Shareholder Report
Mar. 31, 2025
USD ($)
Holding
Fund Expenses
(Based on a hypothetical $10,000 investment)
| Fund (Class) | Costs of a $10,000 investment | Costs paid as a percentage of a $10,000 investment |
| FPA New Income Fund (Institutional Class/FPNIX) |
$23 | 0.45%1 |
|
1 |
Annualized. |
Key Fund Statistics
The following table outlines key fund statistics that you should pay attention to.
| Fund net assets | $8,888,294,054 |
| Total number of portfolio holdings | 336 |
| Portfolio turnover rate as of the end of the reporting period | 22% |
Graphical Representation of Holdings
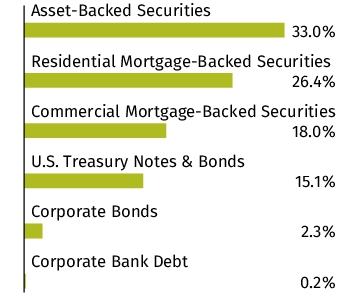
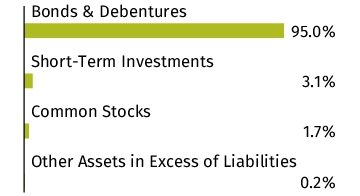
The tables below show the investment makeup of the Fund, representing percentage of the total net assets of the Fund. The Top Ten Holdings and Sector Allocation exclude short-term holdings, if any. The Top Ten Holdings table may not reflect the total exposure to an issuer. Interest rates presented in the Top Ten Holdings are as of the reporting period end. The Sector Allocation chart represents Bonds & Debentures of the Fund.
Top Ten Holdings
| U.S. Treasury Note, 4.375%, 12/31/2029 | 7.6% |
| U.S. Treasury Note, 4.125%, 11/30/2029 | 2.1% |
| U.S. Treasury Note, 4.250%, 1/31/2030 | 1.4% |
| Fortress Credit Opportunities Ltd., Series 2017-9A, Class A1TR, 6.114%, 10/15/2033 | 1.3% |
| Fannie Mae Pool, 1.000%, 3/1/2037 | 1.3% |
| U.S. Treasury Note, 4.125%, 10/31/2029 | 1.3% |
| U.S. Treasury Note, 3.500%, 9/30/2029 | 1.3% |
| U.S. Treasury Note, 4.625%, 9/30/2030 | 1.2% |
| PHI Group, Inc. | 1.0% |
| Verizon Master Trust, Series 2024-2, Class A, 4.830%, 12/22/2031 | 1.0% |
Asset Allocation

Sector Allocation
Top Ten Holdings
| U.S. Treasury Note, 4.375%, 12/31/2029 | 7.6% |
| U.S. Treasury Note, 4.125%, 11/30/2029 | 2.1% |
| U.S. Treasury Note, 4.250%, 1/31/2030 | 1.4% |
| Fortress Credit Opportunities Ltd., Series 2017-9A, Class A1TR, 6.114%, 10/15/2033 | 1.3% |
| Fannie Mae Pool, 1.000%, 3/1/2037 | 1.3% |
| U.S. Treasury Note, 4.125%, 10/31/2029 | 1.3% |
| U.S. Treasury Note, 3.500%, 9/30/2029 | 1.3% |
| U.S. Treasury Note, 4.625%, 9/30/2030 | 1.2% |
| PHI Group, Inc. | 1.0% |
| Verizon Master Trust, Series 2024-2, Class A, 4.830%, 12/22/2031 | 1.0% |
Changes in and Disagreements with Accountants
There were no changes in or disagreements with the Fund's accountants during the reporting period.
Fund Expenses
(Based on a hypothetical $10,000 investment)
| Fund (Class) | Costs of a $10,000 investment | Costs paid as a percentage of a $10,000 investment |
| FPA New Income Fund (Investor Class/FPNRX) |
$28 | 0.55%1 |
|
1 |
Annualized. |
Key Fund Statistics
The following table outlines key fund statistics that you should pay attention to.
| Fund net assets | $8,888,294,054 |
| Total number of portfolio holdings | 336 |
| Portfolio turnover rate as of the end of the reporting period | 22% |
Graphical Representation of Holdings
The tables below show the investment makeup of the Fund, representing percentage of the total net assets of the Fund. The Top Ten Holdings and Sector Allocation exclude short-term holdings, if any. The Top Ten Holdings table may not reflect the total exposure to an issuer. Interest rates presented in the Top Ten Holdings are as of the reporting period end. The Sector Allocation chart represents Bonds & Debentures of the Fund.
Top Ten Holdings
| U.S. Treasury Note, 4.375%, 12/31/2029 | 7.6% |
| U.S. Treasury Note, 4.125%, 11/30/2029 | 2.1% |
| U.S. Treasury Note, 4.250%, 1/31/2030 | 1.4% |
| Fortress Credit Opportunities Ltd., Series 2017-9A, Class A1TR, 6.114%, 10/15/2033 | 1.3% |
| Fannie Mae Pool, 1.000%, 3/1/2037 | 1.3% |
| U.S. Treasury Note, 4.125%, 10/31/2029 | 1.3% |
| U.S. Treasury Note, 3.500%, 9/30/2029 | 1.3% |
| U.S. Treasury Note, 4.625%, 9/30/2030 | 1.2% |
| PHI Group, Inc. | 1.0% |
| Verizon Master Trust, Series 2024-2, Class A, 4.830%, 12/22/2031 | 1.0% |
Asset Allocation
Sector Allocation

Top Ten Holdings
| U.S. Treasury Note, 4.375%, 12/31/2029 | 7.6% |
| U.S. Treasury Note, 4.125%, 11/30/2029 | 2.1% |
| U.S. Treasury Note, 4.250%, 1/31/2030 | 1.4% |
| Fortress Credit Opportunities Ltd., Series 2017-9A, Class A1TR, 6.114%, 10/15/2033 | 1.3% |
| Fannie Mae Pool, 1.000%, 3/1/2037 | 1.3% |
| U.S. Treasury Note, 4.125%, 10/31/2029 | 1.3% |
| U.S. Treasury Note, 3.500%, 9/30/2029 | 1.3% |
| U.S. Treasury Note, 4.625%, 9/30/2030 | 1.2% |
| PHI Group, Inc. | 1.0% |
| Verizon Master Trust, Series 2024-2, Class A, 4.830%, 12/22/2031 | 1.0% |
Changes in and Disagreements with Accountants
There were no changes in or disagreements with the Fund's accountants during the reporting period.
| [1] | Annualized. |
| [2] | Annualized. |