Shareholder Report
|
6 Months Ended |
|
Mar. 31, 2025
USD ($)
Holding
|
|---|
| Shareholder Report [Line Items] |
|
| Document Type |
N-CSRS
|
| Amendment Flag |
false
|
| Registrant Name |
Northern Lights Fund Trust
|
| Entity Central Index Key |
0001314414
|
| Entity Investment Company Type |
N-1A
|
| Document Period End Date |
Mar. 31, 2025
|
| C000115425 |
|
| Shareholder Report [Line Items] |
|
| Fund Name |
Ocean Park Tactical All Asset Fund
|
| Class Name |
Class A1 Shares
|
| Trading Symbol |
SIRZX
|
| Shareholder Report Annual or Semi-Annual |
Semi-Annual Shareholder Report
|
| Additional Information Phone Number |
1-866-738-4363
|
| Additional Information Website |
https://www.oceanparkmutualfunds.com/tactical-all-asset-fund/
|
| Expenses [Text Block] |
What were the Fund’s costs for the last six months?(based on a hypothetical $10,000 investment) Class Name | Costs of a $10,000 investment | Costs paid as a percentage of a $10,000 investment |
|---|
Class A1 Shares | $93 | 1.90%Footnote Reference* |
|---|
|
| Expenses Paid, Amount |
$ 93
|
| Expense Ratio, Percent |
1.90%
|
| AssetsNet |
$ 478,085,801
|
| Holdings Count | Holding |
66
|
| Advisory Fees Paid, Amount |
$ 3,644,431
|
| InvestmentCompanyPortfolioTurnover |
75.00%
|
| Additional Fund Statistics [Text Block] |
- Net Assets$478,085,801
- Number of Portfolio Holdings66
- Advisory Fee $3,644,431
- Portfolio Turnover75%
|
| Holdings [Text Block] |
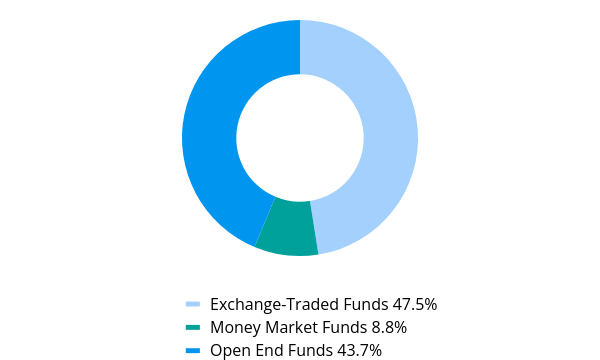
Asset Weighting (% of total investments)Value | Value |
|---|
Exchange-Traded Funds | 47.5% | Money Market Funds | 8.8% | Open End Funds | 43.7% |
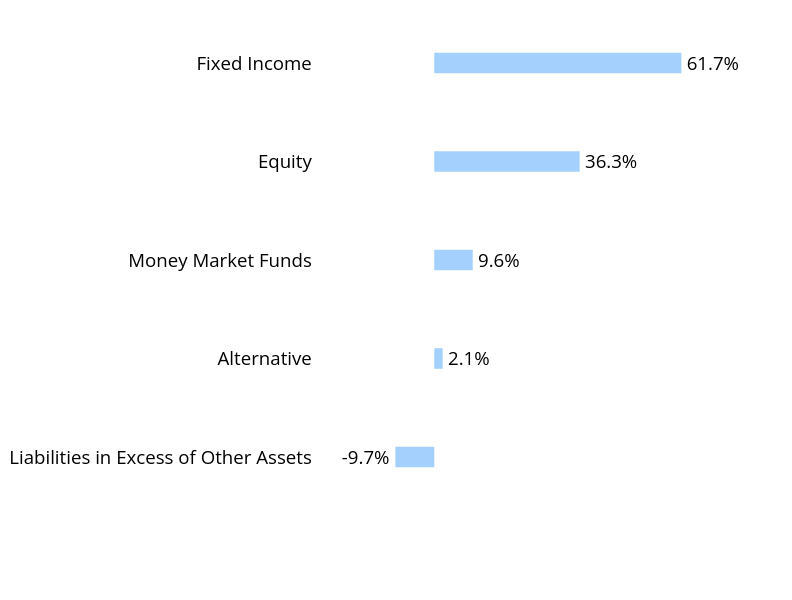
Sector Weighting (% of net assets)Value | Value |
|---|
Liabilities in Excess of Other Assets | -9.7% | Alternative | 2.1% | Money Market Funds | 9.6% | Equity | 36.3% | Fixed Income | 61.7% |
Top 10 Holdings (% of net assets)Holding Name | % of Net Assets |
|---|
PIMCO Income Fund, Institutional Class | 14.5% |
|---|
First American Government Obligations Fund, Class X | 9.6% |
|---|
Schwab S&P 500 Index Fund | 7.7% |
|---|
SPDR Blackstone Senior Loan ETF | 7.6% |
|---|
SPDR Portfolio High Yield Bond ETF | 6.4% |
|---|
PIMCO International Bond Fund U.S. Dollar-Hedged, Institutional Class | 6.3% |
|---|
Invesco Senior Loan ETF | 5.0% |
|---|
Causeway International Value Fund, Class I | 3.9% |
|---|
Vanguard S&P 500 ETF | 3.7% |
|---|
SPDR Bloomberg High Yield Bond ETF | 3.3% |
|---|
|
| Material Fund Change [Text Block] |
No material changes occurred during the period ended March 31, 2025. |
| C000056130 |
|
| Shareholder Report [Line Items] |
|
| Fund Name |
Ocean Park Tactical All Asset Fund
|
| Class Name |
Class A Shares
|
| Trading Symbol |
SIRAX
|
| Shareholder Report Annual or Semi-Annual |
Semi-Annual Shareholder Report
|
| Additional Information Phone Number |
1-866-738-4363
|
| Additional Information Website |
https://www.oceanparkmutualfunds.com/tactical-all-asset-fund/
|
| Expenses [Text Block] |
What were the Fund’s costs for the last six months?(based on a hypothetical $10,000 investment) Class Name | Costs of a $10,000 investment | Costs paid as a percentage of a $10,000 investment |
|---|
Class A Shares | $86 | 1.75%Footnote Reference* |
|---|
|
| Expenses Paid, Amount |
$ 86
|
| Expense Ratio, Percent |
1.75%
|
| AssetsNet |
$ 478,085,801
|
| Holdings Count | Holding |
66
|
| Advisory Fees Paid, Amount |
$ 3,644,431
|
| InvestmentCompanyPortfolioTurnover |
75.00%
|
| Additional Fund Statistics [Text Block] |
- Net Assets$478,085,801
- Number of Portfolio Holdings66
- Advisory Fee $3,644,431
- Portfolio Turnover75%
|
| Holdings [Text Block] |
Asset Weighting (% of total investments)Value | Value |
|---|
Exchange-Traded Funds | 47.5% | Money Market Funds | 8.8% | Open End Funds | 43.7% |
Sector Weighting (% of net assets)Value | Value |
|---|
Liabilities in Excess of Other Assets | -9.7% | Alternative | 2.1% | Money Market Funds | 9.6% | Equity | 36.3% | Fixed Income | 61.7% |
Top 10 Holdings (% of net assets)Holding Name | % of Net Assets |
|---|
PIMCO Income Fund, Institutional Class | 14.5% |
|---|
First American Government Obligations Fund, Class X | 9.6% |
|---|
Schwab S&P 500 Index Fund | 7.7% |
|---|
SPDR Blackstone Senior Loan ETF | 7.6% |
|---|
SPDR Portfolio High Yield Bond ETF | 6.4% |
|---|
PIMCO International Bond Fund U.S. Dollar-Hedged, Institutional Class | 6.3% |
|---|
Invesco Senior Loan ETF | 5.0% |
|---|
Causeway International Value Fund, Class I | 3.9% |
|---|
Vanguard S&P 500 ETF | 3.7% |
|---|
SPDR Bloomberg High Yield Bond ETF | 3.3% |
|---|
|
| Material Fund Change [Text Block] |
No material changes occurred during the period ended March 31, 2025. |
| C000084926 |
|
| Shareholder Report [Line Items] |
|
| Fund Name |
Ocean Park Tactical All Asset Fund
|
| Class Name |
Class C Shares
|
| Trading Symbol |
SIRCX
|
| Shareholder Report Annual or Semi-Annual |
Semi-Annual Shareholder Report
|
| Additional Information Phone Number |
1-866-738-4363
|
| Additional Information Website |
https://www.oceanparkmutualfunds.com/tactical-all-asset-fund/
|
| Expenses [Text Block] |
What were the Fund’s costs for the last six months?(based on a hypothetical $10,000 investment) Class Name | Costs of a $10,000 investment | Costs paid as a percentage of a $10,000 investment |
|---|
Class C Shares | $122 | 2.50%Footnote Reference* |
|---|
|
| Expenses Paid, Amount |
$ 122
|
| Expense Ratio, Percent |
2.50%
|
| AssetsNet |
$ 478,085,801
|
| Holdings Count | Holding |
66
|
| Advisory Fees Paid, Amount |
$ 3,644,431
|
| InvestmentCompanyPortfolioTurnover |
75.00%
|
| Additional Fund Statistics [Text Block] |
- Net Assets$478,085,801
- Number of Portfolio Holdings66
- Advisory Fee $3,644,431
- Portfolio Turnover75%
|
| Holdings [Text Block] |
Asset Weighting (% of total investments)Value | Value |
|---|
Exchange-Traded Funds | 47.5% | Money Market Funds | 8.8% | Open End Funds | 43.7% |
Sector Weighting (% of net assets)Value | Value |
|---|
Liabilities in Excess of Other Assets | -9.7% | Alternative | 2.1% | Money Market Funds | 9.6% | Equity | 36.3% | Fixed Income | 61.7% |
Top 10 Holdings (% of net assets)Holding Name | % of Net Assets |
|---|
PIMCO Income Fund, Institutional Class | 14.5% |
|---|
First American Government Obligations Fund, Class X | 9.6% |
|---|
Schwab S&P 500 Index Fund | 7.7% |
|---|
SPDR Blackstone Senior Loan ETF | 7.6% |
|---|
SPDR Portfolio High Yield Bond ETF | 6.4% |
|---|
PIMCO International Bond Fund U.S. Dollar-Hedged, Institutional Class | 6.3% |
|---|
Invesco Senior Loan ETF | 5.0% |
|---|
Causeway International Value Fund, Class I | 3.9% |
|---|
Vanguard S&P 500 ETF | 3.7% |
|---|
SPDR Bloomberg High Yield Bond ETF | 3.3% |
|---|
|
| Material Fund Change [Text Block] |
No material changes occurred during the period ended March 31, 2025. |
| C000056131 |
|
| Shareholder Report [Line Items] |
|
| Fund Name |
Ocean Park Tactical All Asset Fund
|
| Class Name |
Investor Shares
|
| Trading Symbol |
SIRIX
|
| Shareholder Report Annual or Semi-Annual |
Semi-Annual Shareholder Report
|
| Additional Information Phone Number |
1-866-738-4363
|
| Additional Information Website |
https://www.oceanparkmutualfunds.com/tactical-all-asset-fund/
|
| Expenses [Text Block] |
What were the Fund’s costs for the last six months?(based on a hypothetical $10,000 investment) Class Name | Costs of a $10,000 investment | Costs paid as a percentage of a $10,000 investment |
|---|
Investor Class | $86 | 1.75%Footnote Reference* |
|---|
|
| Expenses Paid, Amount |
$ 86
|
| Expense Ratio, Percent |
1.75%
|
| AssetsNet |
$ 478,085,801
|
| Holdings Count | Holding |
66
|
| Advisory Fees Paid, Amount |
$ 3,644,431
|
| InvestmentCompanyPortfolioTurnover |
75.00%
|
| Additional Fund Statistics [Text Block] |
- Net Assets$478,085,801
- Number of Portfolio Holdings66
- Advisory Fee $3,644,431
- Portfolio Turnover75%
|
| Holdings [Text Block] |
Asset Weighting (% of total investments)Value | Value |
|---|
Exchange-Traded Funds | 47.5% | Money Market Funds | 8.8% | Open End Funds | 43.7% |
Sector Weighting (% of net assets)Value | Value |
|---|
Liabilities in Excess of Other Assets | -9.7% | Alternative | 2.1% | Money Market Funds | 9.6% | Equity | 36.3% | Fixed Income | 61.7% |
Top 10 Holdings (% of net assets)Holding Name | % of Net Assets |
|---|
PIMCO Income Fund, Institutional Class | 14.5% |
|---|
First American Government Obligations Fund, Class X | 9.6% |
|---|
Schwab S&P 500 Index Fund | 7.7% |
|---|
SPDR Blackstone Senior Loan ETF | 7.6% |
|---|
SPDR Portfolio High Yield Bond ETF | 6.4% |
|---|
PIMCO International Bond Fund U.S. Dollar-Hedged, Institutional Class | 6.3% |
|---|
Invesco Senior Loan ETF | 5.0% |
|---|
Causeway International Value Fund, Class I | 3.9% |
|---|
Vanguard S&P 500 ETF | 3.7% |
|---|
SPDR Bloomberg High Yield Bond ETF | 3.3% |
|---|
|
| Material Fund Change [Text Block] |
No material changes occurred during the period ended March 31, 2025. |
| C000056132 |
|
| Shareholder Report [Line Items] |
|
| Fund Name |
Ocean Park Tactical All Asset Fund
|
| Class Name |
Instl Class
|
| Trading Symbol |
SIRRX
|
| Shareholder Report Annual or Semi-Annual |
Semi-Annual Shareholder Report
|
| Additional Information Phone Number |
1-866-738-4363
|
| Additional Information Website |
https://www.oceanparkmutualfunds.com/tactical-all-asset-fund/
|
| Expenses [Text Block] |
What were the Fund’s costs for the last six months?(based on a hypothetical $10,000 investment) Class Name | Costs of a $10,000 investment | Costs paid as a percentage of a $10,000 investment |
|---|
Instl Class | $74 | 1.50%Footnote Reference* |
|---|
|
| Expenses Paid, Amount |
$ 74
|
| Expense Ratio, Percent |
1.50%
|
| AssetsNet |
$ 478,085,801
|
| Holdings Count | Holding |
66
|
| Advisory Fees Paid, Amount |
$ 3,644,431
|
| InvestmentCompanyPortfolioTurnover |
75.00%
|
| Additional Fund Statistics [Text Block] |
- Net Assets$478,085,801
- Number of Portfolio Holdings66
- Advisory Fee $3,644,431
- Portfolio Turnover75%
|
| Holdings [Text Block] |
Asset Weighting (% of total investments)Value | Value |
|---|
Exchange-Traded Funds | 47.5% | Money Market Funds | 8.8% | Open End Funds | 43.7% |
Sector Weighting (% of net assets)Value | Value |
|---|
Liabilities in Excess of Other Assets | -9.7% | Alternative | 2.1% | Money Market Funds | 9.6% | Equity | 36.3% | Fixed Income | 61.7% |
Top 10 Holdings (% of net assets)Holding Name | % of Net Assets |
|---|
PIMCO Income Fund, Institutional Class | 14.5% |
|---|
First American Government Obligations Fund, Class X | 9.6% |
|---|
Schwab S&P 500 Index Fund | 7.7% |
|---|
SPDR Blackstone Senior Loan ETF | 7.6% |
|---|
SPDR Portfolio High Yield Bond ETF | 6.4% |
|---|
PIMCO International Bond Fund U.S. Dollar-Hedged, Institutional Class | 6.3% |
|---|
Invesco Senior Loan ETF | 5.0% |
|---|
Causeway International Value Fund, Class I | 3.9% |
|---|
Vanguard S&P 500 ETF | 3.7% |
|---|
SPDR Bloomberg High Yield Bond ETF | 3.3% |
|---|
|
| Material Fund Change [Text Block] |
No material changes occurred during the period ended March 31, 2025. |
| C000115426 |
|
| Shareholder Report [Line Items] |
|
| Fund Name |
Ocean Park Tactical All Asset Fund
|
| Class Name |
Class I1 Shares
|
| Trading Symbol |
SIRJX
|
| Shareholder Report Annual or Semi-Annual |
Semi-Annual Shareholder Report
|
| Additional Information Phone Number |
1-866-738-4363
|
| Additional Information Website |
https://www.oceanparkmutualfunds.com/tactical-all-asset-fund/
|
| Expenses [Text Block] |
What were the Fund’s costs for the last six months?(based on a hypothetical $10,000 investment) Class Name | Costs of a $10,000 investment | Costs paid as a percentage of a $10,000 investment |
|---|
Class I1 Shares | $93 | 1.90%Footnote Reference* |
|---|
|
| Expenses Paid, Amount |
$ 93
|
| Expense Ratio, Percent |
1.90%
|
| AssetsNet |
$ 478,085,801
|
| Holdings Count | Holding |
66
|
| Advisory Fees Paid, Amount |
$ 3,644,431
|
| InvestmentCompanyPortfolioTurnover |
75.00%
|
| Additional Fund Statistics [Text Block] |
- Net Assets$478,085,801
- Number of Portfolio Holdings66
- Advisory Fee $3,644,431
- Portfolio Turnover75%
|
| Holdings [Text Block] |
Asset Weighting (% of total investments)Value | Value |
|---|
Exchange-Traded Funds | 47.5% | Money Market Funds | 8.8% | Open End Funds | 43.7% |
Sector Weighting (% of net assets)Value | Value |
|---|
Liabilities in Excess of Other Assets | -9.7% | Alternative | 2.1% | Money Market Funds | 9.6% | Equity | 36.3% | Fixed Income | 61.7% |
Top 10 Holdings (% of net assets)Holding Name | % of Net Assets |
|---|
PIMCO Income Fund, Institutional Class | 14.5% |
|---|
First American Government Obligations Fund, Class X | 9.6% |
|---|
Schwab S&P 500 Index Fund | 7.7% |
|---|
SPDR Blackstone Senior Loan ETF | 7.6% |
|---|
SPDR Portfolio High Yield Bond ETF | 6.4% |
|---|
PIMCO International Bond Fund U.S. Dollar-Hedged, Institutional Class | 6.3% |
|---|
Invesco Senior Loan ETF | 5.0% |
|---|
Causeway International Value Fund, Class I | 3.9% |
|---|
Vanguard S&P 500 ETF | 3.7% |
|---|
SPDR Bloomberg High Yield Bond ETF | 3.3% |
|---|
|
| Material Fund Change [Text Block] |
No material changes occurred during the period ended March 31, 2025. |
| C000214244 |
|
| Shareholder Report [Line Items] |
|
| Fund Name |
Ocean Park Tactical Bond Fund
|
| Class Name |
Class A Shares
|
| Trading Symbol |
STBKX
|
| Shareholder Report Annual or Semi-Annual |
Semi-Annual Shareholder Report
|
| Additional Information Phone Number |
1-866-738-4363
|
| Additional Information Website |
https://www.oceanparkmutualfunds.com/tactical-bond-fund/
|
| Expenses [Text Block] |
What were the Fund’s costs for the last six months?(based on a hypothetical $10,000 investment) Class Name | Costs of a $10,000 investment | Costs paid as a percentage of a $10,000 investment |
|---|
Class A Shares | $75 | 1.50%Footnote Reference* |
|---|
|
| Expenses Paid, Amount |
$ 75
|
| Expense Ratio, Percent |
1.50%
|
| AssetsNet |
$ 2,107,307,103
|
| Holdings Count | Holding |
34
|
| Advisory Fees Paid, Amount |
$ 10,423,873
|
| InvestmentCompanyPortfolioTurnover |
0.00%
|
| Additional Fund Statistics [Text Block] |
- Net Assets$2,107,307,103
- Number of Portfolio Holdings34
- Advisory Fee $10,423,873
- Portfolio Turnover0%
|
| Holdings [Text Block] |
Asset Weighting (% of total investments)Value | Value |
|---|
Exchange-Traded Funds | 56.1% | Money Market Funds | 9.0% | Open End Funds | 34.9% |
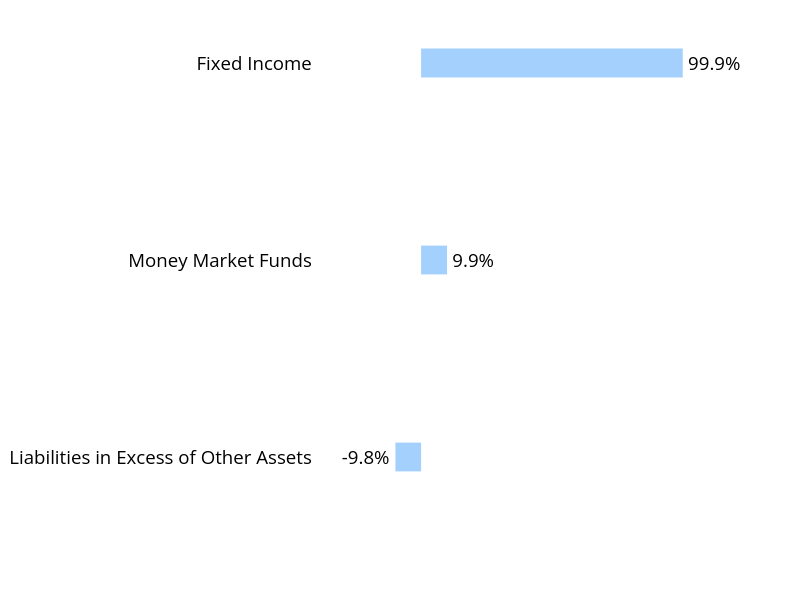
Sector Weighting (% of net assets)Value | Value |
|---|
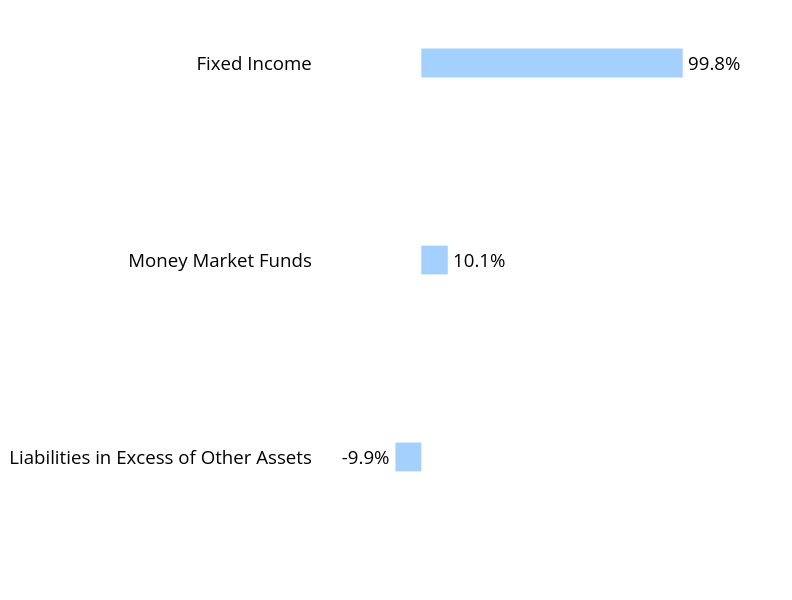
Liabilities in Excess of Other Assets | -9.8% | Money Market Funds | 9.9% | Fixed Income | 99.9% |
Top 10 Holdings (% of net assets)Holding Name | % of Net Assets |
|---|
Blackrock Series Fund V-BlackRock High Yield, Institutional Class | 24.4% |
|---|
iShares Broad USD High Yield Corporate Bond ETF | 15.2% |
|---|
SPDR Bloomberg High Yield Bond ETF | 11.7% |
|---|
First American Government Obligations Fund, Class X | 9.9% |
|---|
iShares iBoxx High Yield Corporate Bond ETF | 8.8% |
|---|
SPDR Portfolio High Yield Bond ETF | 7.9% |
|---|
SPDR Bloomberg Short Term High Yield Bond ETF | 6.3% |
|---|
Osterweis Strategic Income Fund, Class I | 6.3% |
|---|
Xtrackers USD High Yield Corporate Bond ETF | 4.2% |
|---|
City National Rochdale Fixed Income Opportunities, Class N | 3.4% |
|---|
|
| Material Fund Change [Text Block] |
No material changes occurred during the period ended March 31, 2025. |
| C000214245 |
|
| Shareholder Report [Line Items] |
|
| Fund Name |
Ocean Park Tactical Bond Fund
|
| Class Name |
Class C Shares
|
| Trading Symbol |
STBDX
|
| Shareholder Report Annual or Semi-Annual |
Semi-Annual Shareholder Report
|
| Additional Information Phone Number |
1-866-738-4363
|
| Additional Information Website |
https://www.oceanparkmutualfunds.com/tactical-bond-fund/
|
| Expenses [Text Block] |
What were the Fund’s costs for the last six months?(based on a hypothetical $10,000 investment) Class Name | Costs of a $10,000 investment | Costs paid as a percentage of a $10,000 investment |
|---|
Class C Shares | $112 | 2.25%Footnote Reference* |
|---|
|
| Expenses Paid, Amount |
$ 112
|
| Expense Ratio, Percent |
2.25%
|
| AssetsNet |
$ 2,107,307,103
|
| Holdings Count | Holding |
34
|
| Advisory Fees Paid, Amount |
$ 10,423,873
|
| InvestmentCompanyPortfolioTurnover |
0.00%
|
| Additional Fund Statistics [Text Block] |
- Net Assets$2,107,307,103
- Number of Portfolio Holdings34
- Advisory Fee $10,423,873
- Portfolio Turnover0%
|
| Holdings [Text Block] |
Asset Weighting (% of total investments)Value | Value |
|---|
Exchange-Traded Funds | 56.1% | Money Market Funds | 9.0% | Open End Funds | 34.9% |
Sector Weighting (% of net assets)Value | Value |
|---|
Liabilities in Excess of Other Assets | -9.8% | Money Market Funds | 9.9% | Fixed Income | 99.9% |
Top 10 Holdings (% of net assets)Holding Name | % of Net Assets |
|---|
Blackrock Series Fund V-BlackRock High Yield, Institutional Class | 24.4% |
|---|
iShares Broad USD High Yield Corporate Bond ETF | 15.2% |
|---|
SPDR Bloomberg High Yield Bond ETF | 11.7% |
|---|
First American Government Obligations Fund, Class X | 9.9% |
|---|
iShares iBoxx High Yield Corporate Bond ETF | 8.8% |
|---|
SPDR Portfolio High Yield Bond ETF | 7.9% |
|---|
SPDR Bloomberg Short Term High Yield Bond ETF | 6.3% |
|---|
Osterweis Strategic Income Fund, Class I | 6.3% |
|---|
Xtrackers USD High Yield Corporate Bond ETF | 4.2% |
|---|
City National Rochdale Fixed Income Opportunities, Class N | 3.4% |
|---|
|
| Material Fund Change [Text Block] |
No material changes occurred during the period ended March 31, 2025. |
| C000214243 |
|
| Shareholder Report [Line Items] |
|
| Fund Name |
Ocean Park Tactical Bond Fund
|
| Class Name |
Instl Class
|
| Trading Symbol |
STBJX
|
| Shareholder Report Annual or Semi-Annual |
Semi-Annual Shareholder Report
|
| Additional Information Phone Number |
1-866-738-4363
|
| Additional Information Website |
https://www.oceanparkmutualfunds.com/tactical-bond-fund/
|
| Expenses [Text Block] |
What were the Fund’s costs for the last six months?(based on a hypothetical $10,000 investment) Class Name | Costs of a $10,000 investment | Costs paid as a percentage of a $10,000 investment |
|---|
Instl Class | $63 | 1.25%Footnote Reference* |
|---|
|
| Expenses Paid, Amount |
$ 63
|
| Expense Ratio, Percent |
1.25%
|
| AssetsNet |
$ 2,107,307,103
|
| Holdings Count | Holding |
34
|
| Advisory Fees Paid, Amount |
$ 10,423,873
|
| InvestmentCompanyPortfolioTurnover |
0.00%
|
| Additional Fund Statistics [Text Block] |
- Net Assets$2,107,307,103
- Number of Portfolio Holdings34
- Advisory Fee $10,423,873
- Portfolio Turnover0%
|
| Holdings [Text Block] |
Asset Weighting (% of total investments)Value | Value |
|---|
Exchange-Traded Funds | 56.1% | Money Market Funds | 9.0% | Open End Funds | 34.9% |
Sector Weighting (% of net assets)Value | Value |
|---|
Liabilities in Excess of Other Assets | -9.8% | Money Market Funds | 9.9% | Fixed Income | 99.9% |
Top 10 Holdings (% of net assets)Holding Name | % of Net Assets |
|---|
Blackrock Series Fund V-BlackRock High Yield, Institutional Class | 24.4% |
|---|
iShares Broad USD High Yield Corporate Bond ETF | 15.2% |
|---|
SPDR Bloomberg High Yield Bond ETF | 11.7% |
|---|
First American Government Obligations Fund, Class X | 9.9% |
|---|
iShares iBoxx High Yield Corporate Bond ETF | 8.8% |
|---|
SPDR Portfolio High Yield Bond ETF | 7.9% |
|---|
SPDR Bloomberg Short Term High Yield Bond ETF | 6.3% |
|---|
Osterweis Strategic Income Fund, Class I | 6.3% |
|---|
Xtrackers USD High Yield Corporate Bond ETF | 4.2% |
|---|
City National Rochdale Fixed Income Opportunities, Class N | 3.4% |
|---|
|
| Material Fund Change [Text Block] |
No material changes occurred during the period ended March 31, 2025. |
| C000214242 |
|
| Shareholder Report [Line Items] |
|
| Fund Name |
Ocean Park Tactical Bond Fund
|
| Class Name |
Investor Class
|
| Trading Symbol |
STBNX
|
| Shareholder Report Annual or Semi-Annual |
Semi-Annual Shareholder Report
|
| Additional Information Phone Number |
1-866-738-4363
|
| Additional Information Website |
https://www.oceanparkmutualfunds.com/tactical-bond-fund/
|
| Expenses [Text Block] |
What were the Fund’s costs for the last six months?(based on a hypothetical $10,000 investment) Class Name | Costs of a $10,000 investment | Costs paid as a percentage of a $10,000 investment |
|---|
Investor Class | $82 | 1.65%Footnote Reference* |
|---|
|
| Expenses Paid, Amount |
$ 82
|
| Expense Ratio, Percent |
1.65%
|
| AssetsNet |
$ 2,107,307,103
|
| Holdings Count | Holding |
34
|
| Advisory Fees Paid, Amount |
$ 10,423,873
|
| InvestmentCompanyPortfolioTurnover |
0.00%
|
| Additional Fund Statistics [Text Block] |
- Net Assets$2,107,307,103
- Number of Portfolio Holdings34
- Advisory Fee $10,423,873
- Portfolio Turnover0%
|
| Holdings [Text Block] |
Asset Weighting (% of total investments)Value | Value |
|---|
Exchange-Traded Funds | 56.1% | Money Market Funds | 9.0% | Open End Funds | 34.9% |
Sector Weighting (% of net assets)Value | Value |
|---|
Liabilities in Excess of Other Assets | -9.8% | Money Market Funds | 9.9% | Fixed Income | 99.9% |
Top 10 Holdings (% of net assets)Holding Name | % of Net Assets |
|---|
Blackrock Series Fund V-BlackRock High Yield, Institutional Class | 24.4% |
|---|
iShares Broad USD High Yield Corporate Bond ETF | 15.2% |
|---|
SPDR Bloomberg High Yield Bond ETF | 11.7% |
|---|
First American Government Obligations Fund, Class X | 9.9% |
|---|
iShares iBoxx High Yield Corporate Bond ETF | 8.8% |
|---|
SPDR Portfolio High Yield Bond ETF | 7.9% |
|---|
SPDR Bloomberg Short Term High Yield Bond ETF | 6.3% |
|---|
Osterweis Strategic Income Fund, Class I | 6.3% |
|---|
Xtrackers USD High Yield Corporate Bond ETF | 4.2% |
|---|
City National Rochdale Fixed Income Opportunities, Class N | 3.4% |
|---|
|
| Material Fund Change [Text Block] |
No material changes occurred during the period ended March 31, 2025. |
| C000245140 |
|
| Shareholder Report [Line Items] |
|
| Fund Name |
Ocean Park Tactical Core Growth Fund
|
| Class Name |
Instl Class
|
| Trading Symbol |
STEJX
|
| Shareholder Report Annual or Semi-Annual |
Semi-Annual Shareholder Report
|
| Additional Information Phone Number |
1-866-738-4363
|
| Additional Information Website |
https://www.oceanparkmutualfunds.com/tactical-core-growth-fund/
|
| Expenses [Text Block] |
What were the Fund’s costs for the last six months?(based on a hypothetical $10,000 investment) Class Name | Costs of a $10,000 investment | Costs paid as a percentage of a $10,000 investment |
|---|
Instl Class | $49 | 1.00%Footnote Reference* |
|---|
|
| Expenses Paid, Amount |
$ 49
|
| Expense Ratio, Percent |
1.00%
|
| AssetsNet |
$ 9,748,185
|
| Holdings Count | Holding |
30
|
| Advisory Fees Paid, Amount |
$ 0
|
| InvestmentCompanyPortfolioTurnover |
77.00%
|
| Additional Fund Statistics [Text Block] |
- Net Assets$9,748,185
- Number of Portfolio Holdings30
- Advisory Fee (net of waivers)$0
- Portfolio Turnover77%
|
| Holdings [Text Block] |
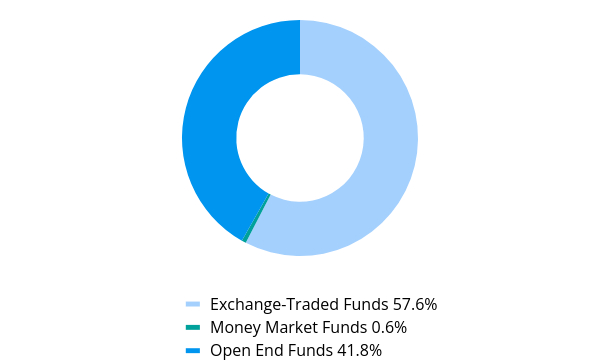
Asset Weighting (% of total investments)Value | Value |
|---|
Exchange-Traded Funds | 57.6% | Money Market Funds | 0.6% | Open End Funds | 41.8% |
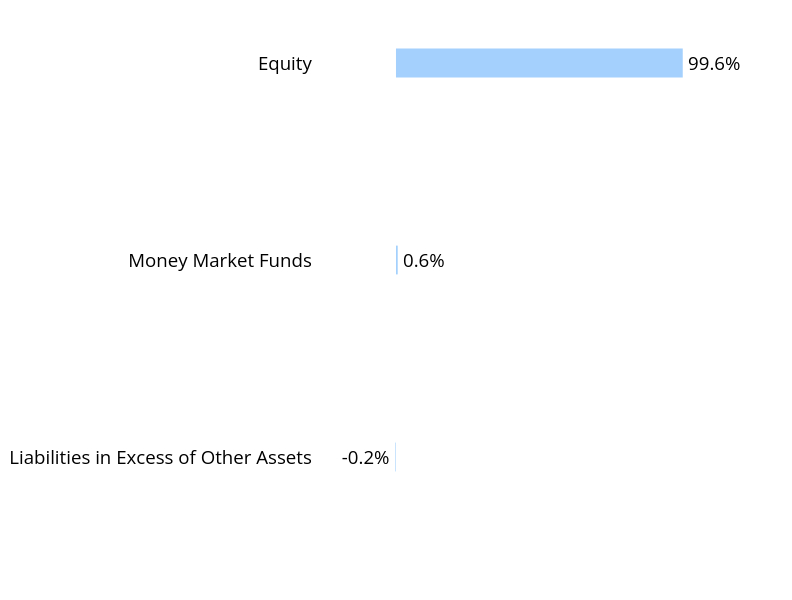
Sector Weighting (% of net assets)Value | Value |
|---|
Liabilities in Excess of Other Assets | -0.2% | Money Market Funds | 0.6% | Equity | 99.6% |
Top 10 Holdings (% of net assets)Holding Name | % of Net Assets |
|---|
Schwab S&P 500 Index Fund | 14.3% |
|---|
iShares MSCI EAFE Value ETF | 8.3% |
|---|
Causeway International Value Fund, Class I | 8.1% |
|---|
iShares MSCI USA Min Vol Factor ETF | 7.5% |
|---|
Vanguard S&P 500 ETF | 6.6% |
|---|
Dodge & Cox International Stock Fund, Class I | 5.1% |
|---|
iShares US Consumer Goods ETF | 5.0% |
|---|
Thornburg Investment Income Builder Fund, Class I | 5.0% |
|---|
iShares MSCI Germany ETF | 4.7% |
|---|
iShares MSCI Hong Kong ETF | 4.7% |
|---|
|
| C000245137 |
|
| Shareholder Report [Line Items] |
|
| Fund Name |
Ocean Park Tactical Core Growth Fund
|
| Class Name |
Investor Class
|
| Trading Symbol |
STENX
|
| Shareholder Report Annual or Semi-Annual |
Semi-Annual Shareholder Report
|
| Additional Information Phone Number |
1-866-738-4363
|
| Additional Information Website |
https://www.oceanparkmutualfunds.com/tactical-core-growth-fund/
|
| Expenses [Text Block] |
What were the Fund’s costs for the last six months?(based on a hypothetical $10,000 investment) Class Name | Costs of a $10,000 investment | Costs paid as a percentage of a $10,000 investment |
|---|
Investor Class | $68 | 1.40%Footnote Reference* |
|---|
|
| Expenses Paid, Amount |
$ 68
|
| Expense Ratio, Percent |
1.40%
|
| AssetsNet |
$ 9,748,185
|
| Holdings Count | Holding |
30
|
| Advisory Fees Paid, Amount |
$ 0
|
| InvestmentCompanyPortfolioTurnover |
77.00%
|
| Additional Fund Statistics [Text Block] |
- Net Assets$9,748,185
- Number of Portfolio Holdings30
- Advisory Fee (net of waivers)$0
- Portfolio Turnover77%
|
| Holdings [Text Block] |
Asset Weighting (% of total investments)Value | Value |
|---|
Exchange-Traded Funds | 57.6% | Money Market Funds | 0.6% | Open End Funds | 41.8% |
Sector Weighting (% of net assets)Value | Value |
|---|
Liabilities in Excess of Other Assets | -0.2% | Money Market Funds | 0.6% | Equity | 99.6% |
Top 10 Holdings (% of net assets)Holding Name | % of Net Assets |
|---|
Schwab S&P 500 Index Fund | 14.3% |
|---|
iShares MSCI EAFE Value ETF | 8.3% |
|---|
Causeway International Value Fund, Class I | 8.1% |
|---|
iShares MSCI USA Min Vol Factor ETF | 7.5% |
|---|
Vanguard S&P 500 ETF | 6.6% |
|---|
Dodge & Cox International Stock Fund, Class I | 5.1% |
|---|
iShares US Consumer Goods ETF | 5.0% |
|---|
Thornburg Investment Income Builder Fund, Class I | 5.0% |
|---|
iShares MSCI Germany ETF | 4.7% |
|---|
iShares MSCI Hong Kong ETF | 4.7% |
|---|
|
| C000108313 |
|
| Shareholder Report [Line Items] |
|
| Fund Name |
Ocean Park Tactical Core Income Fund
|
| Class Name |
Class A Shares
|
| Trading Symbol |
SSIZX
|
| Shareholder Report Annual or Semi-Annual |
Semi-Annual Shareholder Report
|
| Additional Information Phone Number |
1-866-738-4363
|
| Additional Information Website |
https://www.oceanparkmutualfunds.com/tactical-core-income-fund/
|
| Expenses [Text Block] |
What were the Fund’s costs for the last six months?(based on a hypothetical $10,000 investment) Class Name | Costs of a $10,000 investment | Costs paid as a percentage of a $10,000 investment |
|---|
Class A Shares | $67 | 1.35%Footnote Reference* |
|---|
|
| Expenses Paid, Amount |
$ 67
|
| Expense Ratio, Percent |
1.35%
|
| AssetsNet |
$ 1,460,584,847
|
| Holdings Count | Holding |
68
|
| Advisory Fees Paid, Amount |
$ 5,562,836
|
| InvestmentCompanyPortfolioTurnover |
84.00%
|
| Additional Fund Statistics [Text Block] |
- Net Assets$1,460,584,847
- Number of Portfolio Holdings68
- Advisory Fee (net of waivers)$5,562,836
- Portfolio Turnover84%
|
| Holdings [Text Block] |
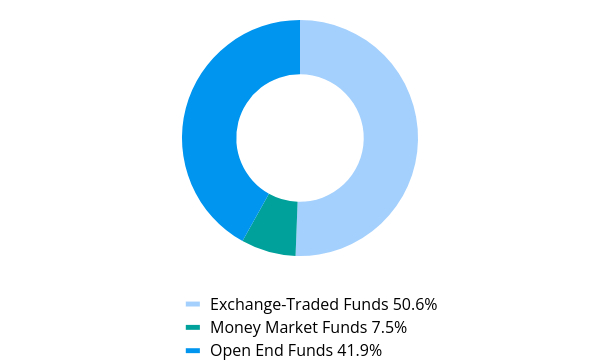
Asset Weighting (% of total investments)Value | Value |
|---|
Exchange-Traded Funds | 50.6% | Money Market Funds | 7.5% | Open End Funds | 41.9% |
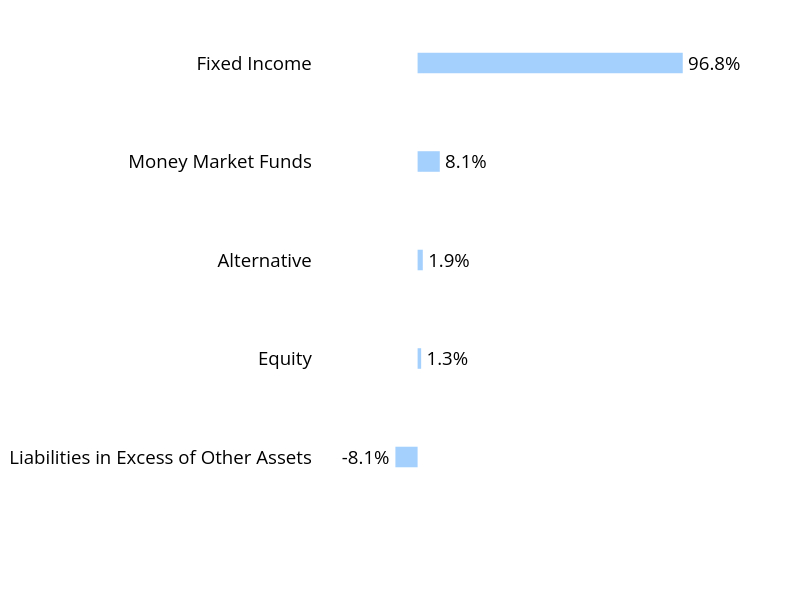
Sector Weighting (% of net assets)Value | Value |
|---|
Liabilities in Excess of Other Assets | -8.1% | Equity | 1.3% | Alternative | 1.9% | Money Market Funds | 8.1% | Fixed
Income | 96.8% |
Top 10 Holdings (% of net assets)Holding Name | % of Net Assets |
|---|
PIMCO Income Fund, Institutional Class | 13.4% |
|---|
SPDR Bloomberg High Yield Bond ETF | 10.6% |
|---|
SPDR Blackstone Senior Loan ETF | 10.1% |
|---|
First American Government Obligations Fund, Class X | 8.1% |
|---|
iShares Broad USD High Yield Corporate Bond ETF | 7.0% |
|---|
Vanguard Long-Term Corporate Bond ETF | 6.0% |
|---|
PIMCO International Bond Fund U.S. Dollar-Hedged, Institutional Class | 5.1% |
|---|
iShares 20+ Year Treasury Bond ETF | 4.5% |
|---|
Invesco Senior Loan ETF | 3.4% |
|---|
PIMCO Long-Term Credit Bond Fund, Institutional Class | 3.1% |
|---|
|
| Material Fund Change [Text Block] |
No material changes occurred during the period ended March 31, 2025. |
| C000108314 |
|
| Shareholder Report [Line Items] |
|
| Fund Name |
Ocean Park Tactical Core Income Fund
|
| Class Name |
Class C Shares
|
| Trading Symbol |
SSICX
|
| Shareholder Report Annual or Semi-Annual |
Semi-Annual Shareholder Report
|
| Additional Information Phone Number |
1-866-738-4363
|
| Additional Information Website |
https://www.oceanparkmutualfunds.com/tactical-core-income-fund/
|
| Expenses [Text Block] |
What were the Fund’s costs for the last six months?(based on a hypothetical $10,000 investment) Class Name | Costs of a $10,000 investment | Costs paid as a percentage of a $10,000 investment |
|---|
Class C Shares | $97 | 1.95%Footnote Reference* |
|---|
|
| Expenses Paid, Amount |
$ 97
|
| Expense Ratio, Percent |
1.95%
|
| AssetsNet |
$ 1,460,584,847
|
| Holdings Count | Holding |
68
|
| Advisory Fees Paid, Amount |
$ 5,562,836
|
| InvestmentCompanyPortfolioTurnover |
84.00%
|
| Additional Fund Statistics [Text Block] |
- Net Assets$1,460,584,847
- Number of Portfolio Holdings68
- Advisory Fee (net of waivers)$5,562,836
- Portfolio Turnover84%
|
| Holdings [Text Block] |
Asset Weighting (% of total investments)Value | Value |
|---|
Exchange-Traded Funds | 50.6% | Money Market Funds | 7.5% | Open End Funds | 41.9% |
Sector Weighting (% of net assets)Value | Value |
|---|
Liabilities in Excess of Other Assets | -8.1% | Equity | 1.3% | Alternative | 1.9% | Money Market Funds | 8.1% | Fixed Income | 96.8% |
Top 10 Holdings (% of net assets)Holding Name | % of Net Assets |
|---|
PIMCO Income Fund, Institutional Class | 13.4% |
|---|
SPDR Bloomberg High Yield Bond ETF | 10.6% |
|---|
SPDR Blackstone Senior Loan ETF | 10.1% |
|---|
First American Government Obligations Fund, Class X | 8.1% |
|---|
iShares Broad USD High Yield Corporate Bond ETF | 7.0% |
|---|
Vanguard Long-Term Corporate Bond ETF | 6.0% |
|---|
PIMCO International Bond Fund U.S. Dollar-Hedged, Institutional Class | 5.1% |
|---|
iShares 20+ Year Treasury Bond ETF | 4.5% |
|---|
Invesco Senior Loan ETF | 3.4% |
|---|
PIMCO Long-Term Credit Bond Fund, Institutional Class | 3.1% |
|---|
|
| Material Fund Change [Text Block] |
No material changes occurred during the period ended March 31, 2025. |
| C000108315 |
|
| Shareholder Report [Line Items] |
|
| Fund Name |
Ocean Park Tactical Core Income Fund
|
| Class Name |
Investor Class
|
| Trading Symbol |
SSIIX
|
| Shareholder Report Annual or Semi-Annual |
Semi-Annual Shareholder Report
|
| Additional Information Phone Number |
1-866-738-4363
|
| Additional Information Website |
https://www.oceanparkmutualfunds.com/tactical-core-income-fund/
|
| Expenses [Text Block] |
What were the Fund’s costs for the last six months?(based on a hypothetical $10,000 investment) Class Name | Costs of a $10,000 investment | Costs paid as a percentage of a $10,000 investment |
|---|
Investor Class | $67 | 1.35%Footnote Reference* |
|---|
|
| Expenses Paid, Amount |
$ 67
|
| Expense Ratio, Percent |
1.35%
|
| AssetsNet |
$ 1,460,584,847
|
| Holdings Count | Holding |
68
|
| Advisory Fees Paid, Amount |
$ 5,562,836
|
| InvestmentCompanyPortfolioTurnover |
84.00%
|
| Additional Fund Statistics [Text Block] |
- Net Assets$1,460,584,847
- Number of Portfolio Holdings68
- Advisory Fee (net of waivers)$5,562,836
- Portfolio Turnover84%
|
| Holdings [Text Block] |
Asset Weighting (% of total investments)Value | Value |
|---|
Exchange-Traded Funds | 50.6% | Money Market Funds | 7.5% | Open End Funds | 41.9% |
Sector Weighting (% of net assets)Value | Value |
|---|
Liabilities in Excess of Other Assets | -8.1% | Equity | 1.3% | Alternative | 1.9% | Money Market Funds | 8.1% | Fixed Income | 96.8% |
Top 10 Holdings (% of net assets)Holding Name | % of Net Assets |
|---|
PIMCO Income Fund, Institutional Class | 13.4% |
|---|
SPDR Bloomberg High Yield Bond ETF | 10.6% |
|---|
SPDR Blackstone Senior Loan ETF | 10.1% |
|---|
First American Government Obligations Fund, Class X | 8.1% |
|---|
iShares Broad USD High Yield Corporate Bond ETF | 7.0% |
|---|
Vanguard Long-Term Corporate Bond ETF | 6.0% |
|---|
PIMCO International Bond Fund U.S. Dollar-Hedged, Institutional Class | 5.1% |
|---|
iShares 20+ Year Treasury Bond ETF | 4.5% |
|---|
Invesco Senior Loan ETF | 3.4% |
|---|
PIMCO Long-Term Credit Bond Fund, Institutional Class | 3.1% |
|---|
|
| Material Fund Change [Text Block] |
No material changes occurred during the period ended March 31, 2025. |
| C000108316 |
|
| Shareholder Report [Line Items] |
|
| Fund Name |
Ocean Park Tactical Core Income Fund
|
| Class Name |
Instl Class
|
| Trading Symbol |
SSIRX
|
| Shareholder Report Annual or Semi-Annual |
Semi-Annual Shareholder Report
|
| Additional Information Phone Number |
1-866-738-4363
|
| Additional Information Website |
https://www.oceanparkmutualfunds.com/tactical-core-income-fund/
|
| Expenses [Text Block] |
What were the Fund’s costs for the last six months?(based on a hypothetical $10,000 investment) Class Name | Costs of a $10,000 investment | Costs paid as a percentage of a $10,000 investment |
|---|
Instl Shares | $48 | 0.96%Footnote Reference* |
|---|
|
| Expenses Paid, Amount |
$ 48
|
| Expense Ratio, Percent |
0.96%
|
| AssetsNet |
$ 1,460,584,847
|
| Holdings Count | Holding |
68
|
| Advisory Fees Paid, Amount |
$ 5,562,836
|
| InvestmentCompanyPortfolioTurnover |
84.00%
|
| Additional Fund Statistics [Text Block] |
- Net Assets$1,460,584,847
- Number of Portfolio Holdings68
- Advisory Fee (net of waivers)$5,562,836
- Portfolio Turnover84%
|
| Holdings [Text Block] |
Asset Weighting (% of total investments)Value | Value |
|---|
Exchange-Traded Funds | 50.6% | Money Market Funds | 7.5% | Open End Funds | 41.9% |
Sector Weighting (% of net assets)Value | Value |
|---|
Liabilities in Excess of Other Assets | -8.1% | Equity | 1.3% | Alternative | 1.9% | Money Market Funds | 8.1% | Fixed Income | 96.8% |
Top 10 Holdings (% of net assets)Holding Name | % of Net Assets |
|---|
PIMCO Income Fund, Institutional Class | 13.4% |
|---|
SPDR Bloomberg High Yield Bond ETF | 10.6% |
|---|
SPDR Blackstone Senior Loan ETF | 10.1% |
|---|
First American Government Obligations Fund, Class X | 8.1% |
|---|
iShares Broad USD High Yield Corporate Bond ETF | 7.0% |
|---|
Vanguard Long-Term Corporate Bond ETF | 6.0% |
|---|
PIMCO International Bond Fund U.S. Dollar-Hedged, Institutional Class | 5.1% |
|---|
iShares 20+ Year Treasury Bond ETF | 4.5% |
|---|
Invesco Senior Loan ETF | 3.4% |
|---|
PIMCO Long-Term Credit Bond Fund, Institutional Class | 3.1% |
|---|
|
| Material Fund Change [Text Block] |
No material changes occurred during the period ended March 31, 2025. |
| C000207097 |
|
| Shareholder Report [Line Items] |
|
| Fund Name |
Ocean Park Tactical Municipal Fund
|
| Class Name |
Class A Shares
|
| Trading Symbol |
STMKX
|
| Shareholder Report Annual or Semi-Annual |
Semi-Annual Shareholder Report
|
| Additional Information Phone Number |
1-866-738-4363
|
| Additional Information Website |
https://www.oceanparkmutualfunds.com/tactical-municipal-fund/
|
| Expenses [Text Block] |
What were the Fund’s costs for the last six months?(based on a hypothetical $10,000 investment) Class Name | Costs of a $10,000 investment | Costs paid as a percentage of a $10,000 investment |
|---|
Class A Shares | $61 | 1.23%Footnote Reference* |
|---|
|
| Expenses Paid, Amount |
$ 61
|
| Expense Ratio, Percent |
1.23%
|
| AssetsNet |
$ 237,573,933
|
| Holdings Count | Holding |
28
|
| Advisory Fees Paid, Amount |
$ 1,026,637
|
| InvestmentCompanyPortfolioTurnover |
80.00%
|
| Additional Fund Statistics [Text Block] |
- Net Assets$237,573,933
- Number of Portfolio Holdings28
- Advisory Fee (net of waivers)$1,026,637
- Portfolio Turnover80%
|
| Holdings [Text Block] |
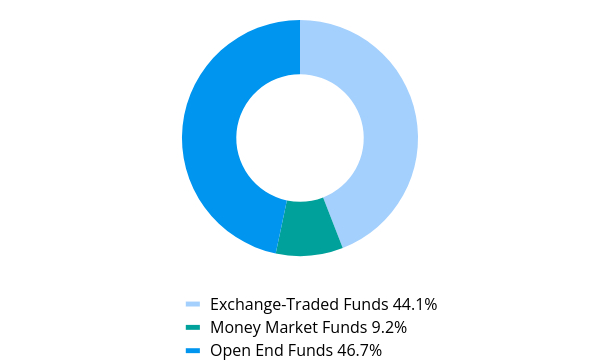
Asset Weighting (% of total investments)Value | Value |
|---|
Exchange-Traded Funds | 44.1% | Money Market Funds | 9.2% | Open End Funds | 46.7% |
Sector Weighting (% of net assets)Value | Value |
|---|
Liabilities in Excess of Other Assets | -9.9% | Money Market Funds | 10.1% | Fixed Income | 99.8% |
Top 10 Holdings (% of net assets)Holding Name | % of Net Assets |
|---|
PIMCO High Yield Municipal Bond Fund, Institutional Class | 26.4% |
|---|
SPDR Nuveen Bloomberg High Yield Municipal Bond | 21.2% |
|---|
VanEck High Yield Muni ETF | 17.5% |
|---|
First Eagle Funds - First Eagle High Income Fund, Class I | 15.5% |
|---|
First American Government Obligations Fund, Class X | 10.1% |
|---|
First Trust Municipal High Income ETF | 4.2% |
|---|
Nuveen Intermediate Duration Municipal Bond Fund, Class I | 3.8% |
|---|
Franklin Dynamic Municipal Bond ETF | 2.7% |
|---|
JPMorgan National Municipal Income Fund, Class I | 2.7% |
|---|
VanEck Short High Yield Muni ETF | 2.4% |
|---|
|
| Material Fund Change [Text Block] |
No material changes occurred during the period ended March 31, 2025. |
| C000214793 |
|
| Shareholder Report [Line Items] |
|
| Fund Name |
Ocean Park Tactical Municipal Fund
|
| Class Name |
Class C Shares
|
| Trading Symbol |
STMHX
|
| Shareholder Report Annual or Semi-Annual |
Semi-Annual Shareholder Report
|
| Additional Information Phone Number |
1-866-738-4363
|
| Additional Information Website |
https://www.oceanparkmutualfunds.com/tactical-municipal-fund/
|
| Expenses [Text Block] |
What were the Fund’s costs for the last six months?(based on a hypothetical $10,000 investment) Class Name | Costs of a $10,000 investment | Costs paid as a percentage of a $10,000 investment |
|---|
Class C Shares | $97 | 1.98%Footnote Reference* |
|---|
|
| Expenses Paid, Amount |
$ 97
|
| Expense Ratio, Percent |
1.98%
|
| AssetsNet |
$ 237,573,933
|
| Holdings Count | Holding |
28
|
| Advisory Fees Paid, Amount |
$ 1,026,637
|
| InvestmentCompanyPortfolioTurnover |
80.00%
|
| Additional Fund Statistics [Text Block] |
- Net Assets$237,573,933
- Number of Portfolio Holdings28
- Advisory Fee (net of waivers)$1,026,637
- Portfolio Turnover80%
|
| Holdings [Text Block] |
Asset Weighting (% of total investments)Value | Value |
|---|
Exchange-Traded Funds | 44.1% | Money Market Funds | 9.2% | Open End Funds | 46.7% |
Sector Weighting (% of net assets)Value | Value |
|---|
Liabilities in Excess of Other Assets | -9.9% | Money Market Funds | 10.1% | Fixed Income | 99.8% |
Top 10 Holdings (% of net assets)Holding Name | % of Net Assets |
|---|
PIMCO High Yield Municipal Bond Fund, Institutional Class | 26.4% |
|---|
SPDR Nuveen Bloomberg High Yield Municipal Bond | 21.2% |
|---|
VanEck High Yield Muni ETF | 17.5% |
|---|
First Eagle Funds - First Eagle High Income Fund, Class I | 15.5% |
|---|
First American Government Obligations Fund, Class X | 10.1% |
|---|
First Trust Municipal High Income ETF | 4.2% |
|---|
Nuveen Intermediate Duration Municipal Bond Fund, Class I | 3.8% |
|---|
Franklin Dynamic Municipal Bond ETF | 2.7% |
|---|
JPMorgan National Municipal Income Fund, Class I | 2.7% |
|---|
VanEck Short High Yield Muni ETF | 2.4% |
|---|
|
| Material Fund Change [Text Block] |
No material changes occurred during the period ended March 31, 2025. |
| C000207099 |
|
| Shareholder Report [Line Items] |
|
| Fund Name |
Ocean Park Tactical Municipal Fund
|
| Class Name |
Investor Class
|
| Trading Symbol |
STMNX
|
| Shareholder Report Annual or Semi-Annual |
Semi-Annual Shareholder Report
|
| Additional Information Phone Number |
1-866-738-4363
|
| Additional Information Website |
https://www.oceanparkmutualfunds.com/tactical-municipal-fund/
|
| Expenses [Text Block] |
What were the Fund’s costs for the last six months?(based on a hypothetical $10,000 investment) Class Name | Costs of a $10,000 investment | Costs paid as a percentage of a $10,000 investment |
|---|
Investor Class | $68 | 1.38%Footnote Reference* |
|---|
|
| Expenses Paid, Amount |
$ 68
|
| Expense Ratio, Percent |
1.38%
|
| AssetsNet |
$ 237,573,933
|
| Holdings Count | Holding |
28
|
| Advisory Fees Paid, Amount |
$ 1,026,637
|
| InvestmentCompanyPortfolioTurnover |
80.00%
|
| Additional Fund Statistics [Text Block] |
- Net Assets$237,573,933
- Number of Portfolio Holdings28
- Advisory Fee (net of waivers)$1,026,637
- Portfolio Turnover80%
|
| Holdings [Text Block] |
Asset Weighting (% of total investments)Value | Value |
|---|
Exchange-Traded Funds | 44.1% | Money Market Funds | 9.2% | Open End Funds | 46.7% |
Sector Weighting (% of net assets)Value | Value |
|---|
Liabilities in Excess of Other Assets | -9.9% | Money Market Funds | 10.1% | Fixed Income | 99.8% |
Top 10 Holdings (% of net assets)Holding Name | % of Net Assets |
|---|
PIMCO High Yield Municipal Bond Fund, Institutional Class | 26.4% |
|---|
SPDR Nuveen Bloomberg High Yield Municipal Bond | 21.2% |
|---|
VanEck High Yield Muni ETF | 17.5% |
|---|
First Eagle Funds - First Eagle High Income Fund, Class I | 15.5% |
|---|
First American Government Obligations Fund, Class X | 10.1% |
|---|
First Trust Municipal High Income ETF | 4.2% |
|---|
Nuveen Intermediate Duration Municipal Bond Fund, Class I | 3.8% |
|---|
Franklin Dynamic Municipal Bond ETF | 2.7% |
|---|
JPMorgan National Municipal Income Fund, Class I | 2.7% |
|---|
VanEck Short High Yield Muni ETF | 2.4% |
|---|
|
| Material Fund Change [Text Block] |
No material changes occurred during the period ended March 31, 2025. |
| C000207098 |
|
| Shareholder Report [Line Items] |
|
| Fund Name |
Ocean Park Tactical Municipal Fund
|
| Class Name |
Instl Class
|
| Trading Symbol |
STMEX
|
| Shareholder Report Annual or Semi-Annual |
Semi-Annual Shareholder Report
|
| Additional Information Phone Number |
1-866-738-4363
|
| Additional Information Website |
https://www.oceanparkmutualfunds.com/tactical-municipal-fund/
|
| Expenses [Text Block] |
What were the Fund’s costs for the last six months?(based on a hypothetical $10,000 investment) Class Name | Costs of a $10,000 investment | Costs paid as a percentage of a $10,000 investment |
|---|
Instl Class | $52 | 1.05%Footnote Reference* |
|---|
|
| Expenses Paid, Amount |
$ 52
|
| Expense Ratio, Percent |
1.05%
|
| AssetsNet |
$ 237,573,933
|
| Holdings Count | Holding |
28
|
| Advisory Fees Paid, Amount |
$ 1,026,637
|
| InvestmentCompanyPortfolioTurnover |
80.00%
|
| Additional Fund Statistics [Text Block] |
- Net Assets$237,573,933
- Number of Portfolio Holdings28
- Advisory Fee (net of waivers)$1,026,637
- Portfolio Turnover80%
|
| Holdings [Text Block] |
Asset Weighting (% of total investments)Value | Value |
|---|
Exchange-Traded Funds | 44.1% | Money Market Funds | 9.2% | Open End Funds | 46.7% |
Sector Weighting (% of net assets)Value | Value |
|---|
Liabilities in Excess of Other Assets | -9.9% | Money Market Funds | 10.1% | Fixed Income | 99.8% |
Top 10 Holdings (% of net assets)Holding Name | % of Net Assets |
|---|
PIMCO High Yield Municipal Bond Fund, Institutional Class | 26.4% |
|---|
SPDR Nuveen Bloomberg High Yield Municipal Bond | 21.2% |
|---|
VanEck High Yield Muni ETF | 17.5% |
|---|
First Eagle Funds - First Eagle High Income Fund, Class I | 15.5% |
|---|
First American Government Obligations Fund, Class X | 10.1% |
|---|
First Trust Municipal High Income ETF | 4.2% |
|---|
Nuveen Intermediate Duration Municipal Bond Fund, Class I | 3.8% |
|---|
Franklin Dynamic Municipal Bond ETF | 2.7% |
|---|
JPMorgan National Municipal Income Fund, Class I | 2.7% |
|---|
VanEck Short High Yield Muni ETF | 2.4% |
|---|
|
| Material Fund Change [Text Block] |
No material changes occurred during the period ended March 31, 2025. |
| C000207096 |
|
| Shareholder Report [Line Items] |
|
| Fund Name |
Ocean Park Tactical Municipal Fund
|
| Class Name |
Special Shares
|
| Trading Symbol |
STMYX
|
| Shareholder Report Annual or Semi-Annual |
Semi-Annual Shareholder Report
|
| Additional Information Phone Number |
1-866-738-4363
|
| Additional Information Website |
https://www.oceanparkmutualfunds.com/tactical-municipal-fund/
|
| Expenses [Text Block] |
What were the Fund’s costs for the last six months?(based on a hypothetical $10,000 investment) Class Name | Costs of a $10,000 investment | Costs paid as a percentage of a $10,000 investment |
|---|
Special Shares | $45 | 0.92%Footnote Reference* |
|---|
|
| Expenses Paid, Amount |
$ 45
|
| Expense Ratio, Percent |
0.92%
|
| AssetsNet |
$ 237,573,933
|
| Holdings Count | Holding |
28
|
| Advisory Fees Paid, Amount |
$ 1,026,637
|
| InvestmentCompanyPortfolioTurnover |
80.00%
|
| Additional Fund Statistics [Text Block] |
- Net Assets$237,573,933
- Number of Portfolio Holdings28
- Advisory Fee (net of waivers)$1,026,637
- Portfolio Turnover80%
|
| Holdings [Text Block] |
Asset Weighting (% of total investments)Value | Value |
|---|
Exchange-Traded Funds | 44.1% | Money Market Funds | 9.2% | Open End Funds | 46.7% |
Sector Weighting (% of net assets)Value | Value |
|---|
Liabilities in Excess of Other Assets | -9.9% | Money Market Funds | 10.1% | Fixed Income | 99.8% |
Top 10 Holdings (% of net assets)Holding Name | % of Net Assets |
|---|
PIMCO High Yield Municipal Bond Fund, Institutional Class | 26.4% |
|---|
SPDR Nuveen Bloomberg High Yield Municipal Bond | 21.2% |
|---|
VanEck High Yield Muni ETF | 17.5% |
|---|
First Eagle Funds - First Eagle High Income Fund, Class I | 15.5% |
|---|
First American Government Obligations Fund, Class X | 10.1% |
|---|
First Trust Municipal High Income ETF | 4.2% |
|---|
Nuveen Intermediate Duration Municipal Bond Fund, Class I | 3.8% |
|---|
Franklin Dynamic Municipal Bond ETF | 2.7% |
|---|
JPMorgan National Municipal Income Fund, Class I | 2.7% |
|---|
VanEck Short High Yield Muni ETF | 2.4% |
|---|
|
| Material Fund Change [Text Block] |
No material changes occurred during the period ended March 31, 2025. |
| C000227417 |
|
| Shareholder Report [Line Items] |
|
| Fund Name |
Ocean Park Tactical Risk Spectrum 30 Fund
|
| Class Name |
Instl Class
|
| Trading Symbol |
SRTJX
|
| Shareholder Report Annual or Semi-Annual |
Semi-Annual Shareholder Report
|
| Additional Information Phone Number |
1-866-738-4363
|
| Additional Information Website |
https://www.oceanparkmutualfunds.com/tactical-risk-spectrum-30-fund/
|
| Expenses [Text Block] |
What were the Fund’s costs for the last six months?What were the Fund’s costs for the last six months? Class Name | Costs of a $10,000 investment | Costs paid as a percentage of a $10,000 investment |
|---|
Instl Class | $65 | 1.31%Footnote Reference* |
|---|
|
| Expenses Paid, Amount |
$ 65
|
| Expense Ratio, Percent |
1.31%
|
| AssetsNet |
$ 181,366,873
|
| Holdings Count | Holding |
72
|
| Advisory Fees Paid, Amount |
$ 286,106
|
| InvestmentCompanyPortfolioTurnover |
49.00%
|
| Additional Fund Statistics [Text Block] |
- Net Assets$181,366,873
- Number of Portfolio Holdings72
- Advisory Fee (net of waivers)$286,106
- Portfolio Turnover49%
|
| Holdings [Text Block] |
Asset Weighting (% of total investments)Value | Value |
|---|
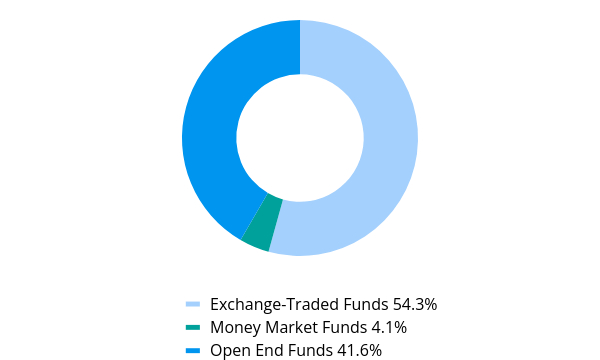
Exchange-Traded Funds | 54.3% | Money Market Funds | 4.1% | Open End Funds | 41.6% |
Sector Weighting (% of net assets)Value | Value |
|---|
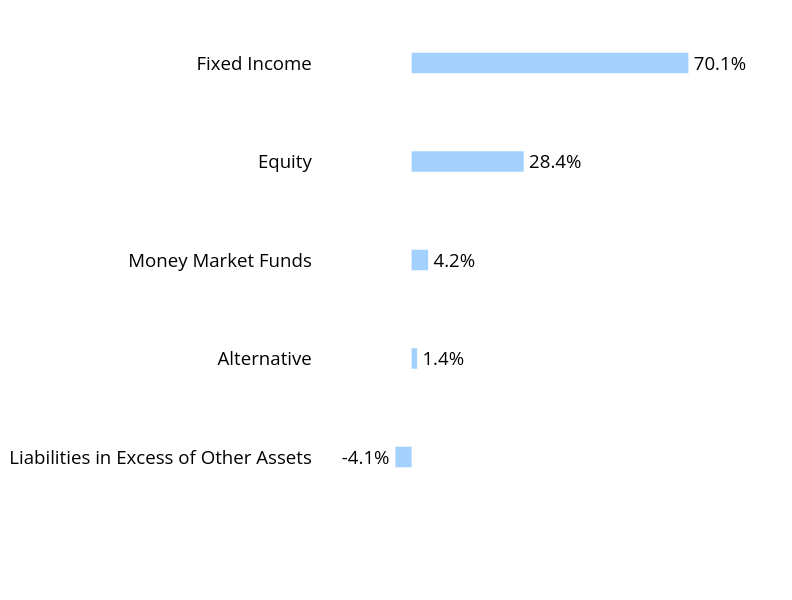
Liabilities in Excess of Other Assets | -4.1% | Alternative | 1.4% | Money Market Funds | 4.2% | Equity | 28.4% | Fixed Income | 70.1% |
Top 10 Holdings (% of net assets)Holding Name | % of Net Assets |
|---|
PIMCO Income Fund, Institutional Class | 11.4% |
|---|
SPDR Portfolio High Yield Bond ETF | 7.6% |
|---|
SPDR Blackstone Senior Loan ETF | 5.4% |
|---|
iShares MSCI EAFE Value ETF | 4.7% |
|---|
BNY Mellon High Yield ETF | 4.6% |
|---|
First American Government Obligations Fund, Class X | 4.2% |
|---|
PIMCO International Bond Fund U.S. Dollar-Hedged, Institutional Class | 4.1% |
|---|
Invesco Senior Loan ETF | 3.7% |
|---|
PIMCO International Bond Fund Unhedged, Institutional Class | 3.0% |
|---|
Medalist Partners MBS Total Return Fund, Institutional Class | 3.0% |
|---|
|
| Material Fund Change [Text Block] |
No material changes occurred during the period ended March 31, 2025. |
| C000227418 |
|
| Shareholder Report [Line Items] |
|
| Fund Name |
Ocean Park Tactical Risk Spectrum 30 Fund
|
| Class Name |
Investor Class
|
| Trading Symbol |
SRTNX
|
| Shareholder Report Annual or Semi-Annual |
Semi-Annual Shareholder Report
|
| Additional Information Phone Number |
1-866-738-4363
|
| Additional Information Website |
https://www.oceanparkmutualfunds.com/tactical-risk-spectrum-30-fund/
|
| Expenses [Text Block] |
What were the Fund’s costs for the last six months?What were the Fund’s costs for the last six months? Class Name | Costs of a $10,000 investment | Costs paid as a percentage of a $10,000 investment |
|---|
Investor Class | $84 | 1.71%Footnote Reference* |
|---|
|
| Expenses Paid, Amount |
$ 84
|
| Expense Ratio, Percent |
1.71%
|
| AssetsNet |
$ 181,366,873
|
| Holdings Count | Holding |
72
|
| Advisory Fees Paid, Amount |
$ 286,106
|
| InvestmentCompanyPortfolioTurnover |
49.00%
|
| Additional Fund Statistics [Text Block] |
- Net Assets$181,366,873
- Number of Portfolio Holdings72
- Advisory Fee (net of waivers)$286,106
- Portfolio Turnover49%
|
| Holdings [Text Block] |
Asset Weighting (% of total investments)Value | Value |
|---|
Exchange-Traded Funds | 54.3% | Money Market Funds | 4.1% | Open End Funds | 41.6% |
Sector Weighting (% of net assets)Value | Value |
|---|
Liabilities in Excess of Other Assets | -4.1% | Alternative | 1.4% | Money Market Funds | 4.2% | Equity | 28.4% | Fixed Income | 70.1% |
Top 10 Holdings (% of net assets)Holding Name | % of Net Assets |
|---|
PIMCO Income Fund, Institutional Class | 11.4% |
|---|
SPDR Portfolio High Yield Bond ETF | 7.6% |
|---|
SPDR Blackstone Senior Loan ETF | 5.4% |
|---|
iShares MSCI EAFE Value ETF | 4.7% |
|---|
BNY Mellon High Yield ETF | 4.6% |
|---|
First American Government Obligations Fund, Class X | 4.2% |
|---|
PIMCO International Bond Fund U.S. Dollar-Hedged, Institutional Class | 4.1% |
|---|
Invesco Senior Loan ETF | 3.7% |
|---|
PIMCO International Bond Fund Unhedged, Institutional Class | 3.0% |
|---|
Medalist Partners MBS Total Return Fund, Institutional Class | 3.0% |
|---|
|
| Material Fund Change [Text Block] |
No material changes occurred during the period ended March 31, 2025. |
| C000227423 |
|
| Shareholder Report [Line Items] |
|
| Fund Name |
Ocean Park Tactical Risk Spectrum 50 Fund
|
| Class Name |
Class A Shares
|
| Trading Symbol |
SRFQX
|
| Shareholder Report Annual or Semi-Annual |
Semi-Annual Shareholder Report
|
| Additional Information Phone Number |
1-866-738-4363
|
| Additional Information Website |
https://www.oceanparkmutualfunds.com/tactical-risk-spectrum-50-fund/
|
| Expenses [Text Block] |
What were the Fund’s costs for the last six months?(based on a hypothetical $10,000 investment) Class Name | Costs of a $10,000 investment | Costs paid as a percentage of a $10,000 investment |
|---|
Class A Shares | $77 | 1.56%Footnote Reference* |
|---|
|
| Expenses Paid, Amount |
$ 77
|
| Expense Ratio, Percent |
1.56%
|
| AssetsNet |
$ 330,259,980
|
| Holdings Count | Holding |
71
|
| Advisory Fees Paid, Amount |
$ 1,821,186
|
| InvestmentCompanyPortfolioTurnover |
64.00%
|
| Additional Fund Statistics [Text Block] |
- Net Assets$330,259,980
- Number of Portfolio Holdings71
- Advisory Fee $1,821,186
- Portfolio Turnover64%
|
| Holdings [Text Block] |
Asset Weighting (% of total investments)Value | Value |
|---|
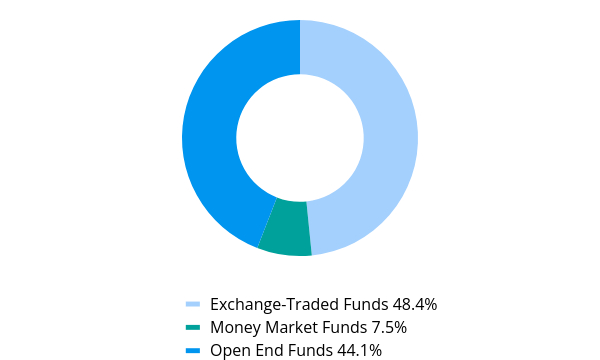
Exchange-Traded Funds | 48.4% | Money Market Funds | 7.5% | Open End Funds | 44.1% |
Sector Weighting (% of net assets)Value | Value |
|---|
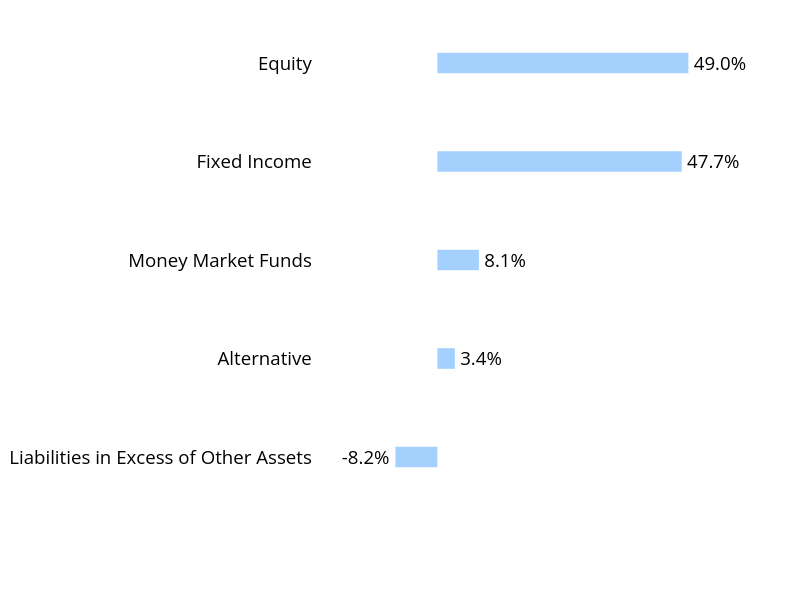
Liabilities in Excess of Other Assets | -8.2% | Alternative | 3.4% | Money Market Funds | 8.1% | Fixed Income | 47.7% | Equity | 49.0% |
Top 10 Holdings (% of net assets)Holding Name | % of Net Assets |
|---|
Schwab S&P 500 Index Fund | 12.6% |
|---|
PIMCO Income Fund, Institutional Class | 8.2% |
|---|
First American Government Obligations Fund, Class X | 8.1% |
|---|
SPDR Blackstone Senior Loan ETF | 7.5% |
|---|
iShares MSCI Eurozone ETF | 5.6% |
|---|
iShares MSCI USA Min Vol Factor ETF | 5.5% |
|---|
Causeway International Value Fund, Class I | 4.7% |
|---|
SPDR Bloomberg High Yield Bond ETF | 4.1% |
|---|
SPDR Portfolio High Yield Bond ETF | 3.9% |
|---|
Invesco Senior Loan ETF | 3.3% |
|---|
|
| Material Fund Change [Text Block] |
No material changes occurred during the period ended March 31, 2025. |
| C000227422 |
|
| Shareholder Report [Line Items] |
|
| Fund Name |
Ocean Park Tactical Risk Spectrum 50 Fund
|
| Class Name |
Class C Shares
|
| Trading Symbol |
SRFKX
|
| Shareholder Report Annual or Semi-Annual |
Semi-Annual Shareholder Report
|
| Additional Information Phone Number |
1-866-738-4363
|
| Additional Information Website |
https://www.oceanparkmutualfunds.com/tactical-risk-spectrum-50-fund/
|
| Expenses [Text Block] |
What were the Fund’s costs for the last six months?(based on a hypothetical $10,000 investment) Class Name | Costs of a $10,000 investment | Costs paid as a percentage of a $10,000 investment |
|---|
Class C Shares | $113 | 2.30%Footnote Reference* |
|---|
|
| Expenses Paid, Amount |
$ 113
|
| Expense Ratio, Percent |
2.30%
|
| AssetsNet |
$ 330,259,980
|
| Holdings Count | Holding |
71
|
| Advisory Fees Paid, Amount |
$ 1,821,186
|
| InvestmentCompanyPortfolioTurnover |
64.00%
|
| Additional Fund Statistics [Text Block] |
- Net Assets$330,259,980
- Number of Portfolio Holdings71
- Advisory Fee $1,821,186
- Portfolio Turnover64%
|
| Holdings [Text Block] |
Asset Weighting (% of total investments)Value | Value |
|---|
Exchange-Traded Funds | 48.4% | Money Market Funds | 7.5% | Open End Funds | 44.1% |
Sector Weighting (% of net assets)Value | Value |
|---|
Liabilities in Excess of Other Assets | -8.2% | Alternative | 3.4% | Money Market Funds | 8.1% | Fixed Income | 47.7% | Equity | 49.0% |
Top 10 Holdings (% of net assets)Holding Name | % of Net Assets |
|---|
Schwab S&P 500 Index Fund | 12.6% |
|---|
PIMCO Income Fund, Institutional Class | 8.2% |
|---|
First American Government Obligations Fund, Class X | 8.1% |
|---|
SPDR Blackstone Senior Loan ETF | 7.5% |
|---|
iShares MSCI Eurozone ETF | 5.6% |
|---|
iShares MSCI USA Min Vol Factor ETF | 5.5% |
|---|
Causeway International Value Fund, Class I | 4.7% |
|---|
SPDR Bloomberg High Yield Bond ETF | 4.1% |
|---|
SPDR Portfolio High Yield Bond ETF | 3.9% |
|---|
Invesco Senior Loan ETF | 3.3% |
|---|
|
| Material Fund Change [Text Block] |
No material changes occurred during the period ended March 31, 2025. |
| C000227421 |
|
| Shareholder Report [Line Items] |
|
| Fund Name |
Ocean Park Tactical Risk Spectrum 50 Fund
|
| Class Name |
Instl Class
|
| Trading Symbol |
SRFJX
|
| Shareholder Report Annual or Semi-Annual |
Semi-Annual Shareholder Report
|
| Additional Information Phone Number |
1-866-738-4363
|
| Additional Information Website |
https://www.oceanparkmutualfunds.com/tactical-risk-spectrum-50-fund/
|
| Expenses [Text Block] |
What were the Fund’s costs for the last six months?(based on a hypothetical $10,000 investment) Class Name | Costs of a $10,000 investment | Costs paid as a percentage of a $10,000 investment |
|---|
Instl Class | $64 | 1.30%Footnote Reference* |
|---|
|
| Expenses Paid, Amount |
$ 64
|
| Expense Ratio, Percent |
1.30%
|
| AssetsNet |
$ 330,259,980
|
| Holdings Count | Holding |
71
|
| Advisory Fees Paid, Amount |
$ 1,821,186
|
| InvestmentCompanyPortfolioTurnover |
64.00%
|
| Additional Fund Statistics [Text Block] |
- Net Assets$330,259,980
- Number of Portfolio Holdings71
- Advisory Fee $1,821,186
- Portfolio Turnover64%
|
| Holdings [Text Block] |
Asset Weighting (% of total investments)Value | Value |
|---|
Exchange-Traded Funds | 48.4% | Money Market Funds | 7.5% | Open End Funds | 44.1% |
Sector Weighting (% of net assets)Value | Value |
|---|
Liabilities in Excess of Other Assets | -8.2% | Alternative | 3.4% | Money Market Funds | 8.1% | Fixed Income | 47.7% | Equity | 49.0% |
Top 10 Holdings (% of net assets)Holding Name | % of Net Assets |
|---|
Schwab S&P 500 Index Fund | 12.6% |
|---|
PIMCO Income Fund, Institutional Class | 8.2% |
|---|
First American Government Obligations Fund, Class X | 8.1% |
|---|
SPDR Blackstone Senior Loan ETF | 7.5% |
|---|
iShares MSCI Eurozone ETF | 5.6% |
|---|
iShares MSCI USA Min Vol Factor ETF | 5.5% |
|---|
Causeway International Value Fund, Class I | 4.7% |
|---|
SPDR Bloomberg High Yield Bond ETF | 4.1% |
|---|
SPDR Portfolio High Yield Bond ETF | 3.9% |
|---|
Invesco Senior Loan ETF | 3.3% |
|---|
|
| Material Fund Change [Text Block] |
No material changes occurred during the period ended March 31, 2025. |
| C000227420 |
|
| Shareholder Report [Line Items] |
|
| Fund Name |
Ocean Park Tactical Risk Spectrum 50 Fund
|
| Class Name |
Investor Class
|
| Trading Symbol |
SRFNX
|
| Shareholder Report Annual or Semi-Annual |
Semi-Annual Shareholder Report
|
| Additional Information Phone Number |
1-866-738-4363
|
| Additional Information Website |
https://www.oceanparkmutualfunds.com/tactical-risk-spectrum-50-fund/
|
| Expenses [Text Block] |
What were the Fund’s costs for the last six months?(based on a hypothetical $10,000 investment) Class Name | Costs of a $10,000 investment | Costs paid as a percentage of a $10,000 investment |
|---|
Investor Class | $84 | 1.71%Footnote Reference* |
|---|
|
| Expenses Paid, Amount |
$ 84
|
| Expense Ratio, Percent |
1.71%
|
| AssetsNet |
$ 330,259,980
|
| Holdings Count | Holding |
71
|
| Advisory Fees Paid, Amount |
$ 1,821,186
|
| InvestmentCompanyPortfolioTurnover |
64.00%
|
| Additional Fund Statistics [Text Block] |
- Net Assets$330,259,980
- Number of Portfolio Holdings71
- Advisory Fee $1,821,186
- Portfolio Turnover64%
|
| Holdings [Text Block] |
Asset Weighting (% of total investments)Value | Value |
|---|
Exchange-Traded Funds | 48.4% | Money Market Funds | 7.5% | Open End Funds | 44.1% |
Sector Weighting (% of net assets)Value | Value |
|---|
Liabilities in Excess of Other Assets | -8.2% | Alternative | 3.4% | Money Market Funds | 8.1% | Fixed Income | 47.7% | Equity | 49.0% |
Top 10 Holdings (% of net assets)Holding Name | % of Net Assets |
|---|
Schwab S&P 500 Index Fund | 12.6% |
|---|
PIMCO Income Fund, Institutional Class | 8.2% |
|---|
First American Government Obligations Fund, Class X | 8.1% |
|---|
SPDR Blackstone Senior Loan ETF | 7.5% |
|---|
iShares MSCI Eurozone ETF | 5.6% |
|---|
iShares MSCI USA Min Vol Factor ETF | 5.5% |
|---|
Causeway International Value Fund, Class I | 4.7% |
|---|
SPDR Bloomberg High Yield Bond ETF | 4.1% |
|---|
SPDR Portfolio High Yield Bond ETF | 3.9% |
|---|
Invesco Senior Loan ETF | 3.3% |
|---|
|
| Material Fund Change [Text Block] |
No material changes occurred during the period ended March 31, 2025. |
| C000227426 |
|
| Shareholder Report [Line Items] |
|
| Fund Name |
Ocean Park Tactical Risk Spectrum 70 Fund
|
| Class Name |
Instl Class
|
| Trading Symbol |
SRSJX
|
| Shareholder Report Annual or Semi-Annual |
Semi-Annual Shareholder Report
|
| Additional Information Phone Number |
1-866-738-4363
|
| Additional Information Website |
https://www.oceanparkmutualfunds.com/tactical-risk-spectrum-70-fund/
|
| Expenses [Text Block] |
What were the Fund’s costs for the last six months?(based on a hypothetical $10,000 investment) Class Name | Costs of a $10,000 investment | Costs paid as a percentage of a $10,000 investment |
|---|
Instl Class | $64 | 1.31%Footnote Reference* |
|---|
|
| Expenses Paid, Amount |
$ 64
|
| Expense Ratio, Percent |
1.31%
|
| AssetsNet |
$ 66,388,673
|
| Holdings Count | Holding |
59
|
| Advisory Fees Paid, Amount |
$ 260,738
|
| InvestmentCompanyPortfolioTurnover |
81.00%
|
| Additional Fund Statistics [Text Block] |
- Net Assets$66,388,673
- Number of Portfolio Holdings59
- Advisory Fee (net of waivers)$260,738
- Portfolio Turnover81%
|
| Holdings [Text Block] |
Asset Weighting (% of total investments)Value | Value |
|---|
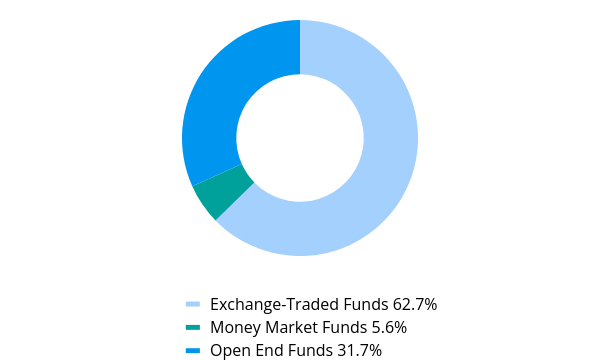
Exchange-Traded Funds | 62.7% | Money Market Funds | 5.6% | Open End Funds | 31.7% |
Sector Weighting (% of net assets)Value | Value |
|---|
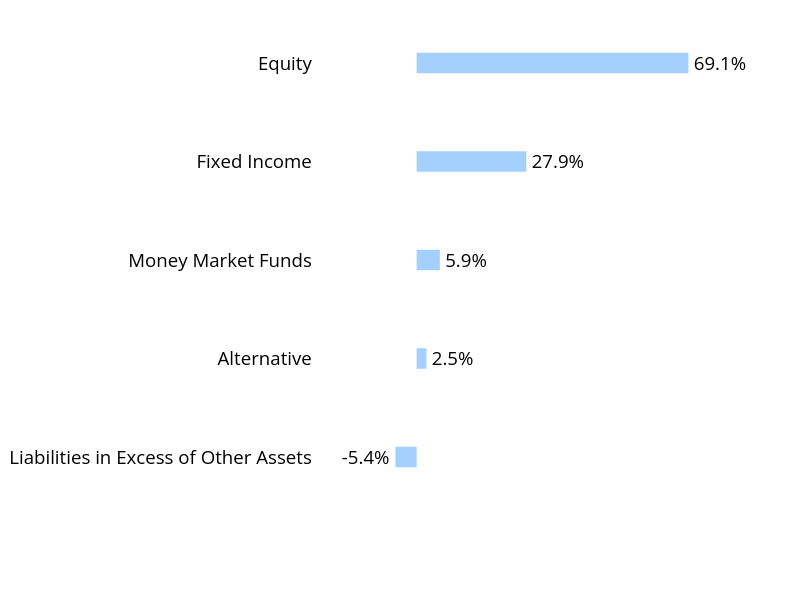
Liabilities in Excess of Other Assets | -5.4% | Alternative | 2.5% | Money Market Funds | 5.9% | Fixed Income | 27.9% | Equity | 69.1% |
Top 10 Holdings (% of net assets)Holding Name | % of Net Assets |
|---|
Schwab S&P 500 Index Fund | 8.6% |
|---|
First American Government Obligations Fund, Class X | 5.9% |
|---|
Invesco Senior Loan ETF | 5.7% |
|---|
Vanguard S&P 500 ETF | 5.6% |
|---|
iShares MSCI EAFE Value ETF | 5.5% |
|---|
Causeway International Value Fund, Class I | 5.4% |
|---|
iShares MSCI USA Min Vol Factor ETF | 4.6% |
|---|
iShares MSCI Hong Kong ETF | 4.0% |
|---|
Thornburg Investment Income Builder Fund, Class I | 3.9% |
|---|
SPDR Portfolio High Yield Bond ETF | 3.4% |
|---|
|
| Material Fund Change [Text Block] |
No material changes occurred during the period ended March 31, 2025. |
| C000227425 |
|
| Shareholder Report [Line Items] |
|
| Fund Name |
Ocean Park Tactical Risk Spectrum 70 Fund
|
| Class Name |
Investor Class
|
| Trading Symbol |
SRSNX
|
| Shareholder Report Annual or Semi-Annual |
Semi-Annual Shareholder Report
|
| Additional Information Phone Number |
1-866-738-4363
|
| Additional Information Website |
https://www.oceanparkmutualfunds.com/tactical-risk-spectrum-70-fund/
|
| Expenses [Text Block] |
What were the Fund’s costs for the last six months?(based on a hypothetical $10,000 investment) Class Name | Costs of a $10,000 investment | Costs paid as a percentage of a $10,000 investment |
|---|
Investor Class | $83 | 1.71%Footnote Reference* |
|---|
|
| Expenses Paid, Amount |
$ 83
|
| Expense Ratio, Percent |
1.71%
|
| AssetsNet |
$ 66,388,673
|
| Holdings Count | Holding |
59
|
| Advisory Fees Paid, Amount |
$ 260,738
|
| InvestmentCompanyPortfolioTurnover |
81.00%
|
| Additional Fund Statistics [Text Block] |
- Net Assets$66,388,673
- Number of Portfolio Holdings59
- Advisory Fee (net of waivers)$260,738
- Portfolio Turnover81%
|
| Holdings [Text Block] |
Asset Weighting (% of total investments)Value | Value |
|---|
Exchange-Traded Funds | 62.7% | Money Market Funds | 5.6% | Open End Funds | 31.7% |
Sector Weighting (% of net assets)Value | Value |
|---|
Liabilities in Excess of Other Assets | -5.4% | Alternative | 2.5% | Money Market Funds | 5.9% | Fixed Income | 27.9% | Equity | 69.1% |
Top 10 Holdings (% of net assets)Holding Name | % of Net Assets |
|---|
Schwab S&P 500 Index Fund | 8.6% |
|---|
First American Government Obligations Fund, Class X | 5.9% |
|---|
Invesco Senior Loan ETF | 5.7% |
|---|
Vanguard S&P 500 ETF | 5.6% |
|---|
iShares MSCI EAFE Value ETF | 5.5% |
|---|
Causeway International Value Fund, Class I | 5.4% |
|---|
iShares MSCI USA Min Vol Factor ETF | 4.6% |
|---|
iShares MSCI Hong Kong ETF | 4.0% |
|---|
Thornburg Investment Income Builder Fund, Class I | 3.9% |
|---|
SPDR Portfolio High Yield Bond ETF | 3.4% |
|---|
|
| Material Fund Change [Text Block] |
No material changes occurred during the period ended March 31, 2025. |