What were the Fund costs for the past year?
(based on a hypothetical $10,000 investment)
Fund Name | Costs of a $10,000 investment | Costs paid as a percentage of a $10,000 investment |
|---|---|---|
Even Herd Long Short ETF | $261 | 2.60% |
How did the Fund perform last year and what affected its performance?
The Fund achieved a positive net return of 1.60% during the reporting period. Despite its long/short strategy, it maintained positive net equity exposure between 45-75% the entire period.
What Factors Influenced Performance
Equity markets experienced significant short-term volatility, which posed challenges for a strategy focused on relative momentum and trend-following. However, the Fund outperformed the benchmark at its largest margin by over 800 basis points off the August lows, demonstrating its ability to capture upside while managing short positions, particularly during the post-election rally.
Despite this outperformance, much was reversed within five days in the second half of February 2025, primarily due to an imbalance in long/short positions and a convergence of momentum factors. This event highlighted areas for improved position clustering, which has been refined through proprietary data to hopefully reduce similar impacts in the future. Additionally, a sharp market rotation from Technology and Communication Services to Utilities and Consumer Defensive sectors during that period in February also influenced performance.
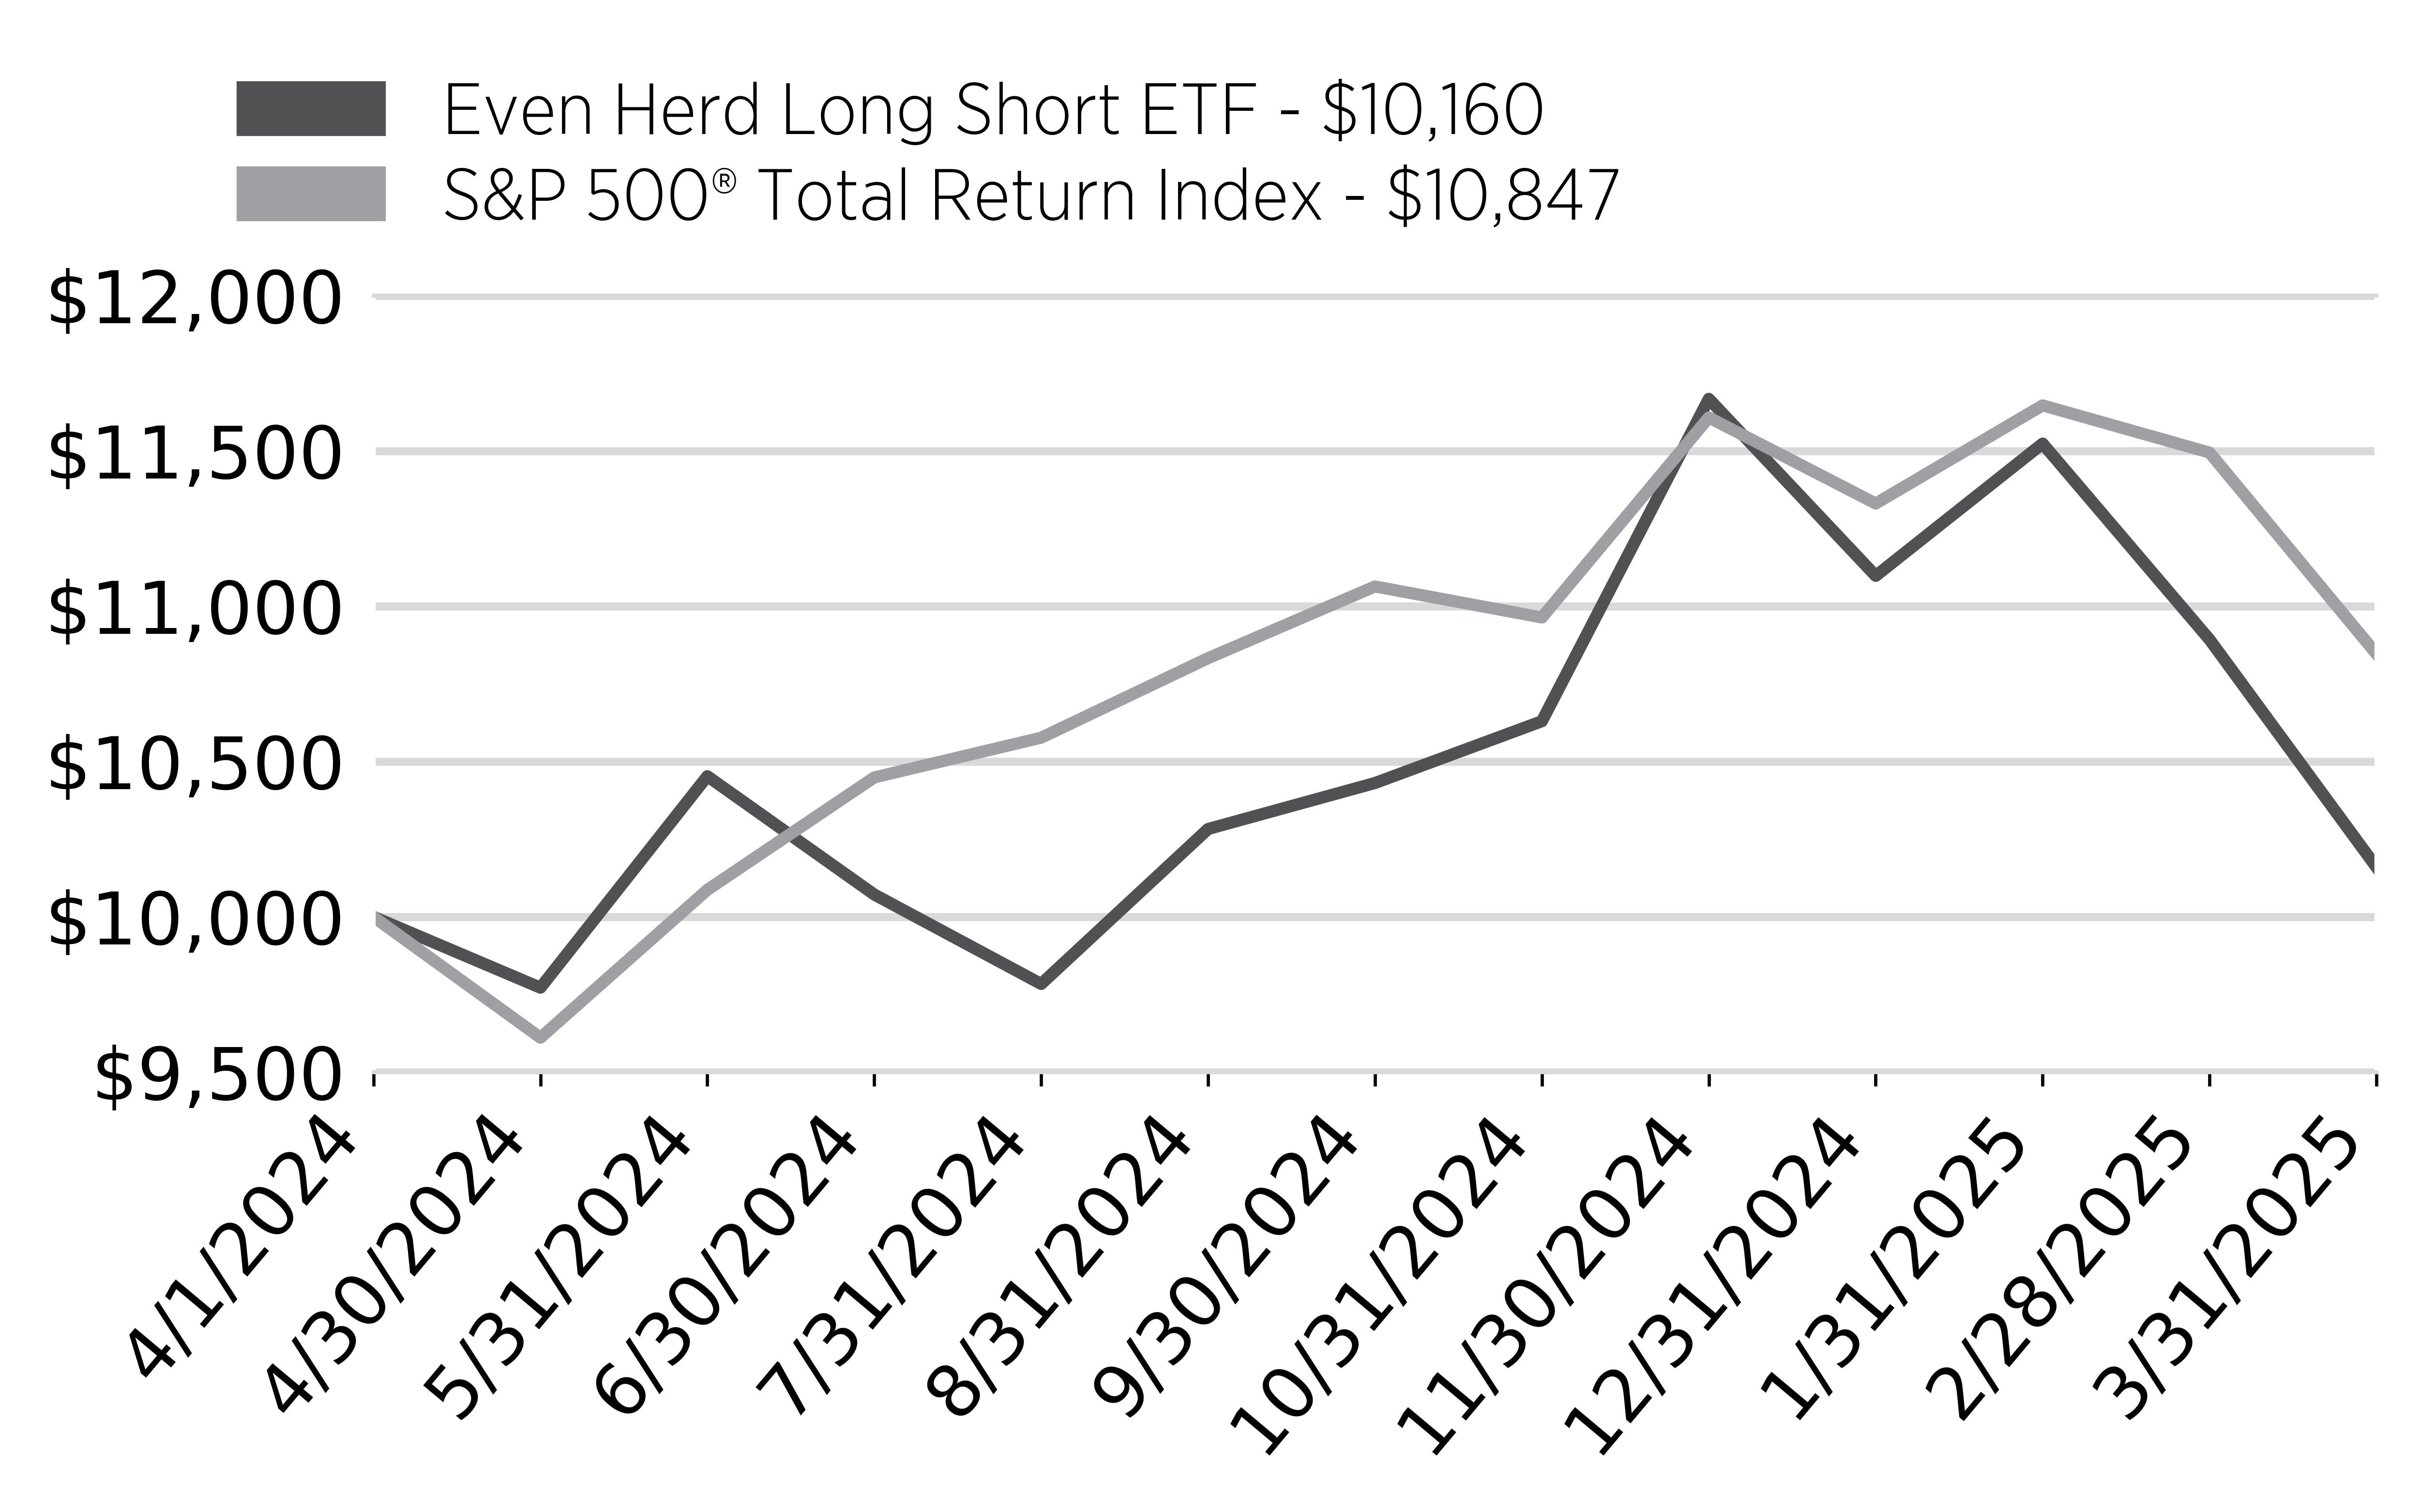
Cumulative Performance
(Initial Investment of $10,000)
Annual Performance
Returns for the Period Ended March 31, 2025 | Since Inception (4/1/2024) |
|---|---|
Even Herd Long Short ETF - at NAV | 1.60% |
S&P 500® Total Return Index | 8.47% |
Key Fund Statistics
(as of March 31, 2025)
Fund Size (Thousands) | $48,687 |
Number of Holdings | 311 |
Total Advisory Fee Paid | $562,651 |
Annual Portfolio Turnover | 423% |
What did the Fund invest in?
(as of March 31, 2025)
Security Type - Investments
(% of total net assets)
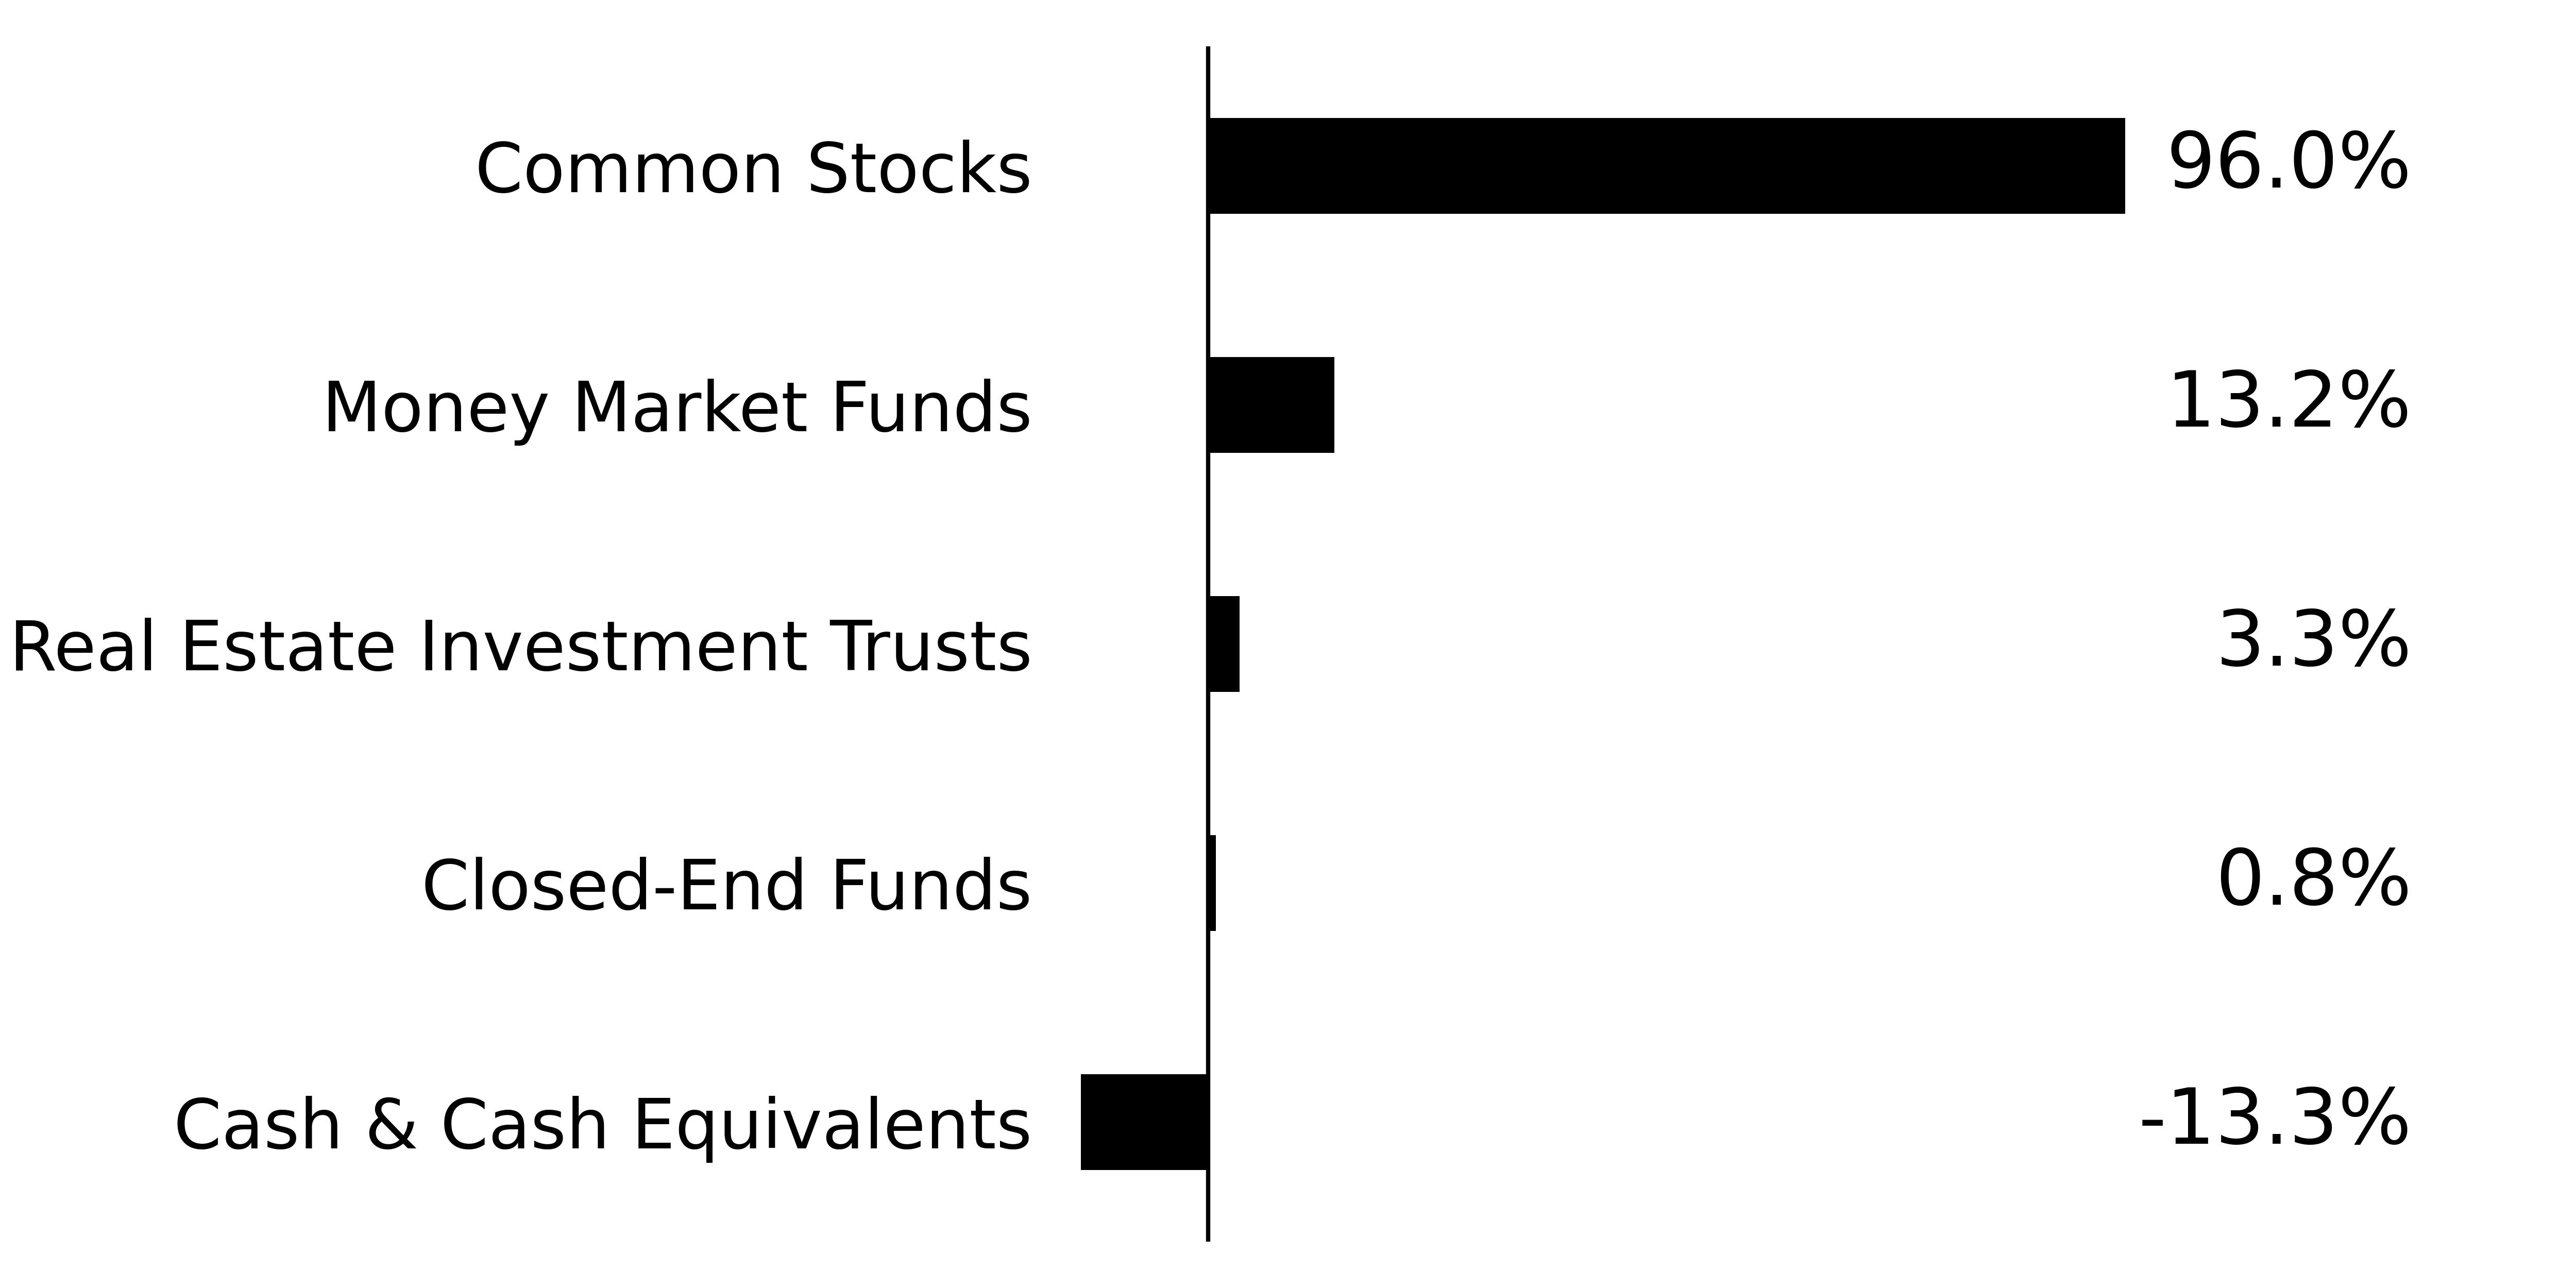
Percentages are based on total net assets. Cash & Cash Equivalents represents cash and liabilities in excess of other assets.
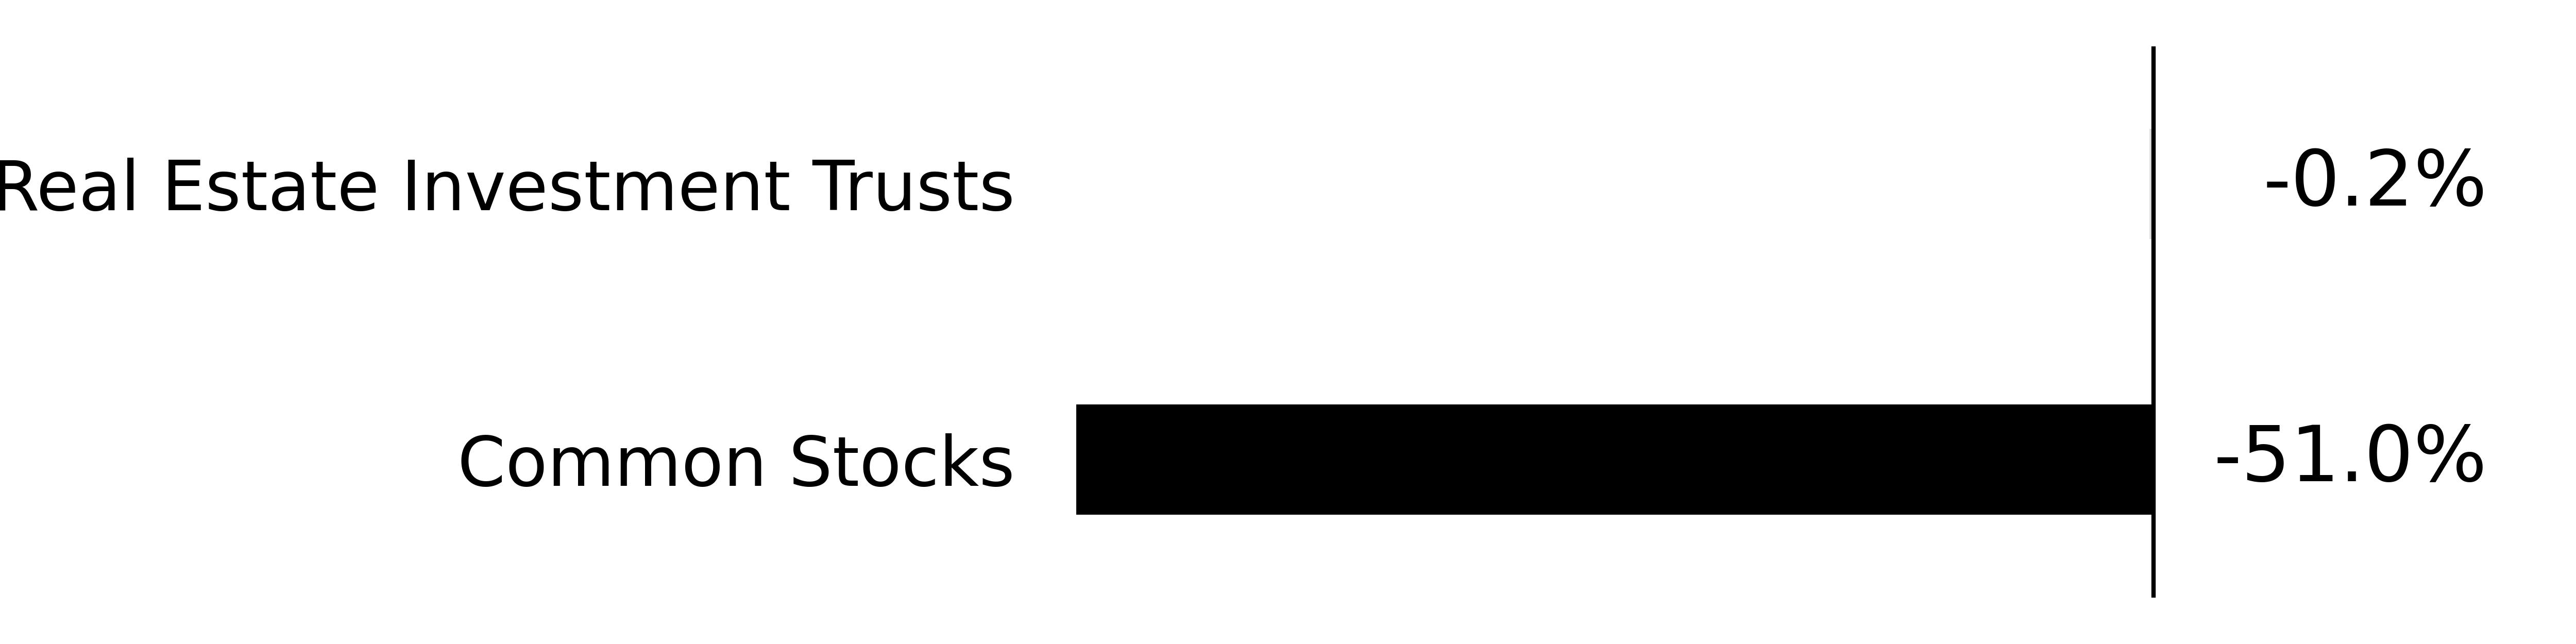
Security Type - Securities Sold Short
(% of total net assets)
Top Ten Holdings | (% of Total Net Assets) |
|---|---|
Alamos Gold, Inc. - Class A | |
Aris Water Solutions, Inc. - Class A | |
Entergy Corp. | |
Howmet Aerospace, Inc. | |
Banco Macro SA | |
Sea Ltd. - Class A | |
Third Coast Bancshares, Inc. | |
Targa Resources Corp. | |
Northeast Bank | |
Robinhood Markets, Inc. - Class A |