Shareholder Report
|
6 Months Ended |
12 Months Ended |
|
Mar. 31, 2025
USD ($)
Holding
|
Mar. 31, 2025
USD ($)
Holding
|
| Shareholder Report [Line Items] |
|
|
| Document Type |
N-CSRS
|
|
| Amendment Flag |
false
|
|
| Registrant Name |
ALPS SERIES TRUST
|
|
| Entity Central Index Key |
0001558107
|
|
| Entity Investment Company Type |
N-1A
|
|
| Document Period End Date |
Mar. 31, 2025
|
|
| C000193426 |
|
|
| Shareholder Report [Line Items] |
|
|
| Fund Name |
Beacon Planned Return Strategy Fund
|
|
| Trading Symbol |
Class I
|
|
| Annual or Semi-Annual Statement [Text Block] |
This semi-annual shareholder report contains important information about Beacon Planned Return Strategy Fund - I Class for the period of October 1, 2024 to March 31, 2025.
|
|
| Shareholder Report Annual or Semi-Annual |
semi-annual shareholder report
|
|
| Additional Information [Text Block] |
You can find additional information about the Fund at https://www.beacontrust.com/services/investment-management/beacon-funds. You can also request this information by contacting us at 1-844-894-9222.
|
|
| Additional Information Phone Number |
1-844-894-9222
|
|
| Additional Information Website |
<span style="box-sizing: border-box; color: rgb(51, 62, 72); display: inline; flex-wrap: nowrap; font-size: 12px; font-weight: 400; grid-area: auto; line-height: 16.8px; margin: 0px; overflow: visible; text-align: left; white-space-collapse: preserve-breaks;">https://www.beacontrust.com/services/investment-management/beacon-funds</span>
|
|
| Expenses [Text Block] |
What were the Fund's Cost for the last six months? (based on a hypothetical $10,000 investment) CLASS NAME | COST OF A $10,000 INVESTMENT | COST PAID AS A PERCENTAGE OF
A $10,000 INVESTMENT |
|---|
Beacon Planned Return Strategy Fund - I | $62 | 1.23% |
|---|
|
|
| Expenses Paid, Amount |
$ 0.0123
|
|
| Expense Ratio, Percent |
6200.00%
|
|
| Factors Affecting Performance [Text Block] |
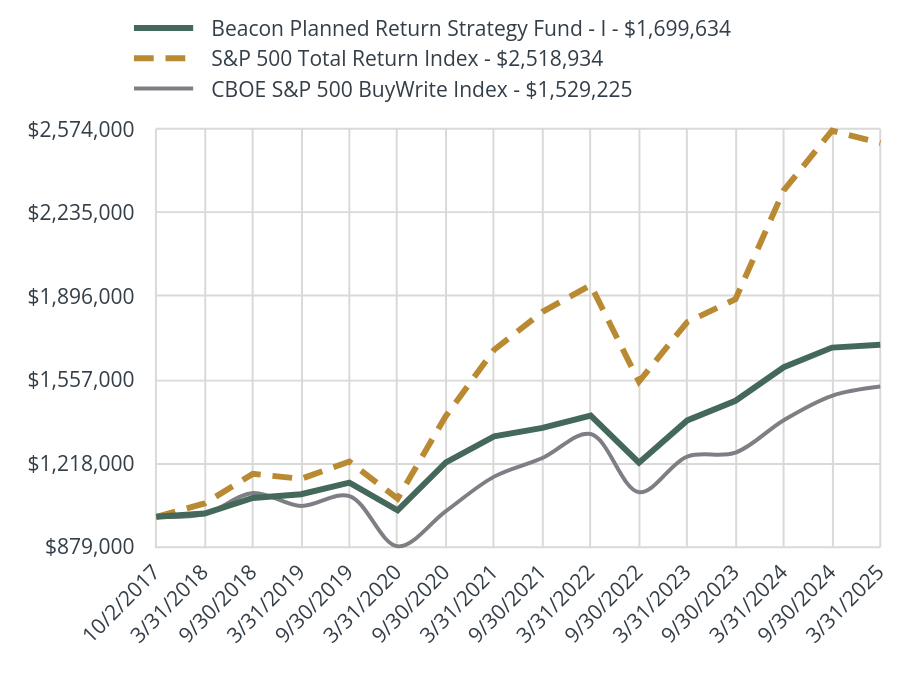
How did the Fund perform last year?The Beacon Planned Return Strategy Fund - I returned 0.70% for the 6 months ended March 31, 2025. This is in contrast to the CBOE S&P 500 BuyWrite Index, which had a 9.80% return for the same time period. The returns sought to be generated by the Fund are derived from three distinct return elements, i.e., returns from Directional/Enhanced market movements, returns from Income (or option premium) and returns from the Hedge that creates constant “downside protection”. Each return driver plays a crucial and sometimes complementary role in the overall performance of the strategy. During the period, the Directional / Enhanced component added value due to the increase in the S&P 500, the Income component detracted from value since selling the out of the money call options lost more than the gains received from selling put options, and the Hedge component detracted from value due to the rise in the S&P 500. |
|
| Line Graph [Table Text Block] |
| Beacon Planned Return Strategy Fund - I - $1,699,634 | S&P 500 Total Return Index - $2,518,934 | CBOE S&P 500 BuyWrite Index - $1,529,225 |
|---|
10/2/2017 | $1,000,000.00 | $1,000,000.00 | $1,000,000.00 |
|---|
3/31/2018 | $1,013,244.09 | $1,054,264.18 | $1,010,887.60 |
|---|
9/30/2018 | $1,076,446.45 | $1,174,549.41 | $1,096,538.69 |
|---|
3/31/2019 | $1,091,691.78 | $1,154,381.98 | $1,044,148.20 |
|---|
9/30/2019 | $1,138,587.63 | $1,224,513.54 | $1,084,395.69 |
|---|
3/31/2020 | $1,026,380.15 | $1,073,830.43 | $879,937.53 |
|---|
9/30/2020 | $1,220,717.43 | $1,410,016.88 | $1,023,023.12 |
|---|
3/31/2021 | $1,327,212.06 | $1,678,951.36 | $1,163,269.12 |
|---|
9/30/2021 | $1,361,462.70 | $1,833,090.82 | $1,238,906.91 |
|---|
3/31/2022 | $1,411,347.42 | $1,941,637.53 | $1,336,334.83 |
|---|
9/30/2022 | $1,219,717.49 | $1,549,472.99 | $1,100,035.87 |
|---|
3/31/2023 | $1,391,764.80 | $1,791,578.02 | $1,244,705.65 |
|---|
9/30/2023 | $1,471,494.04 | $1,884,428.52 | $1,260,913.75 |
|---|
3/31/2024 | $1,607,838.09 | $2,326,924.02 | $1,392,723.17 |
|---|
9/30/2024 | $1,687,785.84 | $2,569,446.82 | $1,491,727.82 |
|---|
3/31/2025 | $1,699,633.77 | $2,518,934.49 | $1,529,225.39 |
|---|
|
|
| Average Annual Return [Table Text Block] |
Average Annual Total Retuns Class I | 6 Month | 1 Year | 5 Year | Since Inception |
|---|
Beacon Planned Return Strategy Fund - Class I | 0.70% | 5.71% | 10.61% | 7.34% |
|---|
S&P 500 Total Return Index | -1.97% | 8.25% | 18.59% | 13.12% |
|---|
CBOE S&P 500 BuyWrite Index | 2.51% | 9.80% | 11.69% | 5.83% |
|---|
|
|
| AssetsNet |
$ 328,267,412
|
$ 328,267,412
|
| Holdings Count | Holding |
82
|
82
|
| InvestmentCompanyPortfolioTurnover |
0.00%
|
|
| Additional Fund Statistics [Text Block] |
- Total Net Assets$328,267,412
- # of Portfolio Holdings82
- Portfolio Turnover Rate (Class I)-%
|
|
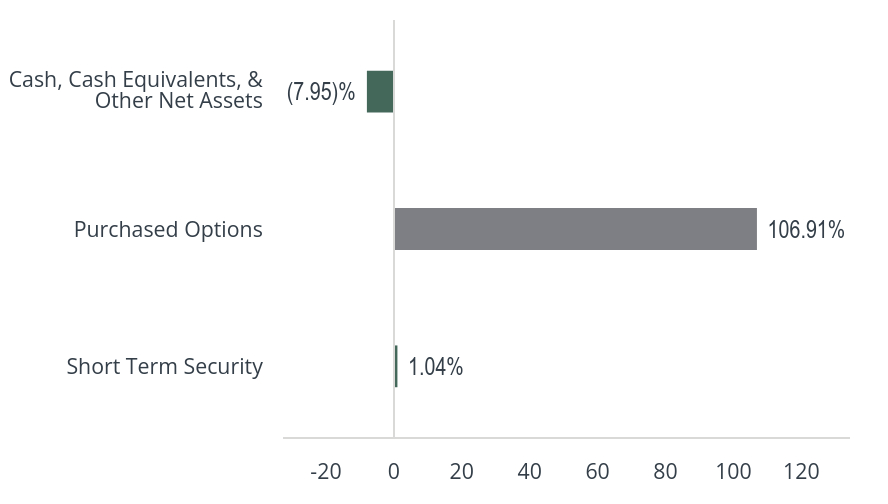
| Holdings [Text Block] |
Value | Value |
|---|
Short Term Security | 1.04% | Purchased Options | 106.91% | Cash, Cash Equivalents, & Other Net Assets | (7.95)% |
|
|
| Largest Holdings [Text Block] |
Top 10 | % |
|---|
Call XSP AUGUST 72.00 08/14/2025 | 9.68% | Call XSP September 73.42 09/12/2025 | 9.50% | Call XSP July 73.55 07/14/2025 | 9.43% | Call XSP October 76.10 10/14/2025 | 9.08% | Call XSP June 70.80 06/13/2025 | 8.51% | Call XSP April 67.30 04/14/2025 | 8.28% | Call XSP May 69.00 05/14/2025 | 8.17% | Call XSP November 78.25 11/14/2025 | 7.35% | Call XSP Febuary 73.53 02/13/2026 | 6.67% | Call XSP Jan 79.78 01/14/2026 | 4.84% | Total % of Top 10 Holdings | 81.51% |
|
|
| Material Fund Change [Text Block] |
There have been no material Fund changes during the reporting period. |
|
| C000241324 |
|
|
| Shareholder Report [Line Items] |
|
|
| Fund Name |
Brigade High Income Fund
|
|
| Class Name |
FOUNDERS
|
|
| No Trading Symbol [Flag] |
true
|
|
| Annual or Semi-Annual Statement [Text Block] |
This semi-annual shareholder report contains important information about Brigade High Income Fund - Founders Class for the period of October 1, 2024 to March 31, 2025.
|
|
| Shareholder Report Annual or Semi-Annual |
semi-annual shareholder report
|
|
| Additional Information [Text Block] |
You can find additional information about the Fund at https://www.brigadefunds.com/resources. You can also request this information by contacting us at 212.745.9700.
|
|
| Additional Information Phone Number |
212.745.9700
|
|
| Additional Information Website |
<span style="box-sizing: border-box; color: rgb(49, 60, 76); display: inline; flex-wrap: nowrap; font-size: 12px; font-weight: 400; grid-area: auto; line-height: 16.8px; margin: 0px; overflow: visible; text-align: left; white-space-collapse: preserve-breaks;">https://www.brigadefunds.com/resources</span>
|
|
| Expenses [Text Block] |
WHAT WERE THE FUND'S COST FOR THE LAST SIX MONTHS? (based on a hypothetical $10,000 investment) CLASS NAME | COST OF A $10,000 INVESTMENT | COST PAID AS A PERCENTAGE OF
A $10,000 INVESTMENT |
|---|
Brigade High Income Fund - Founders | $26 | 0.52% |
|---|
|
|
| Expenses Paid, Amount |
$ 0.0052
|
|
| Expense Ratio, Percent |
2600.00%
|
|
| Average Annual Return [Table Text Block] |
AVERAGE ANNUAL TOTAL RETURNS Founders | 1 Year | Since Inception |
|---|
Brigade High Income Fund - Founders (Incep. May 1, 2023) | 9.17% | 11.78% |
|---|
Bloomberg US Aggregate Bond Index | 4.88% | 3.62% |
|---|
60% ICE BofA US HY Contrained / 40% Credit Suisse Leverage Loan | 7.38% | 9.39% |
|---|
ICE BofA US High Yield Constrained Index | 7.60% | 9.26% |
|---|
|
|
| Performance Inception Date |
|
May 01, 2023
|
| AssetsNet |
$ 663,737,261
|
$ 663,737,261
|
| Holdings Count | Holding |
301
|
301
|
| InvestmentCompanyPortfolioTurnover |
18.00%
|
|
| Additional Fund Statistics [Text Block] |
- Total Net Assets$663,737,261
- # of Portfolio Holdings301
- Portfolio Turnover Rate18%
|
|
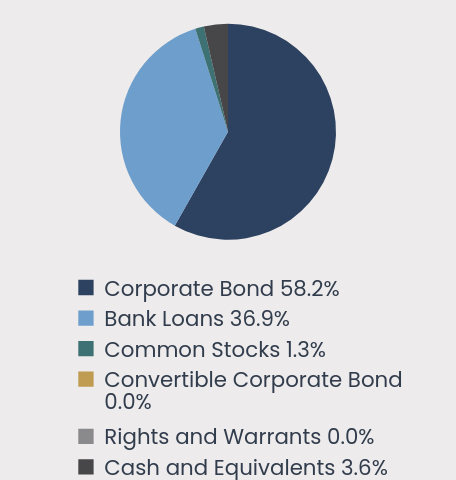
| Holdings [Text Block] |
ASSET CLASS WEIGHTINGS(as a % of Net Assets) Value | Value |
|---|
Corporate Bond | 58.2% | Bank Loans | 36.9% | Common Stocks | 1.3% | Convertible Corporate Bond | 0.0% | Rights and Warrants | 0.0% | Cash and Equivalents | 3.6% |
|
|
| Largest Holdings [Text Block] |
TOP TEN HOLDINGS(as a % of Net Assets) Top 10 | Top 10 |
|---|
Tenet Healthcare Corp. 06/15/2028 4.625% | 1.1% | Team Health Holdings, Inc. 02/02/2027 3M SOFR + 5.25% | 1.0% | TransDigm, Inc. 12/01/2031 7.125% | 1.0% | Radiology Partners, Inc. 01/31/2029 7.775% | 1.0% | Akumin, Inc. 08/01/2027 9.00% | 0.9% | Pluto Acquisition I, Inc. 09/20/2028 3M SOFR + 4.00% | 0.9% | LifeScan Global Corp. 12/31/2026 3M SOFR + 6.50% | 0.9% | Avaya Inc. 08/01/2028 1M SOFR + 7.50% | 0.9% | Domtar Corp. 10/01/2028 6.75% | 0.9% | Diversified Healthcare Trust 03/01/2031 4.375% | 0.8% | Total % of Top 10 Holdings | 9.2% |
|
|
| Material Fund Change [Text Block] |
There have been no material Fund changes during the reporting period. |
|
| C000241325 |
|
|
| Shareholder Report [Line Items] |
|
|
| Fund Name |
Brigade High Income Fund
|
|
| Class Name |
INSTITUTIONAL
|
|
| No Trading Symbol [Flag] |
true
|
|
| Annual or Semi-Annual Statement [Text Block] |
This semi-annual shareholder report contains important information about Brigade High Income Fund - Institutional Class for the period of October 1, 2024 to March 31, 2025.
|
|
| Shareholder Report Annual or Semi-Annual |
semi-annual shareholder report
|
|
| Additional Information [Text Block] |
You can find additional information about the Fund at https://www.brigadefunds.com/resources. You can also request this information by contacting us at 212.745.9700.
|
|
| Additional Information Phone Number |
212.745.9700
|
|
| Additional Information Website |
<span style="box-sizing: border-box; color: rgb(49, 60, 76); display: inline; flex-wrap: nowrap; font-size: 12px; font-weight: 400; grid-area: auto; line-height: 16.8px; margin: 0px; overflow: visible; text-align: left; white-space-collapse: preserve-breaks;">https://www.brigadefunds.com/resources</span>
|
|
| Expenses [Text Block] |
WHAT WERE THE FUND'S COST FOR THE LAST SIX MONTHS? (based on a hypothetical $10,000 investment) CLASS NAME | COST OF A $10,000 INVESTMENT | COST PAID AS A PERCENTAGE OF
A $10,000 INVESTMENT |
|---|
Brigade High Income Fund - Institutional | $31 | 0.61% |
|---|
|
|
| Expenses Paid, Amount |
$ 0.0061
|
|
| Expense Ratio, Percent |
3100.00%
|
|
| Average Annual Return [Table Text Block] |
AVERAGE ANNUAL TOTAL RETURNS Institutional | 1 Year | Since Inception |
|---|
Brigade High Income Fund - Institutional (Incep. May 4, 2023) | 8.94% | 11.73% |
|---|
Bloomberg US Aggregate Bond Index | 4.88% | 2.97% |
|---|
60% ICE BofA US HY Contrained / 40% Credit Suisse Leverage Loan | 7.38% | 9.69% |
|---|
ICE BofA US High Yield Constrained Index | 7.60% | 9.66% |
|---|
|
|
| Performance Inception Date |
|
May 04, 2023
|
| AssetsNet |
$ 663,737,261
|
$ 663,737,261
|
| Holdings Count | Holding |
301
|
301
|
| InvestmentCompanyPortfolioTurnover |
18.00%
|
|
| Additional Fund Statistics [Text Block] |
- Total Net Assets$663,737,261
- # of Portfolio Holdings301
- Portfolio Turnover Rate18%
|
|
| Holdings [Text Block] |
ASSET CLASS WEIGHTINGS(as a % of Net Assets) Value | Value |
|---|
Corporate Bond | 58.2% | Bank Loans | 36.9% | Common Stocks | 1.3% | Convertible Corporate Bond | 0.0% | Rights and Warrants | 0.0% | Cash and Equivalents | 3.6% |
|
|
| Largest Holdings [Text Block] |
TOP TEN HOLDINGS(as a % of Net Assets) Top 10 | Top 10 |
|---|
Tenet Healthcare Corp. 06/15/2028 4.625% | 1.1% | Team Health Holdings, Inc. 02/02/2027 3M SOFR + 5.25% | 1.0% | TransDigm, Inc. 12/01/2031 7.125% | 1.0% | Radiology Partners, Inc. 01/31/2029 7.775% | 1.0% | Akumin, Inc. 08/01/2027 9.00% | 0.9% | Pluto Acquisition I, Inc. 09/20/2028 3M SOFR + 4.00% | 0.9% | LifeScan Global Corp. 12/31/2026 3M SOFR + 6.50% | 0.9% | Avaya Inc. 08/01/2028 1M SOFR + 7.50% | 0.9% | Domtar Corp. 10/01/2028 6.75% | 0.9% | Diversified Healthcare Trust 03/01/2031 4.375% | 0.8% | Total % of Top 10 Holdings | 9.2% |
|
|
| Material Fund Change [Text Block] |
There have been no material Fund changes during the reporting period. |
|
| C000203691 |
|
|
| Shareholder Report [Line Items] |
|
|
| Fund Name |
Carret Kansas Tax-Exempt Bond Fund
|
|
| Trading Symbol |
CLASS A
|
|
| Annual or Semi-Annual Statement [Text Block] |
This semi-annual shareholder report contains important information about Carret Kansas Tax-Exempt Bond Fund - A for the period of October 1, 2024 to March 31, 2025.
|
|
| Shareholder Report Annual or Semi-Annual |
semi-annual shareholder report
|
|
| Additional Information [Text Block] |
You can find additional information about the Fund at https://www.carret.com/carret-kansas-tax-exempt-bond-fund. You can also request this information by contacting us at 888.266.8787.
|
|
| Additional Information Phone Number |
888.266.8787
|
|
| Additional Information Website |
<span style="box-sizing: border-box; color: rgb(0, 0, 0); display: inline; flex-wrap: nowrap; font-size: 12px; font-weight: 400; grid-area: auto; line-height: 16.8px; margin: 0px; overflow: visible; text-align: left; white-space-collapse: preserve-breaks;">https://www.carret.com/carret-kansas-tax-exempt-bond-fund</span>
|
|
| Expenses [Text Block] |
WHAT WERE THE FUND'S COST FOR THE LAST SIX MONTHS?
|
|
| Expenses Paid, Amount |
$ 0.0036
|
|
| Expense Ratio, Percent |
1800.00%
|
|
| Factors Affecting Performance [Text Block] |
HOW DID THE FUND PERFORM LAST YEAR?For the 6 months ended March 31, 2025, the Carret Kansas Tax-Exempt Bond Fund returned -0.85% compared to a return of -0.54% for the Bloomberg US Municipal Bond 7 Year Index and a return of -1.43% for the Bloomberg Municipal Bond Index. The performance of the Fund was driven by the rise in municipal bond interest rates during the period between 9/30/24 and 3/31/25. The broad uncertainty of the macro and micro economies added a notable degree of volatility to the municipal bond marketplace. The Fund’s high-quality focus, premium coupon bias, and intermediate-duration structure provided a cushion against market volatility. |
|
| Line Graph [Table Text Block] |
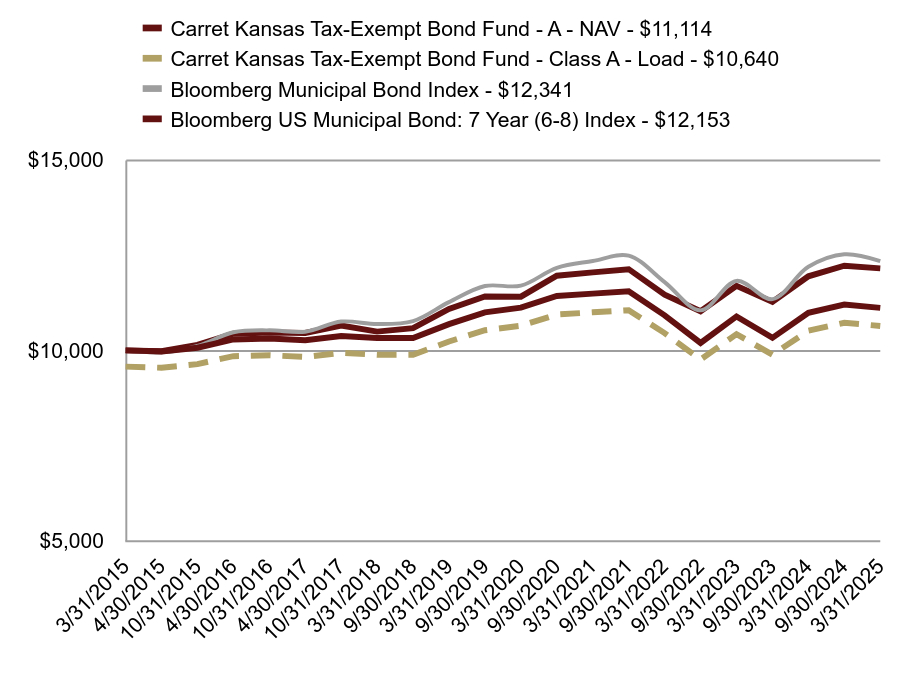 | Carret Kansas Tax-Exempt Bond Fund - A - NAV - $11,114 | Carret Kansas Tax-Exempt Bond Fund - Class A - Load - $10,640 | Bloomberg Municipal Bond Index - $12,341 | Bloomberg US Municipal Bond: 7 Year (6-8) Index - $12,153 |
|---|
3/31/2015 | $10,000.00 | $9,573.01 | $10,000.00 | $10,000.01 |
|---|
4/30/2015 | $9,969.29 | $9,543.62 | $9,947.50 | $9,977.17 |
|---|
10/31/2015 | $10,069.81 | $9,639.84 | $10,114.91 | $10,142.60 |
|---|
4/30/2016 | $10,287.11 | $9,847.86 | $10,474.09 | $10,437.17 |
|---|
10/31/2016 | $10,312.11 | $9,871.80 | $10,525.38 | $10,470.35 |
|---|
4/30/2017 | $10,267.03 | $9,828.64 | $10,489.18 | $10,458.57 |
|---|
10/31/2017 | $10,379.21 | $9,936.03 | $10,756.13 | $10,651.18 |
|---|
3/31/2018 | $10,324.14 | $9,883.32 | $10,690.48 | $10,492.47 |
|---|
9/30/2018 | $10,326.72 | $9,885.79 | $10,767.34 | $10,582.16 |
|---|
3/31/2019 | $10,688.76 | $10,232.36 | $11,266.15 | $11,086.41 |
|---|
9/30/2019 | $10,998.28 | $10,528.67 | $11,688.01 | $11,414.88 |
|---|
3/31/2020 | $11,121.34 | $10,646.48 | $11,699.77 | $11,409.11 |
|---|
9/30/2020 | $11,428.26 | $10,940.29 | $12,166.26 | $11,960.24 |
|---|
3/31/2021 | $11,488.73 | $10,998.18 | $12,344.23 | $12,047.29 |
|---|
9/30/2021 | $11,547.92 | $11,054.84 | $12,485.99 | $12,130.49 |
|---|
3/31/2022 | $10,919.58 | $10,453.33 | $11,792.55 | $11,462.97 |
|---|
9/30/2022 | $10,195.02 | $9,759.71 | $11,050.03 | $11,025.81 |
|---|
3/31/2023 | $10,890.53 | $10,425.52 | $11,823.01 | $11,693.09 |
|---|
9/30/2023 | $10,329.20 | $9,888.16 | $11,344.39 | $11,271.56 |
|---|
3/31/2024 | $10,984.94 | $10,515.90 | $12,192.65 | $11,943.65 |
|---|
9/30/2024 | $11,202.56 | $10,724.23 | $12,521.00 | $12,221.14 |
|---|
3/31/2025 | $11,114.49 | $10,639.92 | $12,341.36 | $12,152.61 |
|---|
|
|
| Average Annual Return [Table Text Block] |
AVERAGE ANNUAL TOTAL RETURNS Class A | 1 Year | 5 Year | 10 Year |
|---|
Carret Kansas Tax-Exempt Bond Fund - Class A - NAV | 1.18% | -0.01% | 1.06% |
|---|
Carret Kansas Tax-Exempt Bond Fund - Class A - Load | -3.13% | -0.88% | 0.62% |
|---|
Bloomberg Municipal Bond Index | 1.22% | 1.07% | 2.13% |
|---|
Bloomberg US Municipal Bond: 7 Year (6-8) Index | 1.74% | 1.27% | 1.97% |
|---|
|
|
| AssetsNet |
$ 119,768,392
|
$ 119,768,392
|
| Holdings Count | Holding |
167
|
167
|
| InvestmentCompanyPortfolioTurnover |
5.00%
|
|
| Additional Fund Statistics [Text Block] |
- Total Net Assets$119,768,392
- # of Portfolio Holdings167
- Portfolio Turnover Rate5%
|
|
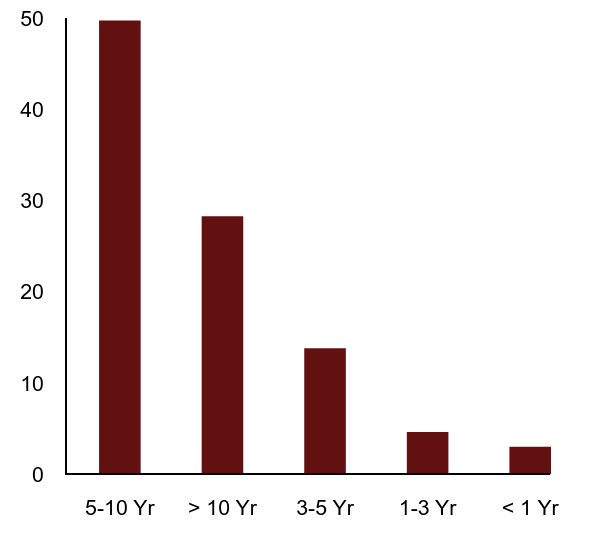
| Holdings [Text Block] |
Value | Value |
|---|
5-10 Yr | 49.8% | > 10 Yr | 28.3% | 3-5 Yr | 13.8% | 1-3 Yr | 4.6% | < 1 Yr | 3.0% |
|
|
| Largest Holdings [Text Block] |
Top 10 | % |
|---|
State of Kansas Department of Transportation 09/01/2031 5.00% | 1.74% | State of Kansas Department of Transportation 09/01/2034 5.00% | 1.73% | Allen County Unified School District No 257 09/01/2043 3.00% | 1.61% | Kansas Development Finance Authority 05/01/2042 5.00% | 1.35% | State of Kansas Department of Transportation 09/01/2028 5.00% | 1.31% | County of Johnson KS 09/01/2035 4.00% | 1.28% | Johnson County Public Building Commission 09/01/2031 4.00% | 1.26% | Douglas County Unified School District No 497 Lawrence 09/01/2031 4.00% | 1.26% | Johnson County Unified School District No 229 Blue Valley 10/01/2040 4.00% | 1.24% | City of Lenexa KS 09/01/2033 3.00% | 1.24% | Total % of Top 10 Holdings | 14.02% |
|
|
| Material Fund Change [Text Block] |
There have been no material Fund changes during the reporting period. |
|
| C000203690 |
|
|
| Shareholder Report [Line Items] |
|
|
| Fund Name |
Carret Kansas Tax-Exempt Bond Fund
|
|
| Trading Symbol |
INSTITUTIONAL
|
|
| Annual or Semi-Annual Statement [Text Block] |
This semi-annual shareholder report contains important information about Carret Kansas Tax-Exempt Bond Fund - I for the period of October 1, 2024 to March 31, 2025.
|
|
| Shareholder Report Annual or Semi-Annual |
semi-annual shareholder report
|
|
| Additional Information [Text Block] |
You can find additional information about the Fund at https://www.carret.com/carret-kansas-tax-exempt-bond-fund. You can also request this information by contacting us at 888.266.8787.
|
|
| Additional Information Phone Number |
888.266.8787
|
|
| Additional Information Website |
<span style="box-sizing: border-box; color: rgb(0, 0, 0); display: inline; flex-wrap: nowrap; font-size: 12px; font-weight: 400; grid-area: auto; line-height: 16.8px; margin: 0px; overflow: visible; text-align: left; white-space-collapse: preserve-breaks;">https://www.carret.com/carret-kansas-tax-exempt-bond-fund</span>
|
|
| Expenses [Text Block] |
WHAT WERE THE FUND'S COST FOR THE LAST SIX MONTHS?
|
|
| Expenses Paid, Amount |
$ 0.0048
|
|
| Expense Ratio, Percent |
2400.00%
|
|
| Factors Affecting Performance [Text Block] |
HOW DID THE FUND PERFORM LAST YEAR?For the 6 months ended March 31, 2025, the Carret Kansas Tax-Exempt Bond Fund returned -0.85% compared to a return of -0.54% for the Bloomberg US Municipal Bond 7 Year Index and a return of -1.43% for the Bloomberg Municipal Bond Index. The performance of the Fund was driven by the rise in municipal bond interest rates during the period between 9/30/24 and 3/31/25. The broad uncertainty of the macro and micro economies added a notable degree of volatility to the municipal bond marketplace. The Fund’s high-quality focus, premium coupon bias, and intermediate-duration structure provided a cushion against market volatility. |
|
| Line Graph [Table Text Block] |
 | Carret Kansas Tax-Exempt Bond Fund - Institutional - $3,427,669 | Bloomberg Municipal Bond Index - $3,702,408 | Bloomberg US Municipal Bond: 7 Year (6-8) Index - $3,645,779 |
|---|
3/31/2015 | $3,000,000.00 | $3,000,000.00 | $3,000,000.09 |
|---|
4/30/2015 | $2,991,750.38 | $2,984,249.56 | $2,993,146.99 |
|---|
10/31/2015 | $3,026,768.46 | $3,034,473.18 | $3,042,777.89 |
|---|
4/30/2016 | $3,098,003.75 | $3,142,226.17 | $3,131,146.85 |
|---|
10/31/2016 | $3,111,615.44 | $3,157,615.49 | $3,141,101.89 |
|---|
4/30/2017 | $3,103,998.15 | $3,146,754.08 | $3,137,567.13 |
|---|
10/31/2017 | $3,144,075.25 | $3,226,839.63 | $3,195,349.61 |
|---|
3/31/2018 | $3,132,443.86 | $3,207,144.64 | $3,147,738.58 |
|---|
9/30/2018 | $3,139,253.53 | $3,230,200.84 | $3,174,646.02 |
|---|
3/31/2019 | $3,250,350.98 | $3,379,843.88 | $3,325,919.26 |
|---|
9/30/2019 | $3,351,868.49 | $3,506,402.96 | $3,424,459.68 |
|---|
3/31/2020 | $3,393,593.89 | $3,509,930.83 | $3,422,728.36 |
|---|
9/30/2020 | $3,491,602.92 | $3,649,879.16 | $3,588,068.50 |
|---|
3/31/2021 | $3,514,458.58 | $3,703,269.53 | $3,614,182.43 |
|---|
9/30/2021 | $3,536,989.63 | $3,745,798.49 | $3,639,142.15 |
|---|
3/31/2022 | $3,348,726.79 | $3,537,764.94 | $3,438,887.26 |
|---|
9/30/2022 | $3,130,459.30 | $3,315,008.75 | $3,307,740.50 |
|---|
3/31/2023 | $3,348,181.04 | $3,546,904.08 | $3,507,923.26 |
|---|
9/30/2023 | $3,179,613.27 | $3,403,316.76 | $3,381,465.47 |
|---|
3/31/2024 | $3,385,579.42 | $3,657,796.05 | $3,583,090.98 |
|---|
9/30/2024 | $3,456,970.03 | $3,756,298.79 | $3,666,338.15 |
|---|
3/31/2025 | $3,427,668.72 | $3,702,408.40 | $3,645,778.84 |
|---|
|
|
| Average Annual Return [Table Text Block] |
AVERAGE ANNUAL TOTAL RETURNS Institutional | 1 Year | 5 Year | 10 Year |
|---|
Carret Kansas Tax-Exempt Bond Fund - Institutional | 1.24% | 0.20% | 1.34% |
|---|
Bloomberg Municipal Bond Index | 1.22% | 1.07% | 2.13% |
|---|
Bloomberg US Municipal Bond: 7 Year (6-8) Index | 1.74% | 1.27% | 1.97% |
|---|
|
|
| AssetsNet |
$ 119,768,392
|
$ 119,768,392
|
| Holdings Count | Holding |
167
|
167
|
| InvestmentCompanyPortfolioTurnover |
5.00%
|
|
| Additional Fund Statistics [Text Block] |
- Total Net Assets$119,768,392
- # of Portfolio Holdings167
- Portfolio Turnover Rate5%
|
|
| Holdings [Text Block] |
Value | Value |
|---|
5-10 Yr | 49.8% | > 10 Yr | 28.3% | 3-5 Yr | 13.8% | 1-3 Yr | 4.6% | < 1 Yr | 3.0% |
|
|
| Largest Holdings [Text Block] |
Top 10 | % |
|---|
State of Kansas Department of Transportation 09/01/2031 5.00% | 1.74% | State of Kansas Department of Transportation 09/01/2034 5.00% | 1.73% | Allen County Unified School District No 257 09/01/2043 3.00% | 1.61% | Kansas Development Finance Authority 05/01/2042 5.00% | 1.35% | State of Kansas Department of Transportation 09/01/2028 5.00% | 1.31% | County of Johnson KS 09/01/2035 4.00% | 1.28% | Johnson County Public Building Commission 09/01/2031 4.00% | 1.26% | Douglas County Unified School District No 497 Lawrence 09/01/2031 4.00% | 1.26% | Johnson County Unified School District No 229 Blue Valley 10/01/2040 4.00% | 1.24% | City of Lenexa KS 09/01/2033 3.00% | 1.24% | Total % of Top 10 Holdings | 14.02% |
|
|
| Material Fund Change [Text Block] |
There have been no material Fund changes during the reporting period. |
|
| C000225205 |
|
|
| Shareholder Report [Line Items] |
|
|
| Fund Name |
Hillman Value Fund
|
|
| Trading Symbol |
HCMAX
|
|
| Annual or Semi-Annual Statement [Text Block] |
This semi-annual shareholder report contains important information about Hillman Value Fund for the period of October 1, 2024 to March 31, 2025.
|
|
| Shareholder Report Annual or Semi-Annual |
semi-annual shareholder report
|
|
| Additional Information [Text Block] |
You can find additional information about the Fund at https://hcmfunds.com/resources. You can also request this information by contacting us at 1-855-400-5944.
|
|
| Material Fund Change Notice [Text Block] |
|
|
| Additional Information Phone Number |
1-855-400-5944
|
|
| Additional Information Website |
<span style="box-sizing: border-box; color: rgb(10, 10, 10); display: inline; flex-wrap: nowrap; font-size: 12px; font-weight: 400; grid-area: auto; line-height: 14.4px; margin: 0px; overflow: visible; text-align: left; white-space-collapse: preserve-breaks;">https://hcmfunds.com/resources</span>
|
|
| Expenses [Text Block] |
What were the Fund’s cost for the last six months? (based on a hypothetical $10,000 investment) FUND NAME | COST OF A $10,000 INVESTMENT | COST PAID AS A PERCENTAGE OF
A $10,000 INVESTMENT |
|---|
Hillman Value Fund | $47 | 0.95% |
|---|
|
|
| Expenses Paid, Amount |
$ 0.0095
|
|
| Expense Ratio, Percent |
4700.00%
|
|
| Factors Affecting Performance [Text Block] |
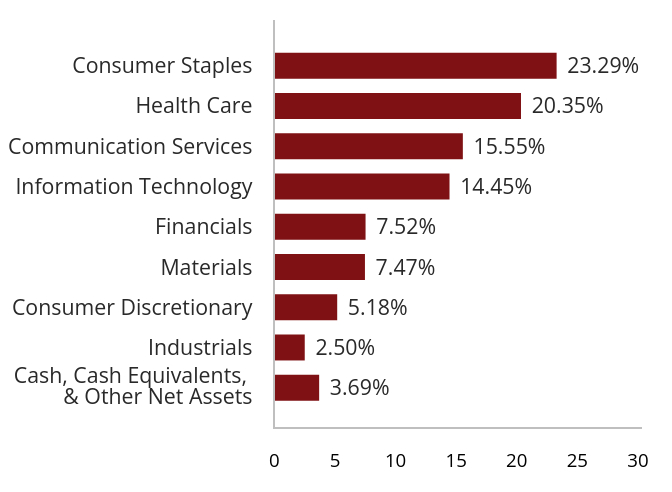
How did the Fund perform in the last six months? For the six months ending March 31, 2025, the Hillman Value Fund returned -2.98% versus a return of 0.11% for the Russell 1000 Value Total Return Index. While the fund experienced near-term underperformance, it is our view that investment in enterprises which we believe possess sustainable competitive advantages, coupled with strict adherence to a fundamentally sound valuation discipline, will help to support performance over the long-term. The Fund enjoyed strong performance in the Communication Services and Industrials Sectors. The Consumer Staples, Materials, Information Technology, and Health Care Sectors negatively impacted results. The premiums generated from option writing nominally benefited performance. |
|
| Average Annual Return [Table Text Block] |
AVERAGE ANNUAL TOTAL RETURNS Fund | 1 Year | 5 Year | 10 Year |
|---|
Hillman Value Fund | -1.95% | 15.13% | 10.00% |
|---|
FT Wilshire 5000 Index - TR | 7.11% | 18.34% | 12.00% |
|---|
Russell 1000® Value Index TR | 7.18% | 16.15% | 8.79% |
|---|
|
|
| AssetsNet |
$ 141,870,338
|
$ 141,870,338
|
| Holdings Count | Holding |
39
|
39
|
| InvestmentCompanyPortfolioTurnover |
25.00%
|
|
| Additional Fund Statistics [Text Block] |
- Total Net Assets$141,870,338
- # of Portfolio Holdings39
- Portfolio Turnover Rate25%
|
|
| Holdings [Text Block] |
Value | Value |
|---|
Cash, Cash Equivalents,
& Other Net Assets | 3.69% | Industrials | 2.50% | Consumer Discretionary | 5.18% | Materials | 7.47% | Financials | 7.52% | Information Technology | 14.45% | Communication Services | 15.55% | Health Care | 20.35% | Consumer Staples | 23.29% |
|
|
| Material Fund Change [Text Block] |
There have been no material Fund changes during the reporting period. |
|
| C000200677 |
|
|
| Shareholder Report [Line Items] |
|
|
| Fund Name |
SEVEN CANYONS STRATEGIC GLOBAL FUND
|
|
| Class Name |
Investor
|
|
| Trading Symbol |
WASIX
|
|
| Annual or Semi-Annual Statement [Text Block] |
Semi-Annual Shareholder Report
|
|
| Shareholder Report Annual or Semi-Annual |
semi-annual shareholder report
|
|
| Additional Information Phone Number |
833-722-6966
|
|
| Additional Information Website |
https://sevencanyonsadvisors.com/investor-reports
|
|
| Expenses [Text Block] |
WHAT WERE THE FUND’S COST FOR LAST SIX MONTHS? (based on a hypothetical $10,000 investment) CLASS NAME | COST OF A $10,000 INVESTMENT | COST PAID AS A PERCENTAGE OF
A $10,000 INVESTMENT |
|---|
Seven Canyons Strategic Global Fund - Investor | $68 | 1.40% |
|---|
|
|
| Expenses Paid, Amount |
$ 0.0140
|
|
| Expense Ratio, Percent |
6800.00%
|
|
| AssetsNet |
$ 11,684,341
|
$ 11,684,341
|
| Holdings Count | Holding |
26
|
26
|
| InvestmentCompanyPortfolioTurnover |
119.00%
|
|
| Additional Fund Statistics [Text Block] |
- Total Net Assets$11,684,341
- # of Portfolio Holdings26
- Portfolio Turnover Rate119%
|
|
| Material Fund Change [Text Block] |
On November 21, 2024, the Board of Trustees (the “Board”) of ALPS Series Trust (the “Trust”), based upon the recommendation of Seven Canyons Advisors, LLC, the investment adviser to the Funds, approved the proposed reorganization of the Seven Canyons Strategic Global Fund and the Seven Canyons World Innovators Fund, severally and not jointly (each a “Target Fund” and together the “Target Funds”) into the Hood River International Opportunity Fund (the “Acquiring Fund”), a series of Manager Directed Portfolios, (each, a “Reorganization” and together, the “Reorganizations”). Each Reorganization is subject to approval by shareholders of the applicable Target Fund. The effective date of the reorganization was April 4, 2025. |
|
| C000200678 |
|
|
| Shareholder Report [Line Items] |
|
|
| Fund Name |
SEVEN CANYONS WORLD INNOVATORS FUND
|
|
| Class Name |
Institutional
|
|
| Trading Symbol |
WIGTX
|
|
| Annual or Semi-Annual Statement [Text Block] |
Semi-Annual Shareholder Report
|
|
| Shareholder Report Annual or Semi-Annual |
semi-annual shareholder report
|
|
| Additional Information Phone Number |
833-722-6966
|
|
| Additional Information Website |
https://sevencanyonsadvisors.com/investor-reports
|
|
| Expenses [Text Block] |
WHAT WERE THE FUND’S COST FOR LAST SIX MONTHS? (based on a hypothetical $10,000 investment) CLASS NAME | COST OF A $10,000 INVESTMENT | COST PAID AS A PERCENTAGE OF
A $10,000 INVESTMENT |
|---|
Seven Canyons World Innovators Fund - Institutional | $77 | 1.60% |
|---|
|
|
| Expenses Paid, Amount |
$ 0.0160
|
|
| Expense Ratio, Percent |
7700.00%
|
|
| AssetsNet |
$ 36,129,346
|
$ 36,129,346
|
| Holdings Count | Holding |
42
|
42
|
| InvestmentCompanyPortfolioTurnover |
91.00%
|
|
| Additional Fund Statistics [Text Block] |
- Total Net Assets$36,129,346
- # of Portfolio Holdings42
- Portfolio Turnover Rate91%
|
|
| Material Fund Change [Text Block] |
On November 21, 2024, the Board of Trustees (the “Board”) of ALPS Series Trust (the “Trust”), based upon the recommendation of Seven Canyons Advisors, LLC, the investment adviser to the Funds, approved the proposed reorganization of the Seven Canyons Strategic Global Fund and the Seven Canyons World Innovators Fund, severally and not jointly (each a “Target Fund” and together the “Target Funds”) into the Hood River International Opportunity Fund (the “Acquiring Fund”), a series of Manager Directed Portfolios, (each, a “Reorganization” and together, the “Reorganizations”). Each Reorganization is subject to approval by shareholders of the applicable Target Fund. The effective date of the reorganization was April 4, 2025. |
|
| C000200679 |
|
|
| Shareholder Report [Line Items] |
|
|
| Fund Name |
SEVEN CANYONS WORLD INNOVATORS FUND
|
|
| Class Name |
Investor
|
|
| Trading Symbol |
WAGTX
|
|
| Annual or Semi-Annual Statement [Text Block] |
Semi-Annual Shareholder Report
|
|
| Shareholder Report Annual or Semi-Annual |
semi-annual shareholder report
|
|
| Additional Information Phone Number |
833-722-6966
|
|
| Additional Information Website |
https://sevencanyonsadvisors.com/investor-reports
|
|
| Expenses [Text Block] |
WHAT WERE THE FUND’S COST FOR LAST SIX MONTHS? (based on a hypothetical $10,000 investment) CLASS NAME | COST OF A $10,000 INVESTMENT | COST PAID AS A PERCENTAGE OF
A $10,000 INVESTMENT |
|---|
Seven Canyons World Innovators Fund - Investor | $82 | 1.70% |
|---|
|
|
| Expenses Paid, Amount |
$ 0.0170
|
|
| Expense Ratio, Percent |
8200.00%
|
|
| AssetsNet |
$ 36,129,346
|
$ 36,129,346
|
| Holdings Count | Holding |
42
|
42
|
| InvestmentCompanyPortfolioTurnover |
91.00%
|
|
| Additional Fund Statistics [Text Block] |
- Total Net Assets$36,129,346
- # of Portfolio Holdings42
- Portfolio Turnover Rate91%
|
|
| Material Fund Change [Text Block] |
On November 21, 2024, the Board of Trustees (the “Board”) of ALPS Series Trust (the “Trust”), based upon the recommendation of Seven Canyons Advisors, LLC, the investment adviser to the Funds, approved the proposed reorganization of the Seven Canyons Strategic Global Fund and the Seven Canyons World Innovators Fund, severally and not jointly (each a “Target Fund” and together the “Target Funds”) into the Hood River International Opportunity Fund (the “Acquiring Fund”), a series of Manager Directed Portfolios, (each, a “Reorganization” and together, the “Reorganizations”). Each Reorganization is subject to approval by shareholders of the applicable Target Fund. The effective date of the reorganization was April 4, 2025. |
|
| C000225903 |
|
|
| Shareholder Report [Line Items] |
|
|
| Fund Name |
CLARKSTON FOUNDERS FUND
|
|
| Class Name |
Founders
|
|
| Trading Symbol |
CFMDX
|
|
| Annual or Semi-Annual Statement [Text Block] |
This semi-annual shareholder report contains important information about Clarkston Founders Fund - Founders Class for the period of October 1, 2024 to March 31, 2025.
|
|
| Shareholder Report Annual or Semi-Annual |
Semi-Annual Shareholder Report
|
|
| Additional Information [Text Block] |
You can find additional information about the Fund at https://www.clarkstonfunds.com/literature/clarkston-founders-fund. You can also request this information by contacting us at 844.680.6562.
|
|
| Additional Information Phone Number |
844.680.6562
|
|
| Additional Information Website |
<span style="box-sizing: border-box; color: rgb(74, 79, 84); display: inline; flex-wrap: nowrap; font-size: 12px; font-weight: 400; grid-area: auto; line-height: 14.4px; margin: 0px; overflow: visible; text-align: justify; white-space-collapse: preserve-breaks;">https://www.clarkstonfunds.com/literature/clarkston-founders-fund</span>
|
|
| Expenses [Text Block] |
WHAT WERE THE FUND'S COSTS FOR THE LAST SIX MONTHS? (based on a hypothetical $10,000 investment) CLASS NAME | COST OF A $10,000 INVESTMENT | COST PAID AS A PERCENTAGE OF
A $10,000 INVESTMENT |
|---|
Clarkston Founders Fund - Founders Class | $40 | 0.80% |
|---|
|
|
| Expenses Paid, Amount |
$ 0.0080
|
|
| Expense Ratio, Percent |
4000.00%
|
|
| Factors Affecting Performance [Text Block] |
HOW DID THE FUND PERFORM IN THE LAST SIX MONTHS?During the six-month period ended March 31, 2025, the Fund’s Founders Class had a return of -1.27% compared to -2.81% for the Russell Midcap® Index and -2.21% for the Russell® 3000 Index. Three largest contributors to the Fund’s performance for the period: LPL Financial Holdings Inc. (LPLA), a provider of an integrated platform of brokerage and investment advisory services to independent financial advisors and financial advisors at institutions in the United States GFL Environmental Inc. (GFL), a provider of non-hazardous solid waste management and environmental services in Canada and the United States Warner Bros. Discovery, Inc. (WBD), a media and entertainment company that operates worldwide
Three largest detractors from the Fund’s performance for the period: Clarivate Plc (CLVT), an information services provider in the Americas, the Middle East, Africa, Europe, and the Asia Pacific that operates through three segments: Academia & Government, Life Sciences & Healthcare, and Intellectual Property Avantor, Inc. (AVTR), a provider of mission-critical products and services to customers in the biopharma, healthcare, education and government, advanced technologies, and applied materials industries in the Americas, Europe, Asia, the Middle East, and Africa Lamb Weston Holdings, Inc. (LW), a company that engages in the production, distribution, and marketing of frozen potato products in the United States, Canada, Mexico, and internationally that offers frozen potatoes, commercial ingredients, and appetizers under the Lamb Weston brand, as well as under various customer labels
|
|
| Average Annual Return [Table Text Block] |
AVERAGE ANNUAL TOTAL RETURNS Founders | 1 Year | Since Inception |
|---|
Clarkston Founders Fund - Founders Class (Incept. February 16, 2021) | 0.29% | 2.68% |
|---|
Russell 3000® Index | 7.22% | 8.90% |
|---|
Russell Midcap® Index | 2.59% | 5.03% |
|---|
|
|
| Performance Inception Date |
|
Feb. 16, 2021
|
| AssetsNet |
$ 778,822,536
|
$ 778,822,536
|
| Holdings Count | Holding |
25
|
25
|
| InvestmentCompanyPortfolioTurnover |
12.00%
|
|
| Additional Fund Statistics [Text Block] |
- Total Net Assets$778,822,536
- # of Portfolio Holdings (excluding cash)25
- Portfolio Turnover Rate12%
|
|
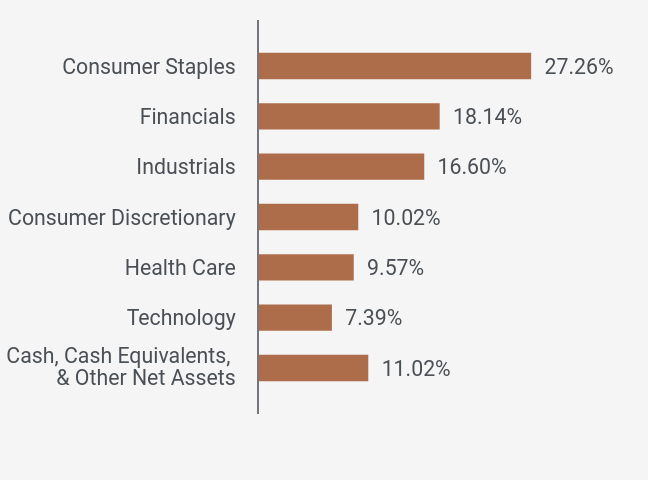
| Holdings [Text Block] |
SECTOR WEIGHTINGS (as a % of Net Assets)Value | Value |
|---|
Cash, Cash Equivalents,
& Other Net Assets | 11.02% | Technology | 7.39% | Health Care | 9.57% | Consumer Discretionary | 10.02% | Industrials | 16.60% | Financials | 18.14% | Consumer Staples | 27.26% |
|
|
| Material Fund Change [Text Block] |
There have been no material Fund changes during the reporting period. |
|
| C000168469 |
|
|
| Shareholder Report [Line Items] |
|
|
| Fund Name |
CLARKSTON FOUNDERS FUND
|
|
| Class Name |
Institutional
|
|
| Trading Symbol |
CIMDX
|
|
| Annual or Semi-Annual Statement [Text Block] |
This semi-annual shareholder report contains important information about Clarkston Founders Fund - Institutional Class for the period of October 1, 2024 to March 31, 2025.
|
|
| Shareholder Report Annual or Semi-Annual |
Semi-Annual Shareholder Report
|
|
| Additional Information [Text Block] |
You can find additional information about the Fund at https://www.clarkstonfunds.com/literature/clarkston-founders-fund. You can also request this information by contacting us at 844.680.6562.
|
|
| Additional Information Phone Number |
844.680.6562
|
|
| Additional Information Website |
<span style="box-sizing: border-box; color: rgb(74, 79, 84); display: inline; flex-wrap: nowrap; font-size: 12px; font-weight: 400; grid-area: auto; line-height: 14.4px; margin: 0px; overflow: visible; text-align: justify; white-space-collapse: preserve-breaks;">https://www.clarkstonfunds.com/literature/clarkston-founders-fund</span>
|
|
| Expenses [Text Block] |
WHAT WERE THE FUND'S COSTS FOR THE LAST SIX MONTHS? (based on a hypothetical $10,000 investment) CLASS NAME | COST OF A $10,000 INVESTMENT | COST PAID AS A PERCENTAGE OF
A $10,000 INVESTMENT |
|---|
Clarkston Founders Fund - Institutional Class | $45 | 0.90% |
|---|
|
|
| Expenses Paid, Amount |
$ 0.0090
|
|
| Expense Ratio, Percent |
4500.00%
|
|
| Factors Affecting Performance [Text Block] |
HOW DID THE FUND PERFORM IN THE LAST SIX MONTHS?During the six-month period ended March 31, 2025, the Fund’s Institutional Class had a return of -1.31% compared to -2.81% for the Russell Midcap® Index and -2.21% for the Russell® 3000 Index. Three largest contributors to the Fund’s performance for the period: LPL Financial Holdings Inc. (LPLA), a provider of an integrated platform of brokerage and investment advisory services to independent financial advisors and financial advisors at institutions in the United States GFL Environmental Inc. (GFL), a provider of non-hazardous solid waste management and environmental services in Canada and the United States Warner Bros. Discovery, Inc. (WBD), a media and entertainment company that operates worldwide
Three largest detractors from the Fund’s performance for the period: Clarivate Plc (CLVT), an information services provider in the Americas, the Middle East, Africa, Europe, and the Asia Pacific that operates through three segments: Academia & Government, Life Sciences & Healthcare, and Intellectual Property Avantor, Inc. (AVTR), a provider of mission-critical products and services to customers in the biopharma, healthcare, education and government, advanced technologies, and applied materials industries in the Americas, Europe, Asia, the Middle East, and Africa Lamb Weston Holdings, Inc. (LW), a company that engages in the production, distribution, and marketing of frozen potato products in the United States, Canada, Mexico, and internationally that offers frozen potatoes, commercial ingredients, and appetizers under the Lamb Weston brand, as well as under various customer labels
|
|
| Average Annual Return [Table Text Block] |
AVERAGE ANNUAL TOTAL RETURNS Institutional | 1 Year | 5 Year | Since Inception |
|---|
Clarkston Founders Fund - Institutional Class (Incept. January 31, 2017) | 0.19% | 12.54% | 7.82% |
|---|
Russell 3000® Index | 7.22% | 18.18% | 12.90% |
|---|
Russell Midcap® Index | 2.59% | 16.28% | 9.71% |
|---|
|
|
| Performance Inception Date |
|
Jan. 31, 2017
|
| AssetsNet |
$ 778,822,536
|
$ 778,822,536
|
| Holdings Count | Holding |
25
|
25
|
| InvestmentCompanyPortfolioTurnover |
12.00%
|
|
| Additional Fund Statistics [Text Block] |
- Total Net Assets$778,822,536
- # of Portfolio Holdings (excluding cash)25
- Portfolio Turnover Rate12%
|
|
| Holdings [Text Block] |
SECTOR WEIGHTINGS (as a % of Net Assets)Value | Value |
|---|
Cash, Cash Equivalents,
& Other Net Assets | 11.02% | Technology | 7.39% | Health Care | 9.57% | Consumer Discretionary | 10.02% | Industrials | 16.60% | Financials | 18.14% | Consumer Staples | 27.26% |
|
|
| Material Fund Change [Text Block] |
There have been no material Fund changes during the reporting period. |
|
| C000159698 |
|
|
| Shareholder Report [Line Items] |
|
|
| Fund Name |
CLARKSTON FUND
|
|
| Class Name |
Institutional
|
|
| Trading Symbol |
CILGX
|
|
| Annual or Semi-Annual Statement [Text Block] |
This semi-annual shareholder report contains important information about Clarkston Fund Institutional Class for the period of October 1, 2024 to March 31, 2025.
|
|
| Shareholder Report Annual or Semi-Annual |
Semi-Annual Shareholder Report
|
|
| Additional Information [Text Block] |
You can find additional information about the Fund at https://www.clarkstonfunds.com/literature/clarkston-fund. You can also request this information by contacting us at 844.680.6562.
|
|
| Additional Information Phone Number |
844.680.6562
|
|
| Additional Information Website |
<span style="box-sizing: border-box; color: rgb(74, 79, 84); display: inline; flex-wrap: nowrap; font-size: 12px; font-weight: 400; grid-area: auto; line-height: 14.4px; margin: 0px; overflow: visible; text-align: justify; white-space-collapse: preserve-breaks;">https://www.clarkstonfunds.com/literature/clarkston-fund</span>
|
|
| Expenses [Text Block] |
WHAT WERE THE FUND'S COSTS FOR THE LAST SIX MONTHS? (based on a hypothetical $10,000 investment) CLASS NAME | COST OF A $10,000 INVESTMENT | COST PAID AS A PERCENTAGE OF
A $10,000 INVESTMENT |
|---|
Clarkston Fund - Institutional Class | $32 | 0.65% |
|---|
|
|
| Expenses Paid, Amount |
$ 0.0065
|
|
| Expense Ratio, Percent |
3200.00%
|
|
| Factors Affecting Performance [Text Block] |
HOW DID THE FUND PERFORM IN THE LAST SIX MONTHS?During the six-month period ended March 31, 2025, the Fund had a return of -2.42% compared to -1.87% for the Russell 1000® Index and -2.21% for the Russell® 3000 Index. Three largest contributors to the Fund’s performance for the period: LPL Financial Holdings Inc. (LPLA), a provider of an integrated platform of brokerage and investment advisory services to independent financial advisors and financial advisors at institutions in the United States Warner Bros. Discovery, Inc. (WBD), a media and entertainment company that operates worldwide Capital One Financial Corporation (COF), a financial services holding company for the Capital One, National Association, which engages in the provision of various financial products and services in the United States, Canada, and the United Kingdom
Three largest detractors from the Fund’s performance for the period: Clarivate Plc (CLVT), an information services provider in the Americas, the Middle East, Africa, Europe, and the Asia Pacific that operates through three segments: Academia & Government, Life Sciences & Healthcare, and Intellectual Property Avantor, Inc. (AVTR), a provider of mission-critical products and services to customers in the biopharma, healthcare, education and government, advanced technologies, and applied materials industries in the Americas, Europe, Asia, the Middle East, and Africa IQVIA Holdings Inc. (IQV), a provider of clinical research services, commercial insights, and healthcare intelligence to the life sciences and healthcare industries in the Americas, Europe, Africa, and the Asia-Pacific
|
|
| Average Annual Return [Table Text Block] |
AVERAGE ANNUAL TOTAL RETURNS Institutional | 1 Year | 5 Year | Since Inception |
|---|
Clarkston Fund - Institutional Class (Incept. April 1, 2016) | -2.11% | 13.58% | 8.47% |
|---|
Russell 3000® Index | 7.22% | 18.18% | 13.17% |
|---|
Russell 1000® Index | 7.82% | 18.47% | 13.48% |
|---|
|
|
| Performance Inception Date |
|
Apr. 01, 2016
|
| AssetsNet |
$ 179,447,666
|
$ 179,447,666
|
| Holdings Count | Holding |
27
|
27
|
| InvestmentCompanyPortfolioTurnover |
8.00%
|
|
| Additional Fund Statistics [Text Block] |
- Total Net Assets$179,447,666
- # of Portfolio Holdings (excluding cash)27
- Portfolio Turnover Rate8%
|
|
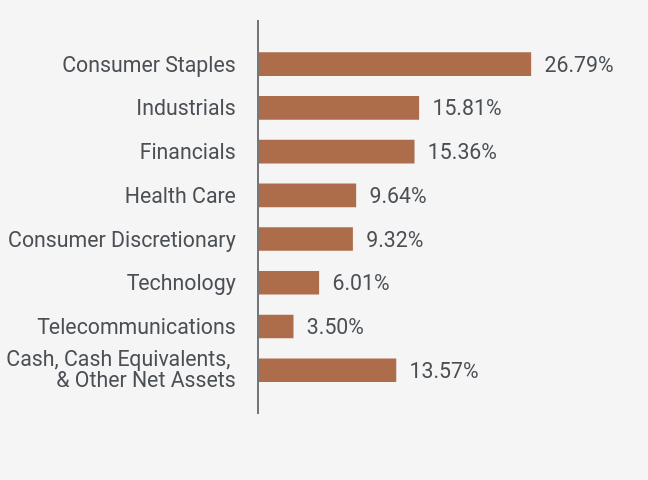
| Holdings [Text Block] |
SECTOR WEIGHTINGS (as a % of Net Assets)Value | Value |
|---|
Cash, Cash Equivalents,
& Other Net Assets | 13.57% | Telecommunications | 3.50% | Technology | 6.01% | Consumer Discretionary | 9.32% | Health Care | 9.64% | Financials | 15.36% | Industrials | 15.81% | Consumer Staples | 26.79% |
|
|
| Material Fund Change [Text Block] |
There have been no material Fund changes during the reporting period. |
|
| C000159696 |
|
|
| Shareholder Report [Line Items] |
|
|
| Fund Name |
CLARKSTON PARTNERS FUND
|
|
| Class Name |
Founders
|
|
| Trading Symbol |
CFSMX
|
|
| Annual or Semi-Annual Statement [Text Block] |
This semi-annual shareholder report contains important information about Clarkston Partners Fund - Founders Class for the period of October 1, 2024 to March 31, 2025.
|
|
| Shareholder Report Annual or Semi-Annual |
Semi-Annual Shareholder Report
|
|
| Additional Information [Text Block] |
You can find additional information about the Fund at https://www.clarkstonfunds.com/literature/clarkston-partners-fund. You can also request this information by contacting us at 844.680.6562.
|
|
| Additional Information Phone Number |
844.680.6562
|
|
| Additional Information Website |
<span style="box-sizing: border-box; color: rgb(74, 79, 84); display: inline; flex-wrap: nowrap; font-size: 12px; font-weight: 400; grid-area: auto; line-height: 14.4px; margin: 0px; overflow: visible; text-align: justify; white-space-collapse: preserve-breaks;">https://www.clarkstonfunds.com/literature/clarkston-partners-fund</span>
|
|
| Expenses [Text Block] |
WHAT WERE THE FUND'S COSTS FOR THE LAST SIX MONTHS? (based on a hypothetical $10,000 investment) CLASS NAME | COST OF A $10,000 INVESTMENT | COST PAID AS A PERCENTAGE OF
A $10,000 INVESTMENT |
|---|
Clarkston Partners Fund - Founders Class | $41 | 0.85% |
|---|
|
|
| Expenses Paid, Amount |
$ 0.0085
|
|
| Expense Ratio, Percent |
4100.00%
|
|
| Factors Affecting Performance [Text Block] |
HOW DID THE FUND PERFORM IN THE LAST SIX MONTHS?During the six-month period ended March 31, 2025, the Fund’s Founders Class had a return of -6.11% compared to -6.93% for the Russell 2500TM Index and -2.21% for the Russell® 3000 Index. Three largest contributors to the Fund’s performance for the period: LPL Financial Holdings Inc. (LPLA), a provider of an integrated platform of brokerage and investment advisory services to independent financial advisors and financial advisors at institutions in the United States GFL Environmental Inc. (GFL), a provider of non-hazardous solid waste management and environmental services in Canada and the United States Brown & Brown, Inc. (BRO), a company that markets and sells insurance products and services in the United States, Canada, Ireland, the United Kingdom, and internationally that operates through four segments: Retail, Programs, Wholesale Brokerage, and Services
Three largest detractors from the Fund’s performance for the period: Clarivate Plc (CLVT), an information services provider in the Americas, the Middle East, Africa, Europe, and the Asia Pacific that operates through three segments: Academia & Government, Life Sciences & Healthcare, and Intellectual Property Leslie's, Inc. (LESL), a company that operates as a direct-to-consumer pool and spa care brand in the United States that markets and sells pool and spa supplies and related products and services Avantor, Inc. (AVTR), a provider of mission-critical products and services to customers in the biopharma, healthcare, education and government, advanced technologies, and applied materials industries in the Americas, Europe, Asia, the Middle East, and Africa
|
|
| Average Annual Return [Table Text Block] |
AVERAGE ANNUAL TOTAL RETURNS Founders | 1 Year | 5 Year | Since Inception |
|---|
Clarkston Partners Fund - Founders Class (Incept. September 15, 2015) | -5.73% | 11.18% | 7.59% |
|---|
Russell 3000® Index | 7.22% | 18.18% | 12.87% |
|---|
Russell 2500™ Index | -3.11% | 14.91% | 8.52% |
|---|
|
|
| Performance Inception Date |
|
Sep. 15, 2015
|
| AssetsNet |
$ 1,049,289,614
|
$ 1,049,289,614
|
| Holdings Count | Holding |
24
|
24
|
| InvestmentCompanyPortfolioTurnover |
12.00%
|
|
| Additional Fund Statistics [Text Block] |
- Total Net Assets$1,049,289,614
- # of Portfolio Holdings (excluding cash)24
- Portfolio Turnover Rate12%
|
|
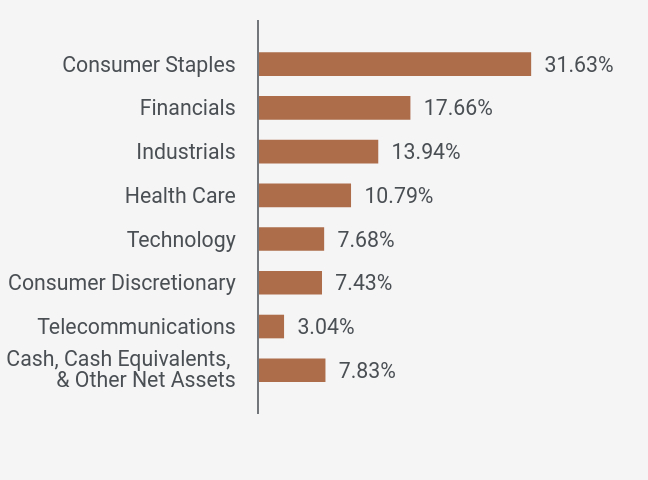
| Holdings [Text Block] |
SECTOR WEIGHTINGS (as a % of Net Assets)Value | Value |
|---|
Cash, Cash Equivalents,
& Other Net Assets | 7.83% | Telecommunications | 3.04% | Consumer Discretionary | 7.43% | Technology | 7.68% | Health Care | 10.79% | Industrials | 13.94% | Financials | 17.66% | Consumer Staples | 31.63% |
|
|
| Material Fund Change [Text Block] |
There have been no material Fund changes during the reporting period. |
|
| C000159697 |
|
|
| Shareholder Report [Line Items] |
|
|
| Fund Name |
CLARKSTON PARTNERS FUND
|
|
| Class Name |
Institutional
|
|
| Trading Symbol |
CISMX
|
|
| Annual or Semi-Annual Statement [Text Block] |
This semi-annual shareholder report contains important information about Clarkston Partners Fund - Institutional Class for the period of October 1, 2024 to March 31, 2025.
|
|
| Shareholder Report Annual or Semi-Annual |
Semi-Annual Shareholder Report
|
|
| Additional Information [Text Block] |
You can find additional information about the Fund at https://www.clarkstonfunds.com/literature/clarkston-partners-fund. You can also request this information by contacting us at 844.680.6562.
|
|
| Additional Information Phone Number |
844.680.6562
|
|
| Additional Information Website |
<span style="box-sizing: border-box; color: rgb(74, 79, 84); display: inline; flex-wrap: nowrap; font-size: 12px; font-weight: 400; grid-area: auto; line-height: 14.4px; margin: 0px; overflow: visible; text-align: justify; white-space-collapse: preserve-breaks;">https://www.clarkstonfunds.com/literature/clarkston-partners-fund</span>
|
|
| Expenses [Text Block] |
WHAT WERE THE FUND'S COSTS FOR THE LAST SIX MONTHS? (based on a hypothetical $10,000 investment) CLASS NAME | COST OF A $10,000 INVESTMENT | COST PAID AS A PERCENTAGE OF
A $10,000 INVESTMENT |
|---|
Clarkston Partners Fund - Institutional Class | $45 | 0.94% |
|---|
|
|
| Expenses Paid, Amount |
$ 0.0094
|
|
| Expense Ratio, Percent |
4500.00%
|
|
| Factors Affecting Performance [Text Block] |
HOW DID THE FUND PERFORM IN THE LAST SIX MONTHS?During the six-month period ended March 31, 2025, the Fund’s Institutional Class had a return of -6.13% compared to -6.93% for the Russell 2500TM Index and -2.21% for the Russell® 3000 Index. Three largest contributors to the Fund’s performance for the period: LPL Financial Holdings Inc. (LPLA), a provider of an integrated platform of brokerage and investment advisory services to independent financial advisors and financial advisors at institutions in the United States GFL Environmental Inc. (GFL), a provider of non-hazardous solid waste management and environmental services in Canada and the United States Brown & Brown, Inc. (BRO), a company that markets and sells insurance products and services in the United States, Canada, Ireland, the United Kingdom, and internationally that operates through four segments: Retail, Programs, Wholesale Brokerage, and Services
Three largest detractors from the Fund’s performance for the period: Clarivate Plc (CLVT), an information services provider in the Americas, the Middle East, Africa, Europe, and the Asia Pacific that operates through three segments: Academia & Government, Life Sciences & Healthcare, and Intellectual Property Leslie's, Inc. (LESL), a company that operates as a direct-to-consumer pool and spa care brand in the United States that markets and sells pool and spa supplies and related products and services Avantor, Inc. (AVTR), a provider of mission-critical products and services to customers in the biopharma, healthcare, education and government, advanced technologies, and applied materials industries in the Americas, Europe, Asia, the Middle East, and Africa
|
|
| Average Annual Return [Table Text Block] |
AVERAGE ANNUAL TOTAL RETURNS Institutional | 1 Year | 5 Year | Since Inception |
|---|
Clarkston Partners Fund - Institutional Class (Incept. September 15, 2015) | -5.74% | 11.09% | 7.47% |
|---|
Russell 3000® Index | 7.22% | 18.18% | 12.87% |
|---|
Russell 2500™ Index | -3.11% | 14.91% | 8.52% |
|---|
|
|
| Performance Inception Date |
|
Sep. 15, 2015
|
| AssetsNet |
$ 1,049,289,614
|
$ 1,049,289,614
|
| Holdings Count | Holding |
24
|
24
|
| InvestmentCompanyPortfolioTurnover |
12.00%
|
|
| Additional Fund Statistics [Text Block] |
- Total Net Assets$1,049,289,614
- # of Portfolio Holdings (excluding cash)24
- Portfolio Turnover Rate12%
|
|
| Holdings [Text Block] |
SECTOR WEIGHTINGS (as a % of Net Assets)Value | Value |
|---|
Cash, Cash Equivalents,
& Other Net Assets | 7.83% | Telecommunications | 3.04% | Consumer Discretionary | 7.43% | Technology | 7.68% | Health Care | 10.79% | Industrials | 13.94% | Financials | 17.66% | Consumer Staples | 31.63% |
|
|
| Material Fund Change [Text Block] |
There have been no material Fund changes during the reporting period. |
|