Shareholder Report
|
12 Months Ended |
|
Mar. 31, 2025
USD ($)
Holding
|
|---|
| Shareholder Report [Line Items] |
|
| Document Type |
N-CSR
|
| Amendment Flag |
false
|
| Registrant Name |
WisdomTree Trust
|
| Entity Central Index Key |
0001350487
|
| Entity Investment Company Type |
N-1A
|
| Document Period End Date |
Mar. 31, 2025
|
| C000069425 |
|
| Shareholder Report [Line Items] |
|
| Fund Name |
WisdomTree Europe Hedged Equity Fund
|
| Trading Symbol |
HEDJ
|
| Annual or Semi-Annual Statement [Text Block] |
This annual shareholder report contains important information about the WisdomTree Europe Hedged Equity Fund (the "Fund") for the period of April 1, 2024 to March 31, 2025.
|
| Shareholder Report Annual or Semi-Annual |
Annual Shareholder Report
|
| Additional Information [Text Block] |
You can find additional information about the Fund at www.wisdomtree.com/investments/regulatory. You can also request this information by contacting us at 1-866-909-WISE (9473).
|
| Additional Information Phone Number |
1-866-909-WISE (9473)
|
| Additional Information Website |
<span style="box-sizing: border-box; color: rgb(0, 0, 0); display: inline; flex-wrap: nowrap; font-size: 10.6667px; font-weight: 400; grid-area: auto; line-height: 10.6667px; margin: 0px; overflow: visible; text-align: left; white-space-collapse: preserve-breaks;">www.wisdomtree.com/investments/regulatory</span>
|
| Expenses [Text Block] |
What were the Fund's costs for the last year?(based on a hypothetical $10,000 investment) Fund Name | Costs of a $10,000 investment | Costs paid as a percentage of a $10,000 investment |
|---|
WisdomTree Europe Hedged Equity Fund | $60 | 0.60% |
|---|
|
| Expenses Paid, Amount |
$ 60
|
| Expense Ratio, Percent |
0.60%
|
| Factors Affecting Performance [Text Block] |
How did the Fund perform last year and what affected its performance?The Fund returned 0.98% at net asset value (NAV) for the fiscal year ended March 31, 2025, underperforming the Fund's primary comparative benchmark, the MSCI EMU Local Currency Index, which returned 6.79% in local currency terms during the same period. The following summarizes the key factors that affected Fund performance during the period: The Fund benefited from its exposures to Information Technology and Communication Services, primarily due to strong allocation and stock selection effects in each. Energy also contributed positively to performance, driven by strong allocation effects. Consumer Discretionary and Financials detracted significantly from performance due to poor stock selection and allocation effects in each. The Fund benefited from its exposure to Spain, primarily due to strong allocation effects. Finland also contributed modestly to performance, driven by positive stock selection effects. Italy and France detracted significantly from performance due to poor stock selection effects. The Fund’s currency hedge was also additive, as positive carry effects from hedging the Euro offset the slight headwind from it strengthening slightly versus the dollar.
|
| Performance Past Does Not Indicate Future [Text] |
The Fund's past performance is not a good predictor of future results. The performance shown in the following graph and table do not reflect the deduction of taxes that a shareholder would pay on Fund distributions or on the redemption of Fund shares. For the most recent performance information visit
|
| Line Graph [Table Text Block] |
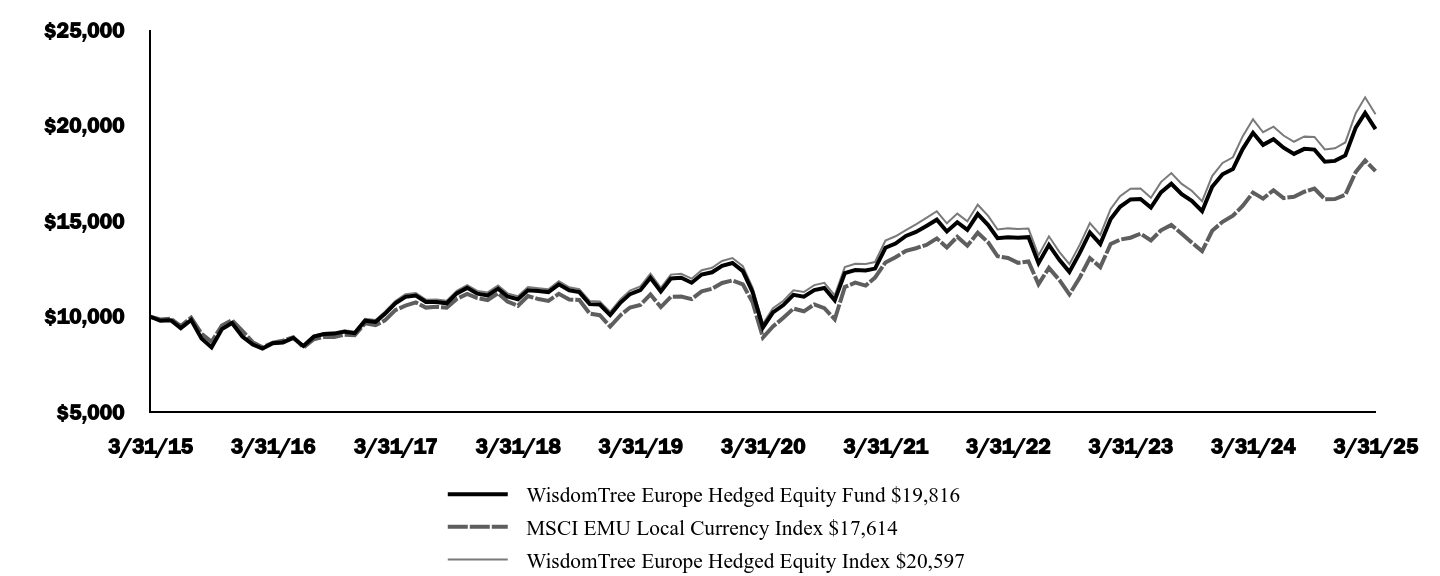 | WisdomTree Europe Hedged Equity Fund $19,816 | MSCI EMU Local Currency Index $17,614 | WisdomTree Europe Hedged Equity Index $20,597
|
|---|
3/31/15 | $10,000 | $10,000 | $10,000 |
|---|
4/30/15 | $9,785 | $9,855 | $9,785 |
|---|
5/31/15 | $9,814 | $9,897 | $9,810 |
|---|
6/30/15 | $9,403 | $9,507 | $9,406 |
|---|
7/31/15 | $9,829 | $9,953 | $9,840 |
|---|
8/31/15 | $8,864 | $9,114 | $8,880 |
|---|
9/30/15 | $8,393 | $8,692 | $8,409 |
|---|
10/31/15 | $9,354 | $9,535 | $9,378 |
|---|
11/30/15 | $9,675 | $9,816 | $9,704 |
|---|
12/31/15 | $8,958 | $9,254 | $8,989 |
|---|
1/31/16 | $8,544 | $8,669 | $8,574 |
|---|
2/29/16 | $8,337 | $8,406 | $8,369 |
|---|
3/31/16 | $8,615 | $8,639 | $8,655 |
|---|
4/30/16 | $8,655 | $8,743 | $8,695 |
|---|
5/31/16 | $8,888 | $8,930 | $8,926 |
|---|
6/30/16 | $8,469 | $8,393 | $8,507 |
|---|
7/31/16 | $8,958 | $8,822 | $9,008 |
|---|
8/31/16 | $9,093 | $8,941 | $9,155 |
|---|
9/30/16 | $9,117 | $8,943 | $9,177 |
|---|
10/31/16 | $9,219 | $9,059 | $9,287 |
|---|
11/30/16 | $9,142 | $9,028 | $9,217 |
|---|
12/31/16 | $9,791 | $9,655 | $9,887 |
|---|
1/31/17 | $9,725 | $9,561 | $9,832 |
|---|
2/28/17 | $10,152 | $9,812 | $10,266 |
|---|
3/31/17 | $10,700 | $10,343 | $10,824 |
|---|
4/30/17 | $11,042 | $10,580 | $11,181 |
|---|
5/31/17 | $11,110 | $10,749 | $11,237 |
|---|
6/30/17 | $10,769 | $10,478 | $10,894 |
|---|
7/31/17 | $10,769 | $10,516 | $10,902 |
|---|
8/31/17 | $10,703 | $10,468 | $10,838 |
|---|
9/30/17 | $11,220 | $10,932 | $11,361 |
|---|
10/31/17 | $11,510 | $11,196 | $11,656 |
|---|
11/30/17 | $11,208 | $10,970 | $11,352 |
|---|
12/31/17 | $11,118 | $10,874 | $11,270 |
|---|
1/31/18 | $11,470 | $11,223 | $11,632 |
|---|
2/28/18 | $11,056 | $10,798 | $11,221 |
|---|
3/31/18 | $10,917 | $10,572 | $11,078 |
|---|
4/30/18 | $11,384 | $11,085 | $11,548 |
|---|
5/31/18 | $11,344 | $10,923 | $11,493 |
|---|
6/30/18 | $11,290 | $10,827 | $11,440 |
|---|
7/31/18 | $11,693 | $11,202 | $11,860 |
|---|
8/31/18 | $11,386 | $10,904 | $11,541 |
|---|
9/30/18 | $11,288 | $10,873 | $11,437 |
|---|
10/31/18 | $10,668 | $10,169 | $10,825 |
|---|
11/30/18 | $10,641 | $10,082 | $10,802 |
|---|
12/31/18 | $10,088 | $9,488 | $10,249 |
|---|
1/31/19 | $10,741 | $10,085 | $10,913 |
|---|
2/28/19 | $11,183 | $10,481 | $11,368 |
|---|
3/31/19 | $11,390 | $10,618 | $11,586 |
|---|
4/30/19 | $12,038 | $11,164 | $12,252 |
|---|
5/31/19 | $11,324 | $10,506 | $11,506 |
|---|
6/30/19 | $12,000 | $11,045 | $12,203 |
|---|
7/31/19 | $12,036 | $11,058 | $12,245 |
|---|
8/31/19 | $11,780 | $10,921 | $11,990 |
|---|
9/30/19 | $12,209 | $11,326 | $12,436 |
|---|
10/31/19 | $12,325 | $11,465 | $12,559 |
|---|
11/30/19 | $12,668 | $11,767 | $12,919 |
|---|
12/31/19 | $12,811 | $11,902 | $13,072 |
|---|
1/31/20 | $12,388 | $11,695 | $12,645 |
|---|
2/29/20 | $11,292 | $10,767 | $11,526 |
|---|
3/31/20 | $9,438 | $8,914 | $9,630 |
|---|
4/30/20 | $10,228 | $9,493 | $10,446 |
|---|
5/31/20 | $10,610 | $9,943 | $10,839 |
|---|
6/30/20 | $11,143 | $10,430 | $11,382 |
|---|
7/31/20 | $11,049 | $10,284 | $11,295 |
|---|
8/31/20 | $11,395 | $10,646 | $11,656 |
|---|
9/30/20 | $11,505 | $10,451 | $11,772 |
|---|
10/31/20 | $10,858 | $9,867 | $11,119 |
|---|
11/30/20 | $12,280 | $11,555 | $12,597 |
|---|
12/31/20 | $12,440 | $11,783 | $12,768 |
|---|
1/31/21 | $12,421 | $11,627 | $12,756 |
|---|
2/28/21 | $12,518 | $12,045 | $12,861 |
|---|
3/31/21 | $13,609 | $12,838 | $13,986 |
|---|
4/30/21 | $13,830 | $13,115 | $14,209 |
|---|
5/31/21 | $14,226 | $13,442 | $14,535 |
|---|
6/30/21 | $14,434 | $13,582 | $14,835 |
|---|
7/31/21 | $14,749 | $13,761 | $15,171 |
|---|
8/31/21 | $15,077 | $14,099 | $15,518 |
|---|
9/30/21 | $14,461 | $13,623 | $14,888 |
|---|
10/31/21 | $14,944 | $14,182 | $15,394 |
|---|
11/30/21 | $14,547 | $13,715 | $14,995 |
|---|
12/31/21 | $15,372 | $14,392 | $15,859 |
|---|
1/31/22 | $14,796 | $13,890 | $15,273 |
|---|
2/28/22 | $14,106 | $13,163 | $14,563 |
|---|
3/31/22 | $14,159 | $13,071 | $14,622 |
|---|
4/30/22 | $14,126 | $12,816 | $14,589 |
|---|
5/31/22 | $14,163 | $12,889 | $14,612 |
|---|
6/30/22 | $12,804 | $11,702 | $13,209 |
|---|
7/31/22 | $13,759 | $12,556 | $14,207 |
|---|
8/31/22 | $12,978 | $11,924 | $13,390 |
|---|
9/30/22 | $12,347 | $11,170 | $12,745 |
|---|
10/31/22 | $13,338 | $12,054 | $13,773 |
|---|
11/30/22 | $14,411 | $13,063 | $14,898 |
|---|
12/31/22 | $13,807 | $12,595 | $14,277 |
|---|
1/31/23 | $15,117 | $13,808 | $15,642 |
|---|
2/28/23 | $15,752 | $14,034 | $16,307 |
|---|
3/31/23 | $16,134 | $14,134 | $16,698 |
|---|
4/30/23 | $16,163 | $14,344 | $16,708 |
|---|
5/31/23 | $15,713 | $13,989 | $16,224 |
|---|
6/30/23 | $16,504 | $14,522 | $17,043 |
|---|
7/31/23 | $16,954 | $14,801 | $17,515 |
|---|
8/31/23 | $16,411 | $14,344 | $16,947 |
|---|
9/30/23 | $16,060 | $13,883 | $16,589 |
|---|
10/31/23 | $15,524 | $13,430 | $16,042 |
|---|
11/30/23 | $16,803 | $14,495 | $17,357 |
|---|
12/31/23 | $17,451 | $14,963 | $18,045 |
|---|
1/31/24 | $17,728 | $15,286 | $18,342 |
|---|
2/29/24 | $18,772 | $15,792 | $19,435 |
|---|
3/31/24 | $19,623 | $16,494 | $20,329 |
|---|
4/30/24 | $18,992 | $16,177 | $19,651 |
|---|
5/31/24 | $19,285 | $16,619 | $19,940 |
|---|
6/30/24 | $18,842 | $16,206 | $19,480 |
|---|
7/31/24 | $18,520 | $16,275 | $19,154 |
|---|
8/31/24 | $18,783 | $16,539 | $19,434 |
|---|
9/30/24 | $18,742 | $16,708 | $19,404 |
|---|
10/31/24 | $18,107 | $16,149 | $18,754 |
|---|
11/30/24 | $18,153 | $16,155 | $18,811 |
|---|
12/31/24 | $18,437 | $16,376 | $19,117 |
|---|
1/31/25 | $19,892 | $17,566 | $20,647 |
|---|
2/28/25 | $20,657 | $18,173 | $21,477 |
|---|
3/31/25 | $19,816 | $17,614 | $20,597 |
|---|
|
| Average Annual Return [Table Text Block] |
| 1 Year | 5 Years | 10 Years |
|---|
Fund NAV Returns | 0.98% | 15.99% | 7.08% |
|---|
MSCI EMU Local Currency Index | 6.79% | 14.59% | 5.82% |
|---|
WisdomTree Europe Hedged Equity Index | 1.32% | 16.42% | 7.49% |
|---|
|
| AssetsNet |
$ 1,670,778,441
|
| Holdings Count | Holding |
132
|
| Advisory Fees Paid, Amount |
$ 9,729,820
|
| InvestmentCompanyPortfolioTurnover |
35.00%
|
| Additional Fund Statistics [Text Block] |
- Total Net Assets$1,670,778,441
- # of Portfolio Holdings132
- Portfolio Turnover Rate35%
- Investment Advisory Fees Paid$9,729,820
|
| Holdings [Text Block] |
Sector Breakdown (% of Net Assets)Industrials | 22.8% |
|---|
Financials | 20.4% |
|---|
Consumer Staples | 11.9% |
|---|
Consumer Discretionary | 11.4% |
|---|
Information Technology | 8.3% |
|---|
Materials | 7.9% |
|---|
Health Care | 7.7% |
|---|
Communication Services | 7.3% |
|---|
Energy | 2.0% |
|---|
Other Sectors | 0.0%Footnote Reference* |
|---|
Other Assets and Liabilities (Net) | 0.3% |
|---|
Total | 100.0% |
|---|
| Footnote | Description | Footnote* | Represents less than 0.1% |
|
| Largest Holdings [Text Block] |
Top 10 Holdings (% of Net Assets)Banco Bilbao Vizcaya Argentaria SA | 7.1% |
|---|
Deutsche Telekom AG | 5.8% |
|---|
Banco Santander SA | 4.5% |
|---|
LVMH Moet Hennessy Louis Vuitton SE | 4.4% |
|---|
Siemens AG | 4.3% |
|---|
Sanofi SA | 4.2% |
|---|
Muenchener Rueckversicherungs-Gesellschaft AG in Muenchen | 3.8% |
|---|
SAP SE | 3.0% |
|---|
L'Oreal SA | 2.7% |
|---|
ASML Holding NV | 2.5% |
|---|
|
| Material Fund Change [Text Block] |
|
| Updated Prospectus Phone Number |
1-866-909-WISE (9473)
|
| Updated Prospectus Web Address |
<span style="box-sizing: border-box; color: rgb(0, 0, 0); display: inline; flex-wrap: nowrap; font-size: 10.6667px; font-weight: 400; grid-area: auto; line-height: 10.6667px; margin: 0px; overflow: visible; text-align: left; white-space-collapse: preserve-breaks;">www.wisdomtree.com/investments/regulatory</span>
|
| C000151994 |
|
| Shareholder Report [Line Items] |
|
| Fund Name |
WisdomTree Europe Hedged SmallCap Equity Fund
|
| Trading Symbol |
EUSC
|
| Annual or Semi-Annual Statement [Text Block] |
This annual shareholder report contains important information about the WisdomTree Europe Hedged SmallCap Equity Fund (the "Fund") for the period of April 1, 2024 to March 31, 2025.
|
| Shareholder Report Annual or Semi-Annual |
Annual Shareholder Report
|
| Additional Information [Text Block] |
You can find additional information about the Fund at www.wisdomtree.com/investments/regulatory. You can also request this information by contacting us at 1-866-909-WISE (9473).
|
| Additional Information Phone Number |
1-866-909-WISE (9473)
|
| Additional Information Website |
<span style="box-sizing: border-box; color: rgb(0, 0, 0); display: inline; flex-wrap: nowrap; font-size: 10.6667px; font-weight: 400; grid-area: auto; line-height: 10.6667px; margin: 0px; overflow: visible; text-align: left; white-space-collapse: preserve-breaks;">www.wisdomtree.com/investments/regulatory</span>
|
| Expenses [Text Block] |
What were the Fund's costs for the last year?(based on a hypothetical $10,000 investment) Fund Name | Costs of a $10,000 investment | Costs paid as a percentage of a $10,000 investment |
|---|
WisdomTree Europe Hedged SmallCap Equity Fund | $87 | 0.81% |
|---|
|
| Expenses Paid, Amount |
$ 87
|
| Expense Ratio, Percent |
0.81%
|
| Factors Affecting Performance [Text Block] |
How did the Fund perform last year and what affected its performance?The Fund returned 13.80% at net asset value (NAV) for the fiscal year ended March 31, 2025, outperforming the Fund's primary comparative benchmark, the MSCI EMU Small Cap Local Currency Index, which returned 3.34% in local currency terms during the same period. The following summarizes the key factors that affected Fund performance during the period: The Fund benefited significantly from its exposures to Financials, driven by a mix of strong allocation and stock selection effects. Industrials were also additive due to strong stock selection impacts. Health Care and Utilities also contributed positively to performance, supported by favorable allocation and selection effects. Materials and Consumer Discretionary detracted from performance due to poor stock selection effects. The Fund benefited meaningfully from its exposures to Italy and Germany, each driven by a mix of strong allocation and stock selection effects. Finland and France also contributed positively to performance, primarily due to strong stock selection effects. Netherlands and Belgium detracted from performance due to poor stock selection effects. The Fund’s currency hedge detracted slightly from performance as the Euro strengthened slightly versus the dollar.
|
| Performance Past Does Not Indicate Future [Text] |
The Fund's past performance is not a good predictor of future results. The performance shown in the following graph and table do not reflect the deduction of taxes that a shareholder would pay on Fund distributions or on the redemption of Fund shares. For the most recent performance information visit
|
| Line Graph [Table Text Block] |
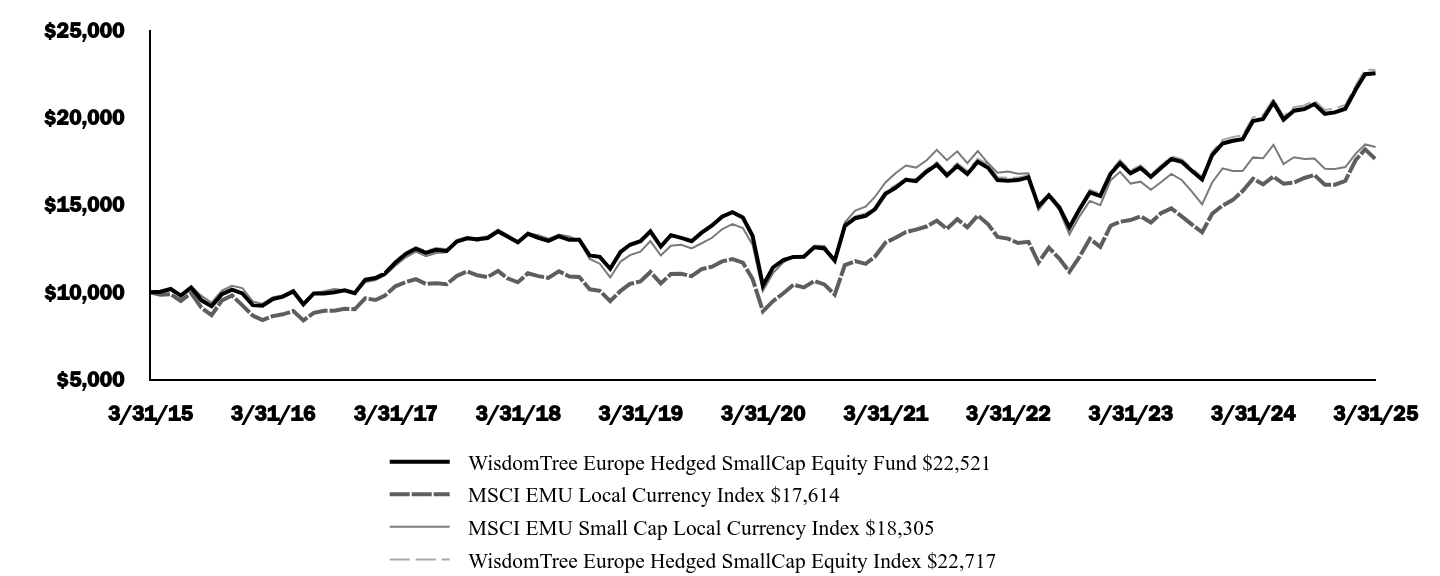 | WisdomTree Europe Hedged SmallCap Equity Fund | MSCI EMU Local Currency Index | MSCI EMU Small Cap Local Currency Index
| WisdomTree Europe Hedged SmallCap Equity Index
|
|---|
3/31/15 | $10,000 | $10,000 | $10,000 | $10,000 |
|---|
4/30/15 | $10,035 | $9,855 | $10,020 | $10,044 |
|---|
5/31/15 | $10,189 | $9,897 | $10,188 | $10,186 |
|---|
6/30/15 | $9,814 | $9,507 | $9,820 | $9,814 |
|---|
7/31/15 | $10,272 | $9,953 | $10,342 | $10,266 |
|---|
8/31/15 | $9,540 | $9,114 | $9,795 | $9,534 |
|---|
9/30/15 | $9,209 | $8,692 | $9,403 | $9,194 |
|---|
10/31/15 | $9,893 | $9,535 | $10,093 | $9,883 |
|---|
11/30/15 | $10,153 | $9,816 | $10,375 | $10,141 |
|---|
12/31/15 | $9,935 | $9,254 | $10,241 | $9,940 |
|---|
1/31/16 | $9,267 | $8,669 | $9,480 | $9,269 |
|---|
2/29/16 | $9,231 | $8,406 | $9,340 | $9,235 |
|---|
3/31/16 | $9,617 | $8,639 | $9,718 | $9,629 |
|---|
4/30/16 | $9,754 | $8,743 | $9,825 | $9,761 |
|---|
5/31/16 | $10,052 | $8,930 | $10,136 | $10,053 |
|---|
6/30/16 | $9,313 | $8,393 | $9,383 | $9,301 |
|---|
7/31/16 | $9,936 | $8,822 | $9,951 | $9,939 |
|---|
8/31/16 | $9,936 | $8,941 | $10,061 | $9,951 |
|---|
9/30/16 | $10,006 | $8,943 | $10,182 | $10,016 |
|---|
10/31/16 | $10,112 | $9,059 | $10,105 | $10,146 |
|---|
11/30/16 | $9,948 | $9,028 | $9,941 | $9,996 |
|---|
12/31/16 | $10,717 | $9,655 | $10,571 | $10,780 |
|---|
1/31/17 | $10,816 | $9,561 | $10,694 | $10,882 |
|---|
2/28/17 | $11,076 | $9,812 | $10,985 | $11,167 |
|---|
3/31/17 | $11,696 | $10,343 | $11,525 | $11,793 |
|---|
4/30/17 | $12,176 | $10,580 | $11,989 | $12,275 |
|---|
5/31/17 | $12,499 | $10,749 | $12,331 | $12,587 |
|---|
6/30/17 | $12,261 | $10,478 | $12,059 | $12,361 |
|---|
7/31/17 | $12,429 | $10,516 | $12,248 | $12,542 |
|---|
8/31/17 | $12,366 | $10,468 | $12,291 | $12,462 |
|---|
9/30/17 | $12,898 | $10,932 | $12,891 | $12,993 |
|---|
10/31/17 | $13,087 | $11,196 | $13,089 | $13,170 |
|---|
11/30/17 | $13,028 | $10,970 | $12,932 | $13,102 |
|---|
12/31/17 | $13,108 | $10,874 | $13,140 | $13,209 |
|---|
1/31/18 | $13,482 | $11,223 | $13,594 | $13,577 |
|---|
2/28/18 | $13,192 | $10,798 | $13,209 | $13,300 |
|---|
3/31/18 | $12,852 | $10,572 | $12,937 | $12,917 |
|---|
4/30/18 | $13,347 | $11,085 | $13,384 | $13,425 |
|---|
5/31/18 | $13,108 | $10,923 | $13,266 | $13,154 |
|---|
6/30/18 | $12,939 | $10,827 | $13,059 | $12,979 |
|---|
7/31/18 | $13,204 | $11,202 | $13,297 | $13,270 |
|---|
8/31/18 | $12,999 | $10,904 | $13,194 | $13,047 |
|---|
9/30/18 | $13,007 | $10,873 | $12,941 | $13,042 |
|---|
10/31/18 | $12,104 | $10,169 | $11,911 | $12,120 |
|---|
11/30/18 | $12,027 | $10,082 | $11,635 | $12,054 |
|---|
12/31/18 | $11,350 | $9,488 | $10,848 | $11,369 |
|---|
1/31/19 | $12,313 | $10,085 | $11,758 | $12,335 |
|---|
2/28/19 | $12,720 | $10,481 | $12,126 | $12,746 |
|---|
3/31/19 | $12,922 | $10,618 | $12,319 | $12,951 |
|---|
4/30/19 | $13,491 | $11,164 | $12,931 | $13,518 |
|---|
5/31/19 | $12,618 | $10,506 | $12,101 | $12,615 |
|---|
6/30/19 | $13,269 | $11,045 | $12,666 | $13,278 |
|---|
7/31/19 | $13,111 | $11,058 | $12,722 | $13,122 |
|---|
8/31/19 | $12,922 | $10,921 | $12,507 | $12,937 |
|---|
9/30/19 | $13,410 | $11,326 | $12,805 | $13,433 |
|---|
10/31/19 | $13,824 | $11,465 | $13,118 | $13,860 |
|---|
11/30/19 | $14,327 | $11,767 | $13,603 | $14,375 |
|---|
12/31/19 | $14,579 | $11,902 | $13,907 | $14,617 |
|---|
1/31/20 | $14,278 | $11,695 | $13,671 | $14,323 |
|---|
2/29/20 | $13,233 | $10,767 | $12,725 | $13,276 |
|---|
3/31/20 | $10,386 | $8,914 | $10,077 | $10,417 |
|---|
4/30/20 | $11,419 | $9,493 | $11,095 | $11,468 |
|---|
5/31/20 | $11,849 | $9,943 | $11,714 | $11,898 |
|---|
6/30/20 | $12,022 | $10,430 | $12,059 | $12,064 |
|---|
7/31/20 | $12,035 | $10,284 | $12,105 | $12,095 |
|---|
8/31/20 | $12,570 | $10,646 | $12,657 | $12,635 |
|---|
9/30/20 | $12,506 | $10,451 | $12,648 | $12,569 |
|---|
10/31/20 | $11,811 | $9,867 | $11,829 | $11,874 |
|---|
11/30/20 | $13,795 | $11,555 | $13,987 | $13,903 |
|---|
12/31/20 | $14,238 | $11,783 | $14,670 | $14,354 |
|---|
1/31/21 | $14,376 | $11,627 | $14,895 | $14,508 |
|---|
2/28/21 | $14,753 | $12,045 | $15,466 | $14,887 |
|---|
3/31/21 | $15,630 | $12,838 | $16,281 | $15,769 |
|---|
4/30/21 | $15,976 | $13,115 | $16,806 | $16,119 |
|---|
5/31/21 | $16,436 | $13,442 | $17,251 | $16,513 |
|---|
6/30/21 | $16,359 | $13,582 | $17,133 | $16,483 |
|---|
7/31/21 | $16,888 | $13,761 | $17,534 | $17,022 |
|---|
8/31/21 | $17,300 | $14,099 | $18,148 | $17,441 |
|---|
9/30/21 | $16,685 | $13,623 | $17,554 | $16,831 |
|---|
10/31/21 | $17,225 | $14,182 | $18,064 | $17,386 |
|---|
11/30/21 | $16,765 | $13,715 | $17,387 | $16,937 |
|---|
12/31/21 | $17,462 | $14,392 | $18,082 | $17,649 |
|---|
1/31/22 | $17,118 | $13,890 | $17,377 | $17,309 |
|---|
2/28/22 | $16,416 | $13,163 | $16,837 | $16,581 |
|---|
3/31/22 | $16,385 | $13,071 | $16,913 | $16,544 |
|---|
4/30/22 | $16,418 | $12,816 | $16,783 | $16,570 |
|---|
5/31/22 | $16,569 | $12,889 | $16,813 | $16,689 |
|---|
6/30/22 | $14,929 | $11,702 | $14,698 | $15,026 |
|---|
7/31/22 | $15,542 | $12,556 | $15,467 | $15,650 |
|---|
8/31/22 | $14,861 | $11,924 | $14,699 | $14,970 |
|---|
9/30/22 | $13,710 | $11,170 | $13,303 | $13,804 |
|---|
10/31/22 | $14,777 | $12,054 | $14,373 | $14,892 |
|---|
11/30/22 | $15,716 | $13,063 | $15,229 | $15,861 |
|---|
12/31/22 | $15,510 | $12,595 | $14,985 | $15,654 |
|---|
1/31/23 | $16,787 | $13,808 | $16,411 | $16,956 |
|---|
2/28/23 | $17,383 | $14,034 | $16,889 | $17,561 |
|---|
3/31/23 | $16,805 | $14,134 | $16,217 | $16,958 |
|---|
4/30/23 | $17,114 | $14,344 | $16,326 | $17,272 |
|---|
5/31/23 | $16,606 | $13,989 | $15,864 | $16,733 |
|---|
6/30/23 | $17,113 | $14,522 | $16,290 | $17,249 |
|---|
7/31/23 | $17,624 | $14,801 | $16,773 | $17,773 |
|---|
8/31/23 | $17,461 | $14,344 | $16,422 | $17,613 |
|---|
9/30/23 | $16,952 | $13,883 | $15,770 | $17,093 |
|---|
10/31/23 | $16,454 | $13,430 | $15,026 | $16,601 |
|---|
11/30/23 | $17,846 | $14,495 | $16,280 | $18,030 |
|---|
12/31/23 | $18,508 | $14,963 | $17,087 | $18,714 |
|---|
1/31/24 | $18,668 | $15,286 | $16,937 | $18,879 |
|---|
2/29/24 | $18,761 | $15,792 | $16,931 | $18,981 |
|---|
3/31/24 | $19,790 | $16,494 | $17,714 | $20,014 |
|---|
4/30/24 | $19,914 | $16,177 | $17,663 | $20,140 |
|---|
5/31/24 | $20,854 | $16,619 | $18,429 | $21,061 |
|---|
6/30/24 | $19,878 | $16,206 | $17,336 | $20,065 |
|---|
7/31/24 | $20,386 | $16,275 | $17,725 | $20,583 |
|---|
8/31/24 | $20,482 | $16,539 | $17,621 | $20,687 |
|---|
9/30/24 | $20,766 | $16,708 | $17,648 | $20,982 |
|---|
10/31/24 | $20,207 | $16,149 | $17,068 | $20,425 |
|---|
11/30/24 | $20,287 | $16,155 | $17,048 | $20,515 |
|---|
12/31/24 | $20,496 | $16,376 | $17,163 | $20,709 |
|---|
1/31/25 | $21,596 | $17,566 | $17,934 | $21,839 |
|---|
2/28/25 | $22,471 | $18,173 | $18,456 | $22,733 |
|---|
3/31/25 | $22,521 | $17,614 | $18,305 | $22,717 |
|---|
|
| Average Annual Return [Table Text Block] |
| 1 Year | 5 Years | 10 Years |
|---|
Fund NAV Returns | 13.80% | 16.74% | 8.46% |
|---|
MSCI EMU Local Currency Index | 6.79% | 14.59% | 5.82% |
|---|
MSCI EMU Small Cap Local Currency Index | 3.34% | 12.68% | 6.23% |
|---|
WisdomTree Europe Hedged SmallCap Equity Index | 13.51% | 16.88% | 8.55% |
|---|
|
| AssetsNet |
$ 79,688,898
|
| Holdings Count | Holding |
262
|
| Advisory Fees Paid, Amount |
$ 284,309
|
| InvestmentCompanyPortfolioTurnover |
37.00%
|
| Additional Fund Statistics [Text Block] |
- Total Net Assets$79,688,898
- # of Portfolio Holdings262
- Portfolio Turnover Rate37%
- Investment Advisory Fees Paid$284,309
|
| Holdings [Text Block] |
Sector Breakdown (% of Net Assets)Financials | 28.2% |
|---|
Industrials | 19.1% |
|---|
Real Estate | 9.3% |
|---|
Materials | 9.0% |
|---|
Utilities | 8.3% |
|---|
Consumer Discretionary | 7.2% |
|---|
Communication Services | 6.2% |
|---|
Consumer Staples | 4.2% |
|---|
Information Technology | 3.2% |
|---|
Energy | 2.9% |
|---|
Other Sectors | 2.1% |
|---|
Other Assets and Liabilities (Net) | 0.3% |
|---|
Total | 100.0% |
|---|
|
| Largest Holdings [Text Block] |
Top 10 Holdings (% of Net Assets)Banco BPM SpA | 3.2% |
|---|
BPER Banca SpA | 2.4% |
|---|
Klepierre SA | 2.3% |
|---|
BAWAG Group AG | 2.3% |
|---|
Banca Mediolanum SpA | 2.0% |
|---|
Banca Monte dei Paschi di Siena SpA | 1.9% |
|---|
Bankinter SA | 1.9% |
|---|
Elisa OYJ | 1.7% |
|---|
Banca Popolare di Sondrio SpA | 1.7% |
|---|
Italgas SpA | 1.5% |
|---|
|
| Material Fund Change [Text Block] |
|
| Updated Prospectus Phone Number |
1-866-909-WISE (9473)
|
| Updated Prospectus Web Address |
<span style="box-sizing: border-box; color: rgb(0, 0, 0); display: inline; flex-wrap: nowrap; font-size: 10.6667px; font-weight: 400; grid-area: auto; line-height: 10.6667px; margin: 0px; overflow: visible; text-align: left; white-space-collapse: preserve-breaks;">www.wisdomtree.com/investments/regulatory</span>
|
| C000248668 |
|
| Shareholder Report [Line Items] |
|
| Fund Name |
WisdomTree India Hedged Equity Fund
|
| Trading Symbol |
INDH
|
| Annual or Semi-Annual Statement [Text Block] |
This annual shareholder report contains important information about the WisdomTree India Hedged Equity Fund (the "Fund") for the period of May 9, 2024 to March 31, 2025.
|
| Shareholder Report Annual or Semi-Annual |
Annual Shareholder Report
|
| Additional Information [Text Block] |
You can find additional information about the Fund at www.wisdomtree.com/investments/regulatory. You can also request this information by contacting us at 1-866-909-WISE (9473).
|
| Additional Information Phone Number |
1-866-909-WISE (9473)
|
| Additional Information Website |
<span style="box-sizing: border-box; color: rgb(0, 0, 0); display: inline; flex-wrap: nowrap; font-size: 10.6667px; font-weight: 400; grid-area: auto; line-height: 10.6667px; margin: 0px; overflow: visible; text-align: left; white-space-collapse: preserve-breaks;">www.wisdomtree.com/investments/regulatory</span>
|
| Expenses [Text Block] |
What were the Fund's costs for the last period?(based on a hypothetical $10,000 investment) Fund Name | Costs of a $10,000 investmentFootnote Reference* | Costs paid as a percentage of a $10,000 investment |
|---|
WisdomTree India Hedged Equity Fund | $58 | 0.64% |
|---|
| Footnote | Description | Footnote* | The Fund commenced operations on 5/09/24. Actual expenses are calculated using a 327/365 day period (to reflect the period since commencement of operations). The expenses for a full fiscal year period would be higher. |
|
| Expenses Paid, Amount |
$ 58
|
| Expense Ratio, Percent |
0.64%
|
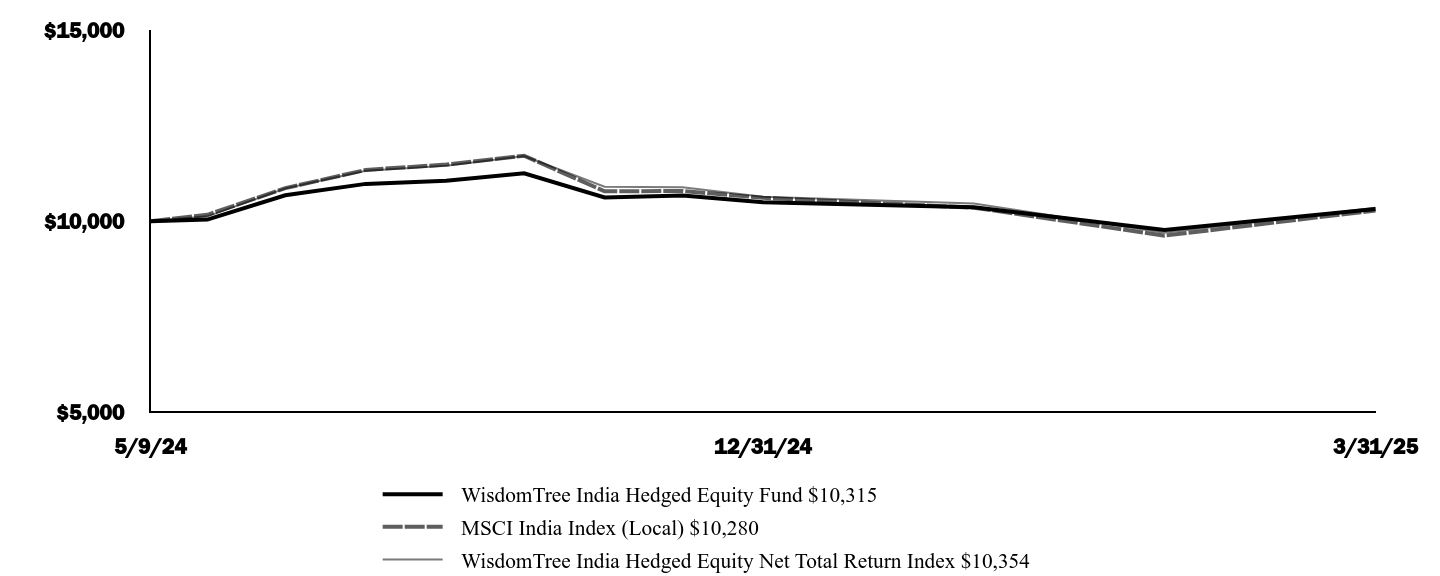
| Factors Affecting Performance [Text Block] |
How did the Fund perform the last period and what affected its performance?The Fund returned 3.15% at net asset value (NAV) for the fiscal period from May 9, 2024 (inception date) through March 31, 2025, outperforming the Fund's primary comparative benchmark, the MSCI India Index (Local), which returned 2.80% in during the same period. The following summarizes the key factors that affected Fund performance during the period: The Fund benefited modestly from its exposures to Consumer Discretionary and Utilities, each driven by strong stock selection impacts. Industrials aided due to strong stock selection and allocation effects. Information Technology was a modest headwind, primarily due to negative stock selection. The Fund’s currency hedge was also additive for performance, as the Indian rupee weakened versus the dollar. Positive carry effects from hedging were also beneficial.
|
| Performance Past Does Not Indicate Future [Text] |
The Fund's past performance is not a good predictor of future results. The performance shown in the following graph and table do not reflect the deduction of taxes that a shareholder would pay on Fund distributions or on the redemption of Fund shares. For the most recent performance information visit
|
| Line Graph [Table Text Block] |
| WisdomTree India Hedged Equity Fund $10,315 | MSCI India Index (Local) $10,280 | WisdomTree India Hedged Equity Net Total Return Index $10,354
|
|---|
5/9/24 | $10,000 | $10,000 | $10,000 |
|---|
5/31/24 | $10,042 | $10,167 | $10,126 |
|---|
6/30/24 | $10,678 | $10,863 | $10,858 |
|---|
7/31/24 | $10,975 | $11,341 | $11,316 |
|---|
8/31/24 | $11,058 | $11,480 | $11,452 |
|---|
9/30/24 | $11,252 | $11,712 | $11,704 |
|---|
10/31/24 | $10,621 | $10,781 | $10,902 |
|---|
11/30/24 | $10,671 | $10,789 | $10,888 |
|---|
12/31/24 | $10,495 | $10,611 | $10,641 |
|---|
1/31/25 | $10,365 | $10,353 | $10,462 |
|---|
2/28/25 | $9,767 | $9,621 | $9,694 |
|---|
3/31/25 | $10,315 | $10,280 | $10,354 |
|---|
|
| Average Annual Return [Table Text Block] |
| Since
Inception
5/9/24Footnote Reference* |
|---|
Fund NAV Returns | 3.15% |
|---|
MSCI India Index (Local) | 2.80% |
|---|
WisdomTree India Hedged Equity Net Total Return Index | 3.54% |
|---|
|
| AssetsNet |
$ 7,215,593
|
| Holdings Count | Holding |
76
|
| Advisory Fees Paid, Amount |
$ 181,453
|
| InvestmentCompanyPortfolioTurnover |
138.00%
|
| Additional Fund Statistics [Text Block] |
- Total Net Assets$7,215,593
- # of Portfolio Holdings76
- Portfolio Turnover Rate138%
- Investment Advisory Fees Paid$181,453
|
| Holdings [Text Block] |
Sector Breakdown (% of Net Assets)Financials | 26.1% |
|---|
Information Technology | 13.7% |
|---|
Consumer Discretionary | 12.1% |
|---|
Energy | 11.7% |
|---|
Materials | 8.0% |
|---|
Consumer Staples | 7.6% |
|---|
Industrials | 7.1% |
|---|
Health Care | 6.0% |
|---|
Communication Services | 5.1% |
|---|
Utilities | 4.5% |
|---|
Other Sectors | 0.4% |
|---|
Other Assets and Liabilities (Net) | (2.3)% |
|---|
Total | 100.0% |
|---|
|
| Largest Holdings [Text Block] |
Top 10 Holdings (% of Net Assets)HDFC Bank Ltd. | 9.5% |
|---|
Reliance Industries Ltd. | 9.0% |
|---|
ICICI Bank Ltd. | 7.4% |
|---|
Infosys Ltd. | 6.0% |
|---|
Bharti Airtel Ltd. | 4.5% |
|---|
Tata Consultancy Services Ltd. | 3.8% |
|---|
Mahindra & Mahindra Ltd. | 2.7% |
|---|
Kotak Mahindra Bank Ltd. | 2.5% |
|---|
Axis Bank Ltd. | 2.5% |
|---|
Larsen & Toubro Ltd. | 2.4% |
|---|
|
| Material Fund Change [Text Block] |
|
| Updated Prospectus Phone Number |
1-866-909-WISE (9473)
|
| Updated Prospectus Web Address |
<span style="box-sizing: border-box; color: rgb(0, 0, 0); display: inline; flex-wrap: nowrap; font-size: 10.6667px; font-weight: 400; grid-area: auto; line-height: 10.6667px; margin: 0px; overflow: visible; text-align: left; white-space-collapse: preserve-breaks;">www.wisdomtree.com/investments/regulatory</span>
|
| C000135785 |
|
| Shareholder Report [Line Items] |
|
| Fund Name |
WisdomTree International Hedged Quality Dividend Growth Fund
|
| Trading Symbol |
IHDG
|
| Annual or Semi-Annual Statement [Text Block] |
This annual shareholder report contains important information about the WisdomTree International Hedged Quality Dividend Growth Fund (the "Fund") for the period of April 1, 2024 to March 31, 2025.
|
| Shareholder Report Annual or Semi-Annual |
Annual Shareholder Report
|
| Additional Information [Text Block] |
You can find additional information about the Fund at www.wisdomtree.com/investments/regulatory. You can also request this information by contacting us at 1-866-909-WISE (9473).
|
| Additional Information Phone Number |
1-866-909-WISE (9473)
|
| Additional Information Website |
<span style="box-sizing: border-box; color: rgb(0, 0, 0); display: inline; flex-wrap: nowrap; font-size: 10.6667px; font-weight: 400; grid-area: auto; line-height: 10.6667px; margin: 0px; overflow: visible; text-align: left; white-space-collapse: preserve-breaks;">www.wisdomtree.com/investments/regulatory</span>
|
| Expenses [Text Block] |
What were the Fund's costs for the last year?(based on a hypothetical $10,000 investment) Fund Name | Costs of a $10,000 investment | Costs paid as a percentage of a $10,000 investment |
|---|
WisdomTree International Hedged Quality Dividend Growth Fund | $59 | 0.60% |
|---|
|
| Expenses Paid, Amount |
$ 59
|
| Expense Ratio, Percent |
0.60%
|
| Factors Affecting Performance [Text Block] |
How did the Fund perform last year and what affected its performance?The Fund returned -3.90% at net asset value (NAV) for the fiscal year ended March 31, 2025, underperforming the Fund's primary comparative benchmark, the MSCI EAFE Local Currency Index, which returned 4.13% in local currency terms during the same period. The following summarizes the key factors that affected Fund performance during the period: The Fund benefited from Energy and Consumer Staples exposures due to positive stock selection effects in each. However, the Fund’s poor performance during the period is most attributable to its large underweight to Financials. As an indirect byproduct of its quality dividend growth methodology, the Fund is routinely heavily underweight Financials versus the MSCI EAFE Local Currency Index. When Financials perform strongly, Fund performance usually struggles. During the fiscal year, Financials were the best-performing sector in the benchmark. The Fund’s large underweight produced deeply negative allocation and selection effects, which explains half of the underperformance during the period. Materials and Information Technology also detracted from performance due to a mix of poor allocation and stock selection effects in each. Consumer Discretionary was also a laggard due to a large overweight during a period where it was one of the worst performers in the benchmark. At the country level, Japan and France detracted from performance due to poor stock selection effects in both. Australian and Swiss exposures were additive for performance, though their impact was negligible. The Fund’s currency-hedge was slightly additive during the fiscal year as developed market currencies exhibited mixed performance versus the dollar. The hedge also benefited from positive carry effects.
|
| Performance Past Does Not Indicate Future [Text] |
The Fund's past performance is not a good predictor of future results. The performance shown in the following graph and table do not reflect the deduction of taxes that a shareholder would pay on Fund distributions or on the redemption of Fund shares. For the most recent performance information visit
|
| Line Graph [Table Text Block] |
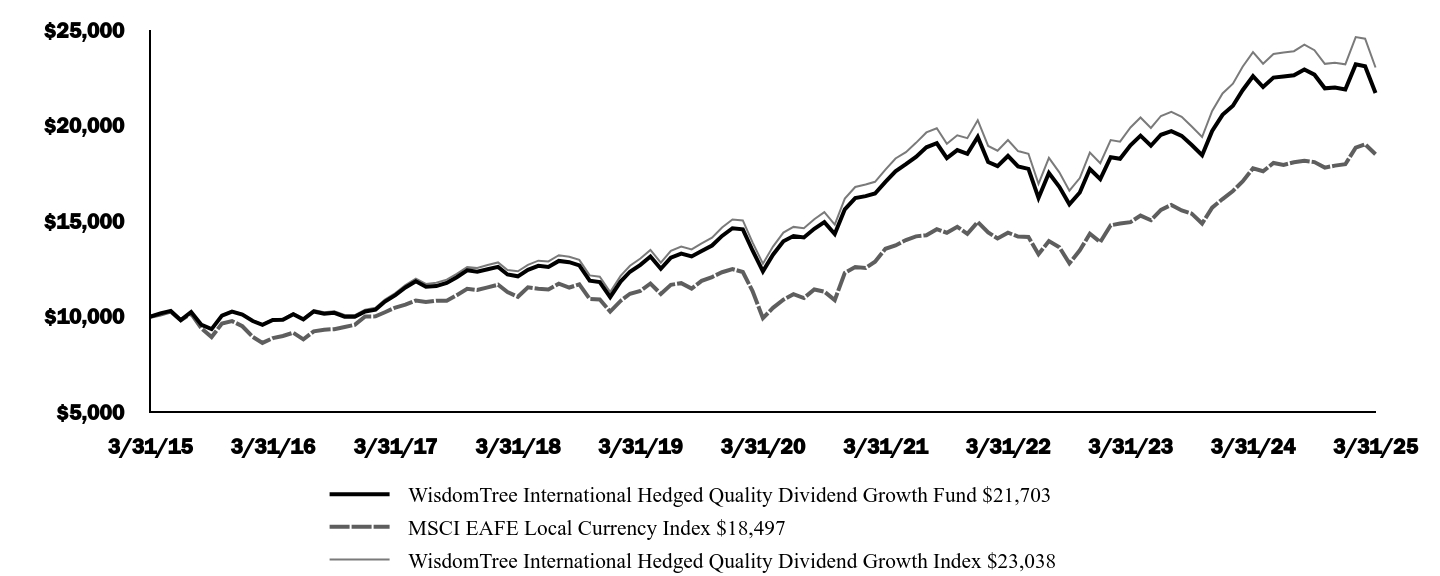 | WisdomTree International Hedged Quality Dividend Growth Fund | MSCI EAFE Local Currency Index | WisdomTree International Hedged Quality Dividend Growth Index
|
|---|
3/31/15 | $10,000 | $10,000 | $10,000 |
|---|
4/30/15 | $10,178 | $10,115 | $10,183 |
|---|
5/31/15 | $10,304 | $10,272 | $10,303 |
|---|
6/30/15 | $9,821 | $9,818 | $9,838 |
|---|
7/31/15 | $10,245 | $10,163 | $10,268 |
|---|
8/31/15 | $9,570 | $9,386 | $9,587 |
|---|
9/30/15 | $9,350 | $8,936 | $9,366 |
|---|
10/31/15 | $10,057 | $9,644 | $10,091 |
|---|
11/30/15 | $10,264 | $9,770 | $10,301 |
|---|
12/31/15 | $10,110 | $9,503 | $10,151 |
|---|
1/31/16 | $9,774 | $8,948 | $9,807 |
|---|
2/29/16 | $9,572 | $8,630 | $9,610 |
|---|
3/31/16 | $9,827 | $8,883 | $9,874 |
|---|
4/30/16 | $9,846 | $8,994 | $9,892 |
|---|
5/31/16 | $10,129 | $9,163 | $10,187 |
|---|
6/30/16 | $9,858 | $8,817 | $9,923 |
|---|
7/31/16 | $10,275 | $9,236 | $10,348 |
|---|
8/31/16 | $10,159 | $9,322 | $10,232 |
|---|
9/30/16 | $10,204 | $9,349 | $10,287 |
|---|
10/31/16 | $10,005 | $9,461 | $10,089 |
|---|
11/30/16 | $9,998 | $9,577 | $10,086 |
|---|
12/31/16 | $10,278 | $10,011 | $10,366 |
|---|
1/31/17 | $10,371 | $10,020 | $10,465 |
|---|
2/28/17 | $10,795 | $10,235 | $10,904 |
|---|
3/31/17 | $11,130 | $10,482 | $11,240 |
|---|
4/30/17 | $11,530 | $10,629 | $11,651 |
|---|
5/31/17 | $11,852 | $10,850 | $11,994 |
|---|
6/30/17 | $11,573 | $10,766 | $11,719 |
|---|
7/31/17 | $11,604 | $10,839 | $11,779 |
|---|
8/31/17 | $11,765 | $10,834 | $11,941 |
|---|
9/30/17 | $12,066 | $11,128 | $12,239 |
|---|
10/31/17 | $12,425 | $11,458 | $12,605 |
|---|
11/30/17 | $12,350 | $11,398 | $12,554 |
|---|
12/31/17 | $12,484 | $11,535 | $12,703 |
|---|
1/31/18 | $12,610 | $11,674 | $12,839 |
|---|
2/28/18 | $12,212 | $11,293 | $12,447 |
|---|
3/31/18 | $12,113 | $11,042 | $12,378 |
|---|
4/30/18 | $12,452 | $11,538 | $12,710 |
|---|
5/31/18 | $12,665 | $11,461 | $12,932 |
|---|
6/30/18 | $12,603 | $11,425 | $12,892 |
|---|
7/31/18 | $12,919 | $11,726 | $13,219 |
|---|
8/31/18 | $12,852 | $11,528 | $13,141 |
|---|
9/30/18 | $12,686 | $11,694 | $12,977 |
|---|
10/31/18 | $11,884 | $10,930 | $12,163 |
|---|
11/30/18 | $11,813 | $10,906 | $12,094 |
|---|
12/31/18 | $11,022 | $10,268 | $11,286 |
|---|
1/31/19 | $11,840 | $10,828 | $12,134 |
|---|
2/28/19 | $12,354 | $11,204 | $12,667 |
|---|
3/31/19 | $12,717 | $11,355 | $13,043 |
|---|
4/30/19 | $13,153 | $11,738 | $13,492 |
|---|
5/31/19 | $12,508 | $11,194 | $12,825 |
|---|
6/30/19 | $13,090 | $11,672 | $13,447 |
|---|
7/31/19 | $13,302 | $11,755 | $13,672 |
|---|
8/31/19 | $13,154 | $11,471 | $13,524 |
|---|
9/30/19 | $13,440 | $11,877 | $13,832 |
|---|
10/31/19 | $13,725 | $12,076 | $14,132 |
|---|
11/30/19 | $14,227 | $12,328 | $14,666 |
|---|
12/31/19 | $14,631 | $12,493 | $15,086 |
|---|
1/31/20 | $14,571 | $12,340 | $15,036 |
|---|
2/29/20 | $13,465 | $11,343 | $13,887 |
|---|
3/31/20 | $12,378 | $9,926 | $12,773 |
|---|
4/30/20 | $13,247 | $10,465 | $13,672 |
|---|
5/31/20 | $13,951 | $10,890 | $14,401 |
|---|
6/30/20 | $14,222 | $11,177 | $14,700 |
|---|
7/31/20 | $14,145 | $10,977 | $14,630 |
|---|
8/31/20 | $14,600 | $11,427 | $15,103 |
|---|
9/30/20 | $14,951 | $11,314 | $15,471 |
|---|
10/31/20 | $14,330 | $10,871 | $14,822 |
|---|
11/30/20 | $15,620 | $12,295 | $16,181 |
|---|
12/31/20 | $16,208 | $12,598 | $16,788 |
|---|
1/31/21 | $16,311 | $12,550 | $16,917 |
|---|
2/28/21 | $16,447 | $12,878 | $17,059 |
|---|
3/31/21 | $17,058 | $13,555 | $17,692 |
|---|
4/30/21 | $17,605 | $13,726 | $18,277 |
|---|
5/31/21 | $17,978 | $14,012 | $18,611 |
|---|
6/30/21 | $18,361 | $14,205 | $19,096 |
|---|
7/31/21 | $18,862 | $14,261 | $19,642 |
|---|
8/31/21 | $19,075 | $14,581 | $19,860 |
|---|
9/30/21 | $18,301 | $14,392 | $19,046 |
|---|
10/31/21 | $18,719 | $14,706 | $19,491 |
|---|
11/30/21 | $18,520 | $14,336 | $19,340 |
|---|
12/31/21 | $19,405 | $14,954 | $20,281 |
|---|
1/31/22 | $18,094 | $14,410 | $18,936 |
|---|
2/28/22 | $17,878 | $14,096 | $18,687 |
|---|
3/31/22 | $18,411 | $14,397 | $19,246 |
|---|
4/30/22 | $17,859 | $14,196 | $18,666 |
|---|
5/31/22 | $17,735 | $14,168 | $18,526 |
|---|
6/30/22 | $16,216 | $13,269 | $16,949 |
|---|
7/31/22 | $17,514 | $13,957 | $18,310 |
|---|
8/31/22 | $16,795 | $13,640 | $17,552 |
|---|
9/30/22 | $15,882 | $12,792 | $16,597 |
|---|
10/31/22 | $16,498 | $13,474 | $17,255 |
|---|
11/30/22 | $17,728 | $14,340 | $18,588 |
|---|
12/31/22 | $17,200 | $13,908 | $18,030 |
|---|
1/31/23 | $18,347 | $14,784 | $19,240 |
|---|
2/28/23 | $18,260 | $14,876 | $19,158 |
|---|
3/31/23 | $18,964 | $14,950 | $19,899 |
|---|
4/30/23 | $19,472 | $15,290 | $20,426 |
|---|
5/31/23 | $18,945 | $15,049 | $19,876 |
|---|
6/30/23 | $19,519 | $15,590 | $20,502 |
|---|
7/31/23 | $19,710 | $15,851 | $20,714 |
|---|
8/31/23 | $19,461 | $15,560 | $20,457 |
|---|
9/30/23 | $18,982 | $15,392 | $19,953 |
|---|
10/31/23 | $18,453 | $14,876 | $19,400 |
|---|
11/30/23 | $19,716 | $15,708 | $20,763 |
|---|
12/31/23 | $20,563 | $16,156 | $21,682 |
|---|
1/31/24 | $21,039 | $16,578 | $22,191 |
|---|
2/29/24 | $21,849 | $17,080 | $23,076 |
|---|
3/31/24 | $22,583 | $17,764 | $23,846 |
|---|
4/30/24 | $22,016 | $17,609 | $23,237 |
|---|
5/31/24 | $22,509 | $18,042 | $23,748 |
|---|
6/30/24 | $22,565 | $17,942 | $23,820 |
|---|
7/31/24 | $22,629 | $18,079 | $23,892 |
|---|
8/31/24 | $22,937 | $18,160 | $24,230 |
|---|
9/30/24 | $22,662 | $18,090 | $23,943 |
|---|
10/31/24 | $21,950 | $17,802 | $23,229 |
|---|
11/30/24 | $21,995 | $17,904 | $23,291 |
|---|
12/31/24 | $21,884 | $17,977 | $23,203 |
|---|
1/31/25 | $23,201 | $18,845 | $24,628 |
|---|
2/28/25 | $23,100 | $19,023 | $24,543 |
|---|
3/31/25 | $21,703 | $18,497 | $23,038 |
|---|
|
| Average Annual Return [Table Text Block] |
| 1 Year | 5 Years | 10 Years |
|---|
Fund NAV Returns | -3.90% | 11.89% | 8.06% |
|---|
MSCI EAFE Local Currency Index | 4.13% | 13.26% | 6.34% |
|---|
WisdomTree International Hedged Quality Dividend Growth Index | -3.39% | 12.52% | 8.70% |
|---|
|
| AssetsNet |
$ 2,835,291,554
|
| Holdings Count | Holding |
267
|
| Advisory Fees Paid, Amount |
$ 15,887,431
|
| InvestmentCompanyPortfolioTurnover |
52.00%
|
| Additional Fund Statistics [Text Block] |
- Total Net Assets$2,835,291,554
- # of Portfolio Holdings267
- Portfolio Turnover Rate52%
- Investment Advisory Fees Paid$15,887,431
|
| Holdings [Text Block] |
Sector Breakdown (% of Net Assets)Industrials | 21.5% |
|---|
Consumer Discretionary | 17.4% |
|---|
Information Technology | 15.2% |
|---|
Health Care | 15.0% |
|---|
Materials | 8.0% |
|---|
Energy | 6.7% |
|---|
Communication Services | 6.0% |
|---|
Consumer Staples | 5.0% |
|---|
Financials | 4.5% |
|---|
Utilities | 0.7% |
|---|
Other Sectors | 0.1% |
|---|
Other Assets and Liabilities (Net) | (0.1)% |
|---|
Total | 100.0% |
|---|
|
| Largest Holdings [Text Block] |
Top 10 Holdings (% of Net Assets)BP PLC | 5.7% |
|---|
Industria de Diseno Textil SA | 4.2% |
|---|
SAP SE | 3.9% |
|---|
GSK PLC | 3.8% |
|---|
Novo Nordisk AS | 3.1% |
|---|
Deutsche Post AG | 2.9% |
|---|
ASML Holding NV | 2.9% |
|---|
UBS Group AG | 2.6% |
|---|
Nintendo Co. Ltd. | 2.5% |
|---|
Hermes International SCA | 2.4% |
|---|
|
| Material Fund Change [Text Block] |
|
| Updated Prospectus Phone Number |
1-866-909-WISE (9473)
|
| Updated Prospectus Web Address |
<span style="box-sizing: border-box; color: rgb(0, 0, 0); display: inline; flex-wrap: nowrap; font-size: 10.6667px; font-weight: 400; grid-area: auto; line-height: 10.6667px; margin: 0px; overflow: visible; text-align: left; white-space-collapse: preserve-breaks;">www.wisdomtree.com/investments/regulatory</span>
|
| C000033618 |
|
| Shareholder Report [Line Items] |
|
| Fund Name |
WisdomTree Japan Hedged Equity Fund
|
| Trading Symbol |
DXJ
|
| Annual or Semi-Annual Statement [Text Block] |
This annual shareholder report contains important information about the WisdomTree Japan Hedged Equity Fund (the "Fund") for the period of April 1, 2024 to March 31, 2025.
|
| Shareholder Report Annual or Semi-Annual |
Annual Shareholder Report
|
| Additional Information [Text Block] |
You can find additional information about the Fund at www.wisdomtree.com/investments/regulatory. You can also request this information by contacting us at 1-866-909-WISE (9473).
|
| Additional Information Phone Number |
1-866-909-WISE (9473)
|
| Additional Information Website |
<span style="box-sizing: border-box; color: rgb(0, 0, 0); display: inline; flex-wrap: nowrap; font-size: 10.6667px; font-weight: 400; grid-area: auto; line-height: 10.6667px; margin: 0px; overflow: visible; text-align: left; white-space-collapse: preserve-breaks;">www.wisdomtree.com/investments/regulatory</span>
|
| Expenses [Text Block] |
What were the Fund's costs for the last year?(based on a hypothetical $10,000 investment) Fund Name | Costs of a $10,000 investment | Costs paid as a percentage of a $10,000 investment |
|---|
WisdomTree Japan Hedged Equity Fund | $49 | 0.48% |
|---|
|
| Expenses Paid, Amount |
$ 49
|
| Expense Ratio, Percent |
0.48%
|
| Factors Affecting Performance [Text Block] |
How did the Fund perform last year and what affected its performance?The Fund returned 3.55% at net asset value (NAV) for the fiscal year ended March 31, 2025, outperforming the Fund's primary comparative benchmark, the MSCI Japan Local Currency Index, which returned -3.27% in local currency terms during the same period. The following summarizes the key factors that affected Fund performance during the period: Information Technology was the most positive contributor during the period due to strong allocation and stock selection effects. The Fund also benefited from positions in the Health Care sector due to strong stock selection. Financials exposure was also additive due to positive allocation effects. The Fund was slightly overweight Financials when it was the second best-performing sector in the benchmark. No sectors detracted from performance during the period, but Materials was the least-positive contributor and exhibited negligible effects. The Fund’s currency hedge was also additive for performance overall. The yen slightly strengthened versus the dollar, which would normally challenge performance, but positive carry effects from the hedge outweighed the headwind.
|
| Performance Past Does Not Indicate Future [Text] |
The Fund's past performance is not a good predictor of future results. The performance shown in the following graph and table do not reflect the deduction of taxes that a shareholder would pay on Fund distributions or on the redemption of Fund shares. For the most recent performance information visit
|
| Line Graph [Table Text Block] |
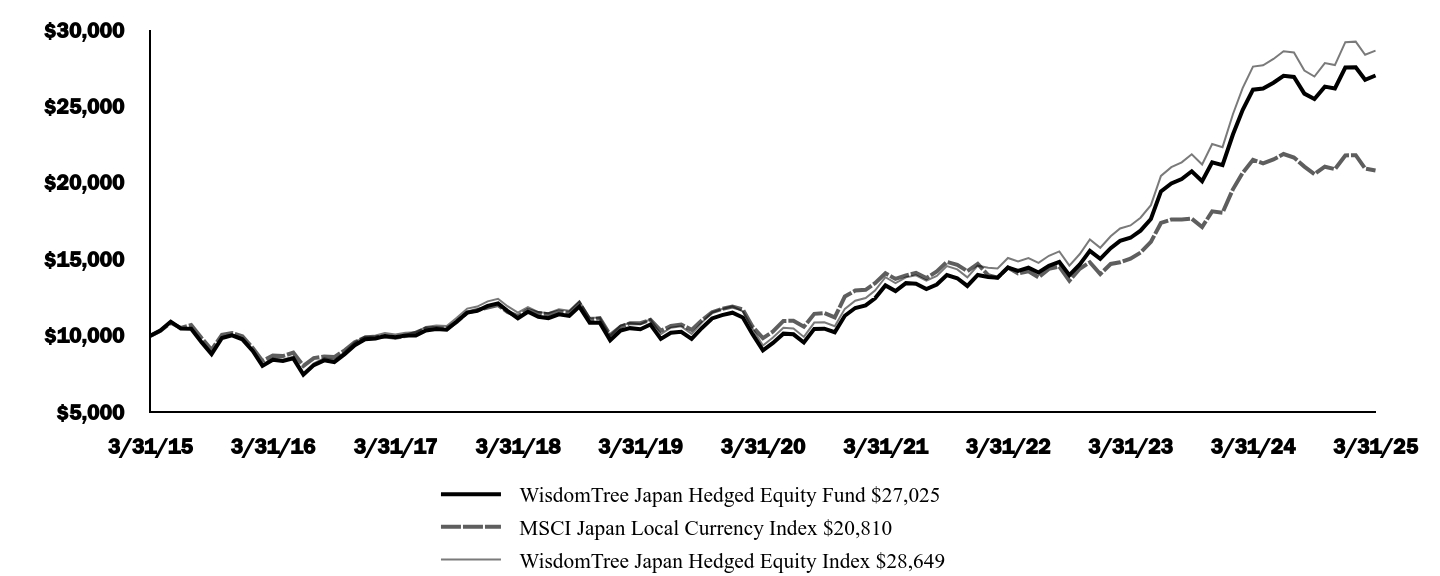 | WisdomTree Japan Hedged Equity Fund | MSCI Japan Local Currency Index | WisdomTree Japan Hedged Equity Index
|
|---|
3/31/15 | $10,000 | $10,000 | $10,000 |
|---|
4/30/15 | $10,347 | $10,332 | $10,353 |
|---|
5/31/15 | $10,929 | $10,854 | $10,948 |
|---|
6/30/15 | $10,485 | $10,519 | $10,522 |
|---|
7/31/15 | $10,470 | $10,701 | $10,515 |
|---|
8/31/15 | $9,588 | $9,858 | $9,633 |
|---|
9/30/15 | $8,810 | $9,080 | $8,853 |
|---|
10/31/15 | $9,863 | $10,072 | $9,920 |
|---|
11/30/15 | $10,032 | $10,187 | $10,096 |
|---|
12/31/15 | $9,773 | $9,973 | $9,843 |
|---|
1/31/16 | $9,013 | $9,211 | $9,077 |
|---|
2/29/16 | $8,036 | $8,352 | $8,114 |
|---|
3/31/16 | $8,436 | $8,710 | $8,520 |
|---|
4/30/16 | $8,361 | $8,677 | $8,445 |
|---|
5/31/16 | $8,527 | $8,901 | $8,645 |
|---|
6/30/16 | $7,463 | $8,031 | $7,568 |
|---|
7/31/16 | $8,084 | $8,542 | $8,205 |
|---|
8/31/16 | $8,397 | $8,655 | $8,530 |
|---|
9/30/16 | $8,288 | $8,609 | $8,405 |
|---|
10/31/16 | $8,804 | $9,051 | $8,941 |
|---|
11/30/16 | $9,392 | $9,578 | $9,563 |
|---|
12/31/16 | $9,780 | $9,899 | $9,964 |
|---|
1/31/17 | $9,828 | $9,910 | $10,019 |
|---|
2/28/17 | $9,985 | $9,959 | $10,185 |
|---|
3/31/17 | $9,908 | $9,882 | $10,096 |
|---|
4/30/17 | $10,016 | $9,989 | $10,207 |
|---|
5/31/17 | $10,024 | $10,208 | $10,227 |
|---|
6/30/17 | $10,354 | $10,482 | $10,579 |
|---|
7/31/17 | $10,444 | $10,517 | $10,676 |
|---|
8/31/17 | $10,402 | $10,470 | $10,637 |
|---|
9/30/17 | $10,938 | $10,918 | $11,180 |
|---|
10/31/17 | $11,518 | $11,529 | $11,781 |
|---|
11/30/17 | $11,634 | $11,694 | $11,915 |
|---|
12/31/17 | $11,958 | $11,854 | $12,253 |
|---|
1/31/18 | $12,120 | $12,013 | $12,425 |
|---|
2/28/18 | $11,636 | $11,566 | $11,938 |
|---|
3/31/18 | $11,148 | $11,284 | $11,522 |
|---|
4/30/18 | $11,573 | $11,688 | $11,877 |
|---|
5/31/18 | $11,251 | $11,490 | $11,554 |
|---|
6/30/18 | $11,159 | $11,419 | $11,475 |
|---|
7/31/18 | $11,412 | $11,587 | $11,743 |
|---|
8/31/18 | $11,306 | $11,503 | $11,644 |
|---|
9/30/18 | $11,916 | $12,141 | $12,266 |
|---|
10/31/18 | $10,861 | $11,043 | $11,182 |
|---|
11/30/18 | $10,863 | $11,155 | $11,186 |
|---|
12/31/18 | $9,710 | $10,058 | $10,002 |
|---|
1/31/19 | $10,343 | $10,586 | $10,679 |
|---|
2/28/19 | $10,504 | $10,824 | $10,840 |
|---|
3/31/19 | $10,434 | $10,823 | $10,762 |
|---|
4/30/19 | $10,738 | $11,042 | $11,084 |
|---|
5/31/19 | $9,799 | $10,338 | $10,111 |
|---|
6/30/19 | $10,199 | $10,642 | $10,536 |
|---|
7/31/19 | $10,268 | $10,740 | $10,619 |
|---|
8/31/19 | $9,795 | $10,393 | $10,127 |
|---|
9/30/19 | $10,499 | $11,010 | $10,856 |
|---|
10/31/19 | $11,138 | $11,547 | $11,530 |
|---|
11/30/19 | $11,356 | $11,763 | $11,759 |
|---|
12/31/19 | $11,514 | $11,917 | $11,924 |
|---|
1/31/20 | $11,198 | $11,723 | $11,603 |
|---|
2/29/20 | $10,111 | $10,600 | $10,484 |
|---|
3/31/20 | $9,048 | $9,851 | $9,371 |
|---|
4/30/20 | $9,538 | $10,283 | $9,886 |
|---|
5/31/20 | $10,143 | $10,974 | $10,525 |
|---|
6/30/20 | $10,100 | $10,988 | $10,488 |
|---|
7/31/20 | $9,563 | $10,597 | $9,931 |
|---|
8/31/20 | $10,454 | $11,438 | $10,867 |
|---|
9/30/20 | $10,467 | $11,494 | $10,884 |
|---|
10/31/20 | $10,235 | $11,204 | $10,634 |
|---|
11/30/20 | $11,313 | $12,572 | $11,766 |
|---|
12/31/20 | $11,820 | $12,961 | $12,295 |
|---|
1/31/21 | $11,992 | $13,012 | $12,477 |
|---|
2/28/21 | $12,454 | $13,441 | $12,965 |
|---|
3/31/21 | $13,298 | $14,089 | $13,834 |
|---|
4/30/21 | $12,932 | $13,724 | $13,453 |
|---|
5/31/21 | $13,450 | $13,949 | $13,825 |
|---|
6/30/21 | $13,405 | $14,112 | $13,961 |
|---|
7/31/21 | $13,060 | $13,777 | $13,607 |
|---|
8/31/21 | $13,354 | $14,215 | $13,920 |
|---|
9/30/21 | $13,977 | $14,834 | $14,564 |
|---|
10/31/21 | $13,766 | $14,649 | $14,345 |
|---|
11/30/21 | $13,262 | $14,228 | $13,828 |
|---|
12/31/21 | $13,983 | $14,703 | $14,587 |
|---|
1/31/22 | $13,844 | $13,966 | $14,447 |
|---|
2/28/22 | $13,799 | $13,804 | $14,404 |
|---|
3/31/22 | $14,466 | $14,474 | $15,091 |
|---|
4/30/22 | $14,245 | $14,089 | $14,860 |
|---|
5/31/22 | $14,453 | $14,219 | $15,092 |
|---|
6/30/22 | $14,142 | $13,831 | $14,772 |
|---|
7/31/22 | $14,575 | $14,382 | $15,235 |
|---|
8/31/22 | $14,837 | $14,536 | $15,522 |
|---|
9/30/22 | $13,967 | $13,605 | $14,595 |
|---|
10/31/22 | $14,675 | $14,385 | $15,350 |
|---|
11/30/22 | $15,554 | $14,812 | $16,300 |
|---|
12/31/22 | $15,032 | $14,043 | $15,760 |
|---|
1/31/23 | $15,731 | $14,701 | $16,509 |
|---|
2/28/23 | $16,211 | $14,807 | $17,022 |
|---|
3/31/23 | $16,414 | $15,041 | $17,218 |
|---|
4/30/23 | $16,877 | $15,445 | $17,728 |
|---|
5/31/23 | $17,643 | $16,142 | $18,545 |
|---|
6/30/23 | $19,445 | $17,383 | $20,457 |
|---|
7/31/23 | $19,962 | $17,604 | $21,028 |
|---|
8/31/23 | $20,256 | $17,601 | $21,344 |
|---|
9/30/23 | $20,762 | $17,662 | $21,872 |
|---|
10/31/23 | $20,113 | $17,117 | $21,202 |
|---|
11/30/23 | $21,340 | $18,139 | $22,543 |
|---|
12/31/23 | $21,160 | $18,053 | $22,340 |
|---|
1/31/24 | $23,166 | $19,583 | $24,490 |
|---|
2/29/24 | $24,763 | $20,652 | $26,195 |
|---|
3/31/24 | $26,099 | $21,513 | $27,605 |
|---|
4/30/24 | $26,176 | $21,282 | $27,689 |
|---|
5/31/24 | $26,553 | $21,538 | $28,108 |
|---|
6/30/24 | $27,000 | $21,890 | $28,608 |
|---|
7/31/24 | $26,928 | $21,662 | $28,535 |
|---|
8/31/24 | $25,840 | $21,069 | $27,352 |
|---|
9/30/24 | $25,492 | $20,579 | $26,958 |
|---|
10/31/24 | $26,296 | $21,061 | $27,833 |
|---|
11/30/24 | $26,178 | $20,901 | $27,708 |
|---|
12/31/24 | $27,543 | $21,797 | $29,205 |
|---|
1/31/25 | $27,560 | $21,812 | $29,239 |
|---|
2/28/25 | $26,745 | $20,939 | $28,379 |
|---|
3/31/25 | $27,025 | $20,810 | $28,649 |
|---|
|
| Average Annual Return [Table Text Block] |
| 1 Year | 5 Years | 10 Years |
|---|
Fund NAV Returns | 3.55% | 24.46% | 10.45% |
|---|
MSCI Japan Local Currency Index | -3.27% | 16.13% | 7.60% |
|---|
WisdomTree Japan Hedged Equity Index | 3.78% | 25.05% | 11.10% |
|---|
|
| AssetsNet |
$ 3,402,346,269
|
| Holdings Count | Holding |
438
|
| Advisory Fees Paid, Amount |
$ 20,100,931
|
| InvestmentCompanyPortfolioTurnover |
36.00%
|
| Additional Fund Statistics [Text Block] |
- Total Net Assets$3,402,346,269
- # of Portfolio Holdings438
- Portfolio Turnover Rate36%
- Investment Advisory Fees Paid$20,100,931
|
| Holdings [Text Block] |
Sector Breakdown (% of Net Assets)Industrials | 22.7% |
|---|
Consumer Discretionary | 19.7% |
|---|
Financials | 18.2% |
|---|
Information Technology | 9.8% |
|---|
Materials | 9.8% |
|---|
Consumer Staples | 7.0% |
|---|
Health Care | 6.8% |
|---|
Communication Services | 3.3% |
|---|
Energy | 1.6% |
|---|
Utilities | 0.1% |
|---|
Other Assets and Liabilities (Net) | 1.0% |
|---|
Total | 100.0% |
|---|
|
| Largest Holdings [Text Block] |
Top 10 Holdings (% of Net Assets)Toyota Motor Corp. | 5.0% |
|---|
Mitsubishi UFJ Financial Group, Inc. | 4.7% |
|---|
Sumitomo Mitsui Financial Group, Inc. | 3.4% |
|---|
Japan Tobacco, Inc. | 3.0% |
|---|
Honda Motor Co. Ltd. | 2.7% |
|---|
Mizuho Financial Group, Inc. | 2.6% |
|---|
Mitsubishi Corp. | 2.5% |
|---|
Takeda Pharmaceutical Co. Ltd. | 2.3% |
|---|
Nintendo Co. Ltd. | 2.3% |
|---|
Tokio Marine Holdings, Inc. | 2.2% |
|---|
|
| Material Fund Change [Text Block] |
|
| Updated Prospectus Phone Number |
1-866-909-WISE (9473)
|
| Updated Prospectus Web Address |
<span style="box-sizing: border-box; color: rgb(0, 0, 0); display: inline; flex-wrap: nowrap; font-size: 10.6667px; font-weight: 400; grid-area: auto; line-height: 10.6667px; margin: 0px; overflow: visible; text-align: left; white-space-collapse: preserve-breaks;">www.wisdomtree.com/investments/regulatory</span>
|
| C000127778 |
|
| Shareholder Report [Line Items] |
|
| Fund Name |
WisdomTree Japan Hedged SmallCap Equity Fund
|
| Trading Symbol |
DXJS
|
| Annual or Semi-Annual Statement [Text Block] |
This annual shareholder report contains important information about the WisdomTree Japan Hedged SmallCap Equity Fund (the "Fund") for the period of April 1, 2024 to March 31, 2025.
|
| Shareholder Report Annual or Semi-Annual |
Annual Shareholder Report
|
| Additional Information [Text Block] |
You can find additional information about the Fund at www.wisdomtree.com/investments/regulatory. You can also request this information by contacting us at 1-866-909-WISE (9473).
|
| Additional Information Phone Number |
1-866-909-WISE (9473)
|
| Additional Information Website |
<span style="box-sizing: border-box; color: rgb(0, 0, 0); display: inline; flex-wrap: nowrap; font-size: 10.6667px; font-weight: 400; grid-area: auto; line-height: 10.6667px; margin: 0px; overflow: visible; text-align: left; white-space-collapse: preserve-breaks;">www.wisdomtree.com/investments/regulatory</span>
|
| Expenses [Text Block] |
What were the Fund's costs for the last year?(based on a hypothetical $10,000 investment) Fund Name | Costs of a $10,000 investment | Costs paid as a percentage of a $10,000 investment |
|---|
WisdomTree Japan Hedged SmallCap Equity Fund | $60 | 0.58% |
|---|
|
| Expenses Paid, Amount |
$ 60
|
| Expense Ratio, Percent |
0.58%
|
| Factors Affecting Performance [Text Block] |
How did the Fund perform last year and what affected its performance?The Fund returned 6.42% at net asset value (NAV) for the fiscal year ended March 31, 2025, outperforming the Fund's primary comparative benchmark, the MSCI Japan Small Cap Local Currency Index, which returned 1.88% in local currency terms during the same period. The following summarizes the key factors that affected Fund performance during the period: The Fund benefited from its exposures to Real Estate, Information Technology, and Consumer Staples, primarily due to strong stock selection effects. Materials detracted from performance due to negative allocation effects resulting from an overweight to an underperforming sector. Industrials and Utilities were also modest headwinds, each due to poor stock selection effects in each. The Fund’s currency hedge was also additive for performance overall. The yen slightly strengthened versus the dollar, which would normally challenge performance, but positive carry effects from the hedge outweighed the headwind.
|
| Performance Past Does Not Indicate Future [Text] |
The Fund's past performance is not a good predictor of future results. The performance shown in the following graph and table do not reflect the deduction of taxes that a shareholder would pay on Fund distributions or on the redemption of Fund shares. For the most recent performance information visit
|
| Line Graph [Table Text Block] |
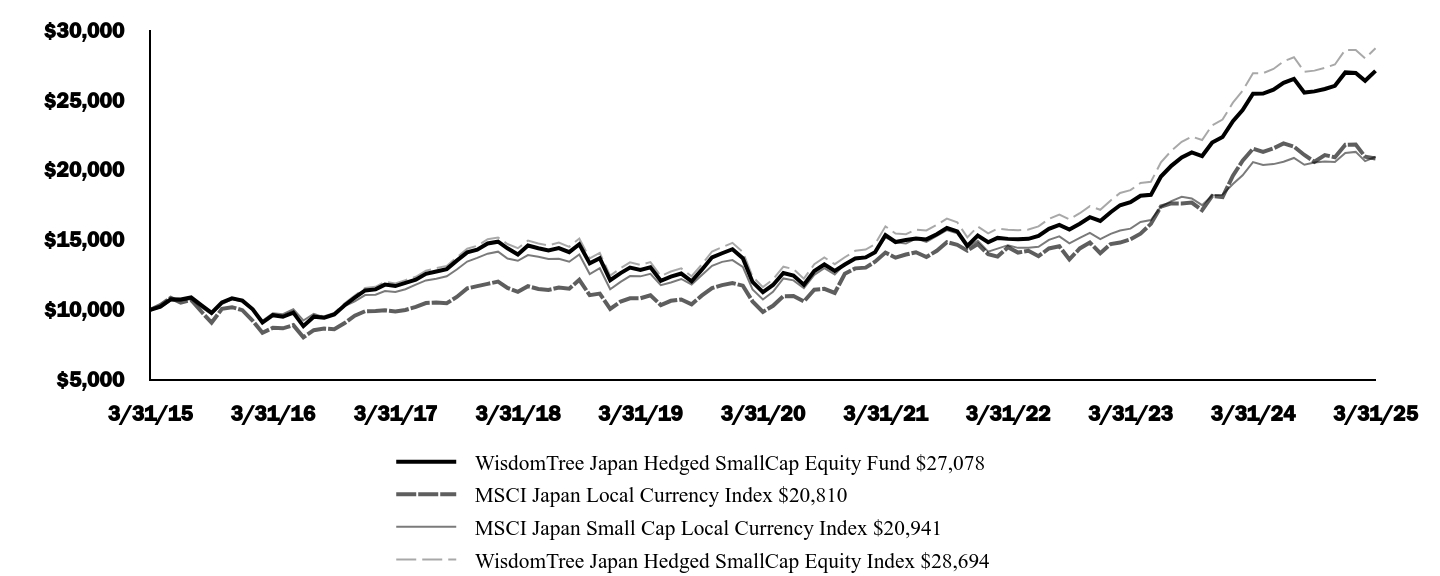 | WisdomTree Japan Hedged SmallCap Equity Fund | MSCI Japan Local Currency Index | MSCI Japan Small Cap Local Currency Index
| WisdomTree Japan Hedged SmallCap Equity Index
|
|---|
3/31/15 | $10,000 | $10,000 | $10,000 | $10,000 |
|---|
4/30/15 | $10,229 | $10,332 | $10,165 | $10,231 |
|---|
5/31/15 | $10,746 | $10,854 | $10,666 | $10,742 |
|---|
6/30/15 | $10,730 | $10,519 | $10,671 | $10,717 |
|---|
7/31/15 | $10,880 | $10,701 | $10,762 | $10,877 |
|---|
8/31/15 | $10,316 | $9,858 | $10,167 | $10,330 |
|---|
9/30/15 | $9,776 | $9,080 | $9,687 | $9,787 |
|---|
10/31/15 | $10,525 | $10,072 | $10,412 | $10,535 |
|---|
11/30/15 | $10,814 | $10,187 | $10,772 | $10,853 |
|---|
12/31/15 | $10,652 | $9,973 | $10,598 | $10,705 |
|---|
1/31/16 | $10,036 | $9,211 | $9,987 | $10,085 |
|---|
2/29/16 | $9,088 | $8,352 | $9,215 | $9,161 |
|---|
3/31/16 | $9,617 | $8,710 | $9,749 | $9,697 |
|---|
4/30/16 | $9,503 | $8,677 | $9,684 | $9,594 |
|---|
5/31/16 | $9,796 | $8,901 | $10,040 | $9,916 |
|---|
6/30/16 | $8,833 | $8,031 | $9,232 | $8,917 |
|---|
7/31/16 | $9,510 | $8,542 | $9,717 | $9,614 |
|---|
8/31/16 | $9,435 | $8,655 | $9,461 | $9,543 |
|---|
9/30/16 | $9,668 | $8,609 | $9,761 | $9,778 |
|---|
10/31/16 | $10,326 | $9,051 | $10,265 | $10,462 |
|---|
11/30/16 | $10,869 | $9,578 | $10,607 | $11,025 |
|---|
12/31/16 | $11,384 | $9,899 | $11,053 | $11,555 |
|---|
1/31/17 | $11,459 | $9,910 | $11,072 | $11,644 |
|---|
2/28/17 | $11,801 | $9,959 | $11,342 | $11,996 |
|---|
3/31/17 | $11,698 | $9,882 | $11,275 | $11,877 |
|---|
4/30/17 | $11,921 | $9,989 | $11,472 | $12,120 |
|---|
5/31/17 | $12,153 | $10,208 | $11,799 | $12,359 |
|---|
6/30/17 | $12,568 | $10,482 | $12,101 | $12,793 |
|---|
7/31/17 | $12,733 | $10,517 | $12,218 | $12,974 |
|---|
8/31/17 | $12,908 | $10,470 | $12,396 | $13,138 |
|---|
9/30/17 | $13,516 | $10,918 | $12,880 | $13,750 |
|---|
10/31/17 | $14,108 | $11,529 | $13,447 | $14,364 |
|---|
11/30/17 | $14,298 | $11,694 | $13,708 | $14,580 |
|---|
12/31/17 | $14,738 | $11,854 | $14,013 | $15,041 |
|---|
1/31/18 | $14,866 | $12,013 | $14,154 | $15,169 |
|---|
2/28/18 | $14,393 | $11,566 | $13,669 | $14,702 |
|---|
3/31/18 | $13,956 | $11,284 | $13,506 | $14,401 |
|---|
4/30/18 | $14,594 | $11,688 | $13,916 | $14,943 |
|---|
5/31/18 | $14,400 | $11,490 | $13,785 | $14,741 |
|---|
6/30/18 | $14,235 | $11,419 | $13,624 | $14,605 |
|---|
7/31/18 | $14,411 | $11,587 | $13,649 | $14,803 |
|---|
8/31/18 | $14,118 | $11,503 | $13,434 | $14,501 |
|---|
9/30/18 | $14,690 | $12,141 | $13,953 | $15,092 |
|---|
10/31/18 | $13,316 | $11,043 | $12,552 | $13,681 |
|---|
11/30/18 | $13,683 | $11,155 | $12,972 | $14,062 |
|---|
12/31/18 | $12,111 | $10,058 | $11,465 | $12,442 |
|---|
1/31/19 | $12,624 | $10,586 | $11,995 | $12,975 |
|---|
2/28/19 | $13,014 | $10,824 | $12,408 | $13,388 |
|---|
3/31/19 | $12,855 | $10,823 | $12,389 | $13,214 |
|---|
4/30/19 | $13,037 | $11,042 | $12,575 | $13,411 |
|---|
5/31/19 | $12,075 | $10,338 | $11,760 | $12,413 |
|---|
6/30/19 | $12,377 | $10,642 | $11,954 | $12,739 |
|---|
7/31/19 | $12,590 | $10,740 | $12,202 | $12,962 |
|---|
8/31/19 | $12,041 | $10,393 | $11,813 | $12,396 |
|---|
9/30/19 | $12,850 | $11,010 | $12,464 | $13,224 |
|---|
10/31/19 | $13,753 | $11,547 | $13,143 | $14,167 |
|---|
11/30/19 | $14,043 | $11,763 | $13,425 | $14,476 |
|---|
12/31/19 | $14,331 | $11,917 | $13,554 | $14,784 |
|---|
1/31/20 | $13,680 | $11,723 | $13,063 | $14,126 |
|---|
2/29/20 | $11,988 | $10,600 | $11,457 | $12,382 |
|---|
3/31/20 | $11,261 | $9,851 | $10,740 | $11,618 |
|---|
4/30/20 | $11,776 | $10,283 | $11,285 | $12,170 |
|---|
5/31/20 | $12,626 | $10,974 | $12,240 | $13,080 |
|---|
6/30/20 | $12,446 | $10,988 | $12,106 | $12,907 |
|---|
7/31/20 | $11,787 | $10,597 | $11,545 | $12,226 |
|---|
8/31/20 | $12,774 | $11,438 | $12,501 | $13,253 |
|---|
9/30/20 | $13,241 | $11,494 | $12,969 | $13,741 |
|---|
10/31/20 | $12,778 | $11,204 | $12,524 | $13,260 |
|---|
11/30/20 | $13,238 | $12,572 | $13,275 | $13,756 |
|---|
12/31/20 | $13,665 | $12,961 | $13,706 | $14,217 |
|---|
1/31/21 | $13,744 | $13,012 | $13,794 | $14,308 |
|---|
2/28/21 | $14,108 | $13,441 | $14,102 | $14,682 |
|---|
3/31/21 | $15,345 | $14,089 | $15,170 | $15,965 |
|---|
4/30/21 | $14,845 | $13,724 | $14,829 | $15,448 |
|---|
5/31/21 | $14,996 | $13,949 | $14,735 | $15,403 |
|---|
6/30/21 | $15,100 | $14,112 | $15,096 | $15,733 |
|---|
7/31/21 | $15,031 | $13,777 | $14,859 | $15,674 |
|---|
8/31/21 | $15,405 | $14,215 | $15,290 | $16,070 |
|---|
9/30/21 | $15,845 | $14,834 | $15,695 | $16,517 |
|---|
10/31/21 | $15,599 | $14,649 | $15,461 | $16,257 |
|---|
11/30/21 | $14,566 | $14,228 | $14,472 | $15,177 |
|---|
12/31/21 | $15,302 | $14,703 | $14,940 | $15,953 |
|---|
1/31/22 | $14,825 | $13,966 | $14,153 | $15,466 |
|---|
2/28/22 | $15,140 | $13,804 | $14,369 | $15,808 |
|---|
3/31/22 | $15,069 | $14,474 | $14,619 | $15,721 |
|---|
4/30/22 | $15,034 | $14,089 | $14,427 | $15,686 |
|---|
5/31/22 | $15,072 | $14,219 | $14,442 | $15,734 |
|---|
6/30/22 | $15,281 | $13,831 | $14,504 | $15,960 |
|---|
7/31/22 | $15,786 | $14,382 | $14,995 | $16,501 |
|---|
8/31/22 | $16,073 | $14,536 | $15,251 | $16,811 |
|---|
9/30/22 | $15,740 | $13,605 | $14,750 | $16,460 |
|---|
10/31/22 | $16,148 | $14,385 | $15,136 | $16,904 |
|---|
11/30/22 | $16,617 | $14,812 | $15,496 | $17,414 |
|---|
12/31/22 | $16,348 | $14,043 | $15,055 | $17,149 |
|---|
1/31/23 | $16,976 | $14,701 | $15,425 | $17,820 |
|---|
2/28/23 | $17,473 | $14,807 | $15,671 | $18,349 |
|---|
3/31/23 | $17,685 | $15,041 | $15,801 | $18,554 |
|---|
4/30/23 | $18,147 | $15,445 | $16,281 | $19,064 |
|---|
5/31/23 | $18,216 | $16,142 | $16,418 | $19,147 |
|---|
6/30/23 | $19,526 | $17,383 | $17,368 | $20,536 |
|---|
7/31/23 | $20,291 | $17,604 | $17,768 | $21,366 |
|---|
8/31/23 | $20,893 | $17,601 | $18,079 | $22,004 |
|---|
9/30/23 | $21,248 | $17,662 | $17,960 | $22,382 |
|---|
10/31/23 | $20,989 | $17,117 | $17,480 | $22,135 |
|---|
11/30/23 | $21,958 | $18,139 | $18,173 | $23,191 |
|---|
12/31/23 | $22,347 | $18,053 | $18,231 | $23,597 |
|---|
1/31/24 | $23,477 | $19,583 | $18,994 | $24,808 |
|---|
2/29/24 | $24,269 | $20,652 | $19,615 | $25,660 |
|---|
3/31/24 | $25,444 | $21,513 | $20,555 | $26,903 |
|---|
4/30/24 | $25,459 | $21,282 | $20,354 | $26,918 |
|---|
5/31/24 | $25,738 | $21,538 | $20,413 | $27,215 |
|---|
6/30/24 | $26,220 | $21,890 | $20,586 | $27,756 |
|---|
7/31/24 | $26,507 | $21,662 | $20,853 | $28,054 |
|---|
8/31/24 | $25,525 | $21,069 | $20,364 | $27,017 |
|---|
9/30/24 | $25,612 | $20,579 | $20,526 | $27,096 |
|---|
10/31/24 | $25,786 | $21,061 | $20,605 | $27,289 |
|---|
11/30/24 | $26,012 | $20,901 | $20,571 | $27,537 |
|---|
12/31/24 | $26,969 | $21,797 | $21,211 | $28,582 |
|---|
1/31/25 | $26,930 | $21,812 | $21,287 | $28,563 |
|---|
2/28/25 | $26,370 | $20,939 | $20,623 | $27,974 |
|---|
3/31/25 | $27,078 | $20,810 | $20,941 | $28,694 |
|---|
|
| Average Annual Return [Table Text Block] |
| 1 Year | 5 Years | 10 Years |
|---|
Fund NAV Returns | 6.42% | 19.18% | 10.47% |
|---|
MSCI Japan Local Currency Index | -3.27% | 16.13% | 7.60% |
|---|
MSCI Japan Small Cap Local Currency Index | 1.88% | 14.29% | 7.67% |
|---|
WisdomTree Japan Hedged SmallCap Equity Index | 6.66% | 19.82% | 11.12% |
|---|
|
| AssetsNet |
$ 76,511,405
|
| Holdings Count | Holding |
770
|
| Advisory Fees Paid, Amount |
$ 431,527
|
| InvestmentCompanyPortfolioTurnover |
45.00%
|
| Additional Fund Statistics [Text Block] |
- Total Net Assets$76,511,405
- # of Portfolio Holdings770
- Portfolio Turnover Rate45%
- Investment Advisory Fees Paid$431,527
|
| Holdings [Text Block] |
Sector Breakdown (% of Net Assets)Industrials | 24.8% |
|---|
Consumer Discretionary | 18.1% |
|---|
Materials | 14.2% |
|---|
Information Technology | 10.7% |
|---|
Consumer Staples | 9.6% |
|---|
Financials | 9.5% |
|---|
Health Care | 4.2% |
|---|
Real Estate | 3.1% |
|---|
Communication Services | 2.0% |
|---|
Utilities | 1.4% |
|---|
Other Sectors | 1.0% |
|---|
Other Assets and Liabilities (Net) | 1.4% |
|---|
Total | 100.0% |
|---|
|
| Largest Holdings [Text Block] |
Top 10 Holdings (% of Net Assets)Toyo Tire Corp. | 0.7% |
|---|
Matsui Securities Co. Ltd. | 0.5% |
|---|
Toyoda Gosei Co. Ltd. | 0.5% |
|---|
Amano Corp. | 0.5% |
|---|
MEITEC Group Holdings, Inc. | 0.5% |
|---|
Nippon Gas Co. Ltd. | 0.5% |
|---|
Hirogin Holdings, Inc. | 0.5% |
|---|
Kokuyo Co. Ltd. | 0.5% |
|---|
Nippon Electric Glass Co. Ltd. | 0.5% |
|---|
EXEO Group, Inc. | 0.5% |
|---|
|
| Material Fund Change [Text Block] |
|
| Updated Prospectus Phone Number |
1-866-909-WISE (9473)
|
| Updated Prospectus Web Address |
<span style="box-sizing: border-box; color: rgb(0, 0, 0); display: inline; flex-wrap: nowrap; font-size: 10.6667px; font-weight: 400; grid-area: auto; line-height: 10.6667px; margin: 0px; overflow: visible; text-align: left; white-space-collapse: preserve-breaks;">www.wisdomtree.com/investments/regulatory</span>
|