Shareholder Report
Mar. 31, 2025
USD ($)
Holding
Shareholder Report |
6 Months Ended |
|---|---|
|
Mar. 31, 2025
USD ($)
Holding
| |
| Shareholder Report [Line Items] | |
| Document Type | N-CSRS |
| Amendment Flag | false |
| Registrant Name | Atlas U.S. Tactical Income Fund |
| Entity Central Index Key | 0001866278 |
| Entity Investment Company Type | N-1A |
| Document Period End Date | Mar. 31, 2025 |
| C000229637 | |
| Shareholder Report [Line Items] | |
| Fund Name | Atlas U.S. Tactical Income Fund |
| Trading Symbol | ATLAX |
| Annual or Semi-Annual Statement [Text Block] | This semi-annual shareholder report contains important information about Atlas U.S. Tactical Income Fund for the period of October 1, 2024 to March 31, 2025. |
| Shareholder Report Annual or Semi-Annual | Semi-Annual Shareholder Report |
| Additional Information [Text Block] | You can find additional information about the Fund at https://www.atlas-am.com/semi-annual-report-eng. You can also request this information by contacting us at (855) 969-8440. |
| Additional Information Phone Number | (855) 969-8440 |
| Additional Information Website | https://www.atlas-am.com/semi-annual-report-eng |
| Expenses [Text Block] | |
| Expenses Paid, Amount | $ 264 |
| Expense Ratio, Percent | 5.30% |
| AssetsNet | $ 72,974,220 |
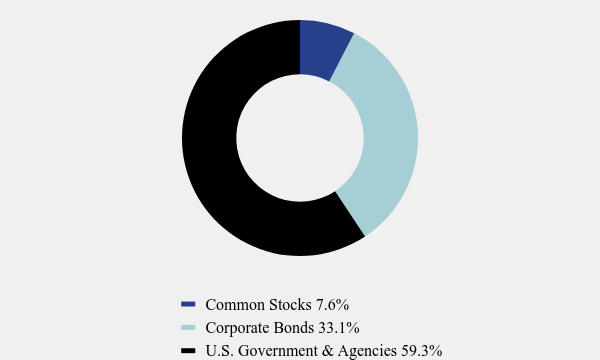
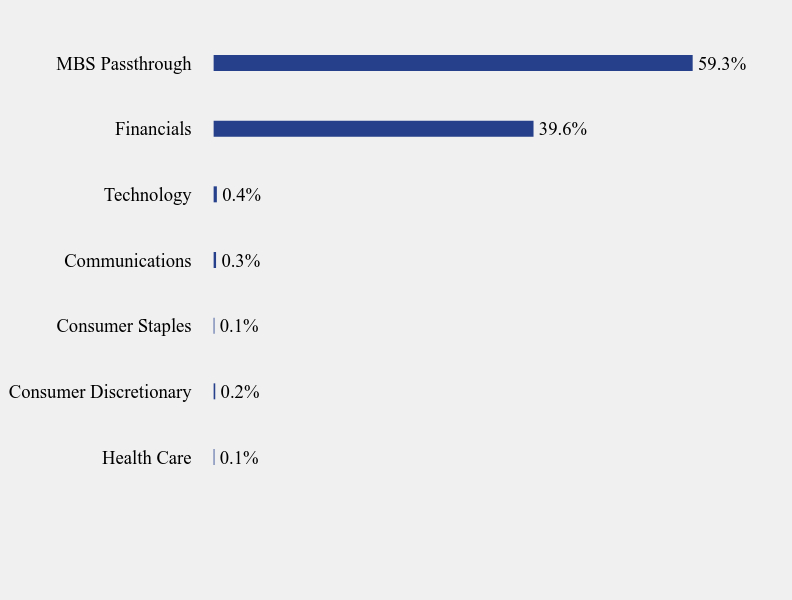
| Holdings Count | Holding | 67 |
| Advisory Fees Paid, Amount | $ 235,000 |
| InvestmentCompanyPortfolioTurnover | 4.00% |
| Additional Fund Statistics [Text Block] | |
| Holdings [Text Block] | |
| Material Fund Change [Text Block] | |
| C000229638 | |
| Shareholder Report [Line Items] | |
| Fund Name | Atlas U.S. Tactical Income Fund |
| Trading Symbol | ATLCX |
| Annual or Semi-Annual Statement [Text Block] | This semi-annual shareholder report contains important information about Atlas U.S. Tactical Income Fund for the period of October 1, 2024 to March 31, 2025. |
| Shareholder Report Annual or Semi-Annual | Semi-Annual Shareholder Report |
| Additional Information [Text Block] | You can find additional information about the Fund at https://www.atlas-am.com/semi-annual-report-eng. You can also request this information by contacting us at (855) 969-8440. |
| Additional Information Phone Number | (855) 969-8440 |
| Additional Information Website | https://www.atlas-am.com/semi-annual-report-eng |
| Expenses [Text Block] | |
| Expenses Paid, Amount | $ 301 |
| Expense Ratio, Percent | 6.05% |
| AssetsNet | $ 72,974,220 |
| Holdings Count | Holding | 67 |
| Advisory Fees Paid, Amount | $ 235,000 |
| InvestmentCompanyPortfolioTurnover | 4.00% |
| Additional Fund Statistics [Text Block] | |
| Holdings [Text Block] | |
| Material Fund Change [Text Block] |