Shareholder Report
|
12 Months Ended |
|
Mar. 31, 2025
USD ($)
Holding
|
|---|
| Shareholder Report [Line Items] |
|
| Document Type |
N-CSR
|
| Amendment Flag |
false
|
| Registrant Name |
PIMCO FUNDS
|
| Entity Central Index Key |
0000810893
|
| Entity Investment Company Type |
N-1A
|
| Document Period End Date |
Mar. 31, 2025
|
| C000088650 |
|
| Shareholder Report [Line Items] |
|
| Fund Name |
PIMCO CommoditiesPLUS<sup style="box-sizing: border-box; color: rgb(0, 0, 0); display: inline; flex-wrap: nowrap; font-size: 15px; font-weight: 700; grid-area: auto; line-height: 0px; margin: 0px; overflow: visible; position: relative; text-align: left; white-space-collapse: preserve-breaks;">®</sup> Strategy Fund
|
| Class Name |
Class A
|
| Trading Symbol |
PCLAX
|
| Annual or Semi-Annual Statement [Text Block] |
This annual shareholder report contains important information about the PIMCO CommoditiesPLUS® Strategy Fund (the "Fund") for the period of April 1, 2024 to March 31, 2025 (the "reporting period").
|
| Shareholder Report Annual or Semi-Annual |
Annual Shareholder Report
|
| Additional Information [Text Block] |
You can find additional information about the Fund at www.pimco.com/literature. You can also request this information by contacting us at 888.87.PIMCO (888.877.4626).
|
| Additional Information Phone Number |
888.87.PIMCO (888.877.4626)
|
| Expenses [Text Block] |
What were the Fund costs for the reporting period?(based on a hypothetical $10,000 investment)
Class Name |
Cost of a $10,000 investment |
Costs paid as a percentage of a $10,000 investment |
Class A |
$130 |
1.27% | |
| Expenses Paid, Amount |
$ 130
|
| Expense Ratio, Percent |
1.27%
|
| Factors Affecting Performance [Text Block] |
How did the Fund perform during the reporting period and what affected its performance?The following affected performance (on a gross basis) during the reporting period: Active commodity strategies within the agriculture sector, including underweight exposure to corn, as well as overweight exposure to coffee, contributed to relative performance versus the UBS Prompt Commodity Index Total Return ("Index"), as corn posted negative returns, while coffee posted positive returns. Overweight exposure to silver contributed to relative performance versus the Index, as silver posted positive returns. Exposure to securitized assets, including collateralized loan obligations, contributed to relative performance versus the Index, as spreads broadly tightened. Duration strategies in the U.S., including overweight exposure to the front-end of the curve, contributed to relative performance versus the Index, as front-end U.S. interest rates fell. Exposure to California Carbon Allowances ("CCAs") detracted from relative performance versus the Index, as CCAs posted negative returns. Overweight exposure to base metals detracted from relative performance versus the Index, as base metals posted positive returns. Underweight exposure to natural gas detracted from relative performance versus the Index, as natural gas posted positive returns.
|
| Performance Past Does Not Indicate Future [Text] |
Performance quoted represents past performance. Past performance is not a guarantee or a reliable indicator of future results.
|
| Line Graph [Table Text Block] |

|
Class A (including sales charge) |
S&P 500 Index |
UBS Prompt Commodity Index Total Return |
3/31/15 |
$9,444 |
$10,000 |
$10,000 |
4/30/15 |
$10,410 |
$10,096 |
$11,039 |
5/31/15 |
$10,106 |
$10,226 |
$10,748 |
6/30/15 |
$10,094 |
$10,028 |
$10,778 |
7/31/15 |
$8,832 |
$10,238 |
$9,366 |
8/31/15 |
$8,805 |
$9,620 |
$9,398 |
9/30/15 |
$8,205 |
$9,382 |
$8,859 |
10/31/15 |
$8,379 |
$10,174 |
$8,944 |
11/30/15 |
$7,696 |
$10,204 |
$8,186 |
12/31/15 |
$7,195 |
$10,043 |
$7,630 |
1/31/16 |
$6,765 |
$9,545 |
$7,250 |
2/29/16 |
$6,658 |
$9,532 |
$7,175 |
3/31/16 |
$7,127 |
$10,178 |
$7,575 |
4/30/16 |
$7,893 |
$10,218 |
$8,366 |
5/31/16 |
$7,960 |
$10,401 |
$8,468 |
6/30/16 |
$8,075 |
$10,428 |
$8,586 |
7/31/16 |
$7,577 |
$10,813 |
$7,996 |
8/31/16 |
$7,698 |
$10,828 |
$8,077 |
9/30/16 |
$8,075 |
$10,830 |
$8,435 |
10/31/16 |
$8,021 |
$10,632 |
$8,309 |
11/30/16 |
$8,263 |
$11,026 |
$8,527 |
12/31/16 |
$8,531 |
$11,244 |
$8,813 |
1/31/17 |
$8,612 |
$11,457 |
$8,808 |
2/28/17 |
$8,639 |
$11,912 |
$8,842 |
3/31/17 |
$8,297 |
$11,926 |
$8,522 |
4/30/17 |
$8,095 |
$12,049 |
$8,291 |
5/31/17 |
$7,961 |
$12,218 |
$8,173 |
6/30/17 |
$7,856 |
$12,294 |
$8,054 |
7/31/17 |
$8,280 |
$12,547 |
$8,454 |
8/31/17 |
$8,308 |
$12,586 |
$8,454 |
9/30/17 |
$8,544 |
$12,845 |
$8,672 |
10/31/17 |
$8,898 |
$13,145 |
$8,997 |
11/30/17 |
$9,045 |
$13,548 |
$9,123 |
12/31/17 |
$9,408 |
$13,699 |
$9,487 |
1/31/18 |
$9,714 |
$14,483 |
$9,795 |
2/28/18 |
$9,485 |
$13,949 |
$9,556 |
3/31/18 |
$9,714 |
$13,595 |
$9,749 |
4/30/18 |
$10,111 |
$13,647 |
$10,177 |
5/31/18 |
$10,325 |
$13,976 |
$10,383 |
6/30/18 |
$10,249 |
$14,062 |
$10,311 |
7/31/18 |
$9,946 |
$14,585 |
$9,986 |
8/31/18 |
$9,994 |
$15,060 |
$10,026 |
9/30/18 |
$10,332 |
$15,146 |
$10,350 |
10/31/18 |
$9,781 |
$14,111 |
$9,871 |
11/30/18 |
$8,680 |
$14,398 |
$8,933 |
12/31/18 |
$8,224 |
$13,098 |
$8,401 |
1/31/19 |
$8,933 |
$14,148 |
$9,103 |
2/28/19 |
$9,394 |
$14,602 |
$9,463 |
3/31/19 |
$9,506 |
$14,886 |
$9,557 |
4/30/19 |
$9,790 |
$15,489 |
$9,788 |
5/31/19 |
$9,007 |
$14,504 |
$9,132 |
6/30/19 |
$9,376 |
$15,526 |
$9,519 |
7/31/19 |
$9,394 |
$15,750 |
$9,505 |
8/31/19 |
$8,838 |
$15,500 |
$9,031 |
9/30/19 |
$8,984 |
$15,790 |
$9,208 |
10/31/19 |
$9,147 |
$16,132 |
$9,372 |
11/30/19 |
$9,147 |
$16,718 |
$9,359 |
12/31/19 |
$9,801 |
$17,222 |
$9,989 |
1/31/20 |
$8,896 |
$17,216 |
$9,119 |
2/29/20 |
$8,171 |
$15,798 |
$8,429 |
3/31/20 |
$5,891 |
$13,847 |
$6,380 |
4/30/20 |
$5,618 |
$15,622 |
$5,971 |
5/31/20 |
$6,709 |
$16,366 |
$7,088 |
6/30/20 |
$7,084 |
$16,692 |
$7,477 |
7/31/20 |
$7,484 |
$17,633 |
$7,824 |
8/31/20 |
$7,903 |
$18,900 |
$8,247 |
9/30/20 |
$7,635 |
$18,182 |
$7,962 |
10/31/20 |
$7,307 |
$17,699 |
$7,603 |
11/30/20 |
$8,309 |
$19,636 |
$8,647 |
12/31/20 |
$8,856 |
$20,391 |
$9,181 |
1/31/21 |
$9,275 |
$20,185 |
$9,597 |
2/28/21 |
$10,259 |
$20,742 |
$10,622 |
3/31/21 |
$10,077 |
$21,650 |
$10,429 |
4/30/21 |
$10,879 |
$22,806 |
$11,273 |
5/31/21 |
$11,207 |
$22,965 |
$11,593 |
6/30/21 |
$11,688 |
$23,501 |
$12,099 |
7/31/21 |
$11,887 |
$24,059 |
$12,337 |
8/31/21 |
$11,738 |
$24,791 |
$12,153 |
9/30/21 |
$12,263 |
$23,638 |
$12,767 |
10/31/21 |
$12,933 |
$25,294 |
$13,454 |
11/30/21 |
$11,745 |
$25,119 |
$12,215 |
12/31/21 |
$12,699 |
$26,244 |
$13,159 |
1/31/22 |
$13,870 |
$24,886 |
$14,482 |
2/28/22 |
$14,857 |
$24,141 |
$15,600 |
3/31/22 |
$16,221 |
$25,038 |
$17,043 |
4/30/22 |
$16,840 |
$22,854 |
$17,695 |
5/31/22 |
$17,512 |
$22,896 |
$18,383 |
6/30/22 |
$16,086 |
$21,006 |
$16,986 |
7/31/22 |
$16,165 |
$22,943 |
$17,018 |
8/31/22 |
$15,749 |
$22,007 |
$16,623 |
9/30/22 |
$14,607 |
$19,981 |
$15,568 |
10/31/22 |
$15,300 |
$21,598 |
$16,275 |
11/30/22 |
$15,516 |
$22,805 |
$16,511 |
12/31/22 |
$15,582 |
$21,491 |
$16,511 |
1/31/23 |
$15,796 |
$22,842 |
$16,637 |
2/28/23 |
$15,273 |
$22,284 |
$15,999 |
3/31/23 |
$15,148 |
$23,103 |
$15,881 |
4/30/23 |
$15,124 |
$23,463 |
$15,818 |
5/31/23 |
$14,135 |
$23,565 |
$14,791 |
6/30/23 |
$14,690 |
$25,122 |
$15,335 |
7/31/23 |
$16,137 |
$25,929 |
$16,832 |
8/31/23 |
$16,185 |
$25,516 |
$16,850 |
9/30/23 |
$16,435 |
$24,300 |
$17,217 |
10/31/23 |
$16,000 |
$23,789 |
$16,775 |
11/30/23 |
$15,710 |
$25,961 |
$16,365 |
12/31/23 |
$15,371 |
$27,141 |
$15,992 |
1/31/24 |
$15,789 |
$27,597 |
$16,398 |
2/29/24 |
$15,838 |
$29,070 |
$16,486 |
3/31/24 |
$16,639 |
$30,006 |
$17,356 |
4/30/24 |
$16,910 |
$28,780 |
$17,720 |
5/31/24 |
$16,836 |
$30,207 |
$17,608 |
6/30/24 |
$16,860 |
$31,291 |
$17,648 |
7/31/24 |
$16,256 |
$31,672 |
$16,996 |
8/31/24 |
$16,054 |
$32,440 |
$16,794 |
9/30/24 |
$16,222 |
$33,133 |
$16,979 |
10/31/24 |
$16,196 |
$32,833 |
$16,960 |
11/30/24 |
$16,222 |
$34,760 |
$17,023 |
12/31/24 |
$16,627 |
$33,931 |
$17,438 |
1/31/25 |
$17,104 |
$34,876 |
$18,005 |
2/28/25 |
$16,865 |
$34,421 |
$17,759 |
3/31/25 |
$17,299 |
$32,482 |
$18,268 |
|
| Average Annual Return [Table Text Block] |
Class/Index Name |
1 Year |
5 Years |
10 Years |
Class A (excluding sales charge) |
3.96% |
24.04% |
6.24% |
Class A (including sales charge) |
(1.71%) |
22.64% |
5.63% |
S&P 500 Index |
8.25% |
18.59% |
12.50% |
UBS Prompt Commodity Index Total Return |
5.26% |
23.42% |
6.21% | |
| No Deduction of Taxes [Text Block] |
Returns shown do not reflect the deduction of taxes that a shareholder would pay on Fund distributions or the redemption of Fund shares.
|
| Performance Table Market Index Changed [Text Block] |
Differences in the Fund’s performance versus an index and related attribution information with respect to particular categories of securities or individual positions may be attributable, in part, to differences in the pricing methodologies used by the Fund and the index.
|
| Updated Performance Information Location [Text Block] |
For performance current to the most recent month-end, visit www.pimco.com/literature or via 888.87.PIMCO (888.877.4626).
|
| AssetsNet |
$ 4,684,149,000
|
| Holdings Count | Holding |
1,079
|
| Advisory Fees Paid, Amount |
$ 22,011,000
|
| InvestmentCompanyPortfolioTurnover |
201.00%
|
| Additional Fund Statistics [Text Block] |
Key Fund StatisticsFootnote Reference† (as of the end of the reporting period)
Total Net Assets |
$4,684,149 |
# of Portfolio Holdings |
1,079 |
Portfolio Turnover Rate |
201% |
Total Net Advisory Fees Paid During the Reporting Period |
$22,011 |
| Footnote |
Description |
Footnote† |
Dollar amounts displayed in 000's | |
| Holdings [Text Block] |
Security Type Breakdown (% of Net Asset Value)Footnote Reference*
Asset-Backed Securities |
17.0% |
Commodities |
14.8% |
Corporate Bonds & Notes |
11.5% |
U.S. Government Agencies |
11.0% |
U.S. Treasury Obligations |
3.2% |
Sovereign Issues |
2.3% |
Non-Agency Mortgage-Backed Securities |
2.2% |
Other Investments |
0.0%Footnote Reference^ |
Short-Term Instruments |
51.4% |
Affiliated Investments |
5.3% |
Financial Derivative Instruments |
1.5% |
Other Assets and Liabilities, Net |
(20.2%) |
Total |
100.0% |
| Footnote |
Description |
Footnote^ |
Rounded value of investments is less than 0.1% of net assets. |
Footnote* |
% of Net Asset Value includes derivatives instruments, if any, valued at the value used for determining the Fund's net asset value. The notional exposure of such derivatives investments therefore may be greater than what is depicted. | |
| Material Fund Change [Text Block] |
|
| C000088651 |
|
| Shareholder Report [Line Items] |
|
| Fund Name |
PIMCO CommoditiesPLUS<sup style="box-sizing: border-box; color: rgb(0, 0, 0); display: inline; flex-wrap: nowrap; font-size: 15px; font-weight: 700; grid-area: auto; line-height: 0px; margin: 0px; overflow: visible; position: relative; text-align: left; white-space-collapse: preserve-breaks;">®</sup> Strategy Fund
|
| Class Name |
Class C
|
| Trading Symbol |
PCPCX
|
| Annual or Semi-Annual Statement [Text Block] |
This annual shareholder report contains important information about the PIMCO CommoditiesPLUS® Strategy Fund (the "Fund") for the period of April 1, 2024 to March 31, 2025 (the "reporting period").
|
| Shareholder Report Annual or Semi-Annual |
Annual Shareholder Report
|
| Additional Information [Text Block] |
You can find additional information about the Fund at www.pimco.com/literature. You can also request this information by contacting us at 888.87.PIMCO (888.877.4626).
|
| Additional Information Phone Number |
888.87.PIMCO (888.877.4626)
|
| Expenses [Text Block] |
What were the Fund costs for the reporting period?(based on a hypothetical $10,000 investment)
Class Name |
Cost of a $10,000 investment |
Costs paid as a percentage of a $10,000 investment |
Class C |
$205 |
2.02% | |
| Expenses Paid, Amount |
$ 205
|
| Expense Ratio, Percent |
2.02%
|
| Factors Affecting Performance [Text Block] |
How did the Fund perform during the reporting period and what affected its performance?The following affected performance (on a gross basis) during the reporting period: Active commodity strategies within the agriculture sector, including underweight exposure to corn, as well as overweight exposure to coffee, contributed to relative performance versus the UBS Prompt Commodity Index Total Return ("Index"), as corn posted negative returns, while coffee posted positive returns. Overweight exposure to silver contributed to relative performance versus the Index, as silver posted positive returns. Exposure to securitized assets, including collateralized loan obligations, contributed to relative performance versus the Index, as spreads broadly tightened. Duration strategies in the U.S., including overweight exposure to the front-end of the curve, contributed to relative performance versus the Index, as front-end U.S. interest rates fell. Exposure to California Carbon Allowances ("CCAs") detracted from relative performance versus the Index, as CCAs posted negative returns. Overweight exposure to base metals detracted from relative performance versus the Index, as base metals posted positive returns. Underweight exposure to natural gas detracted from relative performance versus the Index, as natural gas posted positive returns.
|
| Performance Past Does Not Indicate Future [Text] |
Performance quoted represents past performance. Past performance is not a guarantee or a reliable indicator of future results.
|
| Line Graph [Table Text Block] |

|
Class C (excluding sales charge) |
S&P 500 Index |
UBS Prompt Commodity Index Total Return |
3/31/15 |
$10,000 |
$10,000 |
$10,000 |
4/30/15 |
$11,019 |
$10,096 |
$11,039 |
5/31/15 |
$10,689 |
$10,226 |
$10,748 |
6/30/15 |
$10,660 |
$10,028 |
$10,778 |
7/31/15 |
$9,337 |
$10,238 |
$9,366 |
8/31/15 |
$9,293 |
$9,620 |
$9,398 |
9/30/15 |
$8,655 |
$9,382 |
$8,859 |
10/31/15 |
$8,829 |
$10,174 |
$8,944 |
11/30/15 |
$8,105 |
$10,204 |
$8,186 |
12/31/15 |
$7,562 |
$10,043 |
$7,630 |
1/31/16 |
$7,113 |
$9,545 |
$7,250 |
2/29/16 |
$6,997 |
$9,532 |
$7,175 |
3/31/16 |
$7,489 |
$10,178 |
$7,575 |
4/30/16 |
$8,286 |
$10,218 |
$8,366 |
5/31/16 |
$8,358 |
$10,401 |
$8,468 |
6/30/16 |
$8,460 |
$10,428 |
$8,586 |
7/31/16 |
$7,953 |
$10,813 |
$7,996 |
8/31/16 |
$8,069 |
$10,828 |
$8,077 |
9/30/16 |
$8,445 |
$10,830 |
$8,435 |
10/31/16 |
$8,387 |
$10,632 |
$8,309 |
11/30/16 |
$8,634 |
$11,026 |
$8,527 |
12/31/16 |
$8,923 |
$11,244 |
$8,813 |
1/31/17 |
$8,981 |
$11,457 |
$8,808 |
2/28/17 |
$9,010 |
$11,912 |
$8,842 |
3/31/17 |
$8,663 |
$11,926 |
$8,522 |
4/30/17 |
$8,445 |
$12,049 |
$8,291 |
5/31/17 |
$8,301 |
$12,218 |
$8,173 |
6/30/17 |
$8,175 |
$12,294 |
$8,054 |
7/31/17 |
$8,615 |
$12,547 |
$8,454 |
8/31/17 |
$8,646 |
$12,586 |
$8,454 |
9/30/17 |
$8,874 |
$12,845 |
$8,672 |
10/31/17 |
$9,239 |
$13,145 |
$8,997 |
11/30/17 |
$9,382 |
$13,548 |
$9,123 |
12/31/17 |
$9,756 |
$13,699 |
$9,487 |
1/31/18 |
$10,068 |
$14,483 |
$9,795 |
2/28/18 |
$9,822 |
$13,949 |
$9,556 |
3/31/18 |
$10,052 |
$13,595 |
$9,749 |
4/30/18 |
$10,463 |
$13,647 |
$10,177 |
5/31/18 |
$10,677 |
$13,976 |
$10,383 |
6/30/18 |
$10,586 |
$14,062 |
$10,311 |
7/31/18 |
$10,275 |
$14,585 |
$9,986 |
8/31/18 |
$10,310 |
$15,060 |
$10,026 |
9/30/18 |
$10,656 |
$15,146 |
$10,350 |
10/31/18 |
$10,080 |
$14,111 |
$9,871 |
11/30/18 |
$8,946 |
$14,398 |
$8,933 |
12/31/18 |
$8,473 |
$13,098 |
$8,401 |
1/31/19 |
$9,199 |
$14,148 |
$9,103 |
2/28/19 |
$9,658 |
$14,602 |
$9,463 |
3/31/19 |
$9,762 |
$14,886 |
$9,557 |
4/30/19 |
$10,050 |
$15,489 |
$9,788 |
5/31/19 |
$9,244 |
$14,504 |
$9,132 |
6/30/19 |
$9,608 |
$15,526 |
$9,519 |
7/31/19 |
$9,627 |
$15,750 |
$9,505 |
8/31/19 |
$9,048 |
$15,500 |
$9,031 |
9/30/19 |
$9,187 |
$15,790 |
$9,208 |
10/31/19 |
$9,362 |
$16,132 |
$9,372 |
11/30/19 |
$9,362 |
$16,718 |
$9,359 |
12/31/19 |
$10,006 |
$17,222 |
$9,989 |
1/31/20 |
$9,073 |
$17,216 |
$9,119 |
2/29/20 |
$8,335 |
$15,798 |
$8,429 |
3/31/20 |
$5,993 |
$13,847 |
$6,380 |
4/30/20 |
$5,740 |
$15,622 |
$5,971 |
5/31/20 |
$6,830 |
$16,366 |
$7,088 |
6/30/20 |
$7,223 |
$16,692 |
$7,477 |
7/31/20 |
$7,612 |
$17,633 |
$7,824 |
8/31/20 |
$8,041 |
$18,900 |
$8,247 |
9/30/20 |
$7,749 |
$18,182 |
$7,962 |
10/31/20 |
$7,418 |
$17,699 |
$7,603 |
11/30/20 |
$8,430 |
$19,636 |
$8,647 |
12/31/20 |
$8,975 |
$20,391 |
$9,181 |
1/31/21 |
$9,384 |
$20,185 |
$9,597 |
2/28/21 |
$10,397 |
$20,742 |
$10,622 |
3/31/21 |
$10,202 |
$21,650 |
$10,429 |
4/30/21 |
$11,010 |
$22,806 |
$11,273 |
5/31/21 |
$11,331 |
$22,965 |
$11,593 |
6/30/21 |
$11,808 |
$23,501 |
$12,099 |
7/31/21 |
$11,994 |
$24,059 |
$12,337 |
8/31/21 |
$11,845 |
$24,791 |
$12,153 |
9/30/21 |
$12,368 |
$23,638 |
$12,767 |
10/31/21 |
$13,024 |
$25,294 |
$13,454 |
11/30/21 |
$11,844 |
$25,119 |
$12,215 |
12/31/21 |
$12,781 |
$26,244 |
$13,159 |
1/31/22 |
$13,961 |
$24,886 |
$14,482 |
2/28/22 |
$14,936 |
$24,141 |
$15,600 |
3/31/22 |
$16,303 |
$25,038 |
$17,043 |
4/30/22 |
$16,899 |
$22,854 |
$17,695 |
5/31/22 |
$17,578 |
$22,896 |
$18,383 |
6/30/22 |
$16,134 |
$21,006 |
$16,986 |
7/31/22 |
$16,224 |
$22,943 |
$17,018 |
8/31/22 |
$15,771 |
$22,007 |
$16,623 |
9/30/22 |
$14,623 |
$19,981 |
$15,568 |
10/31/22 |
$15,298 |
$21,598 |
$16,275 |
11/30/22 |
$15,498 |
$22,805 |
$16,511 |
12/31/22 |
$15,563 |
$21,491 |
$16,511 |
1/31/23 |
$15,758 |
$22,842 |
$16,637 |
2/28/23 |
$15,229 |
$22,284 |
$15,999 |
3/31/23 |
$15,090 |
$23,103 |
$15,881 |
4/30/23 |
$15,062 |
$23,463 |
$15,818 |
5/31/23 |
$14,073 |
$23,565 |
$14,791 |
6/30/23 |
$14,638 |
$25,122 |
$15,335 |
7/31/23 |
$16,051 |
$25,929 |
$16,832 |
8/31/23 |
$16,080 |
$25,516 |
$16,850 |
9/30/23 |
$16,334 |
$24,300 |
$17,217 |
10/31/23 |
$15,882 |
$23,789 |
$16,775 |
11/30/23 |
$15,571 |
$25,961 |
$16,365 |
12/31/23 |
$15,256 |
$27,141 |
$15,992 |
1/31/24 |
$15,630 |
$27,597 |
$16,398 |
2/29/24 |
$15,688 |
$29,070 |
$16,486 |
3/31/24 |
$16,486 |
$30,006 |
$17,356 |
4/30/24 |
$16,716 |
$28,780 |
$17,720 |
5/31/24 |
$16,659 |
$30,207 |
$17,608 |
6/30/24 |
$16,665 |
$31,291 |
$17,648 |
7/31/24 |
$16,074 |
$31,672 |
$16,996 |
8/31/24 |
$15,837 |
$32,440 |
$16,794 |
9/30/24 |
$16,008 |
$33,133 |
$16,979 |
10/31/24 |
$15,977 |
$32,833 |
$16,960 |
11/30/24 |
$15,977 |
$34,760 |
$17,023 |
12/31/24 |
$16,361 |
$33,931 |
$17,438 |
1/31/25 |
$16,829 |
$34,876 |
$18,005 |
2/28/25 |
$16,580 |
$34,421 |
$17,759 |
3/31/25 |
$17,003 |
$32,482 |
$18,268 |
|
| Average Annual Return [Table Text Block] |
Class/Index Name |
1 Year |
5 Years |
10 Years |
Class C (excluding sales charge) |
3.14% |
23.19% |
5.45% |
Class C (including sales charge) |
2.20% |
23.19% |
5.45% |
S&P 500 Index |
8.25% |
18.59% |
12.50% |
UBS Prompt Commodity Index Total Return |
5.26% |
23.42% |
6.21% | |
| No Deduction of Taxes [Text Block] |
Returns shown do not reflect the deduction of taxes that a shareholder would pay on Fund distributions or the redemption of Fund shares.
|
| Performance Table Market Index Changed [Text Block] |
Differences in the Fund’s performance versus an index and related attribution information with respect to particular categories of securities or individual positions may be attributable, in part, to differences in the pricing methodologies used by the Fund and the index.
|
| Updated Performance Information Location [Text Block] |
For performance current to the most recent month-end, visit www.pimco.com/literature or via 888.87.PIMCO (888.877.4626).
|
| AssetsNet |
$ 4,684,149,000
|
| Holdings Count | Holding |
1,079
|
| Advisory Fees Paid, Amount |
$ 22,011,000
|
| InvestmentCompanyPortfolioTurnover |
201.00%
|
| Additional Fund Statistics [Text Block] |
Key Fund StatisticsFootnote Reference† (as of the end of the reporting period)
Total Net Assets |
$4,684,149 |
# of Portfolio Holdings |
1,079 |
Portfolio Turnover Rate |
201% |
Total Net Advisory Fees Paid During the Reporting Period |
$22,011 |
| Footnote |
Description |
Footnote† |
Dollar amounts displayed in 000's | |
| Holdings [Text Block] |
Security Type Breakdown (% of Net Asset Value)Footnote Reference*
Asset-Backed Securities |
17.0% |
Commodities |
14.8% |
Corporate Bonds & Notes |
11.5% |
U.S. Government Agencies |
11.0% |
U.S. Treasury Obligations |
3.2% |
Sovereign Issues |
2.3% |
Non-Agency Mortgage-Backed Securities |
2.2% |
Other Investments |
0.0%Footnote Reference^ |
Short-Term Instruments |
51.4% |
Affiliated Investments |
5.3% |
Financial Derivative Instruments |
1.5% |
Other Assets and Liabilities, Net |
(20.2%) |
Total |
100.0% |
| Footnote |
Description |
Footnote^ |
Rounded value of investments is less than 0.1% of net assets. |
Footnote* |
% of Net Asset Value includes derivatives instruments, if any, valued at the value used for determining the Fund's net asset value. The notional exposure of such derivatives investments therefore may be greater than what is depicted. | |
| Material Fund Change [Text Block] |
|
| C000200462 |
|
| Shareholder Report [Line Items] |
|
| Fund Name |
PIMCO CommoditiesPLUS<sup style="box-sizing: border-box; color: rgb(0, 0, 0); display: inline; flex-wrap: nowrap; font-size: 15px; font-weight: 700; grid-area: auto; line-height: 0px; margin: 0px; overflow: visible; position: relative; text-align: left; white-space-collapse: preserve-breaks;">®</sup> Strategy Fund
|
| Class Name |
I-3
|
| Trading Symbol |
PCLNX
|
| Annual or Semi-Annual Statement [Text Block] |
This annual shareholder report contains important information about the PIMCO CommoditiesPLUS® Strategy Fund (the "Fund") for the period of April 1, 2024 to March 31, 2025 (the "reporting period").
|
| Shareholder Report Annual or Semi-Annual |
Annual Shareholder Report
|
| Additional Information [Text Block] |
You can find additional information about the Fund at www.pimco.com/literature. You can also request this information by contacting us at 888.87.PIMCO (888.877.4626).
|
| Additional Information Phone Number |
888.87.PIMCO (888.877.4626)
|
| Expenses [Text Block] |
What were the Fund costs for the reporting period?(based on a hypothetical $10,000 investment)
Class Name |
Cost of a $10,000 investment |
Costs paid as a percentage of a $10,000 investment |
I-3 |
$99 |
0.97% | |
| Expenses Paid, Amount |
$ 99
|
| Expense Ratio, Percent |
0.97%
|
| Factors Affecting Performance [Text Block] |
How did the Fund perform during the reporting period and what affected its performance?The following affected performance (on a gross basis) during the reporting period: Active commodity strategies within the agriculture sector, including underweight exposure to corn, as well as overweight exposure to coffee, contributed to relative performance versus the UBS Prompt Commodity Index Total Return ("Index"), as corn posted negative returns, while coffee posted positive returns. Overweight exposure to silver contributed to relative performance versus the Index, as silver posted positive returns. Exposure to securitized assets, including collateralized loan obligations, contributed to relative performance versus the Index, as spreads broadly tightened. Duration strategies in the U.S., including overweight exposure to the front-end of the curve, contributed to relative performance versus the Index, as front-end U.S. interest rates fell. Exposure to California Carbon Allowances ("CCAs") detracted from relative performance versus the Index, as CCAs posted negative returns. Overweight exposure to base metals detracted from relative performance versus the Index, as base metals posted positive returns. Underweight exposure to natural gas detracted from relative performance versus the Index, as natural gas posted positive returns.
|
| Performance Past Does Not Indicate Future [Text] |
Performance quoted represents past performance. Past performance is not a guarantee or a reliable indicator of future results.
|
| Line Graph [Table Text Block] |

|
I-3 |
S&P 500 Index |
UBS Prompt Commodity Index Total Return |
3/31/15 |
$1,000,000 |
$1,000,000 |
$1,000,000 |
4/30/15 |
$1,100,978 |
$1,009,593 |
$1,103,873 |
5/31/15 |
$1,070,372 |
$1,022,576 |
$1,074,822 |
6/30/15 |
$1,068,583 |
$1,002,781 |
$1,077,753 |
7/31/15 |
$934,884 |
$1,023,790 |
$936,551 |
8/31/15 |
$931,988 |
$962,021 |
$939,768 |
9/30/15 |
$868,761 |
$938,217 |
$885,889 |
10/31/15 |
$886,893 |
$1,017,360 |
$894,412 |
11/30/15 |
$816,624 |
$1,020,385 |
$818,552 |
12/31/15 |
$762,415 |
$1,004,292 |
$762,979 |
1/31/16 |
$717,229 |
$954,455 |
$725,002 |
2/29/16 |
$707,284 |
$953,167 |
$717,486 |
3/31/16 |
$756,500 |
$1,017,828 |
$757,514 |
4/30/16 |
$838,112 |
$1,021,774 |
$836,616 |
5/31/16 |
$845,049 |
$1,040,123 |
$846,843 |
6/30/16 |
$857,722 |
$1,042,818 |
$858,601 |
7/31/16 |
$805,419 |
$1,081,265 |
$799,584 |
8/31/16 |
$818,008 |
$1,082,784 |
$807,729 |
9/30/16 |
$858,806 |
$1,082,988 |
$843,465 |
10/31/16 |
$853,055 |
$1,063,233 |
$830,904 |
11/30/16 |
$878,331 |
$1,102,610 |
$852,719 |
12/31/16 |
$907,824 |
$1,124,405 |
$881,252 |
1/31/17 |
$916,165 |
$1,145,730 |
$880,773 |
2/28/17 |
$918,878 |
$1,191,223 |
$884,185 |
3/31/17 |
$884,202 |
$1,192,612 |
$852,160 |
4/30/17 |
$862,872 |
$1,204,860 |
$829,127 |
5/31/17 |
$848,617 |
$1,221,816 |
$817,310 |
6/30/17 |
$836,859 |
$1,229,442 |
$805,369 |
7/31/17 |
$882,749 |
$1,254,723 |
$845,391 |
8/31/17 |
$887,089 |
$1,258,564 |
$845,403 |
9/30/17 |
$911,461 |
$1,284,525 |
$867,222 |
10/31/17 |
$948,546 |
$1,314,500 |
$899,693 |
11/30/17 |
$965,476 |
$1,354,816 |
$912,263 |
12/31/17 |
$1,004,724 |
$1,369,880 |
$948,717 |
1/31/18 |
$1,036,744 |
$1,448,311 |
$979,501 |
2/28/18 |
$1,012,517 |
$1,394,930 |
$955,592 |
3/31/18 |
$1,037,461 |
$1,359,480 |
$974,890 |
4/30/18 |
$1,080,793 |
$1,364,697 |
$1,017,724 |
5/31/18 |
$1,103,411 |
$1,397,561 |
$1,038,345 |
6/30/18 |
$1,093,540 |
$1,406,163 |
$1,031,075 |
7/31/18 |
$1,063,070 |
$1,458,492 |
$998,642 |
8/31/18 |
$1,068,148 |
$1,506,017 |
$1,002,617 |
9/30/18 |
$1,103,679 |
$1,514,589 |
$1,035,015 |
10/31/18 |
$1,045,312 |
$1,411,067 |
$987,111 |
11/30/18 |
$928,576 |
$1,439,822 |
$893,278 |
12/31/18 |
$879,587 |
$1,309,819 |
$840,103 |
1/31/19 |
$956,645 |
$1,414,783 |
$910,333 |
2/28/19 |
$1,005,511 |
$1,460,209 |
$946,295 |
3/31/19 |
$1,017,817 |
$1,488,583 |
$955,689 |
4/30/19 |
$1,048,031 |
$1,548,856 |
$978,843 |
5/31/19 |
$964,944 |
$1,450,428 |
$913,193 |
6/30/19 |
$1,004,680 |
$1,552,649 |
$951,876 |
7/31/19 |
$1,006,583 |
$1,574,964 |
$950,481 |
8/31/19 |
$947,596 |
$1,550,016 |
$903,112 |
9/30/19 |
$963,897 |
$1,579,018 |
$920,803 |
10/31/19 |
$981,178 |
$1,613,219 |
$937,221 |
11/30/19 |
$981,178 |
$1,671,777 |
$935,942 |
12/31/19 |
$1,049,776 |
$1,722,235 |
$998,876 |
1/31/20 |
$953,467 |
$1,721,559 |
$911,889 |
2/29/20 |
$876,419 |
$1,579,842 |
$842,933 |
3/31/20 |
$632,573 |
$1,384,711 |
$637,991 |
4/30/20 |
$603,556 |
$1,562,223 |
$597,074 |
5/31/20 |
$719,624 |
$1,636,628 |
$708,827 |
6/30/20 |
$761,758 |
$1,669,176 |
$747,675 |
7/31/20 |
$804,401 |
$1,763,293 |
$782,429 |
8/31/20 |
$850,921 |
$1,890,039 |
$824,720 |
9/30/20 |
$821,063 |
$1,818,224 |
$796,199 |
10/31/20 |
$784,183 |
$1,769,870 |
$760,320 |
11/30/20 |
$892,882 |
$1,963,607 |
$864,721 |
12/31/20 |
$953,555 |
$2,039,105 |
$918,095 |
1/31/21 |
$998,222 |
$2,018,518 |
$959,685 |
2/28/21 |
$1,105,036 |
$2,074,179 |
$1,062,177 |
3/31/21 |
$1,084,644 |
$2,165,019 |
$1,042,880 |
4/30/21 |
$1,172,037 |
$2,280,563 |
$1,127,329 |
5/31/21 |
$1,207,966 |
$2,296,491 |
$1,159,290 |
6/30/21 |
$1,260,807 |
$2,350,103 |
$1,209,899 |
7/31/21 |
$1,281,849 |
$2,405,929 |
$1,233,749 |
8/31/21 |
$1,266,067 |
$2,479,083 |
$1,215,251 |
9/30/21 |
$1,323,144 |
$2,363,781 |
$1,276,744 |
10/31/21 |
$1,395,669 |
$2,529,392 |
$1,345,440 |
11/30/21 |
$1,268,308 |
$2,511,866 |
$1,221,538 |
12/31/21 |
$1,371,030 |
$2,624,438 |
$1,315,853 |
1/31/22 |
$1,498,403 |
$2,488,631 |
$1,448,176 |
2/28/22 |
$1,604,547 |
$2,414,118 |
$1,560,016 |
3/31/22 |
$1,753,188 |
$2,503,753 |
$1,704,321 |
4/30/22 |
$1,820,397 |
$2,285,421 |
$1,769,459 |
5/31/22 |
$1,893,366 |
$2,289,614 |
$1,838,298 |
6/30/22 |
$1,739,648 |
$2,100,621 |
$1,698,572 |
7/31/22 |
$1,750,102 |
$2,294,307 |
$1,701,820 |
8/31/22 |
$1,704,102 |
$2,200,741 |
$1,662,348 |
9/30/22 |
$1,580,630 |
$1,998,056 |
$1,556,755 |
10/31/22 |
$1,655,789 |
$2,159,821 |
$1,627,524 |
11/30/22 |
$1,678,565 |
$2,280,521 |
$1,651,058 |
12/31/22 |
$1,686,253 |
$2,149,130 |
$1,651,124 |
1/31/23 |
$1,711,234 |
$2,284,168 |
$1,663,664 |
2/28/23 |
$1,653,777 |
$2,228,437 |
$1,599,917 |
3/31/23 |
$1,641,493 |
$2,310,252 |
$1,588,110 |
4/30/23 |
$1,638,960 |
$2,346,311 |
$1,581,811 |
5/31/23 |
$1,532,567 |
$2,356,510 |
$1,479,141 |
6/30/23 |
$1,593,363 |
$2,512,217 |
$1,533,521 |
7/31/23 |
$1,750,420 |
$2,592,922 |
$1,683,176 |
8/31/23 |
$1,755,486 |
$2,551,639 |
$1,684,968 |
9/30/23 |
$1,784,089 |
$2,429,982 |
$1,721,668 |
10/31/23 |
$1,738,343 |
$2,378,888 |
$1,677,506 |
11/30/23 |
$1,705,304 |
$2,596,140 |
$1,636,490 |
12/31/23 |
$1,671,462 |
$2,714,085 |
$1,599,203 |
1/31/24 |
$1,715,447 |
$2,759,693 |
$1,639,802 |
2/29/24 |
$1,723,210 |
$2,907,048 |
$1,648,587 |
3/31/24 |
$1,808,274 |
$3,000,582 |
$1,735,565 |
4/30/24 |
$1,839,406 |
$2,878,024 |
$1,771,963 |
5/31/24 |
$1,831,623 |
$3,020,730 |
$1,760,799 |
6/30/24 |
$1,835,284 |
$3,129,120 |
$1,764,777 |
7/31/24 |
$1,768,980 |
$3,167,209 |
$1,699,553 |
8/31/24 |
$1,747,763 |
$3,244,035 |
$1,679,375 |
9/30/24 |
$1,766,682 |
$3,313,318 |
$1,697,916 |
10/31/24 |
$1,763,960 |
$3,283,271 |
$1,696,007 |
11/30/24 |
$1,766,682 |
$3,476,003 |
$1,702,287 |
12/31/24 |
$1,811,133 |
$3,393,141 |
$1,743,837 |
1/31/25 |
$1,864,073 |
$3,487,632 |
$1,800,531 |
2/28/25 |
$1,838,996 |
$3,442,124 |
$1,775,866 |
3/31/25 |
$1,885,595 |
$3,248,180 |
$1,826,777 |
|
| Average Annual Return [Table Text Block] |
Class/Index Name |
1 Year |
5 Years |
10 Years |
I-3 |
4.28% |
24.41% |
6.55% |
S&P 500 Index |
8.25% |
18.59% |
12.50% |
UBS Prompt Commodity Index Total Return |
5.26% |
23.42% |
6.21% | |
| No Deduction of Taxes [Text Block] |
Returns shown do not reflect the deduction of taxes that a shareholder would pay on Fund distributions or the redemption of Fund shares.
|
| Performance Table Market Index Changed [Text Block] |
Differences in the Fund’s performance versus an index and related attribution information with respect to particular categories of securities or individual positions may be attributable, in part, to differences in the pricing methodologies used by the Fund and the index.
|
| Updated Performance Information Location [Text Block] |
For performance current to the most recent month-end, visit www.pimco.com/literature or via 888.87.PIMCO (888.877.4626).
|
| AssetsNet |
$ 4,684,149,000
|
| Holdings Count | Holding |
1,079
|
| Advisory Fees Paid, Amount |
$ 22,011,000
|
| InvestmentCompanyPortfolioTurnover |
201.00%
|
| Additional Fund Statistics [Text Block] |
Key Fund StatisticsFootnote Reference† (as of the end of the reporting period)
Total Net Assets |
$4,684,149 |
# of Portfolio Holdings |
1,079 |
Portfolio Turnover Rate |
201% |
Total Net Advisory Fees Paid During the Reporting Period |
$22,011 |
| Footnote |
Description |
Footnote† |
Dollar amounts displayed in 000's | |
| Holdings [Text Block] |
Security Type Breakdown (% of Net Asset Value)Footnote Reference*
Asset-Backed Securities |
17.0% |
Commodities |
14.8% |
Corporate Bonds & Notes |
11.5% |
U.S. Government Agencies |
11.0% |
U.S. Treasury Obligations |
3.2% |
Sovereign Issues |
2.3% |
Non-Agency Mortgage-Backed Securities |
2.2% |
Other Investments |
0.0%Footnote Reference^ |
Short-Term Instruments |
51.4% |
Affiliated Investments |
5.3% |
Financial Derivative Instruments |
1.5% |
Other Assets and Liabilities, Net |
(20.2%) |
Total |
100.0% |
| Footnote |
Description |
Footnote^ |
Rounded value of investments is less than 0.1% of net assets. |
Footnote* |
% of Net Asset Value includes derivatives instruments, if any, valued at the value used for determining the Fund's net asset value. The notional exposure of such derivatives investments therefore may be greater than what is depicted. | |
| Material Fund Change [Text Block] |
|
| C000088655 |
|
| Shareholder Report [Line Items] |
|
| Fund Name |
PIMCO CommoditiesPLUS<sup style="box-sizing: border-box; color: rgb(0, 0, 0); display: inline; flex-wrap: nowrap; font-size: 15px; font-weight: 700; grid-area: auto; line-height: 0px; margin: 0px; overflow: visible; position: relative; text-align: left; white-space-collapse: preserve-breaks;">®</sup> Strategy Fund
|
| Class Name |
Institutional Class
|
| Trading Symbol |
PCLIX
|
| Annual or Semi-Annual Statement [Text Block] |
This annual shareholder report contains important information about the PIMCO CommoditiesPLUS® Strategy Fund (the "Fund") for the period of April 1, 2024 to March 31, 2025 (the "reporting period").
|
| Shareholder Report Annual or Semi-Annual |
Annual Shareholder Report
|
| Additional Information [Text Block] |
You can find additional information about the Fund at www.pimco.com/literature. You can also request this information by contacting us at 888.87.PIMCO (888.877.4626).
|
| Additional Information Phone Number |
888.87.PIMCO (888.877.4626)
|
| Expenses [Text Block] |
What were the Fund costs for the reporting period?(based on a hypothetical $10,000 investment)
Class Name |
Cost of a $10,000 investment |
Costs paid as a percentage of a $10,000 investment |
Institutional Class |
$84 |
0.82% | |
| Expenses Paid, Amount |
$ 84
|
| Expense Ratio, Percent |
0.82%
|
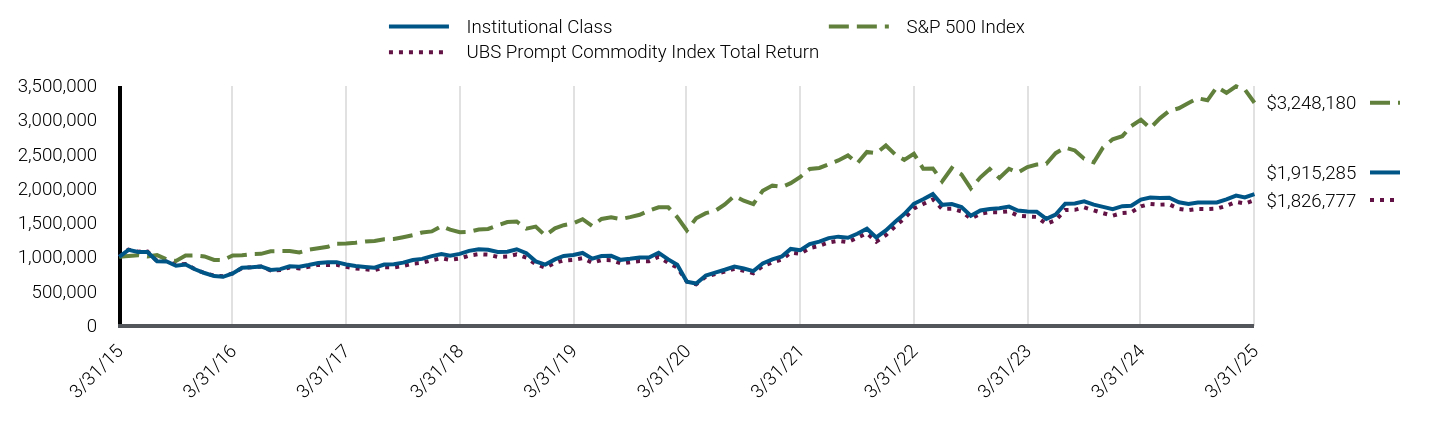
| Factors Affecting Performance [Text Block] |
How did the Fund perform during the reporting period and what affected its performance?The following affected performance (on a gross basis) during the reporting period: Active commodity strategies within the agriculture sector, including underweight exposure to corn, as well as overweight exposure to coffee, contributed to relative performance versus the UBS Prompt Commodity Index Total Return ("Index"), as corn posted negative returns, while coffee posted positive returns. Overweight exposure to silver contributed to relative performance versus the Index, as silver posted positive returns. Exposure to securitized assets, including collateralized loan obligations, contributed to relative performance versus the Index, as spreads broadly tightened. Duration strategies in the U.S., including overweight exposure to the front-end of the curve, contributed to relative performance versus the Index, as front-end U.S. interest rates fell. Exposure to California Carbon Allowances ("CCAs") detracted from relative performance versus the Index, as CCAs posted negative returns. Overweight exposure to base metals detracted from relative performance versus the Index, as base metals posted positive returns. Underweight exposure to natural gas detracted from relative performance versus the Index, as natural gas posted positive returns.
|
| Performance Past Does Not Indicate Future [Text] |
Performance quoted represents past performance. Past performance is not a guarantee or a reliable indicator of future results.
|
| Line Graph [Table Text Block] |
|
Institutional Class |
S&P 500 Index |
UBS Prompt Commodity Index Total Return |
3/31/15 |
$1,000,000 |
$1,000,000 |
$1,000,000 |
4/30/15 |
$1,101,108 |
$1,009,593 |
$1,103,873 |
5/31/15 |
$1,070,637 |
$1,022,576 |
$1,074,822 |
6/30/15 |
$1,068,979 |
$1,002,781 |
$1,077,753 |
7/31/15 |
$935,357 |
$1,023,790 |
$936,551 |
8/31/15 |
$932,573 |
$962,021 |
$939,768 |
9/30/15 |
$869,415 |
$938,217 |
$885,889 |
10/31/15 |
$887,674 |
$1,017,360 |
$894,412 |
11/30/15 |
$817,447 |
$1,020,385 |
$818,552 |
12/31/15 |
$763,282 |
$1,004,292 |
$762,979 |
1/31/16 |
$718,134 |
$954,455 |
$725,002 |
2/29/16 |
$708,258 |
$953,167 |
$717,486 |
3/31/16 |
$757,638 |
$1,017,828 |
$757,514 |
4/30/16 |
$839,469 |
$1,021,774 |
$836,616 |
5/31/16 |
$846,523 |
$1,040,123 |
$846,843 |
6/30/16 |
$859,324 |
$1,042,818 |
$858,601 |
7/31/16 |
$807,029 |
$1,081,265 |
$799,584 |
8/31/16 |
$819,749 |
$1,082,784 |
$807,729 |
9/30/16 |
$860,737 |
$1,082,988 |
$843,465 |
10/31/16 |
$855,083 |
$1,063,233 |
$830,904 |
11/30/16 |
$880,524 |
$1,102,610 |
$852,719 |
12/31/16 |
$910,205 |
$1,124,405 |
$881,252 |
1/31/17 |
$918,685 |
$1,145,730 |
$880,773 |
2/28/17 |
$921,511 |
$1,191,223 |
$884,185 |
3/31/17 |
$886,848 |
$1,192,612 |
$852,160 |
4/30/17 |
$865,564 |
$1,204,860 |
$829,127 |
5/31/17 |
$851,374 |
$1,221,816 |
$817,310 |
6/30/17 |
$839,680 |
$1,229,442 |
$805,369 |
7/31/17 |
$885,832 |
$1,254,723 |
$845,391 |
8/31/17 |
$890,299 |
$1,258,564 |
$845,403 |
9/30/17 |
$914,870 |
$1,284,525 |
$867,222 |
10/31/17 |
$952,212 |
$1,314,500 |
$899,693 |
11/30/17 |
$969,327 |
$1,354,816 |
$912,263 |
12/31/17 |
$1,008,856 |
$1,369,880 |
$948,717 |
1/31/18 |
$1,041,139 |
$1,448,311 |
$979,501 |
2/28/18 |
$1,016,926 |
$1,394,930 |
$955,592 |
3/31/18 |
$1,042,109 |
$1,359,480 |
$974,890 |
4/30/18 |
$1,085,732 |
$1,364,697 |
$1,017,724 |
5/31/18 |
$1,108,351 |
$1,397,561 |
$1,038,345 |
6/30/18 |
$1,101,304 |
$1,406,163 |
$1,031,075 |
7/31/18 |
$1,069,162 |
$1,458,492 |
$998,642 |
8/31/18 |
$1,074,237 |
$1,506,017 |
$1,002,617 |
9/30/18 |
$1,109,761 |
$1,514,589 |
$1,035,015 |
10/31/18 |
$1,051,446 |
$1,411,067 |
$987,111 |
11/30/18 |
$933,048 |
$1,439,822 |
$893,278 |
12/31/18 |
$886,423 |
$1,309,819 |
$840,103 |
1/31/19 |
$961,544 |
$1,414,783 |
$910,333 |
2/28/19 |
$1,012,250 |
$1,460,209 |
$946,295 |
3/31/19 |
$1,024,910 |
$1,488,583 |
$955,689 |
4/30/19 |
$1,055,110 |
$1,548,856 |
$978,843 |
5/31/19 |
$972,060 |
$1,450,428 |
$913,193 |
6/30/19 |
$1,010,197 |
$1,552,649 |
$951,876 |
7/31/19 |
$1,014,002 |
$1,574,964 |
$950,481 |
8/31/19 |
$955,026 |
$1,550,016 |
$903,112 |
9/30/19 |
$969,797 |
$1,579,018 |
$920,803 |
10/31/19 |
$989,001 |
$1,613,219 |
$937,221 |
11/30/19 |
$989,001 |
$1,671,777 |
$935,942 |
12/31/19 |
$1,058,010 |
$1,722,235 |
$998,876 |
1/31/20 |
$961,652 |
$1,721,559 |
$911,889 |
2/29/20 |
$884,566 |
$1,579,842 |
$842,933 |
3/31/20 |
$637,023 |
$1,384,711 |
$637,991 |
4/30/20 |
$609,916 |
$1,562,223 |
$597,074 |
5/31/20 |
$726,090 |
$1,636,628 |
$708,827 |
6/30/20 |
$768,395 |
$1,669,176 |
$747,675 |
7/31/20 |
$811,084 |
$1,763,293 |
$782,429 |
8/31/20 |
$857,653 |
$1,890,039 |
$824,720 |
9/30/20 |
$828,139 |
$1,818,224 |
$796,199 |
10/31/20 |
$791,203 |
$1,769,870 |
$760,320 |
11/30/20 |
$902,010 |
$1,963,607 |
$864,721 |
12/31/20 |
$961,233 |
$2,039,105 |
$918,095 |
1/31/21 |
$1,005,987 |
$2,018,518 |
$959,685 |
2/28/21 |
$1,114,952 |
$2,074,179 |
$1,062,177 |
3/31/21 |
$1,095,494 |
$2,165,019 |
$1,042,880 |
4/30/21 |
$1,184,029 |
$2,280,563 |
$1,127,329 |
5/31/21 |
$1,220,027 |
$2,296,491 |
$1,159,290 |
6/30/21 |
$1,272,827 |
$2,350,103 |
$1,209,899 |
7/31/21 |
$1,293,779 |
$2,405,929 |
$1,233,749 |
8/31/21 |
$1,278,065 |
$2,479,083 |
$1,215,251 |
9/30/21 |
$1,336,146 |
$2,363,781 |
$1,276,744 |
10/31/21 |
$1,408,417 |
$2,529,392 |
$1,345,440 |
11/30/21 |
$1,281,501 |
$2,511,866 |
$1,221,538 |
12/31/21 |
$1,384,497 |
$2,624,438 |
$1,315,853 |
1/31/22 |
$1,515,010 |
$2,488,631 |
$1,448,176 |
2/28/22 |
$1,622,595 |
$2,414,118 |
$1,560,016 |
3/31/22 |
$1,772,878 |
$2,503,753 |
$1,704,321 |
4/30/22 |
$1,839,815 |
$2,285,421 |
$1,769,459 |
5/31/22 |
$1,914,402 |
$2,289,614 |
$1,838,298 |
6/30/22 |
$1,757,821 |
$2,100,621 |
$1,698,572 |
7/31/22 |
$1,770,303 |
$2,294,307 |
$1,701,820 |
8/31/22 |
$1,724,537 |
$2,200,741 |
$1,662,348 |
9/30/22 |
$1,598,506 |
$1,998,056 |
$1,556,755 |
10/31/22 |
$1,675,488 |
$2,159,821 |
$1,627,524 |
11/30/22 |
$1,698,130 |
$2,280,521 |
$1,651,058 |
12/31/22 |
$1,707,196 |
$2,149,130 |
$1,651,124 |
1/31/23 |
$1,732,010 |
$2,284,168 |
$1,663,664 |
2/28/23 |
$1,674,938 |
$2,228,437 |
$1,599,917 |
3/31/23 |
$1,660,818 |
$2,310,252 |
$1,588,110 |
4/30/23 |
$1,658,301 |
$2,346,311 |
$1,581,811 |
5/31/23 |
$1,552,613 |
$2,356,510 |
$1,479,141 |
6/30/23 |
$1,615,523 |
$2,512,217 |
$1,533,521 |
7/31/23 |
$1,774,055 |
$2,592,922 |
$1,683,176 |
8/31/23 |
$1,779,088 |
$2,551,639 |
$1,684,968 |
9/30/23 |
$1,808,498 |
$2,429,982 |
$1,721,668 |
10/31/23 |
$1,760,507 |
$2,378,888 |
$1,677,506 |
11/30/23 |
$1,727,672 |
$2,596,140 |
$1,636,490 |
12/31/23 |
$1,694,359 |
$2,714,085 |
$1,599,203 |
1/31/24 |
$1,738,068 |
$2,759,693 |
$1,639,802 |
2/29/24 |
$1,745,781 |
$2,907,048 |
$1,648,587 |
3/31/24 |
$1,833,352 |
$3,000,582 |
$1,735,565 |
4/30/24 |
$1,864,295 |
$2,878,024 |
$1,771,963 |
5/31/24 |
$1,856,559 |
$3,020,730 |
$1,760,799 |
6/30/24 |
$1,860,705 |
$3,129,120 |
$1,764,777 |
7/31/24 |
$1,794,816 |
$3,167,209 |
$1,699,553 |
8/31/24 |
$1,771,096 |
$3,244,035 |
$1,679,375 |
9/30/24 |
$1,793,261 |
$3,313,318 |
$1,697,916 |
10/31/24 |
$1,790,556 |
$3,283,271 |
$1,696,007 |
11/30/24 |
$1,793,261 |
$3,476,003 |
$1,702,287 |
12/31/24 |
$1,838,027 |
$3,393,141 |
$1,743,837 |
1/31/25 |
$1,893,389 |
$3,487,632 |
$1,800,531 |
2/28/25 |
$1,865,708 |
$3,442,124 |
$1,775,866 |
3/31/25 |
$1,915,285 |
$3,248,180 |
$1,826,777 |
|
| Average Annual Return [Table Text Block] |
Class/Index Name |
1 Year |
5 Years |
10 Years |
Institutional Class |
4.47% |
24.63% |
6.71% |
S&P 500 Index |
8.25% |
18.59% |
12.50% |
UBS Prompt Commodity Index Total Return |
5.26% |
23.42% |
6.21% | |
| No Deduction of Taxes [Text Block] |
Returns shown do not reflect the deduction of taxes that a shareholder would pay on Fund distributions or the redemption of Fund shares.
|
| Performance Table Market Index Changed [Text Block] |
Differences in the Fund’s performance versus an index and related attribution information with respect to particular categories of securities or individual positions may be attributable, in part, to differences in the pricing methodologies used by the Fund and the index.
|
| Updated Performance Information Location [Text Block] |
For performance current to the most recent month-end, visit www.pimco.com/literature or via 888.87.PIMCO (888.877.4626).
|
| AssetsNet |
$ 4,684,149,000
|
| Holdings Count | Holding |
1,079
|
| Advisory Fees Paid, Amount |
$ 22,011,000
|
| InvestmentCompanyPortfolioTurnover |
201.00%
|
| Additional Fund Statistics [Text Block] |
Key Fund StatisticsFootnote Reference† (as of the end of the reporting period)
Total Net Assets |
$4,684,149 |
# of Portfolio Holdings |
1,079 |
Portfolio Turnover Rate |
201% |
Total Net Advisory Fees Paid During the Reporting Period |
$22,011 |
| Footnote |
Description |
Footnote† |
Dollar amounts displayed in 000's | |
| Holdings [Text Block] |
Security Type Breakdown (% of Net Asset Value)Footnote Reference*
Asset-Backed Securities |
17.0% |
Commodities |
14.8% |
Corporate Bonds & Notes |
11.5% |
U.S. Government Agencies |
11.0% |
U.S. Treasury Obligations |
3.2% |
Sovereign Issues |
2.3% |
Non-Agency Mortgage-Backed Securities |
2.2% |
Other Investments |
0.0%Footnote Reference^ |
Short-Term Instruments |
51.4% |
Affiliated Investments |
5.3% |
Financial Derivative Instruments |
1.5% |
Other Assets and Liabilities, Net |
(20.2%) |
Total |
100.0% |
| Footnote |
Description |
Footnote^ |
Rounded value of investments is less than 0.1% of net assets. |
Footnote* |
% of Net Asset Value includes derivatives instruments, if any, valued at the value used for determining the Fund's net asset value. The notional exposure of such derivatives investments therefore may be greater than what is depicted. | |
| Material Fund Change [Text Block] |
|
| C000088654 |
|
| Shareholder Report [Line Items] |
|
| Fund Name |
PIMCO CommoditiesPLUS<sup style="box-sizing: border-box; color: rgb(0, 0, 0); display: inline; flex-wrap: nowrap; font-size: 15px; font-weight: 700; grid-area: auto; line-height: 0px; margin: 0px; overflow: visible; position: relative; text-align: left; white-space-collapse: preserve-breaks;">®</sup> Strategy Fund
|
| Class Name |
I-2
|
| Trading Symbol |
PCLPX
|
| Annual or Semi-Annual Statement [Text Block] |
This annual shareholder report contains important information about the PIMCO CommoditiesPLUS® Strategy Fund (the "Fund") for the period of April 1, 2024 to March 31, 2025 (the "reporting period").
|
| Shareholder Report Annual or Semi-Annual |
Annual Shareholder Report
|
| Additional Information [Text Block] |
You can find additional information about the Fund at www.pimco.com/literature. You can also request this information by contacting us at 888.87.PIMCO (888.877.4626).
|
| Additional Information Phone Number |
888.87.PIMCO (888.877.4626)
|
| Expenses [Text Block] |
What were the Fund costs for the reporting period?(based on a hypothetical $10,000 investment)
Class Name |
Cost of a $10,000 investment |
Costs paid as a percentage of a $10,000 investment |
I-2 |
$94 |
0.92% | |
| Expenses Paid, Amount |
$ 94
|
| Expense Ratio, Percent |
0.92%
|
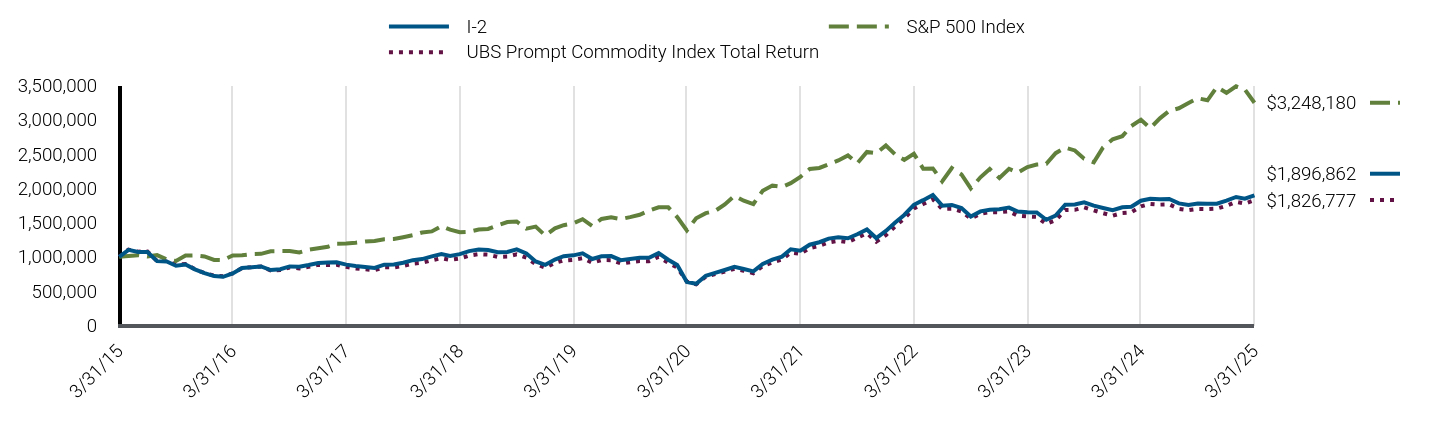
| Factors Affecting Performance [Text Block] |
How did the Fund perform during the reporting period and what affected its performance?The following affected performance (on a gross basis) during the reporting period: Active commodity strategies within the agriculture sector, including underweight exposure to corn, as well as overweight exposure to coffee, contributed to relative performance versus the UBS Prompt Commodity Index Total Return ("Index"), as corn posted negative returns, while coffee posted positive returns. Overweight exposure to silver contributed to relative performance versus the Index, as silver posted positive returns. Exposure to securitized assets, including collateralized loan obligations, contributed to relative performance versus the Index, as spreads broadly tightened. Duration strategies in the U.S., including overweight exposure to the front-end of the curve, contributed to relative performance versus the Index, as front-end U.S. interest rates fell. Exposure to California Carbon Allowances ("CCAs") detracted from relative performance versus the Index, as CCAs posted negative returns. Overweight exposure to base metals detracted from relative performance versus the Index, as base metals posted positive returns. Underweight exposure to natural gas detracted from relative performance versus the Index, as natural gas posted positive returns.
|
| Performance Past Does Not Indicate Future [Text] |
Performance quoted represents past performance. Past performance is not a guarantee or a reliable indicator of future results.
|
| Line Graph [Table Text Block] |
|
I-2 |
S&P 500 Index |
UBS Prompt Commodity Index Total Return |
3/31/15 |
$1,000,000 |
$1,000,000 |
$1,000,000 |
4/30/15 |
$1,101,671 |
$1,009,593 |
$1,103,873 |
5/31/15 |
$1,069,638 |
$1,022,576 |
$1,074,822 |
6/30/15 |
$1,069,184 |
$1,002,781 |
$1,077,753 |
7/31/15 |
$936,236 |
$1,023,790 |
$936,551 |
8/31/15 |
$932,037 |
$962,021 |
$939,768 |
9/30/15 |
$869,681 |
$938,217 |
$885,889 |
10/31/15 |
$888,035 |
$1,017,360 |
$894,412 |
11/30/15 |
$816,032 |
$1,020,385 |
$818,552 |
12/31/15 |
$762,559 |
$1,004,292 |
$762,979 |
1/31/16 |
$718,701 |
$954,455 |
$725,002 |
2/29/16 |
$707,383 |
$953,167 |
$717,486 |
3/31/16 |
$756,900 |
$1,017,828 |
$757,514 |
4/30/16 |
$837,541 |
$1,021,774 |
$836,616 |
5/31/16 |
$846,030 |
$1,040,123 |
$846,843 |
6/30/16 |
$858,726 |
$1,042,818 |
$858,601 |
7/31/16 |
$806,295 |
$1,081,265 |
$799,584 |
8/31/16 |
$819,049 |
$1,082,784 |
$807,729 |
9/30/16 |
$858,726 |
$1,082,988 |
$843,465 |
10/31/16 |
$854,475 |
$1,063,233 |
$830,904 |
11/30/16 |
$879,981 |
$1,102,610 |
$852,719 |
12/31/16 |
$909,739 |
$1,124,405 |
$881,252 |
1/31/17 |
$916,824 |
$1,145,730 |
$880,773 |
2/28/17 |
$919,659 |
$1,191,223 |
$884,185 |
3/31/17 |
$885,503 |
$1,192,612 |
$852,160 |
4/30/17 |
$864,182 |
$1,204,860 |
$829,127 |
5/31/17 |
$849,969 |
$1,221,816 |
$817,310 |
6/30/17 |
$838,071 |
$1,229,442 |
$805,369 |
7/31/17 |
$884,300 |
$1,254,723 |
$845,391 |
8/31/17 |
$887,282 |
$1,258,564 |
$845,403 |
9/30/17 |
$913,123 |
$1,284,525 |
$867,222 |
10/31/17 |
$950,521 |
$1,314,500 |
$899,693 |
11/30/17 |
$966,103 |
$1,354,816 |
$912,263 |
12/31/17 |
$1,005,449 |
$1,369,880 |
$948,717 |
1/31/18 |
$1,039,395 |
$1,448,311 |
$979,501 |
2/28/18 |
$1,013,531 |
$1,394,930 |
$955,592 |
3/31/18 |
$1,038,730 |
$1,359,480 |
$974,890 |
4/30/18 |
$1,082,415 |
$1,364,697 |
$1,017,724 |
5/31/18 |
$1,105,066 |
$1,397,561 |
$1,038,345 |
6/30/18 |
$1,097,910 |
$1,406,163 |
$1,031,075 |
7/31/18 |
$1,065,718 |
$1,458,492 |
$998,642 |
8/31/18 |
$1,070,801 |
$1,506,017 |
$1,002,617 |
9/30/18 |
$1,107,789 |
$1,514,589 |
$1,035,015 |
10/31/18 |
$1,049,392 |
$1,411,067 |
$987,111 |
11/30/18 |
$930,826 |
$1,439,822 |
$893,278 |
12/31/18 |
$882,059 |
$1,309,819 |
$840,103 |
1/31/19 |
$959,168 |
$1,414,783 |
$910,333 |
2/28/19 |
$1,008,067 |
$1,460,209 |
$946,295 |
3/31/19 |
$1,020,587 |
$1,488,583 |
$955,689 |
4/30/19 |
$1,050,826 |
$1,548,856 |
$978,843 |
5/31/19 |
$967,667 |
$1,450,428 |
$913,193 |
6/30/19 |
$1,007,560 |
$1,552,649 |
$951,876 |
7/31/19 |
$1,009,465 |
$1,574,964 |
$950,481 |
8/31/19 |
$950,420 |
$1,550,016 |
$903,112 |
9/30/19 |
$966,889 |
$1,579,018 |
$920,803 |
10/31/19 |
$984,190 |
$1,613,219 |
$937,221 |
11/30/19 |
$984,190 |
$1,671,777 |
$935,942 |
12/31/19 |
$1,053,021 |
$1,722,235 |
$998,876 |
1/31/20 |
$956,590 |
$1,721,559 |
$911,889 |
2/29/20 |
$879,446 |
$1,579,842 |
$842,933 |
3/31/20 |
$633,406 |
$1,384,711 |
$637,991 |
4/30/20 |
$606,287 |
$1,562,223 |
$597,074 |
5/31/20 |
$722,509 |
$1,636,628 |
$708,827 |
6/30/20 |
$764,776 |
$1,669,176 |
$747,675 |
7/31/20 |
$807,480 |
$1,763,293 |
$782,429 |
8/31/20 |
$852,124 |
$1,890,039 |
$824,720 |
9/30/20 |
$822,378 |
$1,818,224 |
$796,199 |
10/31/20 |
$787,383 |
$1,769,870 |
$760,320 |
11/30/20 |
$896,256 |
$1,963,607 |
$864,721 |
12/31/20 |
$957,323 |
$2,039,105 |
$918,095 |
1/31/21 |
$1,002,076 |
$2,018,518 |
$959,685 |
2/28/21 |
$1,109,094 |
$2,074,179 |
$1,062,177 |
3/31/21 |
$1,088,663 |
$2,165,019 |
$1,042,880 |
4/30/21 |
$1,176,223 |
$2,280,563 |
$1,127,329 |
5/31/21 |
$1,212,220 |
$2,296,491 |
$1,159,290 |
6/30/21 |
$1,265,133 |
$2,350,103 |
$1,209,899 |
7/31/21 |
$1,286,189 |
$2,405,929 |
$1,233,749 |
8/31/21 |
$1,270,397 |
$2,479,083 |
$1,215,251 |
9/30/21 |
$1,328,276 |
$2,363,781 |
$1,276,744 |
10/31/21 |
$1,399,118 |
$2,529,392 |
$1,345,440 |
11/30/21 |
$1,273,374 |
$2,511,866 |
$1,221,538 |
12/31/21 |
$1,376,507 |
$2,624,438 |
$1,315,853 |
1/31/22 |
$1,504,060 |
$2,488,631 |
$1,448,176 |
2/28/22 |
$1,610,354 |
$2,414,118 |
$1,560,016 |
3/31/22 |
$1,759,094 |
$2,503,753 |
$1,704,321 |
4/30/22 |
$1,826,382 |
$2,285,421 |
$1,769,459 |
5/31/22 |
$1,901,360 |
$2,289,614 |
$1,838,298 |
6/30/22 |
$1,745,748 |
$2,100,621 |
$1,698,572 |
7/31/22 |
$1,756,214 |
$2,294,307 |
$1,701,820 |
8/31/22 |
$1,710,163 |
$2,200,741 |
$1,662,348 |
9/30/22 |
$1,586,879 |
$1,998,056 |
$1,556,755 |
10/31/22 |
$1,662,119 |
$2,159,821 |
$1,627,524 |
11/30/22 |
$1,687,199 |
$2,280,521 |
$1,651,058 |
12/31/22 |
$1,693,165 |
$2,149,130 |
$1,651,124 |
1/31/23 |
$1,718,175 |
$2,284,168 |
$1,663,664 |
2/28/23 |
$1,660,653 |
$2,228,437 |
$1,599,917 |
3/31/23 |
$1,648,574 |
$2,310,252 |
$1,588,110 |
4/30/23 |
$1,646,038 |
$2,346,311 |
$1,581,811 |
5/31/23 |
$1,539,514 |
$2,356,510 |
$1,479,141 |
6/30/23 |
$1,600,385 |
$2,512,217 |
$1,533,521 |
7/31/23 |
$1,760,170 |
$2,592,922 |
$1,683,176 |
8/31/23 |
$1,762,706 |
$2,551,639 |
$1,684,968 |
9/30/23 |
$1,794,214 |
$2,429,982 |
$1,721,668 |
10/31/23 |
$1,745,859 |
$2,378,888 |
$1,677,506 |
11/30/23 |
$1,712,774 |
$2,596,140 |
$1,636,490 |
12/31/23 |
$1,678,737 |
$2,714,085 |
$1,599,203 |
1/31/24 |
$1,722,778 |
$2,759,693 |
$1,639,802 |
2/29/24 |
$1,730,550 |
$2,907,048 |
$1,648,587 |
3/31/24 |
$1,818,458 |
$3,000,582 |
$1,735,565 |
4/30/24 |
$1,847,034 |
$2,878,024 |
$1,771,963 |
5/31/24 |
$1,839,241 |
$3,020,730 |
$1,760,799 |
6/30/24 |
$1,843,059 |
$3,129,120 |
$1,764,777 |
7/31/24 |
$1,779,322 |
$3,167,209 |
$1,699,553 |
8/31/24 |
$1,755,421 |
$3,244,035 |
$1,679,375 |
9/30/24 |
$1,777,372 |
$3,313,318 |
$1,697,916 |
10/31/24 |
$1,774,646 |
$3,283,271 |
$1,696,007 |
11/30/24 |
$1,774,646 |
$3,476,003 |
$1,702,287 |
12/31/24 |
$1,819,324 |
$3,393,141 |
$1,743,837 |
1/31/25 |
$1,872,341 |
$3,487,632 |
$1,800,531 |
2/28/25 |
$1,847,228 |
$3,442,124 |
$1,775,866 |
3/31/25 |
$1,896,862 |
$3,248,180 |
$1,826,777 |
|
| Average Annual Return [Table Text Block] |
Class/Index Name |
1 Year |
5 Years |
10 Years |
I-2 |
4.31% |
24.53% |
6.61% |
S&P 500 Index |
8.25% |
18.59% |
12.50% |
UBS Prompt Commodity Index Total Return |
5.26% |
23.42% |
6.21% | |
| No Deduction of Taxes [Text Block] |
Returns shown do not reflect the deduction of taxes that a shareholder would pay on Fund distributions or the redemption of Fund shares.
|
| Performance Table Market Index Changed [Text Block] |
Differences in the Fund’s performance versus an index and related attribution information with respect to particular categories of securities or individual positions may be attributable, in part, to differences in the pricing methodologies used by the Fund and the index.
|
| Updated Performance Information Location [Text Block] |
For performance current to the most recent month-end, visit www.pimco.com/literature or via 888.87.PIMCO (888.877.4626).
|
| AssetsNet |
$ 4,684,149,000
|
| Holdings Count | Holding |
1,079
|
| Advisory Fees Paid, Amount |
$ 22,011,000
|
| InvestmentCompanyPortfolioTurnover |
201.00%
|
| Additional Fund Statistics [Text Block] |
Key Fund StatisticsFootnote Reference† (as of the end of the reporting period)
Total Net Assets |
$4,684,149 |
# of Portfolio Holdings |
1,079 |
Portfolio Turnover Rate |
201% |
Total Net Advisory Fees Paid During the Reporting Period |
$22,011 |
| Footnote |
Description |
Footnote† |
Dollar amounts displayed in 000's | |
| Holdings [Text Block] |
Security Type Breakdown (% of Net Asset Value)Footnote Reference*
Asset-Backed Securities |
17.0% |
Commodities |
14.8% |
Corporate Bonds & Notes |
11.5% |
U.S. Government Agencies |
11.0% |
U.S. Treasury Obligations |
3.2% |
Sovereign Issues |
2.3% |
Non-Agency Mortgage-Backed Securities |
2.2% |
Other Investments |
0.0%Footnote Reference^ |
Short-Term Instruments |
51.4% |
Affiliated Investments |
5.3% |
Financial Derivative Instruments |
1.5% |
Other Assets and Liabilities, Net |
(20.2%) |
Total |
100.0% |
| Footnote |
Description |
Footnote^ |
Rounded value of investments is less than 0.1% of net assets. |
Footnote* |
% of Net Asset Value includes derivatives instruments, if any, valued at the value used for determining the Fund's net asset value. The notional exposure of such derivatives investments therefore may be greater than what is depicted. | |
| Material Fund Change [Text Block] |
|
| C000026652 |
|
| Shareholder Report [Line Items] |
|
| Fund Name |
PIMCO CommodityRealReturn Strategy Fund<sup style="box-sizing: border-box; color: rgb(0, 0, 0); display: inline; flex-wrap: nowrap; font-size: 15px; font-weight: 700; grid-area: auto; line-height: 0px; margin: 0px; overflow: visible; position: relative; text-align: left; white-space-collapse: preserve-breaks;">®</sup>
|
| Class Name |
Class A
|
| Trading Symbol |
PCRAX
|
| Annual or Semi-Annual Statement [Text Block] |
This annual shareholder report contains important information about the PIMCO CommodityRealReturn Strategy Fund® (the "Fund") for the period of April 1, 2024 to March 31, 2025 (the "reporting period").
|
| Shareholder Report Annual or Semi-Annual |
Annual Shareholder Report
|
| Additional Information [Text Block] |
You can find additional information about the Fund at www.pimco.com/literature. You can also request this information by contacting us at 888.87.PIMCO (888.877.4626).
|
| Material Fund Change Notice [Text Block] |
This report describes changes to the Fund that occurred during the reporting period.
|
| Additional Information Phone Number |
888.87.PIMCO (888.877.4626)
|
| Expenses [Text Block] |
What were the Fund costs for the reporting period?(based on a hypothetical $10,000 investment)
Class Name |
Cost of a $10,000 investment |
Costs paid as a percentage of a $10,000 investment |
Class A |
$144 |
1.35% | |
| Expenses Paid, Amount |
$ 144
|
| Expense Ratio, Percent |
1.35%
|
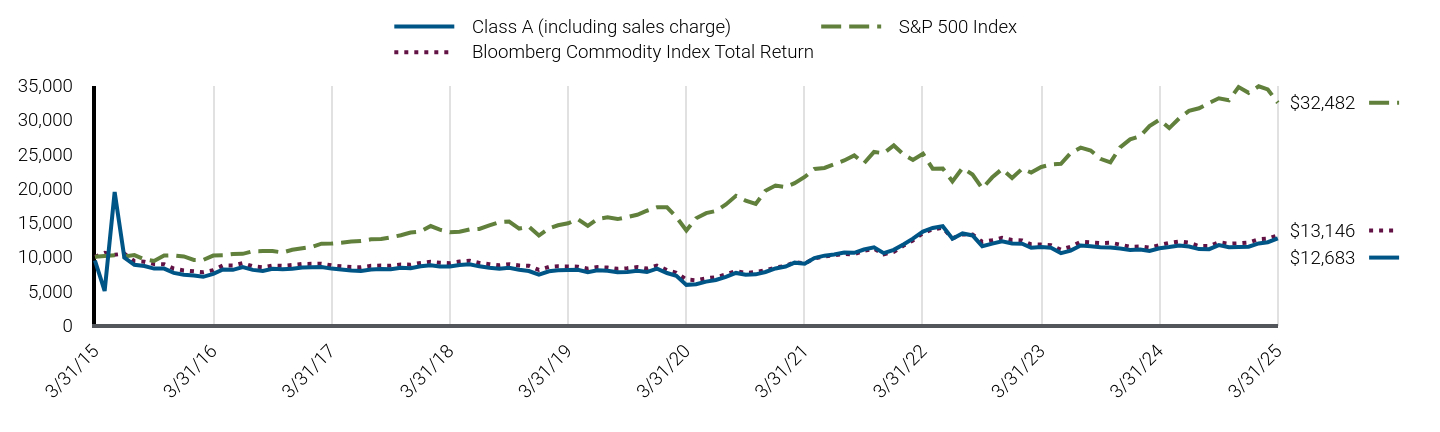
| Factors Affecting Performance [Text Block] |
How did the Fund perform during the reporting period and what affected its performance?The following affected performance (on a gross basis) during the reporting period: The structural allocation to short-term U.S. Treasury inflation-protected securities ("TIPS”), contributed to relative performance versus the Bloomberg Commodity Index Total Return ("Index"), as short-term TIPS underperformed 3-month Treasury Bills. Eurozone interest rate strategies, including short exposure to duration and exposure to swap spreads, contributed to relative performance versus the Index, as eurozone rates rose, while swaps spreads tightened. Positioning within the agriculture sector, including an underweight exposure to corn, contributed to relative performance versus the Index, as corn posted negative returns. Exposure to U.S. non-agency residential mortgage-backed securities and collateralized loan obligations contributed to relative performance versus the Index, as spreads broadly tightened across these sectors. Exposure to California Carbon Allowances ("CCAs") detracted from relative performance versus the Index, as CCAs posted negative returns. Positioning within the energy sector, including an underweight exposure to natural gas, detracted from relative performance versus the Index, as natural gas posted positive returns. There were no other material detractors for this Fund.
|
| Performance Past Does Not Indicate Future [Text] |
Performance quoted represents past performance. Past performance is not a guarantee or a reliable indicator of future results.
|
| Line Graph [Table Text Block] |
|
Class A (including sales charge) |
S&P 500 Index |
Bloomberg Commodity Index Total Return |
3/31/15 |
$9,456 |
$10,000 |
$10,000 |
4/30/15 |
$5,011 |
$10,096 |
$10,573 |
5/31/15 |
$19,456 |
$10,226 |
$10,288 |
6/30/15 |
$9,883 |
$10,028 |
$10,466 |
7/31/15 |
$8,826 |
$10,238 |
$9,354 |
8/31/15 |
$8,642 |
$9,620 |
$9,269 |
9/30/15 |
$8,276 |
$9,382 |
$8,952 |
10/31/15 |
$8,276 |
$10,174 |
$8,912 |
11/30/15 |
$7,643 |
$10,204 |
$8,265 |
12/31/15 |
$7,375 |
$10,043 |
$8,010 |
1/31/16 |
$7,256 |
$9,545 |
$7,876 |
2/29/16 |
$7,077 |
$9,532 |
$7,748 |
3/31/16 |
$7,495 |
$10,178 |
$8,044 |
4/30/16 |
$8,151 |
$10,218 |
$8,728 |
5/31/16 |
$8,092 |
$10,401 |
$8,712 |
6/30/16 |
$8,503 |
$10,428 |
$9,072 |
7/31/16 |
$8,084 |
$10,813 |
$8,608 |
8/31/16 |
$7,929 |
$10,828 |
$8,456 |
9/30/16 |
$8,234 |
$10,830 |
$8,721 |
10/31/16 |
$8,186 |
$10,632 |
$8,679 |
11/30/16 |
$8,246 |
$11,026 |
$8,794 |
12/31/16 |
$8,418 |
$11,244 |
$8,953 |
1/31/17 |
$8,478 |
$11,457 |
$8,965 |
2/28/17 |
$8,490 |
$11,912 |
$8,984 |
3/31/17 |
$8,272 |
$11,926 |
$8,745 |
4/30/17 |
$8,139 |
$12,049 |
$8,613 |
5/31/17 |
$8,006 |
$12,218 |
$8,499 |
6/30/17 |
$7,937 |
$12,294 |
$8,482 |
7/31/17 |
$8,149 |
$12,547 |
$8,674 |
8/31/17 |
$8,198 |
$12,586 |
$8,709 |
9/30/17 |
$8,178 |
$12,845 |
$8,696 |
10/31/17 |
$8,382 |
$13,145 |
$8,882 |
11/30/17 |
$8,331 |
$13,548 |
$8,841 |
12/31/17 |
$8,615 |
$13,699 |
$9,105 |
1/31/18 |
$8,771 |
$14,483 |
$9,286 |
2/28/18 |
$8,576 |
$13,949 |
$9,126 |
3/31/18 |
$8,576 |
$13,595 |
$9,069 |
4/30/18 |
$8,784 |
$13,647 |
$9,303 |
5/31/18 |
$8,901 |
$13,976 |
$9,435 |
6/30/18 |
$8,605 |
$14,062 |
$9,105 |
7/31/18 |
$8,393 |
$14,585 |
$8,911 |
8/31/18 |
$8,260 |
$15,060 |
$8,753 |
9/30/18 |
$8,405 |
$15,146 |
$8,921 |
10/31/18 |
$8,108 |
$14,111 |
$8,728 |
11/30/18 |
$7,920 |
$14,398 |
$8,679 |
12/31/18 |
$7,388 |
$13,098 |
$8,081 |
1/31/19 |
$7,881 |
$14,148 |
$8,522 |
2/28/19 |
$8,018 |
$14,602 |
$8,608 |
3/31/19 |
$8,064 |
$14,886 |
$8,593 |
4/30/19 |
$8,091 |
$15,489 |
$8,556 |
5/31/19 |
$7,762 |
$14,504 |
$8,268 |
6/30/19 |
$8,025 |
$15,526 |
$8,490 |
7/31/19 |
$7,955 |
$15,750 |
$8,433 |
8/31/19 |
$7,732 |
$15,500 |
$8,238 |
9/30/19 |
$7,771 |
$15,790 |
$8,335 |
10/31/19 |
$7,955 |
$16,132 |
$8,503 |
11/30/19 |
$7,771 |
$16,718 |
$8,285 |
12/31/19 |
$8,257 |
$17,222 |
$8,703 |
1/31/20 |
$7,631 |
$17,216 |
$8,063 |
2/29/20 |
$7,233 |
$15,798 |
$7,656 |
3/31/20 |
$5,900 |
$13,847 |
$6,676 |
4/30/20 |
$5,986 |
$15,622 |
$6,573 |
5/31/20 |
$6,371 |
$16,366 |
$6,858 |
6/30/20 |
$6,608 |
$16,692 |
$7,015 |
7/31/20 |
$7,066 |
$17,633 |
$7,415 |
8/31/20 |
$7,640 |
$18,900 |
$7,917 |
9/30/20 |
$7,365 |
$18,182 |
$7,651 |
10/31/20 |
$7,437 |
$17,699 |
$7,759 |
11/30/20 |
$7,782 |
$19,636 |
$8,032 |
12/31/20 |
$8,291 |
$20,391 |
$8,431 |
1/31/21 |
$8,579 |
$20,185 |
$8,653 |
2/28/21 |
$9,142 |
$20,742 |
$9,212 |
3/31/21 |
$8,997 |
$21,650 |
$9,015 |
4/30/21 |
$9,805 |
$22,806 |
$9,762 |
5/31/21 |
$10,165 |
$22,965 |
$10,028 |
6/30/21 |
$10,327 |
$23,501 |
$10,214 |
7/31/21 |
$10,626 |
$24,059 |
$10,402 |
8/31/21 |
$10,573 |
$24,791 |
$10,371 |
9/30/21 |
$11,055 |
$23,638 |
$10,887 |
10/31/21 |
$11,378 |
$25,294 |
$11,168 |
11/30/21 |
$10,535 |
$25,119 |
$10,352 |
12/31/21 |
$11,010 |
$26,244 |
$10,717 |
1/31/22 |
$11,838 |
$24,886 |
$11,658 |
2/28/22 |
$12,648 |
$24,141 |
$12,384 |
3/31/22 |
$13,674 |
$25,038 |
$13,455 |
4/30/22 |
$14,211 |
$22,854 |
$14,012 |
5/31/22 |
$14,461 |
$22,896 |
$14,225 |
6/30/22 |
$12,628 |
$21,006 |
$12,693 |
7/31/22 |
$13,407 |
$22,943 |
$13,234 |
8/31/22 |
$13,112 |
$22,007 |
$13,245 |
9/30/22 |
$11,548 |
$19,981 |
$12,171 |
10/31/22 |
$11,924 |
$21,598 |
$12,414 |
11/30/22 |
$12,252 |
$22,805 |
$12,754 |
12/31/22 |
$11,940 |
$21,491 |
$12,441 |
1/31/23 |
$11,914 |
$22,842 |
$12,380 |
2/28/23 |
$11,322 |
$22,284 |
$11,799 |
3/31/23 |
$11,422 |
$23,103 |
$11,774 |
4/30/23 |
$11,332 |
$23,463 |
$11,686 |
5/31/23 |
$10,540 |
$23,565 |
$11,027 |
6/30/23 |
$10,900 |
$25,122 |
$11,473 |
7/31/23 |
$11,638 |
$25,929 |
$12,190 |
8/31/23 |
$11,521 |
$25,516 |
$12,097 |
9/30/23 |
$11,377 |
$24,300 |
$12,013 |
10/31/23 |
$11,359 |
$23,789 |
$12,045 |
11/30/23 |
$11,215 |
$25,961 |
$11,774 |
12/31/23 |
$10,999 |
$27,141 |
$11,457 |
1/31/24 |
$11,071 |
$27,597 |
$11,503 |
2/29/24 |
$10,846 |
$29,070 |
$11,333 |
3/31/24 |
$11,243 |
$30,006 |
$11,708 |
4/30/24 |
$11,416 |
$28,780 |
$12,023 |
5/31/24 |
$11,651 |
$30,207 |
$12,234 |
6/30/24 |
$11,499 |
$31,291 |
$12,046 |
7/31/24 |
$11,124 |
$31,672 |
$11,560 |
8/31/24 |
$11,115 |
$32,440 |
$11,566 |
9/30/24 |
$11,699 |
$33,133 |
$12,128 |
10/31/24 |
$11,385 |
$32,833 |
$11,903 |
11/30/24 |
$11,413 |
$34,760 |
$11,952 |
12/31/24 |
$11,463 |
$33,931 |
$12,073 |
1/31/25 |
$11,945 |
$34,876 |
$12,551 |
2/28/25 |
$12,130 |
$34,421 |
$12,649 |
3/31/25 |
$12,683 |
$32,482 |
$13,146 |
|
| Average Annual Return [Table Text Block] |
Class/Index Name |
1 Year |
5 Years |
10 Years |
Class A (excluding sales charge) |
12.81% |
16.54% |
2.98% |
Class A (including sales charge) |
6.62% |
15.23% |
2.41% |
S&P 500 Index |
8.25% |
18.59% |
12.50% |
Bloomberg Commodity Index Total Return |
12.28% |
14.51% |
2.77% | |
| No Deduction of Taxes [Text Block] |
Returns shown do not reflect the deduction of taxes that a shareholder would pay on Fund distributions or the redemption of Fund shares.
|
| Performance Table Market Index Changed [Text Block] |
Differences in the Fund’s performance versus an index and related attribution information with respect to particular categories of securities or individual positions may be attributable, in part, to differences in the pricing methodologies used by the Fund and the index.
|
| Updated Performance Information Location [Text Block] |
For performance current to the most recent month-end, visit www.pimco.com/literature or via 888.87.PIMCO (888.877.4626).
|
| AssetsNet |
$ 3,745,951,000
|
| Holdings Count | Holding |
1,303
|
| Advisory Fees Paid, Amount |
$ 19,836,000
|
| InvestmentCompanyPortfolioTurnover |
268.00%
|
| Additional Fund Statistics [Text Block] |
Key Fund StatisticsFootnote Reference† (as of the end of the reporting period)
Total Net Assets |
$3,745,951 |
# of Portfolio Holdings |
1,303 |
Portfolio Turnover Rate |
268% |
Total Net Advisory Fees Paid During the Reporting Period |
$19,836 |
| Footnote |
Description |
Footnote† |
Dollar amounts displayed in 000's | |
| Holdings [Text Block] |
Security Type Breakdown (% of Net Asset Value)Footnote Reference*
U.S. Treasury Obligations |
76.2% |
U.S. Government Agencies |
13.8% |
Sovereign Issues |
10.9% |
Asset-Backed Securities |
9.4% |
Non-Agency Mortgage-Backed Securities |
1.2% |
Corporate Bonds & Notes |
0.2% |
Preferred Securities |
0.1% |
Short-Term Instruments |
12.0% |
Affiliated Investments |
8.1% |
Financial Derivative Instruments |
1.4% |
Other Assets and Liabilities, Net |
(33.3%) |
Total |
100.0% |
| Footnote |
Description |
Footnote* |
% of Net Asset Value includes derivatives instruments, if any, valued at the value used for determining the Fund's net asset value. The notional exposure of such derivatives investments therefore may be greater than what is depicted. | |
| Material Fund Change [Text Block] |
This is a summary of certain changes and planned changes of the Fund since the beginning of the reporting period. For more information, you may refer to the Fund's next prospectus, which we expect to be available by July 31, 2025 or upon request at 888.87.PIMCO (888.877.4626). Changes to Total Annual Fund Operating Expenses. Annual fund operating expenses decreased during the year by 0.10% as a result of lower expenses related to interest. |
| Material Fund Change Expenses [Text Block] |
Changes to Total Annual Fund Operating Expenses. Annual fund operating expenses decreased during the year by 0.10% as a result of lower expenses related to interest.
|
| Summary of Change Legend [Text Block] |
This is a summary of certain changes and planned changes of the Fund since the beginning of the reporting period. For more information, you may refer to the Fund's next prospectus, which we expect to be available by July 31, 2025 or upon request at 888.87.PIMCO (888.877.4626).
|
| C000026651 |
|
| Shareholder Report [Line Items] |
|
| Fund Name |
PIMCO CommodityRealReturn Strategy Fund<sup style="box-sizing: border-box; color: rgb(0, 0, 0); display: inline; flex-wrap: nowrap; font-size: 15px; font-weight: 700; grid-area: auto; line-height: 0px; margin: 0px; overflow: visible; position: relative; text-align: left; white-space-collapse: preserve-breaks;">®</sup>
|
| Class Name |
Administrative Class
|
| Trading Symbol |
PCRRX
|
| Annual or Semi-Annual Statement [Text Block] |
This annual shareholder report contains important information about the PIMCO CommodityRealReturn Strategy Fund® (the "Fund") for the period of April 1, 2024 to March 31, 2025 (the "reporting period").
|
| Shareholder Report Annual or Semi-Annual |
Annual Shareholder Report
|
| Additional Information [Text Block] |
You can find additional information about the Fund at www.pimco.com/literature. You can also request this information by contacting us at 888.87.PIMCO (888.877.4626).
|
| Material Fund Change Notice [Text Block] |
This report describes changes to the Fund that occurred during the reporting period.
|
| Additional Information Phone Number |
888.87.PIMCO (888.877.4626)
|
| Expenses [Text Block] |
What were the Fund costs for the reporting period?(based on a hypothetical $10,000 investment)
Class Name |
Cost of a $10,000 investment |
Costs paid as a percentage of a $10,000 investment |
Administrative Class |
$122 |
1.15% | |
| Expenses Paid, Amount |
$ 122
|
| Expense Ratio, Percent |
1.15%
|
| Factors Affecting Performance [Text Block] |
How did the Fund perform during the reporting period and what affected its performance?The following affected performance (on a gross basis) during the reporting period: The structural allocation to short-term U.S. Treasury inflation-protected securities ("TIPS”), contributed to relative performance versus the Bloomberg Commodity Index Total Return ("Index"), as short-term TIPS underperformed 3-month Treasury Bills. Eurozone interest rate strategies, including short exposure to duration and exposure to swap spreads, contributed to relative performance versus the Index, as eurozone rates rose, while swaps spreads tightened. Positioning within the agriculture sector, including an underweight exposure to corn, contributed to relative performance versus the Index, as corn posted negative returns. Exposure to U.S. non-agency residential mortgage-backed securities and collateralized loan obligations contributed to relative performance versus the Index, as spreads broadly tightened across these sectors. Exposure to California Carbon Allowances ("CCAs") detracted from relative performance versus the Index, as CCAs posted negative returns. Positioning within the energy sector, including an underweight exposure to natural gas, detracted from relative performance versus the Index, as natural gas posted positive returns. There were no other material detractors for this Fund.
|
| Performance Past Does Not Indicate Future [Text] |
Performance quoted represents past performance. Past performance is not a guarantee or a reliable indicator of future results.
|
| Line Graph [Table Text Block] |
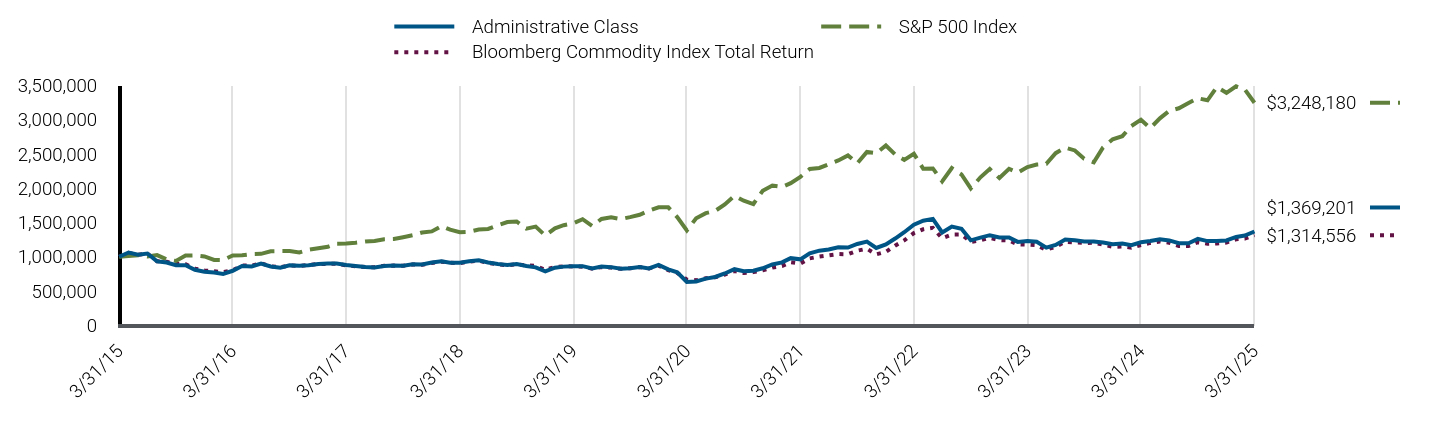
|
Administrative Class |
S&P 500 Index |
Bloomberg Commodity Index Total Return |
3/31/15 |
$1,000,000 |
$1,000,000 |
$1,000,000 |
4/30/15 |
$1,062,201 |
$1,009,593 |
$1,057,338 |
5/31/15 |
$1,028,708 |
$1,022,576 |
$1,028,810 |
6/30/15 |
$1,047,959 |
$1,002,781 |
$1,046,581 |
7/31/15 |
$933,945 |
$1,023,790 |
$935,445 |
8/31/15 |
$915,751 |
$962,021 |
$926,850 |
9/30/15 |
$876,429 |
$938,217 |
$895,178 |
10/31/15 |
$876,429 |
$1,017,360 |
$891,184 |
11/30/15 |
$810,913 |
$1,020,385 |
$826,535 |
12/31/15 |
$781,860 |
$1,004,292 |
$801,030 |
1/31/16 |
$769,249 |
$954,455 |
$787,568 |
2/29/16 |
$750,333 |
$953,167 |
$774,758 |
3/31/16 |
$795,731 |
$1,017,828 |
$804,366 |
4/30/16 |
$865,090 |
$1,021,774 |
$872,835 |
5/31/16 |
$858,785 |
$1,040,123 |
$871,186 |
6/30/16 |
$902,182 |
$1,042,818 |
$907,173 |
7/31/16 |
$857,958 |
$1,081,265 |
$860,803 |
8/31/16 |
$841,532 |
$1,082,784 |
$845,635 |
9/30/16 |
$874,363 |
$1,082,988 |
$872,120 |
10/31/16 |
$869,287 |
$1,063,233 |
$867,860 |
11/30/16 |
$875,632 |
$1,102,610 |
$879,433 |
12/31/16 |
$894,155 |
$1,124,405 |
$895,285 |
1/31/17 |
$900,505 |
$1,145,730 |
$896,497 |
2/28/17 |
$901,776 |
$1,191,223 |
$898,369 |
3/31/17 |
$879,119 |
$1,192,612 |
$874,459 |
4/30/17 |
$865,043 |
$1,204,860 |
$861,293 |
5/31/17 |
$850,967 |
$1,221,816 |
$849,853 |
6/30/17 |
$843,980 |
$1,229,442 |
$848,220 |
7/31/17 |
$866,363 |
$1,254,723 |
$867,399 |
8/31/17 |
$871,630 |
$1,258,564 |
$870,895 |
9/30/17 |
$869,954 |
$1,284,525 |
$869,597 |
10/31/17 |
$891,534 |
$1,314,500 |
$888,244 |
11/30/17 |
$887,488 |
$1,354,816 |
$884,147 |
12/31/17 |
$916,675 |
$1,369,880 |
$910,542 |
1/31/18 |
$933,217 |
$1,448,311 |
$928,625 |
2/28/18 |
$912,540 |
$1,394,930 |
$912,565 |
3/31/18 |
$912,540 |
$1,359,480 |
$906,893 |
4/30/18 |
$934,595 |
$1,364,697 |
$930,332 |
5/31/18 |
$948,380 |
$1,397,561 |
$943,512 |
6/30/18 |
$915,999 |
$1,406,163 |
$910,526 |
7/31/18 |
$893,520 |
$1,458,492 |
$891,093 |
8/31/18 |
$879,471 |
$1,506,017 |
$875,316 |
9/30/18 |
$895,199 |
$1,514,589 |
$892,101 |
10/31/18 |
$865,216 |
$1,411,067 |
$872,843 |
11/30/18 |
$845,228 |
$1,439,822 |
$867,927 |
12/31/18 |
$786,576 |
$1,309,819 |
$808,148 |
1/31/19 |
$840,272 |
$1,414,783 |
$852,163 |
2/28/19 |
$856,236 |
$1,460,209 |
$860,791 |
3/31/19 |
$860,057 |
$1,488,583 |
$859,254 |
4/30/19 |
$862,973 |
$1,548,856 |
$855,632 |
5/31/19 |
$827,987 |
$1,450,428 |
$826,844 |
6/30/19 |
$856,234 |
$1,552,649 |
$849,049 |
7/31/19 |
$848,840 |
$1,574,964 |
$843,338 |
8/31/19 |
$825,179 |
$1,550,016 |
$823,777 |
9/30/19 |
$831,173 |
$1,579,018 |
$833,453 |
10/31/19 |
$849,177 |
$1,613,219 |
$850,305 |
11/30/19 |
$829,673 |
$1,671,777 |
$828,533 |
12/31/19 |
$881,772 |
$1,722,235 |
$870,302 |
1/31/20 |
$815,337 |
$1,721,559 |
$806,275 |
2/29/20 |
$773,060 |
$1,579,842 |
$765,637 |
3/31/20 |
$631,767 |
$1,384,711 |
$667,566 |
4/30/20 |
$639,342 |
$1,562,223 |
$657,296 |
5/31/20 |
$681,763 |
$1,636,628 |
$685,825 |
6/30/20 |
$705,657 |
$1,669,176 |
$701,478 |
7/31/20 |
$755,953 |
$1,763,293 |
$741,515 |
8/31/20 |
$818,441 |
$1,890,039 |
$791,665 |
9/30/20 |
$788,176 |
$1,818,224 |
$765,133 |
10/31/20 |
$795,828 |
$1,769,870 |
$775,911 |
11/30/20 |
$832,558 |
$1,963,607 |
$803,165 |
12/31/20 |
$887,674 |
$2,039,105 |
$843,115 |
1/31/21 |
$918,389 |
$2,018,518 |
$865,252 |
2/28/21 |
$979,820 |
$2,074,179 |
$921,239 |
3/31/21 |
$962,926 |
$2,165,019 |
$901,460 |
4/30/21 |
$1,050,465 |
$2,280,563 |
$976,197 |
5/31/21 |
$1,088,859 |
$2,296,491 |
$1,002,832 |
6/30/21 |
$1,106,409 |
$2,350,103 |
$1,021,397 |
7/31/21 |
$1,138,289 |
$2,405,929 |
$1,040,176 |
8/31/21 |
$1,134,538 |
$2,479,083 |
$1,037,099 |
9/30/21 |
$1,186,443 |
$2,363,781 |
$1,088,697 |
10/31/21 |
$1,220,833 |
$2,529,392 |
$1,116,831 |
11/30/21 |
$1,129,127 |
$2,511,866 |
$1,035,184 |
12/31/21 |
$1,179,773 |
$2,624,438 |
$1,071,677 |
1/31/22 |
$1,269,788 |
$2,488,631 |
$1,165,757 |
2/28/22 |
$1,357,888 |
$2,414,118 |
$1,238,380 |
3/31/22 |
$1,467,727 |
$2,503,753 |
$1,345,463 |
4/30/22 |
$1,526,926 |
$2,285,421 |
$1,401,174 |
5/31/22 |
$1,553,463 |
$2,289,614 |
$1,422,542 |
6/30/22 |
$1,354,665 |
$2,100,621 |
$1,269,269 |
7/31/22 |
$1,439,751 |
$2,294,307 |
$1,323,371 |
8/31/22 |
$1,408,404 |
$2,200,741 |
$1,324,537 |
9/30/22 |
$1,240,225 |
$1,998,056 |
$1,217,138 |
10/31/22 |
$1,280,152 |
$2,159,821 |
$1,241,373 |
11/30/22 |
$1,315,088 |
$2,280,521 |
$1,275,363 |
12/31/22 |
$1,282,921 |
$2,149,130 |
$1,244,144 |
1/31/23 |
$1,282,921 |
$2,284,168 |
$1,238,048 |
2/28/23 |
$1,217,271 |
$2,228,437 |
$1,179,872 |
3/31/23 |
$1,228,410 |
$2,310,252 |
$1,177,442 |
4/30/23 |
$1,218,843 |
$2,346,311 |
$1,168,594 |
5/31/23 |
$1,133,696 |
$2,356,510 |
$1,102,728 |
6/30/23 |
$1,171,964 |
$2,512,217 |
$1,147,271 |
7/31/23 |
$1,252,327 |
$2,592,922 |
$1,219,048 |
8/31/23 |
$1,239,890 |
$2,551,639 |
$1,209,708 |
9/30/23 |
$1,224,583 |
$2,429,982 |
$1,201,309 |
10/31/23 |
$1,222,669 |
$2,378,888 |
$1,204,500 |
11/30/23 |
$1,208,319 |
$2,596,140 |
$1,177,367 |
12/31/23 |
$1,183,874 |
$2,714,085 |
$1,145,700 |
1/31/24 |
$1,192,488 |
$2,759,693 |
$1,150,258 |
2/29/24 |
$1,168,561 |
$2,907,048 |
$1,133,338 |
3/31/24 |
$1,211,289 |
$3,000,582 |
$1,170,830 |
4/30/24 |
$1,230,562 |
$2,878,024 |
$1,202,337 |
5/31/24 |
$1,255,617 |
$3,020,730 |
$1,223,445 |
6/30/24 |
$1,238,953 |
$3,129,120 |
$1,204,629 |
7/31/24 |
$1,199,081 |
$3,167,209 |
$1,156,009 |
8/31/24 |
$1,198,108 |
$3,244,035 |
$1,156,572 |
9/30/24 |
$1,261,823 |
$3,313,318 |
$1,212,799 |
10/31/24 |
$1,228,462 |
$3,283,271 |
$1,190,324 |
11/30/24 |
$1,231,406 |
$3,476,003 |
$1,195,165 |
12/31/24 |
$1,237,623 |
$3,393,141 |
$1,207,347 |
1/31/25 |
$1,288,903 |
$3,487,632 |
$1,255,084 |
2/28/25 |
$1,309,612 |
$3,442,124 |
$1,264,860 |
3/31/25 |
$1,369,201 |
$3,248,180 |
$1,314,556 |
|
| Average Annual Return [Table Text Block] |
Class/Index Name |
1 Year |
5 Years |
10 Years |
Administrative Class |
13.04% |
16.73% |
3.19% |
S&P 500 Index |
8.25% |
18.59% |
12.50% |
Bloomberg Commodity Index Total Return |
12.28% |
14.51% |
2.77% | |
| No Deduction of Taxes [Text Block] |
Returns shown do not reflect the deduction of taxes that a shareholder would pay on Fund distributions or the redemption of Fund shares.
|
| Performance Table Market Index Changed [Text Block] |
Differences in the Fund’s performance versus an index and related attribution information with respect to particular categories of securities or individual positions may be attributable, in part, to differences in the pricing methodologies used by the Fund and the index.
|
| Updated Performance Information Location [Text Block] |
For performance current to the most recent month-end, visit www.pimco.com/literature or via 888.87.PIMCO (888.877.4626).
|
| AssetsNet |
$ 3,745,951,000
|
| Holdings Count | Holding |
1,303
|
| Advisory Fees Paid, Amount |
$ 19,836,000
|
| InvestmentCompanyPortfolioTurnover |
268.00%
|
| Additional Fund Statistics [Text Block] |
Key Fund StatisticsFootnote Reference† (as of the end of the reporting period)
Total Net Assets |
$3,745,951 |
# of Portfolio Holdings |
1,303 |
Portfolio Turnover Rate |
268% |
Total Net Advisory Fees Paid During the Reporting Period |
$19,836 |
| Footnote |
Description |
Footnote† |
Dollar amounts displayed in 000's | |
| Holdings [Text Block] |
Security Type Breakdown (% of Net Asset Value)Footnote Reference*
U.S. Treasury Obligations |
76.2% |
U.S. Government Agencies |
13.8% |
Sovereign Issues |
10.9% |
Asset-Backed Securities |
9.4% |
Non-Agency Mortgage-Backed Securities |
1.2% |
Corporate Bonds & Notes |
0.2% |
Preferred Securities |
0.1% |
Short-Term Instruments |
12.0% |
Affiliated Investments |
8.1% |
Financial Derivative Instruments |
1.4% |
Other Assets and Liabilities, Net |
(33.3%) |
Total |
100.0% |
| Footnote |
Description |
Footnote* |
% of Net Asset Value includes derivatives instruments, if any, valued at the value used for determining the Fund's net asset value. The notional exposure of such derivatives investments therefore may be greater than what is depicted. | |
| Material Fund Change [Text Block] |
This is a summary of certain changes and planned changes of the Fund since the beginning of the reporting period. For more information, you may refer to the Fund's next prospectus, which we expect to be available by July 31, 2025 or upon request at 888.87.PIMCO (888.877.4626). Changes to Total Annual Fund Operating Expenses. Annual fund operating expenses decreased during the year by 0.10% as a result of lower expenses related to interest. |
| Material Fund Change Expenses [Text Block] |
Changes to Total Annual Fund Operating Expenses. Annual fund operating expenses decreased during the year by 0.10% as a result of lower expenses related to interest.
|
| Summary of Change Legend [Text Block] |
This is a summary of certain changes and planned changes of the Fund since the beginning of the reporting period. For more information, you may refer to the Fund's next prospectus, which we expect to be available by July 31, 2025 or upon request at 888.87.PIMCO (888.877.4626).
|
| C000026654 |
|
| Shareholder Report [Line Items] |
|
| Fund Name |
PIMCO CommodityRealReturn Strategy Fund<sup style="box-sizing: border-box; color: rgb(0, 0, 0); display: inline; flex-wrap: nowrap; font-size: 15px; font-weight: 700; grid-area: auto; line-height: 0px; margin: 0px; overflow: visible; position: relative; text-align: left; white-space-collapse: preserve-breaks;">®</sup>
|
| Class Name |
Class C
|
| Trading Symbol |
PCRCX
|
| Annual or Semi-Annual Statement [Text Block] |
This annual shareholder report contains important information about the PIMCO CommodityRealReturn Strategy Fund® (the "Fund") for the period of April 1, 2024 to March 31, 2025 (the "reporting period").
|
| Shareholder Report Annual or Semi-Annual |
Annual Shareholder Report
|
| Additional Information [Text Block] |
You can find additional information about the Fund at www.pimco.com/literature. You can also request this information by contacting us at 888.87.PIMCO (888.877.4626).
|
| Material Fund Change Notice [Text Block] |
This report describes changes to the Fund that occurred during the reporting period.
|
| Additional Information Phone Number |
888.87.PIMCO (888.877.4626)
|
| Expenses [Text Block] |
What were the Fund costs for the reporting period?(based on a hypothetical $10,000 investment)
Class Name |
Cost of a $10,000 investment |
Costs paid as a percentage of a $10,000 investment |
Class C |
$223 |
2.10% | |
| Expenses Paid, Amount |
$ 223
|
| Expense Ratio, Percent |
2.10%
|
| Factors Affecting Performance [Text Block] |
How did the Fund perform during the reporting period and what affected its performance?The following affected performance (on a gross basis) during the reporting period: The structural allocation to short-term U.S. Treasury inflation-protected securities ("TIPS”), contributed to relative performance versus the Bloomberg Commodity Index Total Return ("Index"), as short-term TIPS underperformed 3-month Treasury Bills. Eurozone interest rate strategies, including short exposure to duration and exposure to swap spreads, contributed to relative performance versus the Index, as eurozone rates rose, while swaps spreads tightened. Positioning within the agriculture sector, including an underweight exposure to corn, contributed to relative performance versus the Index, as corn posted negative returns. Exposure to U.S. non-agency residential mortgage-backed securities and collateralized loan obligations contributed to relative performance versus the Index, as spreads broadly tightened across these sectors. Exposure to California Carbon Allowances ("CCAs") detracted from relative performance versus the Index, as CCAs posted negative returns. Positioning within the energy sector, including an underweight exposure to natural gas, detracted from relative performance versus the Index, as natural gas posted positive returns. There were no other material detractors for this Fund.
|
| Performance Past Does Not Indicate Future [Text] |
Performance quoted represents past performance. Past performance is not a guarantee or a reliable indicator of future results.
|
| Line Graph [Table Text Block] |
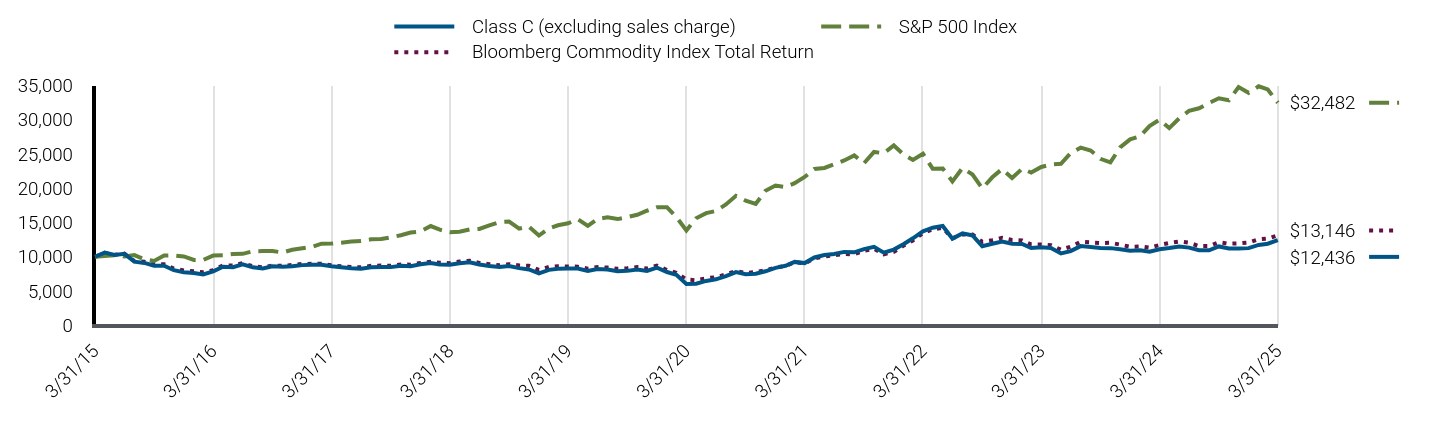
|
Class C (excluding sales charge) |
S&P 500 Index |
Bloomberg Commodity Index Total Return |
3/31/15 |
$10,000 |
$10,000 |
$10,000 |
4/30/15 |
$10,599 |
$10,096 |
$10,573 |
5/31/15 |
$10,274 |
$10,226 |
$10,288 |
6/30/15 |
$10,429 |
$10,028 |
$10,466 |
7/31/15 |
$9,293 |
$10,238 |
$9,354 |
8/31/15 |
$9,103 |
$9,620 |
$9,269 |
9/30/15 |
$8,708 |
$9,382 |
$8,952 |
10/31/15 |
$8,708 |
$10,174 |
$8,912 |
11/30/15 |
$8,040 |
$10,204 |
$8,265 |
12/31/15 |
$7,751 |
$10,043 |
$8,010 |
1/31/16 |
$7,621 |
$9,545 |
$7,876 |
2/29/16 |
$7,425 |
$9,532 |
$7,748 |
3/31/16 |
$7,869 |
$10,178 |
$8,044 |
4/30/16 |
$8,549 |
$10,218 |
$8,728 |
5/31/16 |
$8,483 |
$10,401 |
$8,712 |
6/30/16 |
$8,909 |
$10,428 |
$9,072 |
7/31/16 |
$8,464 |
$10,813 |
$8,608 |
8/31/16 |
$8,294 |
$10,828 |
$8,456 |
9/30/16 |
$8,599 |
$10,830 |
$8,721 |
10/31/16 |
$8,546 |
$10,632 |
$8,679 |
11/30/16 |
$8,612 |
$11,026 |
$8,794 |
12/31/16 |
$8,782 |
$11,244 |
$8,953 |
1/31/17 |
$8,848 |
$11,457 |
$8,965 |
2/28/17 |
$8,848 |
$11,912 |
$8,984 |
3/31/17 |
$8,611 |
$11,926 |
$8,745 |
4/30/17 |
$8,466 |
$12,049 |
$8,613 |
5/31/17 |
$8,321 |
$12,218 |
$8,499 |
6/30/17 |
$8,244 |
$12,294 |
$8,482 |
7/31/17 |
$8,461 |
$12,547 |
$8,674 |
8/31/17 |
$8,501 |
$12,586 |
$8,709 |
9/30/17 |
$8,490 |
$12,845 |
$8,696 |
10/31/17 |
$8,698 |
$13,145 |
$8,882 |
11/30/17 |
$8,629 |
$13,548 |
$8,841 |
12/31/17 |
$8,920 |
$13,699 |
$9,105 |
1/31/18 |
$9,075 |
$14,483 |
$9,286 |
2/28/18 |
$8,863 |
$13,949 |
$9,126 |
3/31/18 |
$8,849 |
$13,595 |
$9,069 |
4/30/18 |
$9,061 |
$13,647 |
$9,303 |
5/31/18 |
$9,189 |
$13,976 |
$9,435 |
6/30/18 |
$8,869 |
$14,062 |
$9,105 |
7/31/18 |
$8,652 |
$14,585 |
$8,911 |
8/31/18 |
$8,508 |
$15,060 |
$8,753 |
9/30/18 |
$8,649 |
$15,146 |
$8,921 |
10/31/18 |
$8,342 |
$14,111 |
$8,728 |
11/30/18 |
$8,151 |
$14,398 |
$8,679 |
12/31/18 |
$7,584 |
$13,098 |
$8,081 |
1/31/19 |
$8,089 |
$14,148 |
$8,522 |
2/28/19 |
$8,237 |
$14,602 |
$8,608 |
3/31/19 |
$8,274 |
$14,886 |
$8,593 |
4/30/19 |
$8,289 |
$15,489 |
$8,556 |
5/31/19 |
$7,946 |
$14,504 |
$8,268 |
6/30/19 |
$8,205 |
$15,526 |
$8,490 |
7/31/19 |
$8,144 |
$15,750 |
$8,433 |
8/31/19 |
$7,903 |
$15,500 |
$8,238 |
9/30/19 |
$7,943 |
$15,790 |
$8,335 |
10/31/19 |
$8,127 |
$16,132 |
$8,503 |
11/30/19 |
$7,928 |
$16,718 |
$8,285 |
12/31/19 |
$8,417 |
$17,222 |
$8,703 |
1/31/20 |
$7,773 |
$17,216 |
$8,063 |
2/29/20 |
$7,359 |
$15,798 |
$7,656 |
3/31/20 |
$6,017 |
$13,847 |
$6,676 |
4/30/20 |
$6,079 |
$15,622 |
$6,573 |
5/31/20 |
$6,478 |
$16,366 |
$6,858 |
6/30/20 |
$6,710 |
$16,692 |
$7,015 |
7/31/20 |
$7,172 |
$17,633 |
$7,415 |
8/31/20 |
$7,759 |
$18,900 |
$7,917 |
9/30/20 |
$7,467 |
$18,182 |
$7,651 |
10/31/20 |
$7,528 |
$17,699 |
$7,759 |
11/30/20 |
$7,884 |
$19,636 |
$8,032 |
12/31/20 |
$8,384 |
$20,391 |
$8,431 |
1/31/21 |
$8,678 |
$20,185 |
$8,653 |
2/28/21 |
$9,250 |
$20,742 |
$9,212 |
3/31/21 |
$9,080 |
$21,650 |
$9,015 |
4/30/21 |
$9,900 |
$22,806 |
$9,762 |
5/31/21 |
$10,255 |
$22,965 |
$10,028 |
6/30/21 |
$10,405 |
$23,501 |
$10,214 |
7/31/21 |
$10,712 |
$24,059 |
$10,402 |
8/31/21 |
$10,655 |
$24,791 |
$10,371 |
9/30/21 |
$11,124 |
$23,638 |
$10,887 |
10/31/21 |
$11,456 |
$25,294 |
$11,168 |
11/30/21 |
$10,597 |
$25,119 |
$10,352 |
12/31/21 |
$11,055 |
$26,244 |
$10,717 |
1/31/22 |
$11,876 |
$24,886 |
$11,658 |
2/28/22 |
$12,696 |
$24,141 |
$12,384 |
3/31/22 |
$13,719 |
$25,038 |
$13,455 |
4/30/22 |
$14,242 |
$22,854 |
$14,012 |
5/31/22 |
$14,493 |
$22,896 |
$14,225 |
6/30/22 |
$12,649 |
$21,006 |
$12,693 |
7/31/22 |
$13,412 |
$22,943 |
$13,234 |
8/31/22 |
$13,112 |
$22,007 |
$13,245 |
9/30/22 |
$11,532 |
$19,981 |
$12,171 |
10/31/22 |
$11,896 |
$21,598 |
$12,414 |
11/30/22 |
$12,235 |
$22,805 |
$12,754 |
12/31/22 |
$11,910 |
$21,491 |
$12,441 |
1/31/23 |
$11,881 |
$22,842 |
$12,380 |
2/28/23 |
$11,277 |
$22,284 |
$11,799 |
3/31/23 |
$11,373 |
$23,103 |
$11,774 |
4/30/23 |
$11,272 |
$23,463 |
$11,686 |
5/31/23 |
$10,484 |
$23,565 |
$11,027 |
6/30/23 |
$10,827 |
$25,122 |
$11,473 |
7/31/23 |
$11,555 |
$25,929 |
$12,190 |
8/31/23 |
$11,434 |
$25,516 |
$12,097 |
9/30/23 |
$11,282 |
$24,300 |
$12,013 |
10/31/23 |
$11,262 |
$23,789 |
$12,045 |
11/30/23 |
$11,110 |
$25,961 |
$11,774 |
12/31/23 |
$10,888 |
$27,141 |
$11,457 |
1/31/24 |
$10,959 |
$27,597 |
$11,503 |
2/29/24 |
$10,726 |
$29,070 |
$11,333 |
3/31/24 |
$11,106 |
$30,006 |
$11,708 |
4/30/24 |
$11,268 |
$28,780 |
$12,023 |
5/31/24 |
$11,502 |
$30,207 |
$12,234 |
6/30/24 |
$11,336 |
$31,291 |
$12,046 |
7/31/24 |
$10,956 |
$31,672 |
$11,560 |
8/31/24 |
$10,946 |
$32,440 |
$11,566 |
9/30/24 |
$11,508 |
$33,133 |
$12,128 |
10/31/24 |
$11,198 |
$32,833 |
$11,903 |
11/30/24 |
$11,219 |
$34,760 |
$11,952 |
12/31/24 |
$11,262 |
$33,931 |
$12,073 |
1/31/25 |
$11,728 |
$34,876 |
$12,551 |
2/28/25 |
$11,904 |
$34,421 |
$12,649 |
3/31/25 |
$12,436 |
$32,482 |
$13,146 |
|
| Average Annual Return [Table Text Block] |
Class/Index Name |
1 Year |
5 Years |
10 Years |
Class C (excluding sales charge) |
11.98% |
15.63% |
2.20% |
Class C (including sales charge) |
10.98% |
15.63% |
2.20% |
S&P 500 Index |
8.25% |
18.59% |
12.50% |
Bloomberg Commodity Index Total Return |
12.28% |
14.51% |
2.77% | |
| No Deduction of Taxes [Text Block] |
Returns shown do not reflect the deduction of taxes that a shareholder would pay on Fund distributions or the redemption of Fund shares.
|
| Performance Table Market Index Changed [Text Block] |
Differences in the Fund’s performance versus an index and related attribution information with respect to particular categories of securities or individual positions may be attributable, in part, to differences in the pricing methodologies used by the Fund and the index.
|
| Updated Performance Information Location [Text Block] |
For performance current to the most recent month-end, visit www.pimco.com/literature or via 888.87.PIMCO (888.877.4626).
|
| AssetsNet |
$ 3,745,951,000
|
| Holdings Count | Holding |
1,303
|
| Advisory Fees Paid, Amount |
$ 19,836,000
|
| InvestmentCompanyPortfolioTurnover |
268.00%
|
| Additional Fund Statistics [Text Block] |
Key Fund StatisticsFootnote Reference† (as of the end of the reporting period)
Total Net Assets |
$3,745,951 |
# of Portfolio Holdings |
1,303 |
Portfolio Turnover Rate |
268% |
Total Net Advisory Fees Paid During the Reporting Period |
$19,836 |
| Footnote |
Description |
Footnote† |
Dollar amounts displayed in 000's | |
| Holdings [Text Block] |
Security Type Breakdown (% of Net Asset Value)Footnote Reference*
U.S. Treasury Obligations |
76.2% |
U.S. Government Agencies |
13.8% |
Sovereign Issues |
10.9% |
Asset-Backed Securities |
9.4% |
Non-Agency Mortgage-Backed Securities |
1.2% |
Corporate Bonds & Notes |
0.2% |
Preferred Securities |
0.1% |
Short-Term Instruments |
12.0% |
Affiliated Investments |
8.1% |
Financial Derivative Instruments |
1.4% |
Other Assets and Liabilities, Net |
(33.3%) |
Total |
100.0% |
| Footnote |
Description |
Footnote* |
% of Net Asset Value includes derivatives instruments, if any, valued at the value used for determining the Fund's net asset value. The notional exposure of such derivatives investments therefore may be greater than what is depicted. | |
| Material Fund Change [Text Block] |
This is a summary of certain changes and planned changes of the Fund since the beginning of the reporting period. For more information, you may refer to the Fund's next prospectus, which we expect to be available by July 31, 2025 or upon request at 888.87.PIMCO (888.877.4626). Changes to Total Annual Fund Operating Expenses. Annual fund operating expenses decreased during the year by 0.10% as a result of lower expenses related to interest. |
| Material Fund Change Expenses [Text Block] |
Changes to Total Annual Fund Operating Expenses. Annual fund operating expenses decreased during the year by 0.10% as a result of lower expenses related to interest.
|
| Summary of Change Legend [Text Block] |
This is a summary of certain changes and planned changes of the Fund since the beginning of the reporting period. For more information, you may refer to the Fund's next prospectus, which we expect to be available by July 31, 2025 or upon request at 888.87.PIMCO (888.877.4626).
|
| C000200453 |
|
| Shareholder Report [Line Items] |
|
| Fund Name |
PIMCO CommodityRealReturn Strategy Fund<sup style="box-sizing: border-box; color: rgb(0, 0, 0); display: inline; flex-wrap: nowrap; font-size: 15px; font-weight: 700; grid-area: auto; line-height: 0px; margin: 0px; overflow: visible; position: relative; text-align: left; white-space-collapse: preserve-breaks;">®</sup>
|
| Class Name |
I-3
|
| Trading Symbol |
PCRNX
|
| Annual or Semi-Annual Statement [Text Block] |
This annual shareholder report contains important information about the PIMCO CommodityRealReturn Strategy Fund® (the "Fund") for the period of April 1, 2024 to March 31, 2025 (the "reporting period").
|
| Shareholder Report Annual or Semi-Annual |
Annual Shareholder Report
|
| Additional Information [Text Block] |
You can find additional information about the Fund at www.pimco.com/literature. You can also request this information by contacting us at 888.87.PIMCO (888.877.4626).
|
| Material Fund Change Notice [Text Block] |
This report describes changes to the Fund that occurred during the reporting period.
|
| Additional Information Phone Number |
888.87.PIMCO (888.877.4626)
|
| Expenses [Text Block] |
What were the Fund costs for the reporting period?(based on a hypothetical $10,000 investment)
Class Name |
Cost of a $10,000 investment |
Costs paid as a percentage of a $10,000 investment |
I-3 |
$112 |
1.05% | |
| Expenses Paid, Amount |
$ 112
|
| Expense Ratio, Percent |
1.05%
|
| Factors Affecting Performance [Text Block] |
How did the Fund perform during the reporting period and what affected its performance?The following affected performance (on a gross basis) during the reporting period: The structural allocation to short-term U.S. Treasury inflation-protected securities ("TIPS”), contributed to relative performance versus the Bloomberg Commodity Index Total Return ("Index"), as short-term TIPS underperformed 3-month Treasury Bills. Eurozone interest rate strategies, including short exposure to duration and exposure to swap spreads, contributed to relative performance versus the Index, as eurozone rates rose, while swaps spreads tightened. Positioning within the agriculture sector, including an underweight exposure to corn, contributed to relative performance versus the Index, as corn posted negative returns. Exposure to U.S. non-agency residential mortgage-backed securities and collateralized loan obligations contributed to relative performance versus the Index, as spreads broadly tightened across these sectors. Exposure to California Carbon Allowances ("CCAs") detracted from relative performance versus the Index, as CCAs posted negative returns. Positioning within the energy sector, including an underweight exposure to natural gas, detracted from relative performance versus the Index, as natural gas posted positive returns. There were no other material detractors for this Fund.
|
| Performance Past Does Not Indicate Future [Text] |
Performance quoted represents past performance. Past performance is not a guarantee or a reliable indicator of future results.
|
| Line Graph [Table Text Block] |
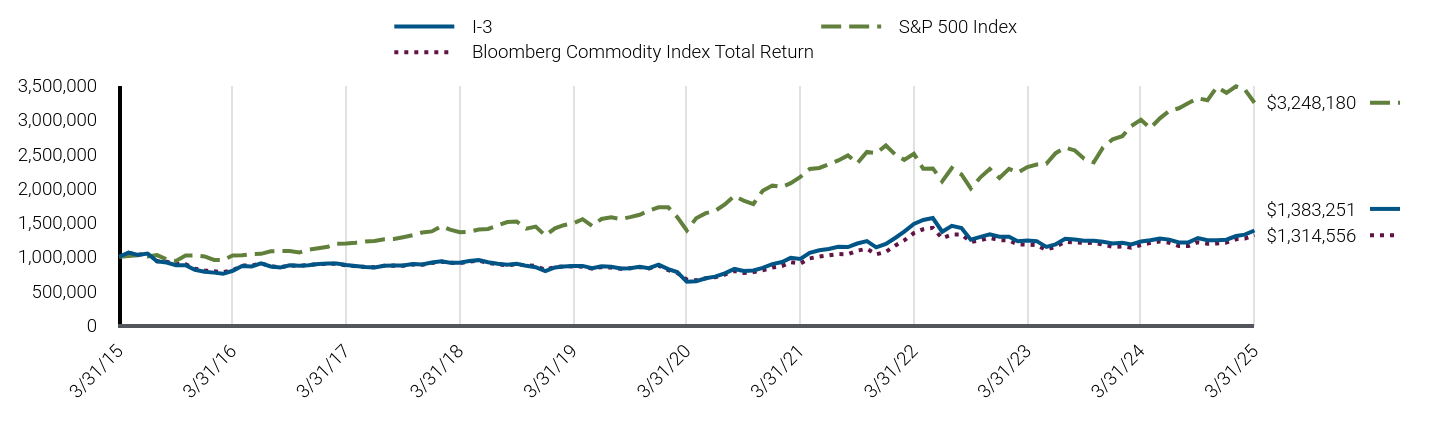
|
I-3 |
S&P 500 Index |
Bloomberg Commodity Index Total Return |
3/31/15 |
$1,000,000 |
$1,000,000 |
$1,000,000 |
4/30/15 |
$1,061,049 |
$1,009,593 |
$1,057,338 |
5/31/15 |
$1,027,978 |
$1,022,576 |
$1,028,810 |
6/30/15 |
$1,047,205 |
$1,002,781 |
$1,046,581 |
7/31/15 |
$934,964 |
$1,023,790 |
$935,445 |
8/31/15 |
$915,768 |
$962,021 |
$926,850 |
9/30/15 |
$876,359 |
$938,217 |
$895,178 |
10/31/15 |
$876,245 |
$1,017,360 |
$891,184 |
11/30/15 |
$810,515 |
$1,020,385 |
$826,535 |
12/31/15 |
$782,297 |
$1,004,292 |
$801,030 |
1/31/16 |
$768,564 |
$954,455 |
$787,568 |
2/29/16 |
$751,121 |
$953,167 |
$774,758 |
3/31/16 |
$795,642 |
$1,017,828 |
$804,366 |
4/30/16 |
$864,943 |
$1,021,774 |
$872,835 |
5/31/16 |
$858,639 |
$1,040,123 |
$871,186 |
6/30/16 |
$903,173 |
$1,042,818 |
$907,173 |
7/31/16 |
$858,338 |
$1,081,265 |
$860,803 |
8/31/16 |
$842,080 |
$1,082,784 |
$845,635 |
9/30/16 |
$874,799 |
$1,082,988 |
$872,120 |
10/31/16 |
$869,696 |
$1,063,233 |
$867,860 |
11/30/16 |
$877,077 |
$1,102,610 |
$879,433 |
12/31/16 |
$894,698 |
$1,124,405 |
$895,285 |
1/31/17 |
$902,081 |
$1,145,730 |
$896,497 |
2/28/17 |
$903,226 |
$1,191,223 |
$898,369 |
3/31/17 |
$880,019 |
$1,192,612 |
$874,459 |
4/30/17 |
$866,062 |
$1,204,860 |
$861,293 |
5/31/17 |
$852,106 |
$1,221,816 |
$849,853 |
6/30/17 |
$844,217 |
$1,229,442 |
$848,220 |
7/31/17 |
$867,416 |
$1,254,723 |
$867,399 |
8/31/17 |
$872,485 |
$1,258,564 |
$870,895 |
9/30/17 |
$871,276 |
$1,284,525 |
$869,597 |
10/31/17 |
$893,709 |
$1,314,500 |
$888,244 |
11/30/17 |
$888,294 |
$1,354,816 |
$884,147 |
12/31/17 |
$917,446 |
$1,369,880 |
$910,542 |
1/31/18 |
$934,945 |
$1,448,311 |
$928,625 |
2/28/18 |
$914,515 |
$1,394,930 |
$912,565 |
3/31/18 |
$914,398 |
$1,359,480 |
$906,893 |
4/30/18 |
$937,332 |
$1,364,697 |
$930,332 |
5/31/18 |
$950,917 |
$1,397,561 |
$943,512 |
6/30/18 |
$919,770 |
$1,406,163 |
$910,526 |
7/31/18 |
$897,607 |
$1,458,492 |
$891,093 |
8/31/18 |
$882,370 |
$1,506,017 |
$875,316 |
9/30/18 |
$898,580 |
$1,514,589 |
$892,101 |
10/31/18 |
$867,595 |
$1,411,067 |
$872,843 |
11/30/18 |
$847,877 |
$1,439,822 |
$867,927 |
12/31/18 |
$789,848 |
$1,309,819 |
$808,148 |
1/31/19 |
$844,222 |
$1,414,783 |
$852,163 |
2/28/19 |
$858,531 |
$1,460,209 |
$860,791 |
3/31/19 |
$863,875 |
$1,488,583 |
$859,254 |
4/30/19 |
$866,749 |
$1,548,856 |
$855,632 |
5/31/19 |
$832,252 |
$1,450,428 |
$826,844 |
6/30/19 |
$860,193 |
$1,552,649 |
$849,049 |
7/31/19 |
$852,904 |
$1,574,964 |
$843,338 |
8/31/19 |
$828,118 |
$1,550,016 |
$823,777 |
9/30/19 |
$834,210 |
$1,579,018 |
$833,453 |
10/31/19 |
$853,438 |
$1,613,219 |
$850,305 |
11/30/19 |
$834,210 |
$1,671,777 |
$828,533 |
12/31/19 |
$885,730 |
$1,722,235 |
$870,302 |
1/31/20 |
$820,230 |
$1,721,559 |
$806,275 |
2/29/20 |
$777,060 |
$1,579,842 |
$765,637 |
3/31/20 |
$634,905 |
$1,384,711 |
$667,566 |
4/30/20 |
$642,375 |
$1,562,223 |
$657,296 |
5/31/20 |
$685,698 |
$1,636,628 |
$685,825 |
6/30/20 |
$709,554 |
$1,669,176 |
$701,478 |
7/31/20 |
$759,163 |
$1,763,293 |
$741,515 |
8/31/20 |
$822,301 |
$1,890,039 |
$791,665 |
9/30/20 |
$792,714 |
$1,818,224 |
$765,133 |
10/31/20 |
$800,264 |
$1,769,870 |
$775,911 |
11/30/20 |
$838,012 |
$1,963,607 |
$803,165 |
12/31/20 |
$892,089 |
$2,039,105 |
$843,115 |
1/31/21 |
$923,895 |
$2,018,518 |
$865,252 |
2/28/21 |
$984,478 |
$2,074,179 |
$921,239 |
3/31/21 |
$969,332 |
$2,165,019 |
$901,460 |
4/30/21 |
$1,057,178 |
$2,280,563 |
$976,197 |
5/31/21 |
$1,095,043 |
$2,296,491 |
$1,002,832 |
6/30/21 |
$1,112,635 |
$2,350,103 |
$1,021,397 |
7/31/21 |
$1,145,793 |
$2,405,929 |
$1,040,176 |
8/31/21 |
$1,142,109 |
$2,479,083 |
$1,037,099 |
9/30/21 |
$1,193,258 |
$2,363,781 |
$1,088,697 |
10/31/21 |
$1,228,905 |
$2,529,392 |
$1,116,831 |
11/30/21 |
$1,136,972 |
$2,511,866 |
$1,035,184 |
12/31/21 |
$1,187,675 |
$2,624,438 |
$1,071,677 |
1/31/22 |
$1,278,021 |
$2,488,631 |
$1,165,757 |
2/28/22 |
$1,366,485 |
$2,414,118 |
$1,238,380 |
3/31/22 |
$1,478,485 |
$2,503,753 |
$1,345,463 |
4/30/22 |
$1,536,583 |
$2,285,421 |
$1,401,174 |
5/31/22 |
$1,564,630 |
$2,289,614 |
$1,422,542 |
6/30/22 |
$1,365,676 |
$2,100,621 |
$1,269,269 |
7/31/22 |
$1,451,168 |
$2,294,307 |
$1,323,371 |
8/31/22 |
$1,418,286 |
$2,200,741 |
$1,324,537 |
9/30/22 |
$1,249,622 |
$1,998,056 |
$1,217,138 |
10/31/22 |
$1,291,032 |
$2,159,821 |
$1,241,373 |
11/30/22 |
$1,327,571 |
$2,280,521 |
$1,275,363 |
12/31/22 |
$1,293,841 |
$2,149,130 |
$1,244,144 |
1/31/23 |
$1,291,179 |
$2,284,168 |
$1,238,048 |
2/28/23 |
$1,227,286 |
$2,228,437 |
$1,179,872 |
3/31/23 |
$1,238,430 |
$2,310,252 |
$1,177,442 |
4/30/23 |
$1,228,203 |
$2,346,311 |
$1,168,594 |
5/31/23 |
$1,143,596 |
$2,356,510 |
$1,102,728 |
6/30/23 |
$1,181,715 |
$2,512,217 |
$1,147,271 |
7/31/23 |
$1,262,604 |
$2,592,922 |
$1,219,048 |
8/31/23 |
$1,250,517 |
$2,551,639 |
$1,209,708 |
9/30/23 |
$1,234,711 |
$2,429,982 |
$1,201,309 |
10/31/23 |
$1,233,782 |
$2,378,888 |
$1,204,500 |
11/30/23 |
$1,218,905 |
$2,596,140 |
$1,177,367 |
12/31/23 |
$1,194,474 |
$2,714,085 |
$1,145,700 |
1/31/24 |
$1,203,776 |
$2,759,693 |
$1,150,258 |
2/29/24 |
$1,178,659 |
$2,907,048 |
$1,133,338 |
3/31/24 |
$1,222,298 |
$3,000,582 |
$1,170,830 |
4/30/24 |
$1,241,030 |
$2,878,024 |
$1,202,337 |
5/31/24 |
$1,267,256 |
$3,020,730 |
$1,223,445 |
6/30/24 |
$1,250,479 |
$3,129,120 |
$1,204,629 |
7/31/24 |
$1,209,836 |
$3,167,209 |
$1,156,009 |
8/31/24 |
$1,209,836 |
$3,244,035 |
$1,156,572 |
9/30/24 |
$1,273,915 |
$3,313,318 |
$1,212,799 |
10/31/24 |
$1,240,542 |
$3,283,271 |
$1,190,324 |
11/30/24 |
$1,242,449 |
$3,476,003 |
$1,195,165 |
12/31/24 |
$1,249,497 |
$3,393,141 |
$1,207,347 |
1/31/25 |
$1,302,198 |
$3,487,632 |
$1,255,084 |
2/28/25 |
$1,322,320 |
$3,442,124 |
$1,264,860 |
3/31/25 |
$1,383,251 |
$3,248,180 |
$1,314,556 |
|
| Average Annual Return [Table Text Block] |
Class/Index Name |
1 Year |
5 Years |
10 Years |
I-3 |
13.17% |
16.85% |
3.30% |
S&P 500 Index |
8.25% |
18.59% |
12.50% |
Bloomberg Commodity Index Total Return |
12.28% |
14.51% |
2.77% | |
| No Deduction of Taxes [Text Block] |
Returns shown do not reflect the deduction of taxes that a shareholder would pay on Fund distributions or the redemption of Fund shares.
|
| Performance Table Market Index Changed [Text Block] |
Differences in the Fund’s performance versus an index and related attribution information with respect to particular categories of securities or individual positions may be attributable, in part, to differences in the pricing methodologies used by the Fund and the index.
|
| Updated Performance Information Location [Text Block] |
For performance current to the most recent month-end, visit www.pimco.com/literature or via 888.87.PIMCO (888.877.4626).
|
| AssetsNet |
$ 3,745,951,000
|
| Holdings Count | Holding |
1,303
|
| Advisory Fees Paid, Amount |
$ 19,836,000
|
| InvestmentCompanyPortfolioTurnover |
268.00%
|
| Additional Fund Statistics [Text Block] |
Key Fund StatisticsFootnote Reference† (as of the end of the reporting period)
Total Net Assets |
$3,745,951 |
# of Portfolio Holdings |
1,303 |
Portfolio Turnover Rate |
268% |
Total Net Advisory Fees Paid During the Reporting Period |
$19,836 |
| Footnote |
Description |
Footnote† |
Dollar amounts displayed in 000's | |
| Holdings [Text Block] |
Security Type Breakdown (% of Net Asset Value)Footnote Reference*
U.S. Treasury Obligations |
76.2% |
U.S. Government Agencies |
13.8% |
Sovereign Issues |
10.9% |
Asset-Backed Securities |
9.4% |
Non-Agency Mortgage-Backed Securities |
1.2% |
Corporate Bonds & Notes |
0.2% |
Preferred Securities |
0.1% |
Short-Term Instruments |
12.0% |
Affiliated Investments |
8.1% |
Financial Derivative Instruments |
1.4% |
Other Assets and Liabilities, Net |
(33.3%) |
Total |
100.0% |
| Footnote |
Description |
Footnote* |
% of Net Asset Value includes derivatives instruments, if any, valued at the value used for determining the Fund's net asset value. The notional exposure of such derivatives investments therefore may be greater than what is depicted. | |
| Material Fund Change [Text Block] |
This is a summary of certain changes and planned changes of the Fund since the beginning of the reporting period. For more information, you may refer to the Fund's next prospectus, which we expect to be available by July 31, 2025 or upon request at 888.87.PIMCO (888.877.4626). Changes to Total Annual Fund Operating Expenses. Annual fund operating expenses decreased during the year by 0.10% as a result of lower expenses related to interest. |
| Material Fund Change Expenses [Text Block] |
Changes to Total Annual Fund Operating Expenses. Annual fund operating expenses decreased during the year by 0.10% as a result of lower expenses related to interest.
|
| Summary of Change Legend [Text Block] |
This is a summary of certain changes and planned changes of the Fund since the beginning of the reporting period. For more information, you may refer to the Fund's next prospectus, which we expect to be available by July 31, 2025 or upon request at 888.87.PIMCO (888.877.4626).
|
| C000026650 |
|
| Shareholder Report [Line Items] |
|
| Fund Name |
PIMCO CommodityRealReturn Strategy Fund<sup style="box-sizing: border-box; color: rgb(0, 0, 0); display: inline; flex-wrap: nowrap; font-size: 15px; font-weight: 700; grid-area: auto; line-height: 0px; margin: 0px; overflow: visible; position: relative; text-align: left; white-space-collapse: preserve-breaks;">®</sup>
|
| Class Name |
Institutional Class
|
| Trading Symbol |
PCRIX
|
| Annual or Semi-Annual Statement [Text Block] |
This annual shareholder report contains important information about the PIMCO CommodityRealReturn Strategy Fund® (the "Fund") for the period of April 1, 2024 to March 31, 2025 (the "reporting period").
|
| Shareholder Report Annual or Semi-Annual |
Annual Shareholder Report
|
| Additional Information [Text Block] |
You can find additional information about the Fund at www.pimco.com/literature. You can also request this information by contacting us at 888.87.PIMCO (888.877.4626).
|
| Material Fund Change Notice [Text Block] |
This report describes changes to the Fund that occurred during the reporting period.
|
| Additional Information Phone Number |
888.87.PIMCO (888.877.4626)
|
| Expenses [Text Block] |
What were the Fund costs for the reporting period?(based on a hypothetical $10,000 investment)
Class Name |
Cost of a $10,000 investment |
Costs paid as a percentage of a $10,000 investment |
Institutional Class |
$96 |
0.90% | |
| Expenses Paid, Amount |
$ 96
|
| Expense Ratio, Percent |
0.90%
|
| Factors Affecting Performance [Text Block] |
How did the Fund perform during the reporting period and what affected its performance?The following affected performance (on a gross basis) during the reporting period: The structural allocation to short-term U.S. Treasury inflation-protected securities ("TIPS”), contributed to relative performance versus the Bloomberg Commodity Index Total Return ("Index"), as short-term TIPS underperformed 3-month Treasury Bills. Eurozone interest rate strategies, including short exposure to duration and exposure to swap spreads, contributed to relative performance versus the Index, as eurozone rates rose, while swaps spreads tightened. Positioning within the agriculture sector, including an underweight exposure to corn, contributed to relative performance versus the Index, as corn posted negative returns. Exposure to U.S. non-agency residential mortgage-backed securities and collateralized loan obligations contributed to relative performance versus the Index, as spreads broadly tightened across these sectors. Exposure to California Carbon Allowances ("CCAs") detracted from relative performance versus the Index, as CCAs posted negative returns. Positioning within the energy sector, including an underweight exposure to natural gas, detracted from relative performance versus the Index, as natural gas posted positive returns. There were no other material detractors for this Fund.
|
| Performance Past Does Not Indicate Future [Text] |
Performance quoted represents past performance. Past performance is not a guarantee or a reliable indicator of future results.
|
| Line Graph [Table Text Block] |
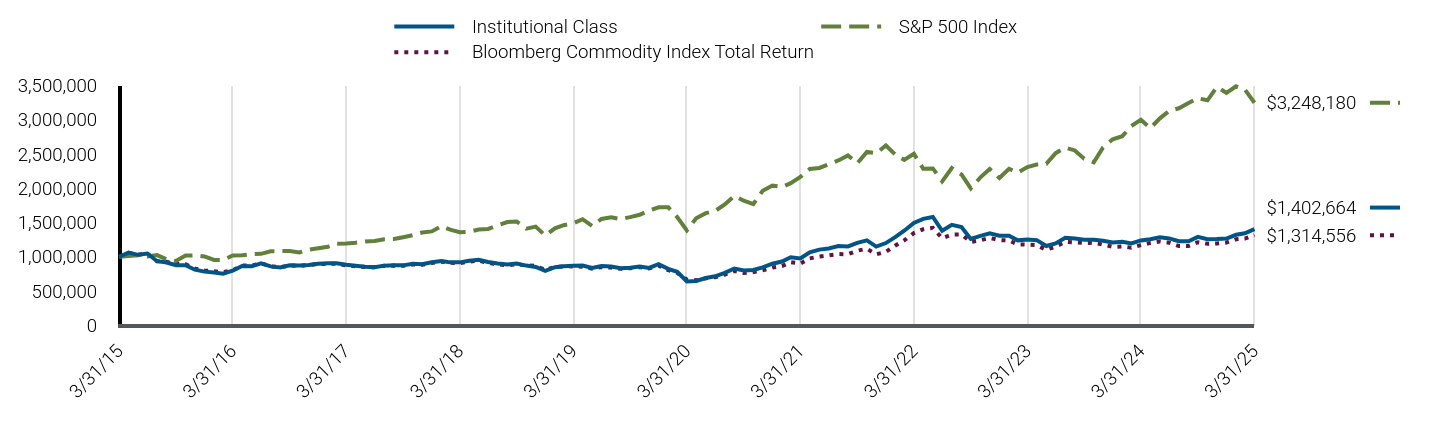
|
Institutional Class |
S&P 500 Index |
Bloomberg Commodity Index Total Return |
3/31/15 |
$1,000,000 |
$1,000,000 |
$1,000,000 |
4/30/15 |
$1,061,176 |
$1,009,593 |
$1,057,338 |
5/31/15 |
$1,028,235 |
$1,022,576 |
$1,028,810 |
6/30/15 |
$1,047,592 |
$1,002,781 |
$1,046,581 |
7/31/15 |
$935,435 |
$1,023,790 |
$935,445 |
8/31/15 |
$916,345 |
$962,021 |
$926,850 |
9/30/15 |
$877,020 |
$938,217 |
$895,178 |
10/31/15 |
$877,020 |
$1,017,360 |
$891,184 |
11/30/15 |
$811,335 |
$1,020,385 |
$826,535 |
12/31/15 |
$783,188 |
$1,004,292 |
$801,030 |
1/31/16 |
$769,535 |
$954,455 |
$787,568 |
2/29/16 |
$752,159 |
$953,167 |
$774,758 |
3/31/16 |
$796,841 |
$1,017,828 |
$804,366 |
4/30/16 |
$866,348 |
$1,021,774 |
$872,835 |
5/31/16 |
$860,142 |
$1,040,123 |
$871,186 |
6/30/16 |
$904,864 |
$1,042,818 |
$907,173 |
7/31/16 |
$860,056 |
$1,081,265 |
$860,803 |
8/31/16 |
$843,875 |
$1,082,784 |
$845,635 |
9/30/16 |
$876,770 |
$1,082,988 |
$872,120 |
10/31/16 |
$871,767 |
$1,063,233 |
$867,860 |
11/30/16 |
$879,271 |
$1,102,610 |
$879,433 |
12/31/16 |
$897,050 |
$1,124,405 |
$895,285 |
1/31/17 |
$904,567 |
$1,145,730 |
$896,497 |
2/28/17 |
$905,820 |
$1,191,223 |
$898,369 |
3/31/17 |
$882,658 |
$1,192,612 |
$874,459 |
4/30/17 |
$868,768 |
$1,204,860 |
$861,293 |
5/31/17 |
$854,878 |
$1,221,816 |
$849,853 |
6/30/17 |
$847,067 |
$1,229,442 |
$848,220 |
7/31/17 |
$870,452 |
$1,254,723 |
$867,399 |
8/31/17 |
$875,649 |
$1,258,564 |
$870,895 |
9/30/17 |
$874,544 |
$1,284,525 |
$869,597 |
10/31/17 |
$897,173 |
$1,314,500 |
$888,244 |
11/30/17 |
$891,849 |
$1,354,816 |
$884,147 |
12/31/17 |
$921,231 |
$1,369,880 |
$910,542 |
1/31/18 |
$938,921 |
$1,448,311 |
$928,625 |
2/28/18 |
$918,510 |
$1,394,930 |
$912,565 |
3/31/18 |
$918,510 |
$1,359,480 |
$906,893 |
4/30/18 |
$941,643 |
$1,364,697 |
$930,332 |
5/31/18 |
$955,250 |
$1,397,561 |
$943,512 |
6/30/18 |
$923,686 |
$1,406,163 |
$910,526 |
7/31/18 |
$901,495 |
$1,458,492 |
$891,093 |
8/31/18 |
$886,239 |
$1,506,017 |
$875,316 |
9/30/18 |
$902,439 |
$1,514,589 |
$892,101 |
10/31/18 |
$871,418 |
$1,411,067 |
$872,843 |
11/30/18 |
$851,677 |
$1,439,822 |
$867,927 |
12/31/18 |
$794,351 |
$1,309,819 |
$808,148 |
1/31/19 |
$847,403 |
$1,414,783 |
$852,163 |
2/28/19 |
$863,176 |
$1,460,209 |
$860,791 |
3/31/19 |
$868,810 |
$1,488,583 |
$859,254 |
4/30/19 |
$871,692 |
$1,548,856 |
$855,632 |
5/31/19 |
$837,113 |
$1,450,428 |
$826,844 |
6/30/19 |
$863,964 |
$1,552,649 |
$849,049 |
7/31/19 |
$858,116 |
$1,574,964 |
$843,338 |
8/31/19 |
$833,265 |
$1,550,016 |
$823,777 |
9/30/19 |
$839,700 |
$1,579,018 |
$833,453 |
10/31/19 |
$858,986 |
$1,613,219 |
$850,305 |
11/30/19 |
$838,216 |
$1,671,777 |
$828,533 |
12/31/19 |
$891,789 |
$1,722,235 |
$870,302 |
1/31/20 |
$824,569 |
$1,721,559 |
$806,275 |
2/29/20 |
$781,249 |
$1,579,842 |
$765,637 |
3/31/20 |
$638,815 |
$1,384,711 |
$667,566 |
4/30/20 |
$647,813 |
$1,562,223 |
$657,296 |
5/31/20 |
$689,801 |
$1,636,628 |
$685,825 |
6/30/20 |
$715,224 |
$1,669,176 |
$701,478 |
7/31/20 |
$765,019 |
$1,763,293 |
$741,515 |
8/31/20 |
$828,393 |
$1,890,039 |
$791,665 |
9/30/20 |
$798,912 |
$1,818,224 |
$765,133 |
10/31/20 |
$806,492 |
$1,769,870 |
$775,911 |
11/30/20 |
$844,391 |
$1,963,607 |
$803,165 |
12/31/20 |
$899,075 |
$2,039,105 |
$843,115 |
1/31/21 |
$931,022 |
$2,018,518 |
$865,252 |
2/28/21 |
$993,394 |
$2,074,179 |
$921,239 |
3/31/21 |
$976,660 |
$2,165,019 |
$901,460 |
4/30/21 |
$1,066,416 |
$2,280,563 |
$976,197 |
5/31/21 |
$1,104,447 |
$2,296,491 |
$1,002,832 |
6/30/21 |
$1,121,903 |
$2,350,103 |
$1,021,397 |
7/31/21 |
$1,157,021 |
$2,405,929 |
$1,040,176 |
8/31/21 |
$1,151,476 |
$2,479,083 |
$1,037,099 |
9/30/21 |
$1,203,331 |
$2,363,781 |
$1,088,697 |
10/31/21 |
$1,239,111 |
$2,529,392 |
$1,116,831 |
11/30/21 |
$1,148,720 |
$2,511,866 |
$1,035,184 |
12/31/21 |
$1,200,087 |
$2,624,438 |
$1,071,677 |
1/31/22 |
$1,290,802 |
$2,488,631 |
$1,165,757 |
2/28/22 |
$1,379,628 |
$2,414,118 |
$1,238,380 |
3/31/22 |
$1,492,316 |
$2,503,753 |
$1,345,463 |
4/30/22 |
$1,552,653 |
$2,285,421 |
$1,401,174 |
5/31/22 |
$1,580,809 |
$2,289,614 |
$1,422,542 |
6/30/22 |
$1,379,539 |
$2,100,621 |
$1,269,269 |
7/31/22 |
$1,465,347 |
$2,294,307 |
$1,323,371 |
8/31/22 |
$1,434,544 |
$2,200,741 |
$1,324,537 |
9/30/22 |
$1,261,177 |
$1,998,056 |
$1,217,138 |
10/31/22 |
$1,305,172 |
$2,159,821 |
$1,241,373 |
11/30/22 |
$1,341,834 |
$2,280,521 |
$1,275,363 |
12/31/22 |
$1,306,294 |
$2,149,130 |
$1,244,144 |
1/31/23 |
$1,306,294 |
$2,284,168 |
$1,238,048 |
2/28/23 |
$1,239,510 |
$2,228,437 |
$1,179,872 |
3/31/23 |
$1,252,780 |
$2,310,252 |
$1,177,442 |
4/30/23 |
$1,242,519 |
$2,346,311 |
$1,168,594 |
5/31/23 |
$1,156,700 |
$2,356,510 |
$1,102,728 |
6/30/23 |
$1,195,878 |
$2,512,217 |
$1,147,271 |
7/31/23 |
$1,277,967 |
$2,592,922 |
$1,219,048 |
8/31/23 |
$1,265,840 |
$2,551,639 |
$1,209,708 |
9/30/23 |
$1,249,982 |
$2,429,982 |
$1,201,309 |
10/31/23 |
$1,249,049 |
$2,378,888 |
$1,204,500 |
11/30/23 |
$1,234,124 |
$2,596,140 |
$1,177,367 |
12/31/23 |
$1,210,000 |
$2,714,085 |
$1,145,700 |
1/31/24 |
$1,218,409 |
$2,759,693 |
$1,150,258 |
2/29/24 |
$1,194,116 |
$2,907,048 |
$1,133,338 |
3/31/24 |
$1,238,304 |
$3,000,582 |
$1,170,830 |
4/30/24 |
$1,257,123 |
$2,878,024 |
$1,202,337 |
5/31/24 |
$1,284,411 |
$3,020,730 |
$1,223,445 |
6/30/24 |
$1,267,780 |
$3,129,120 |
$1,204,629 |
7/31/24 |
$1,225,995 |
$3,167,209 |
$1,156,009 |
8/31/24 |
$1,225,995 |
$3,244,035 |
$1,156,572 |
9/30/24 |
$1,290,599 |
$3,313,318 |
$1,212,799 |
10/31/24 |
$1,257,065 |
$3,283,271 |
$1,190,324 |
11/30/24 |
$1,259,939 |
$3,476,003 |
$1,195,165 |
12/31/24 |
$1,266,777 |
$3,393,141 |
$1,207,347 |
1/31/25 |
$1,320,723 |
$3,487,632 |
$1,255,084 |
2/28/25 |
$1,341,916 |
$3,442,124 |
$1,264,860 |
3/31/25 |
$1,402,664 |
$3,248,180 |
$1,314,556 |
|
| Average Annual Return [Table Text Block] |
Class/Index Name |
1 Year |
5 Years |
10 Years |
Institutional Class |
13.27% |
17.03% |
3.44% |
S&P 500 Index |
8.25% |
18.59% |
12.50% |
Bloomberg Commodity Index Total Return |
12.28% |
14.51% |
2.77% | |
| No Deduction of Taxes [Text Block] |
Returns shown do not reflect the deduction of taxes that a shareholder would pay on Fund distributions or the redemption of Fund shares.
|
| Performance Table Market Index Changed [Text Block] |
Differences in the Fund’s performance versus an index and related attribution information with respect to particular categories of securities or individual positions may be attributable, in part, to differences in the pricing methodologies used by the Fund and the index.
|
| Updated Performance Information Location [Text Block] |
For performance current to the most recent month-end, visit www.pimco.com/literature or via 888.87.PIMCO (888.877.4626).
|
| AssetsNet |
$ 3,745,951,000
|
| Holdings Count | Holding |
1,303
|
| Advisory Fees Paid, Amount |
$ 19,836,000
|
| InvestmentCompanyPortfolioTurnover |
268.00%
|
| Additional Fund Statistics [Text Block] |
Key Fund StatisticsFootnote Reference† (as of the end of the reporting period)
Total Net Assets |
$3,745,951 |
# of Portfolio Holdings |
1,303 |
Portfolio Turnover Rate |
268% |
Total Net Advisory Fees Paid During the Reporting Period |
$19,836 |
| Footnote |
Description |
Footnote† |
Dollar amounts displayed in 000's | |
| Holdings [Text Block] |
Security Type Breakdown (% of Net Asset Value)Footnote Reference*
U.S. Treasury Obligations |
76.2% |
U.S. Government Agencies |
13.8% |
Sovereign Issues |
10.9% |
Asset-Backed Securities |
9.4% |
Non-Agency Mortgage-Backed Securities |
1.2% |
Corporate Bonds & Notes |
0.2% |
Preferred Securities |
0.1% |
Short-Term Instruments |
12.0% |
Affiliated Investments |
8.1% |
Financial Derivative Instruments |
1.4% |
Other Assets and Liabilities, Net |
(33.3%) |
Total |
100.0% |
| Footnote |
Description |
Footnote* |
% of Net Asset Value includes derivatives instruments, if any, valued at the value used for determining the Fund's net asset value. The notional exposure of such derivatives investments therefore may be greater than what is depicted. | |
| Material Fund Change [Text Block] |
This is a summary of certain changes and planned changes of the Fund since the beginning of the reporting period. For more information, you may refer to the Fund's next prospectus, which we expect to be available by July 31, 2025 or upon request at 888.87.PIMCO (888.877.4626). Changes to Total Annual Fund Operating Expenses. Annual fund operating expenses decreased during the year by 0.10% as a result of lower expenses related to interest. |
| Material Fund Change Expenses [Text Block] |
Changes to Total Annual Fund Operating Expenses. Annual fund operating expenses decreased during the year by 0.10% as a result of lower expenses related to interest.
|
| Summary of Change Legend [Text Block] |
This is a summary of certain changes and planned changes of the Fund since the beginning of the reporting period. For more information, you may refer to the Fund's next prospectus, which we expect to be available by July 31, 2025 or upon request at 888.87.PIMCO (888.877.4626).
|
| C000064156 |
|
| Shareholder Report [Line Items] |
|
| Fund Name |
PIMCO CommodityRealReturn Strategy Fund<sup style="box-sizing: border-box; color: rgb(0, 0, 0); display: inline; flex-wrap: nowrap; font-size: 15px; font-weight: 700; grid-area: auto; line-height: 0px; margin: 0px; overflow: visible; position: relative; text-align: left; white-space-collapse: preserve-breaks;">®</sup>
|
| Class Name |
I-2
|
| Trading Symbol |
PCRPX
|
| Annual or Semi-Annual Statement [Text Block] |
This annual shareholder report contains important information about the PIMCO CommodityRealReturn Strategy Fund® (the "Fund") for the period of April 1, 2024 to March 31, 2025 (the "reporting period").
|
| Shareholder Report Annual or Semi-Annual |
Annual Shareholder Report
|
| Additional Information [Text Block] |
You can find additional information about the Fund at www.pimco.com/literature. You can also request this information by contacting us at 888.87.PIMCO (888.877.4626).
|
| Material Fund Change Notice [Text Block] |
This report describes changes to the Fund that occurred during the reporting period.
|
| Additional Information Phone Number |
888.87.PIMCO (888.877.4626)
|
| Expenses [Text Block] |
What were the Fund costs for the reporting period?(based on a hypothetical $10,000 investment)
Class Name |
Cost of a $10,000 investment |
Costs paid as a percentage of a $10,000 investment |
I-2 |
$107 |
1.00% | |
| Expenses Paid, Amount |
$ 107
|
| Expense Ratio, Percent |
1.00%
|
| Factors Affecting Performance [Text Block] |
How did the Fund perform during the reporting period and what affected its performance?The following affected performance (on a gross basis) during the reporting period: The structural allocation to short-term U.S. Treasury inflation-protected securities ("TIPS”), contributed to relative performance versus the Bloomberg Commodity Index Total Return ("Index"), as short-term TIPS underperformed 3-month Treasury Bills. Eurozone interest rate strategies, including short exposure to duration and exposure to swap spreads, contributed to relative performance versus the Index, as eurozone rates rose, while swaps spreads tightened. Positioning within the agriculture sector, including an underweight exposure to corn, contributed to relative performance versus the Index, as corn posted negative returns. Exposure to U.S. non-agency residential mortgage-backed securities and collateralized loan obligations contributed to relative performance versus the Index, as spreads broadly tightened across these sectors. Exposure to California Carbon Allowances ("CCAs") detracted from relative performance versus the Index, as CCAs posted negative returns. Positioning within the energy sector, including an underweight exposure to natural gas, detracted from relative performance versus the Index, as natural gas posted positive returns. There were no other material detractors for this Fund.
|
| Performance Past Does Not Indicate Future [Text] |
Performance quoted represents past performance. Past performance is not a guarantee or a reliable indicator of future results.
|
| Line Graph [Table Text Block] |

|
I-2 |
S&P 500 Index |
Bloomberg Commodity Index Total Return |
3/31/15 |
$1,000,000 |
$1,000,000 |
$1,000,000 |
4/30/15 |
$1,061,321 |
$1,009,593 |
$1,057,338 |
5/31/15 |
$1,028,302 |
$1,022,576 |
$1,028,810 |
6/30/15 |
$1,045,126 |
$1,002,781 |
$1,046,581 |
7/31/15 |
$935,112 |
$1,023,790 |
$935,445 |
8/31/15 |
$914,784 |
$962,021 |
$926,850 |
9/30/15 |
$876,303 |
$938,217 |
$895,178 |
10/31/15 |
$876,303 |
$1,017,360 |
$891,184 |
11/30/15 |
$810,488 |
$1,020,385 |
$826,535 |
12/31/15 |
$782,095 |
$1,004,292 |
$801,030 |
1/31/16 |
$769,661 |
$954,455 |
$787,568 |
2/29/16 |
$751,010 |
$953,167 |
$774,758 |
3/31/16 |
$795,772 |
$1,017,828 |
$804,366 |
4/30/16 |
$865,402 |
$1,021,774 |
$872,835 |
5/31/16 |
$859,185 |
$1,040,123 |
$871,186 |
6/30/16 |
$903,797 |
$1,042,818 |
$907,173 |
7/31/16 |
$858,919 |
$1,081,265 |
$860,803 |
8/31/16 |
$842,713 |
$1,082,784 |
$845,635 |
9/30/16 |
$875,364 |
$1,082,988 |
$872,120 |
10/31/16 |
$870,355 |
$1,063,233 |
$867,860 |
11/30/16 |
$877,869 |
$1,102,610 |
$879,433 |
12/31/16 |
$895,439 |
$1,124,405 |
$895,285 |
1/31/17 |
$902,964 |
$1,145,730 |
$896,497 |
2/28/17 |
$904,218 |
$1,191,223 |
$898,369 |
3/31/17 |
$880,869 |
$1,192,612 |
$874,459 |
4/30/17 |
$866,967 |
$1,204,860 |
$861,293 |
5/31/17 |
$853,065 |
$1,221,816 |
$849,853 |
6/30/17 |
$845,089 |
$1,229,442 |
$848,220 |
7/31/17 |
$868,492 |
$1,254,723 |
$867,399 |
8/31/17 |
$873,692 |
$1,258,564 |
$870,895 |
9/30/17 |
$872,330 |
$1,284,525 |
$869,597 |
10/31/17 |
$894,971 |
$1,314,500 |
$888,244 |
11/30/17 |
$889,644 |
$1,354,816 |
$884,147 |
12/31/17 |
$918,768 |
$1,369,880 |
$910,542 |
1/31/18 |
$936,463 |
$1,448,311 |
$928,625 |
2/28/18 |
$916,046 |
$1,394,930 |
$912,565 |
3/31/18 |
$916,046 |
$1,359,480 |
$906,893 |
4/30/18 |
$937,824 |
$1,364,697 |
$930,332 |
5/31/18 |
$951,435 |
$1,397,561 |
$943,512 |
6/30/18 |
$919,778 |
$1,406,163 |
$910,526 |
7/31/18 |
$897,581 |
$1,458,492 |
$891,093 |
8/31/18 |
$883,708 |
$1,506,017 |
$875,316 |
9/30/18 |
$899,665 |
$1,514,589 |
$892,101 |
10/31/18 |
$868,642 |
$1,411,067 |
$872,843 |
11/30/18 |
$848,900 |
$1,439,822 |
$867,927 |
12/31/18 |
$791,201 |
$1,309,819 |
$808,148 |
1/31/19 |
$844,234 |
$1,414,783 |
$852,163 |
2/28/19 |
$860,001 |
$1,460,209 |
$860,791 |
3/31/19 |
$865,444 |
$1,488,583 |
$859,254 |
4/30/19 |
$868,324 |
$1,548,856 |
$855,632 |
5/31/19 |
$833,764 |
$1,450,428 |
$826,844 |
6/30/19 |
$860,425 |
$1,552,649 |
$849,049 |
7/31/19 |
$854,582 |
$1,574,964 |
$843,338 |
8/31/19 |
$829,748 |
$1,550,016 |
$823,777 |
9/30/19 |
$835,999 |
$1,579,018 |
$833,453 |
10/31/19 |
$855,268 |
$1,613,219 |
$850,305 |
11/30/19 |
$834,517 |
$1,671,777 |
$828,533 |
12/31/19 |
$887,827 |
$1,722,235 |
$870,302 |
1/31/20 |
$820,681 |
$1,721,559 |
$806,275 |
2/29/20 |
$778,901 |
$1,579,842 |
$765,637 |
3/31/20 |
$636,522 |
$1,384,711 |
$667,566 |
4/30/20 |
$644,010 |
$1,562,223 |
$657,296 |
5/31/20 |
$685,946 |
$1,636,628 |
$685,825 |
6/30/20 |
$711,294 |
$1,669,176 |
$701,478 |
7/31/20 |
$761,024 |
$1,763,293 |
$741,515 |
8/31/20 |
$824,318 |
$1,890,039 |
$791,665 |
9/30/20 |
$794,715 |
$1,818,224 |
$765,133 |
10/31/20 |
$800,770 |
$1,769,870 |
$775,911 |
11/30/20 |
$838,614 |
$1,963,607 |
$803,165 |
12/31/20 |
$894,545 |
$2,039,105 |
$843,115 |
1/31/21 |
$924,920 |
$2,018,518 |
$865,252 |
2/28/21 |
$987,189 |
$2,074,179 |
$921,239 |
3/31/21 |
$970,482 |
$2,165,019 |
$901,460 |
4/30/21 |
$1,060,089 |
$2,280,563 |
$976,197 |
5/31/21 |
$1,098,057 |
$2,296,491 |
$1,002,832 |
6/30/21 |
$1,115,506 |
$2,350,103 |
$1,021,397 |
7/31/21 |
$1,148,750 |
$2,405,929 |
$1,040,176 |
8/31/21 |
$1,145,056 |
$2,479,083 |
$1,037,099 |
9/30/21 |
$1,196,515 |
$2,363,781 |
$1,088,697 |
10/31/21 |
$1,232,260 |
$2,529,392 |
$1,116,831 |
11/30/21 |
$1,140,076 |
$2,511,866 |
$1,035,184 |
12/31/21 |
$1,191,052 |
$2,624,438 |
$1,071,677 |
1/31/22 |
$1,281,655 |
$2,488,631 |
$1,165,757 |
2/28/22 |
$1,370,370 |
$2,414,118 |
$1,238,380 |
3/31/22 |
$1,482,674 |
$2,503,753 |
$1,345,463 |
4/30/22 |
$1,540,936 |
$2,285,421 |
$1,401,174 |
5/31/22 |
$1,569,063 |
$2,289,614 |
$1,422,542 |
6/30/22 |
$1,369,850 |
$2,100,621 |
$1,269,269 |
7/31/22 |
$1,455,603 |
$2,294,307 |
$1,323,371 |
8/31/22 |
$1,422,622 |
$2,200,741 |
$1,324,537 |
9/30/22 |
$1,253,544 |
$1,998,056 |
$1,217,138 |
10/31/22 |
$1,295,084 |
$2,159,821 |
$1,241,373 |
11/30/22 |
$1,331,738 |
$2,280,521 |
$1,275,363 |
12/31/22 |
$1,298,511 |
$2,149,130 |
$1,244,144 |
1/31/23 |
$1,295,840 |
$2,284,168 |
$1,238,048 |
2/28/23 |
$1,229,044 |
$2,228,437 |
$1,179,872 |
3/31/23 |
$1,242,977 |
$2,310,252 |
$1,177,442 |
4/30/23 |
$1,232,713 |
$2,346,311 |
$1,168,594 |
5/31/23 |
$1,146,861 |
$2,356,510 |
$1,102,728 |
6/30/23 |
$1,186,054 |
$2,512,217 |
$1,147,271 |
7/31/23 |
$1,267,240 |
$2,592,922 |
$1,219,048 |
8/31/23 |
$1,255,109 |
$2,551,639 |
$1,209,708 |
9/30/23 |
$1,239,245 |
$2,429,982 |
$1,201,309 |
10/31/23 |
$1,238,312 |
$2,378,888 |
$1,204,500 |
11/30/23 |
$1,223,381 |
$2,596,140 |
$1,177,367 |
12/31/23 |
$1,199,073 |
$2,714,085 |
$1,145,700 |
1/31/24 |
$1,208,411 |
$2,759,693 |
$1,150,258 |
2/29/24 |
$1,183,197 |
$2,907,048 |
$1,133,338 |
3/31/24 |
$1,227,115 |
$3,000,582 |
$1,170,830 |
4/30/24 |
$1,245,922 |
$2,878,024 |
$1,202,337 |
5/31/24 |
$1,272,251 |
$3,020,730 |
$1,223,445 |
6/30/24 |
$1,255,396 |
$3,129,120 |
$1,204,629 |
7/31/24 |
$1,215,542 |
$3,167,209 |
$1,156,009 |
8/31/24 |
$1,214,593 |
$3,244,035 |
$1,156,572 |
9/30/24 |
$1,279,078 |
$3,313,318 |
$1,212,799 |
10/31/24 |
$1,245,569 |
$3,283,271 |
$1,190,324 |
11/30/24 |
$1,248,441 |
$3,476,003 |
$1,195,165 |
12/31/24 |
$1,254,908 |
$3,393,141 |
$1,207,347 |
1/31/25 |
$1,307,837 |
$3,487,632 |
$1,255,084 |
2/28/25 |
$1,328,047 |
$3,442,124 |
$1,264,860 |
3/31/25 |
$1,388,470 |
$3,248,180 |
$1,314,556 |
|
| Average Annual Return [Table Text Block] |
Class/Index Name |
1 Year |
5 Years |
10 Years |
I-2 |
13.15% |
16.88% |
3.34% |
S&P 500 Index |
8.25% |
18.59% |
12.50% |
Bloomberg Commodity Index Total Return |
12.28% |
14.51% |
2.77% | |
| No Deduction of Taxes [Text Block] |
Returns shown do not reflect the deduction of taxes that a shareholder would pay on Fund distributions or the redemption of Fund shares.
|
| Performance Table Market Index Changed [Text Block] |
Differences in the Fund’s performance versus an index and related attribution information with respect to particular categories of securities or individual positions may be attributable, in part, to differences in the pricing methodologies used by the Fund and the index.
|
| Updated Performance Information Location [Text Block] |
For performance current to the most recent month-end, visit www.pimco.com/literature or via 888.87.PIMCO (888.877.4626).
|
| AssetsNet |
$ 3,745,951,000
|
| Holdings Count | Holding |
1,303
|
| Advisory Fees Paid, Amount |
$ 19,836,000
|
| InvestmentCompanyPortfolioTurnover |
268.00%
|
| Additional Fund Statistics [Text Block] |
Key Fund StatisticsFootnote Reference† (as of the end of the reporting period)
Total Net Assets |
$3,745,951 |
# of Portfolio Holdings |
1,303 |
Portfolio Turnover Rate |
268% |
Total Net Advisory Fees Paid During the Reporting Period |
$19,836 |
| Footnote |
Description |
Footnote† |
Dollar amounts displayed in 000's | |
| Holdings [Text Block] |
Security Type Breakdown (% of Net Asset Value)Footnote Reference*
U.S. Treasury Obligations |
76.2% |
U.S. Government Agencies |
13.8% |
Sovereign Issues |
10.9% |
Asset-Backed Securities |
9.4% |
Non-Agency Mortgage-Backed Securities |
1.2% |
Corporate Bonds & Notes |
0.2% |
Preferred Securities |
0.1% |
Short-Term Instruments |
12.0% |
Affiliated Investments |
8.1% |
Financial Derivative Instruments |
1.4% |
Other Assets and Liabilities, Net |
(33.3%) |
Total |
100.0% |
| Footnote |
Description |
Footnote* |
% of Net Asset Value includes derivatives instruments, if any, valued at the value used for determining the Fund's net asset value. The notional exposure of such derivatives investments therefore may be greater than what is depicted. | |
| Material Fund Change [Text Block] |
This is a summary of certain changes and planned changes of the Fund since the beginning of the reporting period. For more information, you may refer to the Fund's next prospectus, which we expect to be available by July 31, 2025 or upon request at 888.87.PIMCO (888.877.4626). Changes to Total Annual Fund Operating Expenses. Annual fund operating expenses decreased during the year by 0.10% as a result of lower expenses related to interest. |
| Material Fund Change Expenses [Text Block] |
Changes to Total Annual Fund Operating Expenses. Annual fund operating expenses decreased during the year by 0.10% as a result of lower expenses related to interest.
|
| Summary of Change Legend [Text Block] |
This is a summary of certain changes and planned changes of the Fund since the beginning of the reporting period. For more information, you may refer to the Fund's next prospectus, which we expect to be available by July 31, 2025 or upon request at 888.87.PIMCO (888.877.4626).
|
| C000088664 |
|
| Shareholder Report [Line Items] |
|
| Fund Name |
PIMCO CommodityRealReturn Strategy Fund<sup style="box-sizing: border-box; color: rgb(0, 0, 0); display: inline; flex-wrap: nowrap; font-size: 15px; font-weight: 700; grid-area: auto; line-height: 0px; margin: 0px; overflow: visible; position: relative; text-align: left; white-space-collapse: preserve-breaks;">®</sup>
|
| Class Name |
Class R
|
| Trading Symbol |
PCSRX
|
| Annual or Semi-Annual Statement [Text Block] |
This annual shareholder report contains important information about the PIMCO CommodityRealReturn Strategy Fund® (the "Fund") for the period of April 1, 2024 to March 31, 2025 (the "reporting period").
|
| Shareholder Report Annual or Semi-Annual |
Annual Shareholder Report
|
| Additional Information [Text Block] |
You can find additional information about the Fund at www.pimco.com/literature. You can also request this information by contacting us at 888.87.PIMCO (888.877.4626).
|
| Material Fund Change Notice [Text Block] |
This report describes changes to the Fund that occurred during the reporting period.
|
| Additional Information Phone Number |
888.87.PIMCO (888.877.4626)
|
| Expenses [Text Block] |
What were the Fund costs for the reporting period?(based on a hypothetical $10,000 investment)
Class Name |
Cost of a $10,000 investment |
Costs paid as a percentage of a $10,000 investment |
Class R |
$170 |
1.60% | |
| Expenses Paid, Amount |
$ 170
|
| Expense Ratio, Percent |
1.60%
|
| Factors Affecting Performance [Text Block] |
How did the Fund perform during the reporting period and what affected its performance?The following affected performance (on a gross basis) during the reporting period: The structural allocation to short-term U.S. Treasury inflation-protected securities ("TIPS”), contributed to relative performance versus the Bloomberg Commodity Index Total Return ("Index"), as short-term TIPS underperformed 3-month Treasury Bills. Eurozone interest rate strategies, including short exposure to duration and exposure to swap spreads, contributed to relative performance versus the Index, as eurozone rates rose, while swaps spreads tightened. Positioning within the agriculture sector, including an underweight exposure to corn, contributed to relative performance versus the Index, as corn posted negative returns. Exposure to U.S. non-agency residential mortgage-backed securities and collateralized loan obligations contributed to relative performance versus the Index, as spreads broadly tightened across these sectors. Exposure to California Carbon Allowances ("CCAs") detracted from relative performance versus the Index, as CCAs posted negative returns. Positioning within the energy sector, including an underweight exposure to natural gas, detracted from relative performance versus the Index, as natural gas posted positive returns. There were no other material detractors for this Fund.
|
| Performance Past Does Not Indicate Future [Text] |
Performance quoted represents past performance. Past performance is not a guarantee or a reliable indicator of future results.
|
| Line Graph [Table Text Block] |
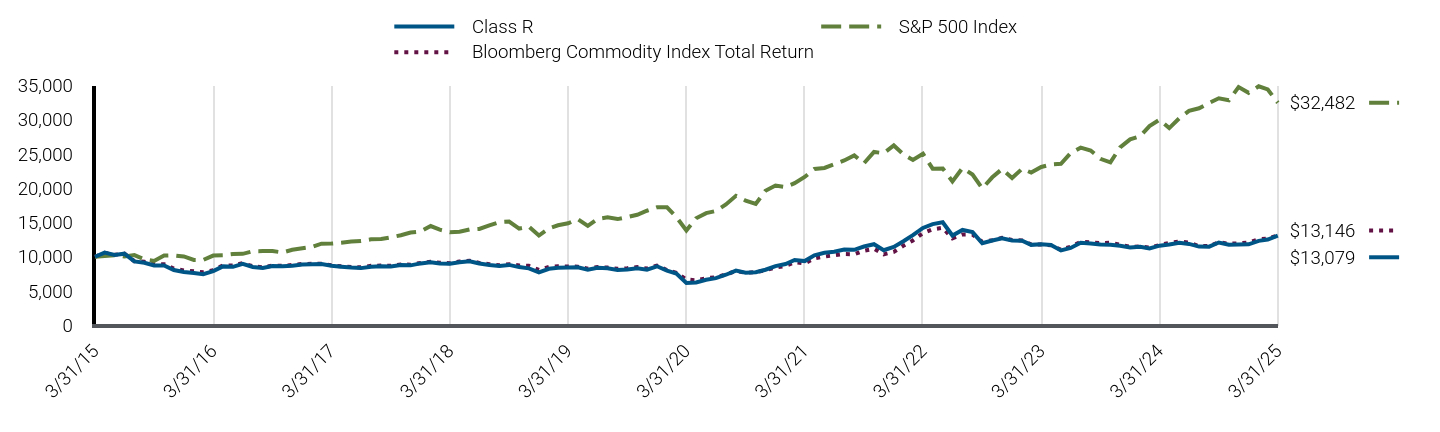
|
Class R |
S&P 500 Index |
Bloomberg Commodity Index Total Return |
3/31/15 |
$10,000 |
$10,000 |
$10,000 |
4/30/15 |
$10,610 |
$10,096 |
$10,573 |
5/31/15 |
$10,268 |
$10,226 |
$10,288 |
6/30/15 |
$10,456 |
$10,028 |
$10,466 |
7/31/15 |
$9,319 |
$10,238 |
$9,354 |
8/31/15 |
$9,133 |
$9,620 |
$9,269 |
9/30/15 |
$8,735 |
$9,382 |
$8,952 |
10/31/15 |
$8,735 |
$10,174 |
$8,912 |
11/30/15 |
$8,068 |
$10,204 |
$8,265 |
12/31/15 |
$7,788 |
$10,043 |
$8,010 |
1/31/16 |
$7,646 |
$9,545 |
$7,876 |
2/29/16 |
$7,467 |
$9,532 |
$7,748 |
3/31/16 |
$7,903 |
$10,178 |
$8,044 |
4/30/16 |
$8,596 |
$10,218 |
$8,728 |
5/31/16 |
$8,532 |
$10,401 |
$8,712 |
6/30/16 |
$8,970 |
$10,428 |
$9,072 |
7/31/16 |
$8,520 |
$10,813 |
$8,608 |
8/31/16 |
$8,353 |
$10,828 |
$8,456 |
9/30/16 |
$8,663 |
$10,830 |
$8,721 |
10/31/16 |
$8,611 |
$10,632 |
$8,679 |
11/30/16 |
$8,688 |
$11,026 |
$8,794 |
12/31/16 |
$8,856 |
$11,244 |
$8,953 |
1/31/17 |
$8,920 |
$11,457 |
$8,965 |
2/28/17 |
$8,933 |
$11,912 |
$8,984 |
3/31/17 |
$8,696 |
$11,926 |
$8,745 |
4/30/17 |
$8,553 |
$12,049 |
$8,613 |
5/31/17 |
$8,423 |
$12,218 |
$8,499 |
6/30/17 |
$8,345 |
$12,294 |
$8,482 |
7/31/17 |
$8,558 |
$12,547 |
$8,674 |
8/31/17 |
$8,612 |
$12,586 |
$8,709 |
9/30/17 |
$8,598 |
$12,845 |
$8,696 |
10/31/17 |
$8,803 |
$13,145 |
$8,882 |
11/30/17 |
$8,748 |
$13,548 |
$8,841 |
12/31/17 |
$9,034 |
$13,699 |
$9,105 |
1/31/18 |
$9,201 |
$14,483 |
$9,286 |
2/28/18 |
$9,006 |
$13,949 |
$9,126 |
3/31/18 |
$8,992 |
$13,595 |
$9,069 |
4/30/18 |
$9,215 |
$13,647 |
$9,303 |
5/31/18 |
$9,341 |
$13,976 |
$9,435 |
6/30/18 |
$9,019 |
$14,062 |
$9,105 |
7/31/18 |
$8,791 |
$14,585 |
$8,911 |
8/31/18 |
$8,649 |
$15,060 |
$8,753 |
9/30/18 |
$8,813 |
$15,146 |
$8,921 |
10/31/18 |
$8,496 |
$14,111 |
$8,728 |
11/30/18 |
$8,308 |
$14,398 |
$8,679 |
12/31/18 |
$7,732 |
$13,098 |
$8,081 |
1/31/19 |
$8,245 |
$14,148 |
$8,522 |
2/28/19 |
$8,392 |
$14,602 |
$8,608 |
3/31/19 |
$8,437 |
$14,886 |
$8,593 |
4/30/19 |
$8,467 |
$15,489 |
$8,556 |
5/31/19 |
$8,128 |
$14,504 |
$8,268 |
6/30/19 |
$8,391 |
$15,526 |
$8,490 |
7/31/19 |
$8,317 |
$15,750 |
$8,433 |
8/31/19 |
$8,078 |
$15,500 |
$8,238 |
9/30/19 |
$8,129 |
$15,790 |
$8,335 |
10/31/19 |
$8,311 |
$16,132 |
$8,503 |
11/30/19 |
$8,114 |
$16,718 |
$8,285 |
12/31/19 |
$8,614 |
$17,222 |
$8,703 |
1/31/20 |
$7,974 |
$17,216 |
$8,063 |
2/29/20 |
$7,548 |
$15,798 |
$7,656 |
3/31/20 |
$6,163 |
$13,847 |
$6,676 |
4/30/20 |
$6,239 |
$15,622 |
$6,573 |
5/31/20 |
$6,651 |
$16,366 |
$6,858 |
6/30/20 |
$6,887 |
$16,692 |
$7,015 |
7/31/20 |
$7,378 |
$17,633 |
$7,415 |
8/31/20 |
$7,976 |
$18,900 |
$7,917 |
9/30/20 |
$7,678 |
$18,182 |
$7,651 |
10/31/20 |
$7,740 |
$17,699 |
$7,759 |
11/30/20 |
$8,109 |
$19,636 |
$8,032 |
12/31/20 |
$8,632 |
$20,391 |
$8,431 |
1/31/21 |
$8,941 |
$20,185 |
$8,653 |
2/28/21 |
$9,526 |
$20,742 |
$9,212 |
3/31/21 |
$9,372 |
$21,650 |
$9,015 |
4/30/21 |
$10,220 |
$22,806 |
$9,762 |
5/31/21 |
$10,574 |
$22,965 |
$10,028 |
6/30/21 |
$10,743 |
$23,501 |
$10,214 |
7/31/21 |
$11,065 |
$24,059 |
$10,402 |
8/31/21 |
$11,009 |
$24,791 |
$10,371 |
9/30/21 |
$11,501 |
$23,638 |
$10,887 |
10/31/21 |
$11,829 |
$25,294 |
$11,168 |
11/30/21 |
$10,961 |
$25,119 |
$10,352 |
12/31/21 |
$11,445 |
$26,244 |
$10,717 |
1/31/22 |
$12,295 |
$24,886 |
$11,658 |
2/28/22 |
$13,146 |
$24,141 |
$12,384 |
3/31/22 |
$14,206 |
$25,038 |
$13,455 |
4/30/22 |
$14,764 |
$22,854 |
$14,012 |
5/31/22 |
$15,032 |
$22,896 |
$14,225 |
6/30/22 |
$13,097 |
$21,006 |
$12,693 |
7/31/22 |
$13,915 |
$22,943 |
$13,234 |
8/31/22 |
$13,597 |
$22,007 |
$13,245 |
9/30/22 |
$11,967 |
$19,981 |
$12,171 |
10/31/22 |
$12,374 |
$21,598 |
$12,414 |
11/30/22 |
$12,705 |
$22,805 |
$12,754 |
12/31/22 |
$12,384 |
$21,491 |
$12,441 |
1/31/23 |
$12,356 |
$22,842 |
$12,380 |
2/28/23 |
$11,739 |
$22,284 |
$11,799 |
3/31/23 |
$11,834 |
$23,103 |
$11,774 |
4/30/23 |
$11,735 |
$23,463 |
$11,686 |
5/31/23 |
$10,920 |
$23,565 |
$11,027 |
6/30/23 |
$11,284 |
$25,122 |
$11,473 |
7/31/23 |
$12,050 |
$25,929 |
$12,190 |
8/31/23 |
$11,932 |
$25,516 |
$12,097 |
9/30/23 |
$11,775 |
$24,300 |
$12,013 |
10/31/23 |
$11,755 |
$23,789 |
$12,045 |
11/30/23 |
$11,608 |
$25,961 |
$11,774 |
12/31/23 |
$11,372 |
$27,141 |
$11,457 |
1/31/24 |
$11,451 |
$27,597 |
$11,503 |
2/29/24 |
$11,215 |
$29,070 |
$11,333 |
3/31/24 |
$11,624 |
$30,006 |
$11,708 |
4/30/24 |
$11,792 |
$28,780 |
$12,023 |
5/31/24 |
$12,039 |
$30,207 |
$12,234 |
6/30/24 |
$11,878 |
$31,291 |
$12,046 |
7/31/24 |
$11,489 |
$31,672 |
$11,560 |
8/31/24 |
$11,469 |
$32,440 |
$11,566 |
9/30/24 |
$12,078 |
$33,133 |
$12,128 |
10/31/24 |
$11,757 |
$32,833 |
$11,903 |
11/30/24 |
$11,777 |
$34,760 |
$11,952 |
12/31/24 |
$11,824 |
$33,931 |
$12,073 |
1/31/25 |
$12,319 |
$34,876 |
$12,551 |
2/28/25 |
$12,511 |
$34,421 |
$12,649 |
3/31/25 |
$13,079 |
$32,482 |
$13,146 |
|
| Average Annual Return [Table Text Block] |
Class/Index Name |
1 Year |
5 Years |
10 Years |
Class R |
12.52% |
16.24% |
2.72% |
S&P 500 Index |
8.25% |
18.59% |
12.50% |
Bloomberg Commodity Index Total Return |
12.28% |
14.51% |
2.77% | |
| No Deduction of Taxes [Text Block] |
Returns shown do not reflect the deduction of taxes that a shareholder would pay on Fund distributions or the redemption of Fund shares.
|
| Performance Table Market Index Changed [Text Block] |
Differences in the Fund’s performance versus an index and related attribution information with respect to particular categories of securities or individual positions may be attributable, in part, to differences in the pricing methodologies used by the Fund and the index.
|
| Updated Performance Information Location [Text Block] |
For performance current to the most recent month-end, visit www.pimco.com/literature or via 888.87.PIMCO (888.877.4626).
|
| AssetsNet |
$ 3,745,951,000
|
| Holdings Count | Holding |
1,303
|
| Advisory Fees Paid, Amount |
$ 19,836,000
|
| InvestmentCompanyPortfolioTurnover |
268.00%
|
| Additional Fund Statistics [Text Block] |
Key Fund StatisticsFootnote Reference† (as of the end of the reporting period)
Total Net Assets |
$3,745,951 |
# of Portfolio Holdings |
1,303 |
Portfolio Turnover Rate |
268% |
Total Net Advisory Fees Paid During the Reporting Period |
$19,836 |
| Footnote |
Description |
Footnote† |
Dollar amounts displayed in 000's | |
| Holdings [Text Block] |
Security Type Breakdown (% of Net Asset Value)Footnote Reference*
U.S. Treasury Obligations |
76.2% |
U.S. Government Agencies |
13.8% |
Sovereign Issues |
10.9% |
Asset-Backed Securities |
9.4% |
Non-Agency Mortgage-Backed Securities |
1.2% |
Corporate Bonds & Notes |
0.2% |
Preferred Securities |
0.1% |
Short-Term Instruments |
12.0% |
Affiliated Investments |
8.1% |
Financial Derivative Instruments |
1.4% |
Other Assets and Liabilities, Net |
(33.3%) |
Total |
100.0% |
| Footnote |
Description |
Footnote* |
% of Net Asset Value includes derivatives instruments, if any, valued at the value used for determining the Fund's net asset value. The notional exposure of such derivatives investments therefore may be greater than what is depicted. | |
| Material Fund Change [Text Block] |
This is a summary of certain changes and planned changes of the Fund since the beginning of the reporting period. For more information, you may refer to the Fund's next prospectus, which we expect to be available by July 31, 2025 or upon request at 888.87.PIMCO (888.877.4626). Changes to Total Annual Fund Operating Expenses. Annual fund operating expenses decreased during the year by 0.10% as a result of lower expenses related to interest. |
| Material Fund Change Expenses [Text Block] |
Changes to Total Annual Fund Operating Expenses. Annual fund operating expenses decreased during the year by 0.10% as a result of lower expenses related to interest.
|
| Summary of Change Legend [Text Block] |
This is a summary of certain changes and planned changes of the Fund since the beginning of the reporting period. For more information, you may refer to the Fund's next prospectus, which we expect to be available by July 31, 2025 or upon request at 888.87.PIMCO (888.877.4626).
|
| C000075263 |
|
| Shareholder Report [Line Items] |
|
| Fund Name |
PIMCO Government Money Market Fund
|
| Class Name |
Class A
|
| Trading Symbol |
AMAXX
|
| Annual or Semi-Annual Statement [Text Block] |
This annual shareholder report contains important information about the PIMCO Government Money Market Fund (the "Fund") for the period of April 1, 2024 to March 31, 2025 (the "reporting period").
|
| Shareholder Report Annual or Semi-Annual |
Annual Shareholder Report
|
| Additional Information [Text Block] |
You can find additional information about the Fund at www.pimco.com/literature. You can also request this information by contacting us at 888.87.PIMCO (888.877.4626).
|
| Additional Information Phone Number |
888.87.PIMCO (888.877.4626)
|
| Expenses [Text Block] |
What were the Fund costs for the reporting period?(based on a hypothetical $10,000 investment)
Class Name |
Cost of a $10,000 investment |
Costs paid as a percentage of a $10,000 investment |
Class A |
$34 |
0.33% | |
| Expenses Paid, Amount |
$ 34
|
| Expense Ratio, Percent |
0.33%
|
| Factors Affecting Performance [Text Block] |
How did the Fund perform during the reporting period and what affected its performance?The following affected performance (on a gross basis) during the reporting period: Underweight U.S. duration positioning detracted from relative performance, as interest rates fell. There were no material contributors for this Fund.
|
| Performance Past Does Not Indicate Future [Text] |
Performance quoted represents past performance. Past performance is not a guarantee or a reliable indicator of future results.
|
| Line Graph [Table Text Block] |

|
Class A (including sales charge) |
Bloomberg U.S. Aggregate Index |
FTSE 3-Month Treasury Bill Index |
3/31/15 |
$10,000 |
$10,000 |
$10,000 |
4/30/15 |
$10,000 |
$9,964 |
$10,000 |
5/31/15 |
$10,000 |
$9,940 |
$10,000 |
6/30/15 |
$10,000 |
$9,832 |
$10,000 |
7/31/15 |
$10,000 |
$9,900 |
$10,001 |
8/31/15 |
$10,000 |
$9,886 |
$10,001 |
9/30/15 |
$10,000 |
$9,953 |
$10,001 |
10/31/15 |
$10,000 |
$9,954 |
$10,001 |
11/30/15 |
$10,001 |
$9,928 |
$10,002 |
12/31/15 |
$10,003 |
$9,896 |
$10,002 |
1/31/16 |
$10,004 |
$10,032 |
$10,004 |
2/29/16 |
$10,006 |
$10,103 |
$10,005 |
3/31/16 |
$10,007 |
$10,196 |
$10,008 |
4/30/16 |
$10,007 |
$10,235 |
$10,010 |
5/31/16 |
$10,008 |
$10,238 |
$10,012 |
6/30/16 |
$10,009 |
$10,422 |
$10,014 |
7/31/16 |
$10,011 |
$10,488 |
$10,016 |
8/31/16 |
$10,013 |
$10,476 |
$10,019 |
9/30/16 |
$10,015 |
$10,470 |
$10,021 |
10/31/16 |
$10,016 |
$10,389 |
$10,024 |
11/30/16 |
$10,017 |
$10,144 |
$10,026 |
12/31/16 |
$10,018 |
$10,158 |
$10,029 |
1/31/17 |
$10,020 |
$10,178 |
$10,033 |
2/28/17 |
$10,023 |
$10,246 |
$10,037 |
3/31/17 |
$10,026 |
$10,241 |
$10,042 |
4/30/17 |
$10,030 |
$10,320 |
$10,047 |
5/31/17 |
$10,035 |
$10,399 |
$10,053 |
6/30/17 |
$10,041 |
$10,389 |
$10,060 |
7/31/17 |
$10,047 |
$10,434 |
$10,068 |
8/31/17 |
$10,054 |
$10,527 |
$10,077 |
9/30/17 |
$10,061 |
$10,477 |
$10,086 |
10/31/17 |
$10,068 |
$10,483 |
$10,095 |
11/30/17 |
$10,075 |
$10,470 |
$10,104 |
12/31/17 |
$10,084 |
$10,518 |
$10,114 |
1/31/18 |
$10,093 |
$10,397 |
$10,125 |
2/28/18 |
$10,101 |
$10,298 |
$10,136 |
3/31/18 |
$10,113 |
$10,364 |
$10,149 |
4/30/18 |
$10,125 |
$10,287 |
$10,163 |
5/31/18 |
$10,138 |
$10,360 |
$10,178 |
6/30/18 |
$10,152 |
$10,348 |
$10,193 |
7/31/18 |
$10,166 |
$10,350 |
$10,210 |
8/31/18 |
$10,182 |
$10,417 |
$10,227 |
9/30/18 |
$10,195 |
$10,350 |
$10,244 |
10/31/18 |
$10,212 |
$10,268 |
$10,263 |
11/30/18 |
$10,230 |
$10,329 |
$10,282 |
12/31/18 |
$10,248 |
$10,519 |
$10,302 |
1/31/19 |
$10,267 |
$10,631 |
$10,323 |
2/28/19 |
$10,284 |
$10,625 |
$10,342 |
3/31/19 |
$10,303 |
$10,829 |
$10,364 |
4/30/19 |
$10,322 |
$10,831 |
$10,385 |
5/31/19 |
$10,342 |
$11,024 |
$10,406 |
6/30/19 |
$10,359 |
$11,162 |
$10,427 |
7/31/19 |
$10,379 |
$11,187 |
$10,448 |
8/31/19 |
$10,397 |
$11,476 |
$10,468 |
9/30/19 |
$10,412 |
$11,415 |
$10,486 |
10/31/19 |
$10,427 |
$11,450 |
$10,504 |
11/30/19 |
$10,439 |
$11,444 |
$10,519 |
12/31/19 |
$10,450 |
$11,436 |
$10,534 |
1/31/20 |
$10,462 |
$11,656 |
$10,548 |
2/29/20 |
$10,473 |
$11,866 |
$10,562 |
3/31/20 |
$10,477 |
$11,796 |
$10,575 |
4/30/20 |
$10,478 |
$12,006 |
$10,584 |
5/31/20 |
$10,478 |
$12,062 |
$10,588 |
6/30/20 |
$10,478 |
$12,137 |
$10,589 |
7/31/20 |
$10,478 |
$12,319 |
$10,591 |
8/31/20 |
$10,478 |
$12,219 |
$10,592 |
9/30/20 |
$10,478 |
$12,213 |
$10,593 |
10/31/20 |
$10,478 |
$12,158 |
$10,594 |
11/30/20 |
$10,479 |
$12,277 |
$10,595 |
12/31/20 |
$10,479 |
$12,294 |
$10,595 |
1/31/21 |
$10,479 |
$12,206 |
$10,596 |
2/28/21 |
$10,479 |
$12,030 |
$10,597 |
3/31/21 |
$10,479 |
$11,880 |
$10,597 |
4/30/21 |
$10,479 |
$11,974 |
$10,598 |
5/31/21 |
$10,479 |
$12,013 |
$10,598 |
6/30/21 |
$10,479 |
$12,097 |
$10,598 |
7/31/21 |
$10,479 |
$12,232 |
$10,598 |
8/31/21 |
$10,479 |
$12,209 |
$10,599 |
9/30/21 |
$10,479 |
$12,103 |
$10,599 |
10/31/21 |
$10,479 |
$12,100 |
$10,599 |
11/30/21 |
$10,479 |
$12,136 |
$10,600 |
12/31/21 |
$10,479 |
$12,105 |
$10,600 |
1/31/22 |
$10,479 |
$11,844 |
$10,601 |
2/28/22 |
$10,479 |
$11,712 |
$10,602 |
3/31/22 |
$10,479 |
$11,386 |
$10,603 |
4/30/22 |
$10,479 |
$10,954 |
$10,606 |
5/31/22 |
$10,483 |
$11,025 |
$10,611 |
6/30/22 |
$10,489 |
$10,852 |
$10,619 |
7/31/22 |
$10,500 |
$11,117 |
$10,630 |
8/31/22 |
$10,516 |
$10,803 |
$10,645 |
9/30/22 |
$10,536 |
$10,336 |
$10,666 |
10/31/22 |
$10,558 |
$10,202 |
$10,693 |
11/30/22 |
$10,587 |
$10,578 |
$10,723 |
12/31/22 |
$10,624 |
$10,530 |
$10,759 |
1/31/23 |
$10,657 |
$10,854 |
$10,799 |
2/28/23 |
$10,692 |
$10,573 |
$10,837 |
3/31/23 |
$10,735 |
$10,842 |
$10,880 |
4/30/23 |
$10,772 |
$10,908 |
$10,923 |
5/31/23 |
$10,816 |
$10,789 |
$10,970 |
6/30/23 |
$10,862 |
$10,750 |
$11,016 |
7/31/23 |
$10,904 |
$10,743 |
$11,067 |
8/31/23 |
$10,951 |
$10,674 |
$11,118 |
9/30/23 |
$10,999 |
$10,403 |
$11,168 |
10/31/23 |
$11,045 |
$10,239 |
$11,221 |
11/30/23 |
$11,092 |
$10,702 |
$11,272 |
12/31/23 |
$11,142 |
$11,112 |
$11,325 |
1/31/24 |
$11,188 |
$11,082 |
$11,378 |
2/29/24 |
$11,234 |
$10,925 |
$11,428 |
3/31/24 |
$11,282 |
$11,026 |
$11,480 |
4/30/24 |
$11,330 |
$10,747 |
$11,532 |
5/31/24 |
$11,382 |
$10,930 |
$11,586 |
6/30/24 |
$11,427 |
$11,033 |
$11,638 |
7/31/24 |
$11,477 |
$11,291 |
$11,692 |
8/31/24 |
$11,530 |
$11,453 |
$11,746 |
9/30/24 |
$11,574 |
$11,606 |
$11,797 |
10/31/24 |
$11,620 |
$11,319 |
$11,848 |
11/30/24 |
$11,663 |
$11,438 |
$11,895 |
12/31/24 |
$11,706 |
$11,251 |
$11,942 |
1/31/25 |
$11,748 |
$11,311 |
$11,988 |
2/28/25 |
$11,785 |
$11,560 |
$12,029 |
3/31/25 |
$11,824 |
$11,564 |
$12,074 |
|
| Average Annual Return [Table Text Block] |
Class/Index Name |
1 Year |
5 Years |
10 Years |
Class A (excluding sales charge) |
4.80% |
2.45% |
1.69% |
Class A (including sales charge) |
4.80% |
2.45% |
1.69% |
Bloomberg U.S. Aggregate Index |
4.88% |
(0.40%) |
1.46% |
FTSE 3-Month Treasury Bill Index |
5.17% |
2.69% |
1.90% | |
| No Deduction of Taxes [Text Block] |
Returns shown do not reflect the deduction of taxes that a shareholder would pay on Fund distributions or the redemption of Fund shares.
|
| Performance Table Market Index Changed [Text Block] |
Differences in the Fund’s performance versus an index and related attribution information with respect to particular categories of securities or individual positions may be attributable, in part, to differences in the pricing methodologies used by the Fund and the index.
|
| Updated Performance Information Location [Text Block] |
For performance current to the most recent month-end, visit www.pimco.com/literature or via 888.87.PIMCO (888.877.4626).
|
| AssetsNet |
$ 4,462,627,000
|
| Holdings Count | Holding |
15
|
| Advisory Fees Paid, Amount |
$ 4,188,000
|
| Additional Fund Statistics [Text Block] |
Key Fund StatisticsFootnote Reference† (as of the end of the reporting period)
Total Net Assets |
$4,462,627 |
# of Portfolio Holdings |
15 |
Total Net Advisory Fees Paid During the Reporting Period |
$4,188 |
| Footnote |
Description |
Footnote† |
Dollar amounts displayed in 000's | |
| Holdings [Text Block] |
Security Type Breakdown (% of Net Asset Value)Footnote Reference*
Short-Term Instruments |
146.9% |
Other Assets and Liabilities, Net |
(46.9%) |
Total |
100.0% |
| Footnote |
Description |
Footnote* |
% of Net Asset Value includes derivatives instruments, if any, valued at the value used for determining the Fund's net asset value. The notional exposure of such derivatives investments therefore may be greater than what is depicted. | |
| Material Fund Change [Text Block] |
|
| C000072053 |
|
| Shareholder Report [Line Items] |
|
| Fund Name |
PIMCO Government Money Market Fund
|
| Class Name |
Administrative Class
|
| Trading Symbol |
PGOXX
|
| Annual or Semi-Annual Statement [Text Block] |
This annual shareholder report contains important information about the PIMCO Government Money Market Fund (the "Fund") for the period of April 1, 2024 to March 31, 2025 (the "reporting period").
|
| Shareholder Report Annual or Semi-Annual |
Annual Shareholder Report
|
| Additional Information [Text Block] |
You can find additional information about the Fund at www.pimco.com/literature. You can also request this information by contacting us at 888.87.PIMCO (888.877.4626).
|
| Additional Information Phone Number |
888.87.PIMCO (888.877.4626)
|
| Expenses [Text Block] |
What were the Fund costs for the reporting period?(based on a hypothetical $10,000 investment)
Class Name |
Cost of a $10,000 investment |
Costs paid as a percentage of a $10,000 investment |
Administrative Class |
$18 |
0.18% | |
| Expenses Paid, Amount |
$ 18
|
| Expense Ratio, Percent |
0.18%
|
| Factors Affecting Performance [Text Block] |
How did the Fund perform during the reporting period and what affected its performance?The following affected performance (on a gross basis) during the reporting period: Underweight U.S. duration positioning detracted from relative performance, as interest rates fell. There were no material contributors for this Fund.
|
| Performance Past Does Not Indicate Future [Text] |
Performance quoted represents past performance. Past performance is not a guarantee or a reliable indicator of future results.
|
| Line Graph [Table Text Block] |
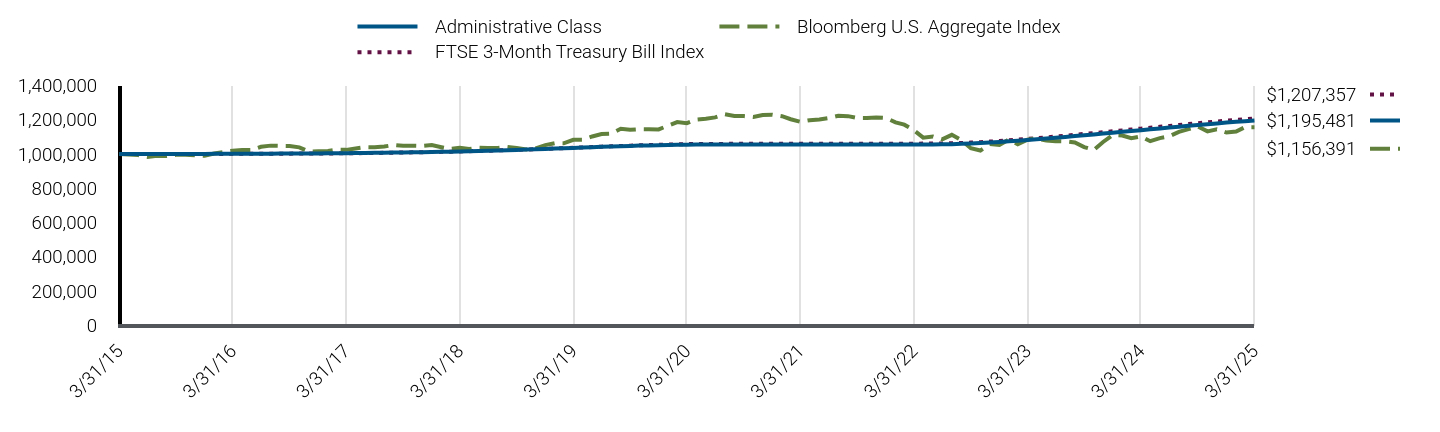
|
Administrative Class |
Bloomberg U.S. Aggregate Index |
FTSE 3-Month Treasury Bill Index |
3/31/15 |
$1,000,000 |
$1,000,000 |
$1,000,000 |
4/30/15 |
$1,000,010 |
$996,412 |
$1,000,016 |
5/31/15 |
$1,000,016 |
$994,012 |
$1,000,030 |
6/30/15 |
$1,000,024 |
$983,174 |
$1,000,041 |
7/31/15 |
$1,000,045 |
$990,008 |
$1,000,050 |
8/31/15 |
$1,000,079 |
$988,586 |
$1,000,075 |
9/30/15 |
$1,000,094 |
$995,273 |
$1,000,101 |
10/31/15 |
$1,000,105 |
$995,439 |
$1,000,125 |
11/30/15 |
$1,000,114 |
$992,809 |
$1,000,152 |
12/31/15 |
$1,000,457 |
$989,601 |
$1,000,229 |
1/31/16 |
$1,000,700 |
$1,003,219 |
$1,000,354 |
2/29/16 |
$1,000,945 |
$1,010,335 |
$1,000,534 |
3/31/16 |
$1,001,171 |
$1,019,605 |
$1,000,767 |
4/30/16 |
$1,001,378 |
$1,023,519 |
$1,001,004 |
5/31/16 |
$1,001,515 |
$1,023,781 |
$1,001,216 |
6/30/16 |
$1,001,799 |
$1,042,177 |
$1,001,416 |
7/31/16 |
$1,002,081 |
$1,048,765 |
$1,001,638 |
8/31/16 |
$1,002,326 |
$1,047,566 |
$1,001,877 |
9/30/16 |
$1,002,671 |
$1,046,952 |
$1,002,116 |
10/31/16 |
$1,002,928 |
$1,038,944 |
$1,002,369 |
11/30/16 |
$1,003,232 |
$1,014,369 |
$1,002,627 |
12/31/16 |
$1,003,475 |
$1,015,800 |
$1,002,938 |
1/31/17 |
$1,003,833 |
$1,017,793 |
$1,003,311 |
2/28/17 |
$1,004,177 |
$1,024,634 |
$1,003,703 |
3/31/17 |
$1,004,652 |
$1,024,097 |
$1,004,153 |
4/30/17 |
$1,005,169 |
$1,032,000 |
$1,004,663 |
5/31/17 |
$1,005,760 |
$1,039,943 |
$1,005,272 |
6/30/17 |
$1,006,561 |
$1,038,896 |
$1,005,984 |
7/31/17 |
$1,007,289 |
$1,043,367 |
$1,006,794 |
8/31/17 |
$1,008,110 |
$1,052,726 |
$1,007,683 |
9/30/17 |
$1,008,941 |
$1,047,712 |
$1,008,552 |
10/31/17 |
$1,009,733 |
$1,048,319 |
$1,009,463 |
11/30/17 |
$1,010,574 |
$1,046,973 |
$1,010,364 |
12/31/17 |
$1,011,609 |
$1,051,778 |
$1,011,376 |
1/31/18 |
$1,012,653 |
$1,039,665 |
$1,012,488 |
2/28/18 |
$1,013,626 |
$1,029,809 |
$1,013,578 |
3/31/18 |
$1,014,962 |
$1,036,414 |
$1,014,900 |
4/30/18 |
$1,016,312 |
$1,028,705 |
$1,016,269 |
5/31/18 |
$1,017,728 |
$1,036,047 |
$1,017,787 |
6/30/18 |
$1,019,253 |
$1,034,773 |
$1,019,327 |
7/31/18 |
$1,020,786 |
$1,035,019 |
$1,020,980 |
8/31/18 |
$1,022,532 |
$1,041,679 |
$1,022,701 |
9/30/18 |
$1,023,971 |
$1,034,971 |
$1,024,424 |
10/31/18 |
$1,025,797 |
$1,026,792 |
$1,026,288 |
11/30/18 |
$1,027,729 |
$1,032,921 |
$1,028,181 |
12/31/18 |
$1,029,666 |
$1,051,898 |
$1,030,216 |
1/31/19 |
$1,031,658 |
$1,063,068 |
$1,032,309 |
2/28/19 |
$1,033,503 |
$1,062,452 |
$1,034,221 |
3/31/19 |
$1,035,582 |
$1,082,853 |
$1,036,364 |
4/30/19 |
$1,037,602 |
$1,083,130 |
$1,038,451 |
5/31/19 |
$1,039,789 |
$1,102,358 |
$1,040,621 |
6/30/19 |
$1,041,637 |
$1,116,201 |
$1,042,721 |
7/31/19 |
$1,043,727 |
$1,118,657 |
$1,044,805 |
8/31/19 |
$1,045,659 |
$1,147,643 |
$1,046,791 |
9/30/19 |
$1,047,358 |
$1,141,531 |
$1,048,587 |
10/31/19 |
$1,048,942 |
$1,144,969 |
$1,050,362 |
11/30/19 |
$1,050,249 |
$1,144,386 |
$1,051,926 |
12/31/19 |
$1,051,525 |
$1,143,588 |
$1,053,424 |
1/31/20 |
$1,052,871 |
$1,165,596 |
$1,054,843 |
2/29/20 |
$1,054,063 |
$1,186,575 |
$1,056,175 |
3/31/20 |
$1,054,535 |
$1,179,592 |
$1,057,509 |
4/30/20 |
$1,054,703 |
$1,200,561 |
$1,058,376 |
5/31/20 |
$1,054,712 |
$1,206,151 |
$1,058,833 |
6/30/20 |
$1,054,715 |
$1,213,749 |
$1,058,937 |
7/31/20 |
$1,054,729 |
$1,231,878 |
$1,059,058 |
8/31/20 |
$1,054,731 |
$1,221,935 |
$1,059,176 |
9/30/20 |
$1,054,735 |
$1,221,265 |
$1,059,278 |
10/31/20 |
$1,054,742 |
$1,215,812 |
$1,059,369 |
11/30/20 |
$1,054,749 |
$1,227,742 |
$1,059,456 |
12/31/20 |
$1,054,754 |
$1,229,433 |
$1,059,538 |
1/31/21 |
$1,054,756 |
$1,220,618 |
$1,059,615 |
2/28/21 |
$1,054,771 |
$1,202,992 |
$1,059,676 |
3/31/21 |
$1,054,772 |
$1,187,971 |
$1,059,730 |
4/30/21 |
$1,054,772 |
$1,197,356 |
$1,059,766 |
5/31/21 |
$1,054,783 |
$1,201,268 |
$1,059,790 |
6/30/21 |
$1,054,783 |
$1,209,708 |
$1,059,806 |
7/31/21 |
$1,054,783 |
$1,223,233 |
$1,059,829 |
8/31/21 |
$1,054,784 |
$1,220,905 |
$1,059,862 |
9/30/21 |
$1,054,799 |
$1,210,334 |
$1,059,903 |
10/31/21 |
$1,054,804 |
$1,210,000 |
$1,059,941 |
11/30/21 |
$1,054,804 |
$1,213,580 |
$1,059,981 |
12/31/21 |
$1,054,815 |
$1,210,475 |
$1,060,025 |
1/31/22 |
$1,054,818 |
$1,184,396 |
$1,060,075 |
2/28/22 |
$1,054,819 |
$1,171,183 |
$1,060,155 |
3/31/22 |
$1,054,872 |
$1,138,645 |
$1,060,323 |
4/30/22 |
$1,054,983 |
$1,095,436 |
$1,060,623 |
5/31/22 |
$1,055,447 |
$1,102,499 |
$1,061,136 |
6/30/22 |
$1,056,225 |
$1,085,203 |
$1,061,852 |
7/31/22 |
$1,057,452 |
$1,111,719 |
$1,062,953 |
8/31/22 |
$1,059,232 |
$1,080,306 |
$1,064,534 |
9/30/22 |
$1,061,341 |
$1,033,630 |
$1,066,619 |
10/31/22 |
$1,063,684 |
$1,020,242 |
$1,069,261 |
11/30/22 |
$1,066,701 |
$1,057,762 |
$1,072,326 |
12/31/22 |
$1,070,572 |
$1,052,991 |
$1,075,945 |
1/31/23 |
$1,074,106 |
$1,085,385 |
$1,079,916 |
2/28/23 |
$1,077,746 |
$1,057,322 |
$1,083,683 |
3/31/23 |
$1,082,167 |
$1,084,180 |
$1,088,015 |
4/30/23 |
$1,086,077 |
$1,090,751 |
$1,092,346 |
5/31/23 |
$1,090,655 |
$1,078,874 |
$1,096,968 |
6/30/23 |
$1,095,435 |
$1,075,027 |
$1,101,639 |
7/31/23 |
$1,099,813 |
$1,074,277 |
$1,106,658 |
8/31/23 |
$1,104,692 |
$1,067,415 |
$1,111,804 |
9/30/23 |
$1,109,611 |
$1,040,290 |
$1,116,824 |
10/31/23 |
$1,114,410 |
$1,023,873 |
$1,122,085 |
11/30/23 |
$1,119,238 |
$1,070,241 |
$1,127,216 |
12/31/23 |
$1,124,441 |
$1,111,209 |
$1,132,519 |
1/31/24 |
$1,129,299 |
$1,108,157 |
$1,137,809 |
2/29/24 |
$1,134,006 |
$1,092,501 |
$1,142,751 |
3/31/24 |
$1,139,069 |
$1,102,589 |
$1,148,046 |
4/30/24 |
$1,143,993 |
$1,074,739 |
$1,153,200 |
5/31/24 |
$1,149,413 |
$1,092,959 |
$1,158,559 |
6/30/24 |
$1,154,059 |
$1,103,307 |
$1,163,774 |
7/31/24 |
$1,159,261 |
$1,129,077 |
$1,169,185 |
8/31/24 |
$1,164,817 |
$1,145,301 |
$1,174,577 |
9/30/24 |
$1,169,353 |
$1,160,636 |
$1,179,725 |
10/31/24 |
$1,174,120 |
$1,131,854 |
$1,184,817 |
11/30/24 |
$1,178,683 |
$1,143,821 |
$1,189,527 |
12/31/24 |
$1,183,158 |
$1,125,101 |
$1,194,204 |
1/31/25 |
$1,187,556 |
$1,131,070 |
$1,198,799 |
2/28/25 |
$1,191,459 |
$1,155,956 |
$1,202,884 |
3/31/25 |
$1,195,481 |
$1,156,391 |
$1,207,357 |
|
| Average Annual Return [Table Text Block] |
Class/Index Name |
1 Year |
5 Years |
10 Years |
Administrative Class |
4.95% |
2.54% |
1.80% |
Bloomberg U.S. Aggregate Index |
4.88% |
(0.40%) |
1.46% |
FTSE 3-Month Treasury Bill Index |
5.17% |
2.69% |
1.90% | |
| No Deduction of Taxes [Text Block] |
Returns shown do not reflect the deduction of taxes that a shareholder would pay on Fund distributions or the redemption of Fund shares.
|
| Performance Table Market Index Changed [Text Block] |
Differences in the Fund’s performance versus an index and related attribution information with respect to particular categories of securities or individual positions may be attributable, in part, to differences in the pricing methodologies used by the Fund and the index.
|
| Updated Performance Information Location [Text Block] |
For performance current to the most recent month-end, visit www.pimco.com/literature or via 888.87.PIMCO (888.877.4626).
|
| AssetsNet |
$ 4,462,627,000
|
| Holdings Count | Holding |
15
|
| Advisory Fees Paid, Amount |
$ 4,188,000
|
| Additional Fund Statistics [Text Block] |
Key Fund StatisticsFootnote Reference† (as of the end of the reporting period)
Total Net Assets |
$4,462,627 |
# of Portfolio Holdings |
15 |
Total Net Advisory Fees Paid During the Reporting Period |
$4,188 |
| Footnote |
Description |
Footnote† |
Dollar amounts displayed in 000's | |
| Holdings [Text Block] |
Security Type Breakdown (% of Net Asset Value)Footnote Reference*
Short-Term Instruments |
146.9% |
Other Assets and Liabilities, Net |
(46.9%) |
Total |
100.0% |
| Footnote |
Description |
Footnote* |
% of Net Asset Value includes derivatives instruments, if any, valued at the value used for determining the Fund's net asset value. The notional exposure of such derivatives investments therefore may be greater than what is depicted. | |
| Material Fund Change [Text Block] |
|
| C000075264 |
|
| Shareholder Report [Line Items] |
|
| Fund Name |
PIMCO Government Money Market Fund
|
| Class Name |
Class C
|
| Trading Symbol |
AMGXX
|
| Annual or Semi-Annual Statement [Text Block] |
This annual shareholder report contains important information about the PIMCO Government Money Market Fund (the "Fund") for the period of April 1, 2024 to March 31, 2025 (the "reporting period").
|
| Shareholder Report Annual or Semi-Annual |
Annual Shareholder Report
|
| Additional Information [Text Block] |
You can find additional information about the Fund at www.pimco.com/literature. You can also request this information by contacting us at 888.87.PIMCO (888.877.4626).
|
| Additional Information Phone Number |
888.87.PIMCO (888.877.4626)
|
| Expenses [Text Block] |
What were the Fund costs for the reporting period?(based on a hypothetical $10,000 investment)
Class Name |
Cost of a $10,000 investment |
Costs paid as a percentage of a $10,000 investment |
Class C |
$34 |
0.33% | |
| Expenses Paid, Amount |
$ 34
|
| Expense Ratio, Percent |
0.33%
|
| Factors Affecting Performance [Text Block] |
How did the Fund perform during the reporting period and what affected its performance?The following affected performance (on a gross basis) during the reporting period: Underweight U.S. duration positioning detracted from relative performance, as interest rates fell. There were no material contributors for this Fund.
|
| Performance Past Does Not Indicate Future [Text] |
Performance quoted represents past performance. Past performance is not a guarantee or a reliable indicator of future results.
|
| Line Graph [Table Text Block] |
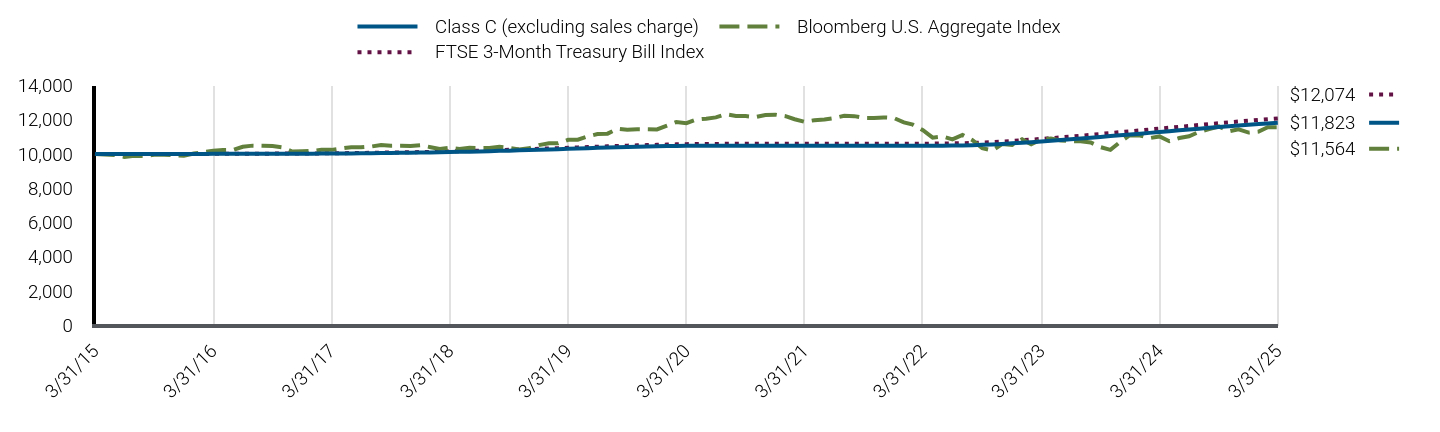
|
Class C (excluding sales charge) |
Bloomberg U.S. Aggregate Index |
FTSE 3-Month Treasury Bill Index |
3/31/15 |
$10,000 |
$10,000 |
$10,000 |
4/30/15 |
$10,000 |
$9,964 |
$10,000 |
5/31/15 |
$10,000 |
$9,940 |
$10,000 |
6/30/15 |
$10,000 |
$9,832 |
$10,000 |
7/31/15 |
$10,000 |
$9,900 |
$10,001 |
8/31/15 |
$10,000 |
$9,886 |
$10,001 |
9/30/15 |
$10,000 |
$9,953 |
$10,001 |
10/31/15 |
$10,001 |
$9,954 |
$10,001 |
11/30/15 |
$10,001 |
$9,928 |
$10,002 |
12/31/15 |
$10,003 |
$9,896 |
$10,002 |
1/31/16 |
$10,004 |
$10,032 |
$10,004 |
2/29/16 |
$10,006 |
$10,103 |
$10,005 |
3/31/16 |
$10,007 |
$10,196 |
$10,008 |
4/30/16 |
$10,007 |
$10,235 |
$10,010 |
5/31/16 |
$10,008 |
$10,238 |
$10,012 |
6/30/16 |
$10,010 |
$10,422 |
$10,014 |
7/31/16 |
$10,011 |
$10,488 |
$10,016 |
8/31/16 |
$10,013 |
$10,476 |
$10,019 |
9/30/16 |
$10,015 |
$10,470 |
$10,021 |
10/31/16 |
$10,016 |
$10,389 |
$10,024 |
11/30/16 |
$10,017 |
$10,144 |
$10,026 |
12/31/16 |
$10,018 |
$10,158 |
$10,029 |
1/31/17 |
$10,020 |
$10,178 |
$10,033 |
2/28/17 |
$10,023 |
$10,246 |
$10,037 |
3/31/17 |
$10,026 |
$10,241 |
$10,042 |
4/30/17 |
$10,030 |
$10,320 |
$10,047 |
5/31/17 |
$10,035 |
$10,399 |
$10,053 |
6/30/17 |
$10,041 |
$10,389 |
$10,060 |
7/31/17 |
$10,047 |
$10,434 |
$10,068 |
8/31/17 |
$10,054 |
$10,527 |
$10,077 |
9/30/17 |
$10,061 |
$10,477 |
$10,086 |
10/31/17 |
$10,068 |
$10,483 |
$10,095 |
11/30/17 |
$10,075 |
$10,470 |
$10,104 |
12/31/17 |
$10,084 |
$10,518 |
$10,114 |
1/31/18 |
$10,093 |
$10,397 |
$10,125 |
2/28/18 |
$10,101 |
$10,298 |
$10,136 |
3/31/18 |
$10,113 |
$10,364 |
$10,149 |
4/30/18 |
$10,126 |
$10,287 |
$10,163 |
5/31/18 |
$10,138 |
$10,360 |
$10,178 |
6/30/18 |
$10,152 |
$10,348 |
$10,193 |
7/31/18 |
$10,166 |
$10,350 |
$10,210 |
8/31/18 |
$10,182 |
$10,417 |
$10,227 |
9/30/18 |
$10,195 |
$10,350 |
$10,244 |
10/31/18 |
$10,212 |
$10,268 |
$10,263 |
11/30/18 |
$10,230 |
$10,329 |
$10,282 |
12/31/18 |
$10,248 |
$10,519 |
$10,302 |
1/31/19 |
$10,267 |
$10,631 |
$10,323 |
2/28/19 |
$10,284 |
$10,625 |
$10,342 |
3/31/19 |
$10,303 |
$10,829 |
$10,364 |
4/30/19 |
$10,322 |
$10,831 |
$10,385 |
5/31/19 |
$10,342 |
$11,024 |
$10,406 |
6/30/19 |
$10,359 |
$11,162 |
$10,427 |
7/31/19 |
$10,379 |
$11,187 |
$10,448 |
8/31/19 |
$10,396 |
$11,476 |
$10,468 |
9/30/19 |
$10,412 |
$11,415 |
$10,486 |
10/31/19 |
$10,427 |
$11,450 |
$10,504 |
11/30/19 |
$10,438 |
$11,444 |
$10,519 |
12/31/19 |
$10,450 |
$11,436 |
$10,534 |
1/31/20 |
$10,462 |
$11,656 |
$10,548 |
2/29/20 |
$10,472 |
$11,866 |
$10,562 |
3/31/20 |
$10,476 |
$11,796 |
$10,575 |
4/30/20 |
$10,478 |
$12,006 |
$10,584 |
5/31/20 |
$10,478 |
$12,062 |
$10,588 |
6/30/20 |
$10,478 |
$12,137 |
$10,589 |
7/31/20 |
$10,478 |
$12,319 |
$10,591 |
8/31/20 |
$10,478 |
$12,219 |
$10,592 |
9/30/20 |
$10,478 |
$12,213 |
$10,593 |
10/31/20 |
$10,478 |
$12,158 |
$10,594 |
11/30/20 |
$10,478 |
$12,277 |
$10,595 |
12/31/20 |
$10,478 |
$12,294 |
$10,595 |
1/31/21 |
$10,478 |
$12,206 |
$10,596 |
2/28/21 |
$10,478 |
$12,030 |
$10,597 |
3/31/21 |
$10,478 |
$11,880 |
$10,597 |
4/30/21 |
$10,478 |
$11,974 |
$10,598 |
5/31/21 |
$10,478 |
$12,013 |
$10,598 |
6/30/21 |
$10,478 |
$12,097 |
$10,598 |
7/31/21 |
$10,478 |
$12,232 |
$10,598 |
8/31/21 |
$10,478 |
$12,209 |
$10,599 |
9/30/21 |
$10,479 |
$12,103 |
$10,599 |
10/31/21 |
$10,479 |
$12,100 |
$10,599 |
11/30/21 |
$10,479 |
$12,136 |
$10,600 |
12/31/21 |
$10,479 |
$12,105 |
$10,600 |
1/31/22 |
$10,479 |
$11,844 |
$10,601 |
2/28/22 |
$10,479 |
$11,712 |
$10,602 |
3/31/22 |
$10,479 |
$11,386 |
$10,603 |
4/30/22 |
$10,479 |
$10,954 |
$10,606 |
5/31/22 |
$10,482 |
$11,025 |
$10,611 |
6/30/22 |
$10,489 |
$10,852 |
$10,619 |
7/31/22 |
$10,500 |
$11,117 |
$10,630 |
8/31/22 |
$10,516 |
$10,803 |
$10,645 |
9/30/22 |
$10,535 |
$10,336 |
$10,666 |
10/31/22 |
$10,557 |
$10,202 |
$10,693 |
11/30/22 |
$10,586 |
$10,578 |
$10,723 |
12/31/22 |
$10,623 |
$10,530 |
$10,759 |
1/31/23 |
$10,657 |
$10,854 |
$10,799 |
2/28/23 |
$10,692 |
$10,573 |
$10,837 |
3/31/23 |
$10,734 |
$10,842 |
$10,880 |
4/30/23 |
$10,772 |
$10,908 |
$10,923 |
5/31/23 |
$10,816 |
$10,789 |
$10,970 |
6/30/23 |
$10,862 |
$10,750 |
$11,016 |
7/31/23 |
$10,904 |
$10,743 |
$11,067 |
8/31/23 |
$10,951 |
$10,674 |
$11,118 |
9/30/23 |
$10,998 |
$10,403 |
$11,168 |
10/31/23 |
$11,045 |
$10,239 |
$11,221 |
11/30/23 |
$11,091 |
$10,702 |
$11,272 |
12/31/23 |
$11,141 |
$11,112 |
$11,325 |
1/31/24 |
$11,188 |
$11,082 |
$11,378 |
2/29/24 |
$11,233 |
$10,925 |
$11,428 |
3/31/24 |
$11,282 |
$11,026 |
$11,480 |
4/30/24 |
$11,329 |
$10,747 |
$11,532 |
5/31/24 |
$11,382 |
$10,930 |
$11,586 |
6/30/24 |
$11,426 |
$11,033 |
$11,638 |
7/31/24 |
$11,476 |
$11,291 |
$11,692 |
8/31/24 |
$11,530 |
$11,453 |
$11,746 |
9/30/24 |
$11,573 |
$11,606 |
$11,797 |
10/31/24 |
$11,619 |
$11,319 |
$11,848 |
11/30/24 |
$11,663 |
$11,438 |
$11,895 |
12/31/24 |
$11,706 |
$11,251 |
$11,942 |
1/31/25 |
$11,748 |
$11,311 |
$11,988 |
2/28/25 |
$11,785 |
$11,560 |
$12,029 |
3/31/25 |
$11,823 |
$11,564 |
$12,074 |
|
| Average Annual Return [Table Text Block] |
Class/Index Name |
1 Year |
5 Years |
10 Years |
Class C (excluding sales charge) |
4.80% |
2.45% |
1.69% |
Class C (including sales charge) |
4.80% |
2.45% |
1.69% |
Bloomberg U.S. Aggregate Index |
4.88% |
(0.40%) |
1.46% |
FTSE 3-Month Treasury Bill Index |
5.17% |
2.69% |
1.90% | |
| No Deduction of Taxes [Text Block] |
Returns shown do not reflect the deduction of taxes that a shareholder would pay on Fund distributions or the redemption of Fund shares.
|
| Performance Table Market Index Changed [Text Block] |
Differences in the Fund’s performance versus an index and related attribution information with respect to particular categories of securities or individual positions may be attributable, in part, to differences in the pricing methodologies used by the Fund and the index.
|
| Updated Performance Information Location [Text Block] |
For performance current to the most recent month-end, visit www.pimco.com/literature or via 888.87.PIMCO (888.877.4626).
|
| AssetsNet |
$ 4,462,627,000
|
| Holdings Count | Holding |
15
|
| Advisory Fees Paid, Amount |
$ 4,188,000
|
| Additional Fund Statistics [Text Block] |
Key Fund StatisticsFootnote Reference† (as of the end of the reporting period)
Total Net Assets |
$4,462,627 |
# of Portfolio Holdings |
15 |
Total Net Advisory Fees Paid During the Reporting Period |
$4,188 |
| Footnote |
Description |
Footnote† |
Dollar amounts displayed in 000's | |
| Holdings [Text Block] |
Security Type Breakdown (% of Net Asset Value)Footnote Reference*
Short-Term Instruments |
146.9% |
Other Assets and Liabilities, Net |
(46.9%) |
Total |
100.0% |
| Footnote |
Description |
Footnote* |
% of Net Asset Value includes derivatives instruments, if any, valued at the value used for determining the Fund's net asset value. The notional exposure of such derivatives investments therefore may be greater than what is depicted. | |
| Material Fund Change [Text Block] |
|
| C000169180 |
|
| Shareholder Report [Line Items] |
|
| Fund Name |
PIMCO Government Money Market Fund
|
| Class Name |
Institutional Class
|
| Trading Symbol |
PGYXX
|
| Annual or Semi-Annual Statement [Text Block] |
This annual shareholder report contains important information about the PIMCO Government Money Market Fund (the "Fund") for the period of April 1, 2024 to March 31, 2025 (the "reporting period").
|
| Shareholder Report Annual or Semi-Annual |
Annual Shareholder Report
|
| Additional Information [Text Block] |
You can find additional information about the Fund at www.pimco.com/literature. You can also request this information by contacting us at 888.87.PIMCO (888.877.4626).
|
| Additional Information Phone Number |
888.87.PIMCO (888.877.4626)
|
| Expenses [Text Block] |
What were the Fund costs for the reporting period?(based on a hypothetical $10,000 investment)
Class Name |
Cost of a $10,000 investment |
Costs paid as a percentage of a $10,000 investment |
Institutional Class |
$18 |
0.18% | |
| Expenses Paid, Amount |
$ 18
|
| Expense Ratio, Percent |
0.18%
|
| Factors Affecting Performance [Text Block] |
How did the Fund perform during the reporting period and what affected its performance?The following affected performance (on a gross basis) during the reporting period: Underweight U.S. duration positioning detracted from relative performance, as interest rates fell. There were no material contributors for this Fund.
|
| Performance Past Does Not Indicate Future [Text] |
Performance quoted represents past performance. Past performance is not a guarantee or a reliable indicator of future results.
|
| Line Graph [Table Text Block] |
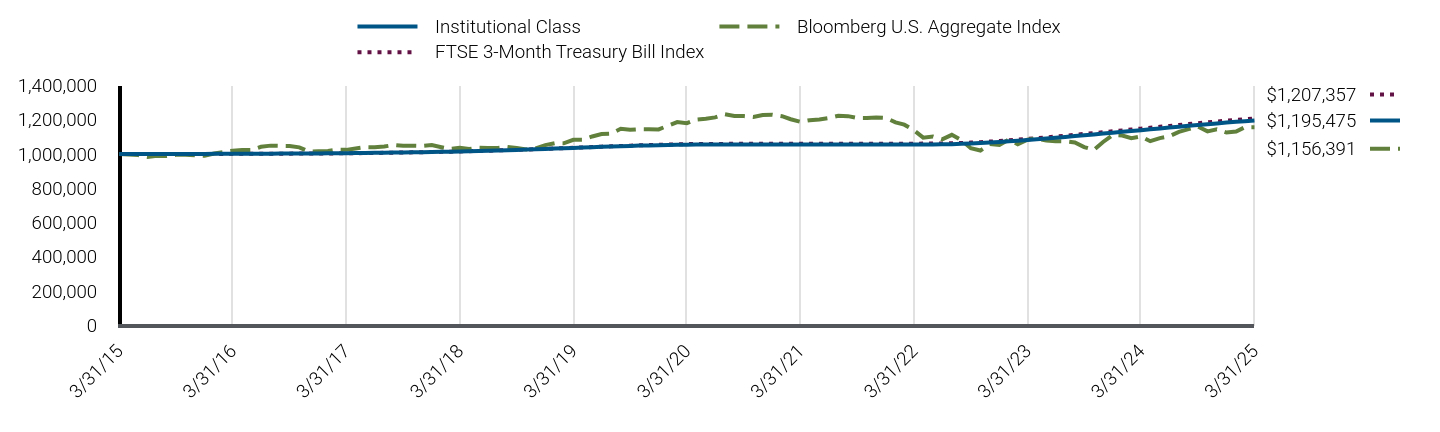
|
Institutional Class |
Bloomberg U.S. Aggregate Index |
FTSE 3-Month Treasury Bill Index |
3/31/15 |
$1,000,000 |
$1,000,000 |
$1,000,000 |
4/30/15 |
$1,000,010 |
$996,412 |
$1,000,016 |
5/31/15 |
$1,000,016 |
$994,012 |
$1,000,030 |
6/30/15 |
$1,000,024 |
$983,174 |
$1,000,041 |
7/31/15 |
$1,000,045 |
$990,008 |
$1,000,050 |
8/31/15 |
$1,000,079 |
$988,586 |
$1,000,075 |
9/30/15 |
$1,000,094 |
$995,273 |
$1,000,101 |
10/31/15 |
$1,000,105 |
$995,439 |
$1,000,125 |
11/30/15 |
$1,000,114 |
$992,809 |
$1,000,152 |
12/31/15 |
$1,000,457 |
$989,601 |
$1,000,229 |
1/31/16 |
$1,000,700 |
$1,003,219 |
$1,000,354 |
2/29/16 |
$1,000,945 |
$1,010,335 |
$1,000,534 |
3/31/16 |
$1,001,171 |
$1,019,605 |
$1,000,767 |
4/30/16 |
$1,001,378 |
$1,023,519 |
$1,001,004 |
5/31/16 |
$1,001,515 |
$1,023,781 |
$1,001,216 |
6/30/16 |
$1,001,799 |
$1,042,177 |
$1,001,416 |
7/31/16 |
$1,002,088 |
$1,048,765 |
$1,001,638 |
8/31/16 |
$1,002,362 |
$1,047,566 |
$1,001,877 |
9/30/16 |
$1,002,726 |
$1,046,952 |
$1,002,116 |
10/31/16 |
$1,002,982 |
$1,038,944 |
$1,002,369 |
11/30/16 |
$1,003,286 |
$1,014,369 |
$1,002,627 |
12/31/16 |
$1,003,453 |
$1,015,800 |
$1,002,938 |
1/31/17 |
$1,003,811 |
$1,017,793 |
$1,003,311 |
2/28/17 |
$1,004,155 |
$1,024,634 |
$1,003,703 |
3/31/17 |
$1,004,629 |
$1,024,097 |
$1,004,153 |
4/30/17 |
$1,005,147 |
$1,032,000 |
$1,004,663 |
5/31/17 |
$1,005,738 |
$1,039,943 |
$1,005,272 |
6/30/17 |
$1,006,539 |
$1,038,896 |
$1,005,984 |
7/31/17 |
$1,007,267 |
$1,043,367 |
$1,006,794 |
8/31/17 |
$1,008,087 |
$1,052,726 |
$1,007,683 |
9/30/17 |
$1,008,919 |
$1,047,712 |
$1,008,552 |
10/31/17 |
$1,009,710 |
$1,048,319 |
$1,009,463 |
11/30/17 |
$1,010,551 |
$1,046,973 |
$1,010,364 |
12/31/17 |
$1,011,587 |
$1,051,778 |
$1,011,376 |
1/31/18 |
$1,012,631 |
$1,039,665 |
$1,012,488 |
2/28/18 |
$1,013,605 |
$1,029,809 |
$1,013,578 |
3/31/18 |
$1,014,940 |
$1,036,414 |
$1,014,900 |
4/30/18 |
$1,016,291 |
$1,028,705 |
$1,016,269 |
5/31/18 |
$1,017,708 |
$1,036,047 |
$1,017,787 |
6/30/18 |
$1,019,236 |
$1,034,773 |
$1,019,327 |
7/31/18 |
$1,020,769 |
$1,035,019 |
$1,020,980 |
8/31/18 |
$1,022,515 |
$1,041,679 |
$1,022,701 |
9/30/18 |
$1,023,956 |
$1,034,971 |
$1,024,424 |
10/31/18 |
$1,025,782 |
$1,026,792 |
$1,026,288 |
11/30/18 |
$1,027,714 |
$1,032,921 |
$1,028,181 |
12/31/18 |
$1,029,653 |
$1,051,898 |
$1,030,216 |
1/31/19 |
$1,031,644 |
$1,063,068 |
$1,032,309 |
2/28/19 |
$1,033,490 |
$1,062,452 |
$1,034,221 |
3/31/19 |
$1,035,569 |
$1,082,853 |
$1,036,364 |
4/30/19 |
$1,037,590 |
$1,083,130 |
$1,038,451 |
5/31/19 |
$1,039,777 |
$1,102,358 |
$1,040,621 |
6/30/19 |
$1,041,624 |
$1,116,201 |
$1,042,721 |
7/31/19 |
$1,043,715 |
$1,118,657 |
$1,044,805 |
8/31/19 |
$1,045,647 |
$1,147,643 |
$1,046,791 |
9/30/19 |
$1,047,346 |
$1,141,531 |
$1,048,587 |
10/31/19 |
$1,048,930 |
$1,144,969 |
$1,050,362 |
11/30/19 |
$1,050,236 |
$1,144,386 |
$1,051,926 |
12/31/19 |
$1,051,513 |
$1,143,588 |
$1,053,424 |
1/31/20 |
$1,052,859 |
$1,165,596 |
$1,054,843 |
2/29/20 |
$1,054,052 |
$1,186,575 |
$1,056,175 |
3/31/20 |
$1,054,525 |
$1,179,592 |
$1,057,509 |
4/30/20 |
$1,054,692 |
$1,200,561 |
$1,058,376 |
5/31/20 |
$1,054,701 |
$1,206,151 |
$1,058,833 |
6/30/20 |
$1,054,704 |
$1,213,749 |
$1,058,937 |
7/31/20 |
$1,054,718 |
$1,231,878 |
$1,059,058 |
8/31/20 |
$1,054,721 |
$1,221,935 |
$1,059,176 |
9/30/20 |
$1,054,725 |
$1,221,265 |
$1,059,278 |
10/31/20 |
$1,054,732 |
$1,215,812 |
$1,059,369 |
11/30/20 |
$1,054,739 |
$1,227,742 |
$1,059,456 |
12/31/20 |
$1,054,744 |
$1,229,433 |
$1,059,538 |
1/31/21 |
$1,054,746 |
$1,220,618 |
$1,059,615 |
2/28/21 |
$1,054,761 |
$1,202,992 |
$1,059,676 |
3/31/21 |
$1,054,762 |
$1,187,971 |
$1,059,730 |
4/30/21 |
$1,054,762 |
$1,197,356 |
$1,059,766 |
5/31/21 |
$1,054,773 |
$1,201,268 |
$1,059,790 |
6/30/21 |
$1,054,773 |
$1,209,708 |
$1,059,806 |
7/31/21 |
$1,054,773 |
$1,223,233 |
$1,059,829 |
8/31/21 |
$1,054,774 |
$1,220,905 |
$1,059,862 |
9/30/21 |
$1,054,789 |
$1,210,334 |
$1,059,903 |
10/31/21 |
$1,054,794 |
$1,210,000 |
$1,059,941 |
11/30/21 |
$1,054,794 |
$1,213,580 |
$1,059,981 |
12/31/21 |
$1,054,805 |
$1,210,475 |
$1,060,025 |
1/31/22 |
$1,054,808 |
$1,184,396 |
$1,060,075 |
2/28/22 |
$1,054,808 |
$1,171,183 |
$1,060,155 |
3/31/22 |
$1,054,862 |
$1,138,645 |
$1,060,323 |
4/30/22 |
$1,054,971 |
$1,095,436 |
$1,060,623 |
5/31/22 |
$1,055,436 |
$1,102,499 |
$1,061,136 |
6/30/22 |
$1,056,214 |
$1,085,203 |
$1,061,852 |
7/31/22 |
$1,057,440 |
$1,111,719 |
$1,062,953 |
8/31/22 |
$1,059,220 |
$1,080,306 |
$1,064,534 |
9/30/22 |
$1,061,330 |
$1,033,630 |
$1,066,619 |
10/31/22 |
$1,063,672 |
$1,020,242 |
$1,069,261 |
11/30/22 |
$1,066,689 |
$1,057,762 |
$1,072,326 |
12/31/22 |
$1,070,562 |
$1,052,991 |
$1,075,945 |
1/31/23 |
$1,074,096 |
$1,085,385 |
$1,079,916 |
2/28/23 |
$1,077,736 |
$1,057,322 |
$1,083,683 |
3/31/23 |
$1,082,157 |
$1,084,180 |
$1,088,015 |
4/30/23 |
$1,086,066 |
$1,090,751 |
$1,092,346 |
5/31/23 |
$1,090,645 |
$1,078,874 |
$1,096,968 |
6/30/23 |
$1,095,426 |
$1,075,027 |
$1,101,639 |
7/31/23 |
$1,099,803 |
$1,074,277 |
$1,106,658 |
8/31/23 |
$1,104,682 |
$1,067,415 |
$1,111,804 |
9/30/23 |
$1,109,602 |
$1,040,290 |
$1,116,824 |
10/31/23 |
$1,114,401 |
$1,023,873 |
$1,122,085 |
11/30/23 |
$1,119,229 |
$1,070,241 |
$1,127,216 |
12/31/23 |
$1,124,433 |
$1,111,209 |
$1,132,519 |
1/31/24 |
$1,129,290 |
$1,108,157 |
$1,137,809 |
2/29/24 |
$1,133,997 |
$1,092,501 |
$1,142,751 |
3/31/24 |
$1,139,061 |
$1,102,589 |
$1,148,046 |
4/30/24 |
$1,143,986 |
$1,074,739 |
$1,153,200 |
5/31/24 |
$1,149,407 |
$1,092,959 |
$1,158,559 |
6/30/24 |
$1,154,053 |
$1,103,307 |
$1,163,774 |
7/31/24 |
$1,159,256 |
$1,129,077 |
$1,169,185 |
8/31/24 |
$1,164,812 |
$1,145,301 |
$1,174,577 |
9/30/24 |
$1,169,349 |
$1,160,636 |
$1,179,725 |
10/31/24 |
$1,174,115 |
$1,131,854 |
$1,184,817 |
11/30/24 |
$1,178,677 |
$1,143,821 |
$1,189,527 |
12/31/24 |
$1,183,151 |
$1,125,101 |
$1,194,204 |
1/31/25 |
$1,187,550 |
$1,131,070 |
$1,198,799 |
2/28/25 |
$1,191,453 |
$1,155,956 |
$1,202,884 |
3/31/25 |
$1,195,475 |
$1,156,391 |
$1,207,357 |
|
| Average Annual Return [Table Text Block] |
Class/Index Name |
1 Year |
5 Years |
10 Years |
Institutional Class |
4.95% |
2.54% |
1.80% |
Bloomberg U.S. Aggregate Index |
4.88% |
(0.40%) |
1.46% |
FTSE 3-Month Treasury Bill Index |
5.17% |
2.69% |
1.90% | |
| No Deduction of Taxes [Text Block] |
Returns shown do not reflect the deduction of taxes that a shareholder would pay on Fund distributions or the redemption of Fund shares.
|
| Performance Table Market Index Changed [Text Block] |
Differences in the Fund’s performance versus an index and related attribution information with respect to particular categories of securities or individual positions may be attributable, in part, to differences in the pricing methodologies used by the Fund and the index.
|
| Updated Performance Information Location [Text Block] |
For performance current to the most recent month-end, visit www.pimco.com/literature or via 888.87.PIMCO (888.877.4626).
|
| AssetsNet |
$ 4,462,627,000
|
| Holdings Count | Holding |
15
|
| Advisory Fees Paid, Amount |
$ 4,188,000
|
| Additional Fund Statistics [Text Block] |
Key Fund StatisticsFootnote Reference† (as of the end of the reporting period)
Total Net Assets |
$4,462,627 |
# of Portfolio Holdings |
15 |
Total Net Advisory Fees Paid During the Reporting Period |
$4,188 |
| Footnote |
Description |
Footnote† |
Dollar amounts displayed in 000's | |
| Holdings [Text Block] |
Security Type Breakdown (% of Net Asset Value)Footnote Reference*
Short-Term Instruments |
146.9% |
Other Assets and Liabilities, Net |
(46.9%) |
Total |
100.0% |
| Footnote |
Description |
Footnote* |
% of Net Asset Value includes derivatives instruments, if any, valued at the value used for determining the Fund's net asset value. The notional exposure of such derivatives investments therefore may be greater than what is depicted. | |
| Material Fund Change [Text Block] |
|
| C000072055 |
|
| Shareholder Report [Line Items] |
|
| Fund Name |
PIMCO Government Money Market Fund
|
| Class Name |
Class M
|
| Trading Symbol |
PGFXX
|
| Annual or Semi-Annual Statement [Text Block] |
This annual shareholder report contains important information about the PIMCO Government Money Market Fund (the "Fund") for the period of April 1, 2024 to March 31, 2025 (the "reporting period").
|
| Shareholder Report Annual or Semi-Annual |
Annual Shareholder Report
|
| Additional Information [Text Block] |
You can find additional information about the Fund at www.pimco.com/literature. You can also request this information by contacting us at 888.87.PIMCO (888.877.4626).
|
| Additional Information Phone Number |
888.87.PIMCO (888.877.4626)
|
| Expenses [Text Block] |
What were the Fund costs for the reporting period?(based on a hypothetical $10,000 investment)
Class Name |
Cost of a $10,000 investment |
Costs paid as a percentage of a $10,000 investment |
Class M |
$18 |
0.18% | |
| Expenses Paid, Amount |
$ 18
|
| Expense Ratio, Percent |
0.18%
|
| Factors Affecting Performance [Text Block] |
How did the Fund perform during the reporting period and what affected its performance?The following affected performance (on a gross basis) during the reporting period: Underweight U.S. duration positioning detracted from relative performance, as interest rates fell. There were no material contributors for this Fund.
|
| Performance Past Does Not Indicate Future [Text] |
Performance quoted represents past performance. Past performance is not a guarantee or a reliable indicator of future results.
|
| Line Graph [Table Text Block] |
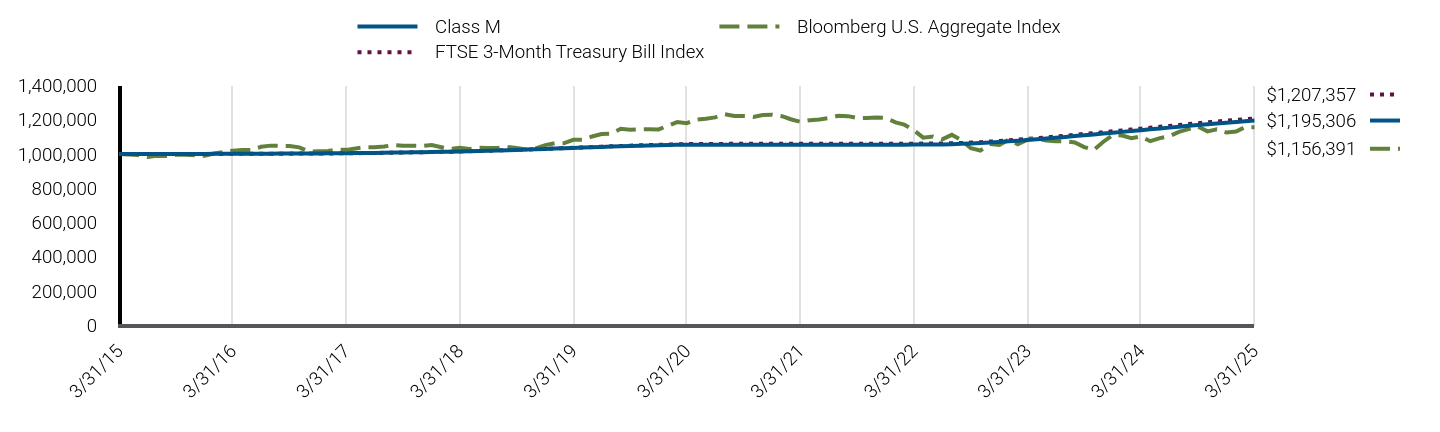
|
Class M |
Bloomberg U.S. Aggregate Index |
FTSE 3-Month Treasury Bill Index |
3/31/15 |
$1,000,000 |
$1,000,000 |
$1,000,000 |
4/30/15 |
$1,000,010 |
$996,412 |
$1,000,016 |
5/31/15 |
$1,000,016 |
$994,012 |
$1,000,030 |
6/30/15 |
$1,000,024 |
$983,174 |
$1,000,041 |
7/31/15 |
$1,000,045 |
$990,008 |
$1,000,050 |
8/31/15 |
$1,000,079 |
$988,586 |
$1,000,075 |
9/30/15 |
$1,000,094 |
$995,273 |
$1,000,101 |
10/31/15 |
$1,000,105 |
$995,439 |
$1,000,125 |
11/30/15 |
$1,000,114 |
$992,809 |
$1,000,152 |
12/31/15 |
$1,000,457 |
$989,601 |
$1,000,229 |
1/31/16 |
$1,000,700 |
$1,003,219 |
$1,000,354 |
2/29/16 |
$1,000,945 |
$1,010,335 |
$1,000,534 |
3/31/16 |
$1,001,171 |
$1,019,605 |
$1,000,767 |
4/30/16 |
$1,001,378 |
$1,023,519 |
$1,001,004 |
5/31/16 |
$1,001,532 |
$1,023,781 |
$1,001,216 |
6/30/16 |
$1,001,824 |
$1,042,177 |
$1,001,416 |
7/31/16 |
$1,002,116 |
$1,048,765 |
$1,001,638 |
8/31/16 |
$1,002,387 |
$1,047,566 |
$1,001,877 |
9/30/16 |
$1,002,748 |
$1,046,952 |
$1,002,116 |
10/31/16 |
$1,003,000 |
$1,038,944 |
$1,002,369 |
11/30/16 |
$1,003,181 |
$1,014,369 |
$1,002,627 |
12/31/16 |
$1,003,425 |
$1,015,800 |
$1,002,938 |
1/31/17 |
$1,003,778 |
$1,017,793 |
$1,003,311 |
2/28/17 |
$1,004,119 |
$1,024,634 |
$1,003,703 |
3/31/17 |
$1,004,589 |
$1,024,097 |
$1,004,153 |
4/30/17 |
$1,005,101 |
$1,032,000 |
$1,004,663 |
5/31/17 |
$1,005,688 |
$1,039,943 |
$1,005,272 |
6/30/17 |
$1,006,485 |
$1,038,896 |
$1,005,984 |
7/31/17 |
$1,007,209 |
$1,043,367 |
$1,006,794 |
8/31/17 |
$1,008,025 |
$1,052,726 |
$1,007,683 |
9/30/17 |
$1,008,852 |
$1,047,712 |
$1,008,552 |
10/31/17 |
$1,009,639 |
$1,048,319 |
$1,009,463 |
11/30/17 |
$1,010,476 |
$1,046,973 |
$1,010,364 |
12/31/17 |
$1,011,505 |
$1,051,778 |
$1,011,376 |
1/31/18 |
$1,012,544 |
$1,039,665 |
$1,012,488 |
2/28/18 |
$1,013,512 |
$1,029,809 |
$1,013,578 |
3/31/18 |
$1,014,844 |
$1,036,414 |
$1,014,900 |
4/30/18 |
$1,016,190 |
$1,028,705 |
$1,016,269 |
5/31/18 |
$1,017,602 |
$1,036,047 |
$1,017,787 |
6/30/18 |
$1,019,122 |
$1,034,773 |
$1,019,327 |
7/31/18 |
$1,020,652 |
$1,035,019 |
$1,020,980 |
8/31/18 |
$1,022,394 |
$1,041,679 |
$1,022,701 |
9/30/18 |
$1,023,830 |
$1,034,971 |
$1,024,424 |
10/31/18 |
$1,025,651 |
$1,026,792 |
$1,026,288 |
11/30/18 |
$1,027,580 |
$1,032,921 |
$1,028,181 |
12/31/18 |
$1,029,508 |
$1,051,898 |
$1,030,216 |
1/31/19 |
$1,031,499 |
$1,063,068 |
$1,032,309 |
2/28/19 |
$1,033,343 |
$1,062,452 |
$1,034,221 |
3/31/19 |
$1,035,421 |
$1,082,853 |
$1,036,364 |
4/30/19 |
$1,037,441 |
$1,083,130 |
$1,038,451 |
5/31/19 |
$1,039,628 |
$1,102,358 |
$1,040,621 |
6/30/19 |
$1,041,474 |
$1,116,201 |
$1,042,721 |
7/31/19 |
$1,043,565 |
$1,118,657 |
$1,044,805 |
8/31/19 |
$1,045,497 |
$1,147,643 |
$1,046,791 |
9/30/19 |
$1,047,195 |
$1,141,531 |
$1,048,587 |
10/31/19 |
$1,048,779 |
$1,144,969 |
$1,050,362 |
11/30/19 |
$1,050,085 |
$1,144,386 |
$1,051,926 |
12/31/19 |
$1,051,361 |
$1,143,588 |
$1,053,424 |
1/31/20 |
$1,052,707 |
$1,165,596 |
$1,054,843 |
2/29/20 |
$1,053,899 |
$1,186,575 |
$1,056,175 |
3/31/20 |
$1,054,372 |
$1,179,592 |
$1,057,509 |
4/30/20 |
$1,054,540 |
$1,200,561 |
$1,058,376 |
5/31/20 |
$1,054,549 |
$1,206,151 |
$1,058,833 |
6/30/20 |
$1,054,552 |
$1,213,749 |
$1,058,937 |
7/31/20 |
$1,054,565 |
$1,231,878 |
$1,059,058 |
8/31/20 |
$1,054,568 |
$1,221,935 |
$1,059,176 |
9/30/20 |
$1,054,571 |
$1,221,265 |
$1,059,278 |
10/31/20 |
$1,054,578 |
$1,215,812 |
$1,059,369 |
11/30/20 |
$1,054,585 |
$1,227,742 |
$1,059,456 |
12/31/20 |
$1,054,591 |
$1,229,433 |
$1,059,538 |
1/31/21 |
$1,054,592 |
$1,220,618 |
$1,059,615 |
2/28/21 |
$1,054,608 |
$1,202,992 |
$1,059,676 |
3/31/21 |
$1,054,609 |
$1,187,971 |
$1,059,730 |
4/30/21 |
$1,054,609 |
$1,197,356 |
$1,059,766 |
5/31/21 |
$1,054,620 |
$1,201,268 |
$1,059,790 |
6/30/21 |
$1,054,620 |
$1,209,708 |
$1,059,806 |
7/31/21 |
$1,054,620 |
$1,223,233 |
$1,059,829 |
8/31/21 |
$1,054,620 |
$1,220,905 |
$1,059,862 |
9/30/21 |
$1,054,636 |
$1,210,334 |
$1,059,903 |
10/31/21 |
$1,054,641 |
$1,210,000 |
$1,059,941 |
11/30/21 |
$1,054,641 |
$1,213,580 |
$1,059,981 |
12/31/21 |
$1,054,651 |
$1,210,475 |
$1,060,025 |
1/31/22 |
$1,054,655 |
$1,184,396 |
$1,060,075 |
2/28/22 |
$1,054,655 |
$1,171,183 |
$1,060,155 |
3/31/22 |
$1,054,709 |
$1,138,645 |
$1,060,323 |
4/30/22 |
$1,054,819 |
$1,095,436 |
$1,060,623 |
5/31/22 |
$1,055,283 |
$1,102,499 |
$1,061,136 |
6/30/22 |
$1,056,060 |
$1,085,203 |
$1,061,852 |
7/31/22 |
$1,057,287 |
$1,111,719 |
$1,062,953 |
8/31/22 |
$1,059,067 |
$1,080,306 |
$1,064,534 |
9/30/22 |
$1,061,175 |
$1,033,630 |
$1,066,619 |
10/31/22 |
$1,063,517 |
$1,020,242 |
$1,069,261 |
11/30/22 |
$1,066,534 |
$1,057,762 |
$1,072,326 |
12/31/22 |
$1,070,409 |
$1,052,991 |
$1,075,945 |
1/31/23 |
$1,073,943 |
$1,085,385 |
$1,079,916 |
2/28/23 |
$1,077,583 |
$1,057,322 |
$1,083,683 |
3/31/23 |
$1,082,003 |
$1,084,180 |
$1,088,015 |
4/30/23 |
$1,085,913 |
$1,090,751 |
$1,092,346 |
5/31/23 |
$1,090,491 |
$1,078,874 |
$1,096,968 |
6/30/23 |
$1,095,271 |
$1,075,027 |
$1,101,639 |
7/31/23 |
$1,099,648 |
$1,074,277 |
$1,106,658 |
8/31/23 |
$1,104,526 |
$1,067,415 |
$1,111,804 |
9/30/23 |
$1,109,445 |
$1,040,290 |
$1,116,824 |
10/31/23 |
$1,114,242 |
$1,023,873 |
$1,122,085 |
11/30/23 |
$1,119,070 |
$1,070,241 |
$1,127,216 |
12/31/23 |
$1,124,273 |
$1,111,209 |
$1,132,519 |
1/31/24 |
$1,129,130 |
$1,108,157 |
$1,137,809 |
2/29/24 |
$1,133,836 |
$1,092,501 |
$1,142,751 |
3/31/24 |
$1,138,898 |
$1,102,589 |
$1,148,046 |
4/30/24 |
$1,143,822 |
$1,074,739 |
$1,153,200 |
5/31/24 |
$1,149,242 |
$1,092,959 |
$1,158,559 |
6/30/24 |
$1,153,888 |
$1,103,307 |
$1,163,774 |
7/31/24 |
$1,159,090 |
$1,129,077 |
$1,169,185 |
8/31/24 |
$1,164,647 |
$1,145,301 |
$1,174,577 |
9/30/24 |
$1,169,184 |
$1,160,636 |
$1,179,725 |
10/31/24 |
$1,173,950 |
$1,131,854 |
$1,184,817 |
11/30/24 |
$1,178,511 |
$1,143,821 |
$1,189,527 |
12/31/24 |
$1,182,986 |
$1,125,101 |
$1,194,204 |
1/31/25 |
$1,187,382 |
$1,131,070 |
$1,198,799 |
2/28/25 |
$1,191,285 |
$1,155,956 |
$1,202,884 |
3/31/25 |
$1,195,306 |
$1,156,391 |
$1,207,357 |
|
| Average Annual Return [Table Text Block] |
Class/Index Name |
1 Year |
5 Years |
10 Years |
Class M |
4.95% |
2.54% |
1.80% |
Bloomberg U.S. Aggregate Index |
4.88% |
(0.40%) |
1.46% |
FTSE 3-Month Treasury Bill Index |
5.17% |
2.69% |
1.90% | |
| No Deduction of Taxes [Text Block] |
Returns shown do not reflect the deduction of taxes that a shareholder would pay on Fund distributions or the redemption of Fund shares.
|
| Performance Table Market Index Changed [Text Block] |
Differences in the Fund’s performance versus an index and related attribution information with respect to particular categories of securities or individual positions may be attributable, in part, to differences in the pricing methodologies used by the Fund and the index.
|
| Updated Performance Information Location [Text Block] |
For performance current to the most recent month-end, visit www.pimco.com/literature or via 888.87.PIMCO (888.877.4626).
|
| AssetsNet |
$ 4,462,627,000
|
| Holdings Count | Holding |
15
|
| Advisory Fees Paid, Amount |
$ 4,188,000
|
| Additional Fund Statistics [Text Block] |
Key Fund StatisticsFootnote Reference† (as of the end of the reporting period)
Total Net Assets |
$4,462,627 |
# of Portfolio Holdings |
15 |
Total Net Advisory Fees Paid During the Reporting Period |
$4,188 |
| Footnote |
Description |
Footnote† |
Dollar amounts displayed in 000's | |
| Holdings [Text Block] |
Security Type Breakdown (% of Net Asset Value)Footnote Reference*
Short-Term Instruments |
146.9% |
Other Assets and Liabilities, Net |
(46.9%) |
Total |
100.0% |
| Footnote |
Description |
Footnote* |
% of Net Asset Value includes derivatives instruments, if any, valued at the value used for determining the Fund's net asset value. The notional exposure of such derivatives investments therefore may be greater than what is depicted. | |
| Material Fund Change [Text Block] |
|
| C000072056 |
|
| Shareholder Report [Line Items] |
|
| Fund Name |
PIMCO Government Money Market Fund
|
| Class Name |
I-2
|
| Trading Symbol |
PGPXX
|
| Annual or Semi-Annual Statement [Text Block] |
This annual shareholder report contains important information about the PIMCO Government Money Market Fund (the "Fund") for the period of April 1, 2024 to March 31, 2025 (the "reporting period").
|
| Shareholder Report Annual or Semi-Annual |
Annual Shareholder Report
|
| Additional Information [Text Block] |
You can find additional information about the Fund at www.pimco.com/literature. You can also request this information by contacting us at 888.87.PIMCO (888.877.4626).
|
| Additional Information Phone Number |
888.87.PIMCO (888.877.4626)
|
| Expenses [Text Block] |
What were the Fund costs for the reporting period?(based on a hypothetical $10,000 investment)
Class Name |
Cost of a $10,000 investment |
Costs paid as a percentage of a $10,000 investment |
I-2 |
$29 |
0.28% | |
| Expenses Paid, Amount |
$ 29
|
| Expense Ratio, Percent |
0.28%
|
| Factors Affecting Performance [Text Block] |
How did the Fund perform during the reporting period and what affected its performance?The following affected performance (on a gross basis) during the reporting period: Underweight U.S. duration positioning detracted from relative performance, as interest rates fell. There were no material contributors for this Fund.
|
| Performance Past Does Not Indicate Future [Text] |
Performance quoted represents past performance. Past performance is not a guarantee or a reliable indicator of future results.
|
| Line Graph [Table Text Block] |
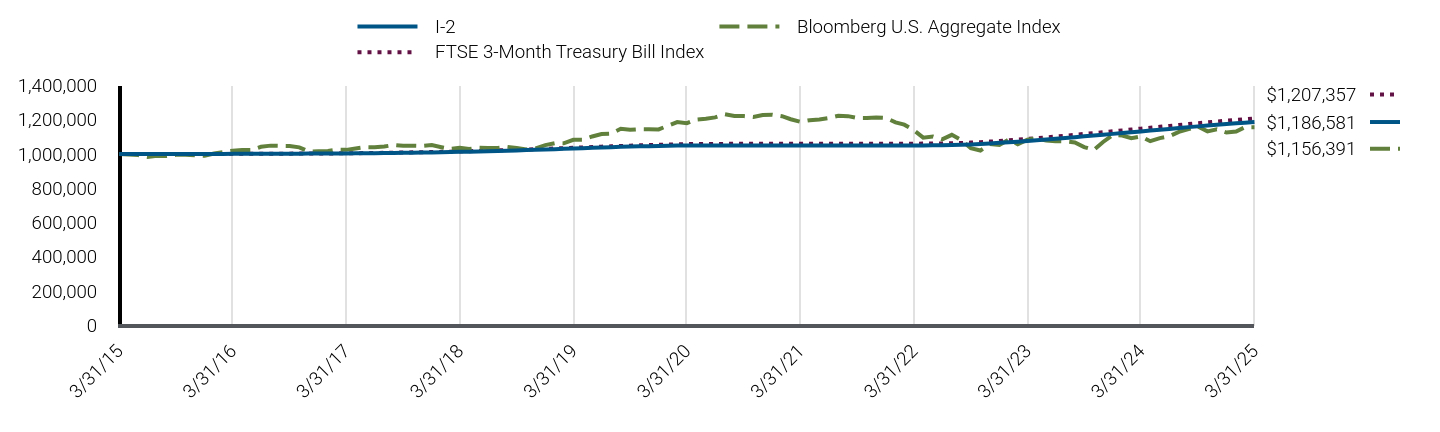
|
I-2 |
Bloomberg U.S. Aggregate Index |
FTSE 3-Month Treasury Bill Index |
3/31/15 |
$1,000,000 |
$1,000,000 |
$1,000,000 |
4/30/15 |
$1,000,006 |
$996,412 |
$1,000,016 |
5/31/15 |
$1,000,015 |
$994,012 |
$1,000,030 |
6/30/15 |
$1,000,022 |
$983,174 |
$1,000,041 |
7/31/15 |
$1,000,030 |
$990,008 |
$1,000,050 |
8/31/15 |
$1,000,036 |
$988,586 |
$1,000,075 |
9/30/15 |
$1,000,043 |
$995,273 |
$1,000,101 |
10/31/15 |
$1,000,051 |
$995,439 |
$1,000,125 |
11/30/15 |
$1,000,058 |
$992,809 |
$1,000,152 |
12/31/15 |
$1,000,337 |
$989,601 |
$1,000,229 |
1/31/16 |
$1,000,503 |
$1,003,219 |
$1,000,354 |
2/29/16 |
$1,000,669 |
$1,010,335 |
$1,000,534 |
3/31/16 |
$1,000,809 |
$1,019,605 |
$1,000,767 |
4/30/16 |
$1,000,932 |
$1,023,519 |
$1,001,004 |
5/31/16 |
$1,001,007 |
$1,023,781 |
$1,001,216 |
6/30/16 |
$1,001,217 |
$1,042,177 |
$1,001,416 |
7/31/16 |
$1,001,423 |
$1,048,765 |
$1,001,638 |
8/31/16 |
$1,001,610 |
$1,047,566 |
$1,001,877 |
9/30/16 |
$1,001,883 |
$1,046,952 |
$1,002,116 |
10/31/16 |
$1,002,056 |
$1,038,944 |
$1,002,369 |
11/30/16 |
$1,002,157 |
$1,014,369 |
$1,002,627 |
12/31/16 |
$1,002,310 |
$1,015,800 |
$1,002,938 |
1/31/17 |
$1,002,583 |
$1,017,793 |
$1,003,311 |
2/28/17 |
$1,002,847 |
$1,024,634 |
$1,003,703 |
3/31/17 |
$1,003,225 |
$1,024,097 |
$1,004,153 |
4/30/17 |
$1,003,662 |
$1,032,000 |
$1,004,663 |
5/31/17 |
$1,004,162 |
$1,039,943 |
$1,005,272 |
6/30/17 |
$1,004,870 |
$1,038,896 |
$1,005,984 |
7/31/17 |
$1,005,513 |
$1,043,367 |
$1,006,794 |
8/31/17 |
$1,006,243 |
$1,052,726 |
$1,007,683 |
9/30/17 |
$1,006,983 |
$1,047,712 |
$1,008,552 |
10/31/17 |
$1,007,686 |
$1,048,319 |
$1,009,463 |
11/30/17 |
$1,008,439 |
$1,046,973 |
$1,010,364 |
12/31/17 |
$1,009,379 |
$1,051,778 |
$1,011,376 |
1/31/18 |
$1,010,335 |
$1,039,665 |
$1,012,488 |
2/28/18 |
$1,011,226 |
$1,029,809 |
$1,013,578 |
3/31/18 |
$1,012,464 |
$1,036,414 |
$1,014,900 |
4/30/18 |
$1,013,726 |
$1,028,705 |
$1,016,269 |
5/31/18 |
$1,015,050 |
$1,036,047 |
$1,017,787 |
6/30/18 |
$1,016,480 |
$1,034,773 |
$1,019,327 |
7/31/18 |
$1,017,924 |
$1,035,019 |
$1,020,980 |
8/31/18 |
$1,019,566 |
$1,041,679 |
$1,022,701 |
9/30/18 |
$1,020,923 |
$1,034,971 |
$1,024,424 |
10/31/18 |
$1,022,655 |
$1,026,792 |
$1,026,288 |
11/30/18 |
$1,024,488 |
$1,032,921 |
$1,028,181 |
12/31/18 |
$1,026,336 |
$1,051,898 |
$1,030,216 |
1/31/19 |
$1,028,233 |
$1,063,068 |
$1,032,309 |
2/28/19 |
$1,029,994 |
$1,062,452 |
$1,034,221 |
3/31/19 |
$1,031,978 |
$1,082,853 |
$1,036,364 |
4/30/19 |
$1,033,906 |
$1,083,130 |
$1,038,451 |
5/31/19 |
$1,035,993 |
$1,102,358 |
$1,040,621 |
6/30/19 |
$1,037,755 |
$1,116,201 |
$1,042,721 |
7/31/19 |
$1,039,751 |
$1,118,657 |
$1,044,805 |
8/31/19 |
$1,041,582 |
$1,147,643 |
$1,046,791 |
9/30/19 |
$1,043,194 |
$1,141,531 |
$1,048,587 |
10/31/19 |
$1,044,684 |
$1,144,969 |
$1,050,362 |
11/30/19 |
$1,045,896 |
$1,144,386 |
$1,051,926 |
12/31/19 |
$1,047,078 |
$1,143,588 |
$1,053,424 |
1/31/20 |
$1,048,327 |
$1,165,596 |
$1,054,843 |
2/29/20 |
$1,049,434 |
$1,186,575 |
$1,056,175 |
3/31/20 |
$1,049,858 |
$1,179,592 |
$1,057,509 |
4/30/20 |
$1,050,025 |
$1,200,561 |
$1,058,376 |
5/31/20 |
$1,050,033 |
$1,206,151 |
$1,058,833 |
6/30/20 |
$1,050,035 |
$1,213,749 |
$1,058,937 |
7/31/20 |
$1,050,038 |
$1,231,878 |
$1,059,058 |
8/31/20 |
$1,050,038 |
$1,221,935 |
$1,059,176 |
9/30/20 |
$1,050,039 |
$1,221,265 |
$1,059,278 |
10/31/20 |
$1,050,045 |
$1,215,812 |
$1,059,369 |
11/30/20 |
$1,050,053 |
$1,227,742 |
$1,059,456 |
12/31/20 |
$1,050,058 |
$1,229,433 |
$1,059,538 |
1/31/21 |
$1,050,059 |
$1,220,618 |
$1,059,615 |
2/28/21 |
$1,050,074 |
$1,202,992 |
$1,059,676 |
3/31/21 |
$1,050,075 |
$1,187,971 |
$1,059,730 |
4/30/21 |
$1,050,075 |
$1,197,356 |
$1,059,766 |
5/31/21 |
$1,050,086 |
$1,201,268 |
$1,059,790 |
6/30/21 |
$1,050,086 |
$1,209,708 |
$1,059,806 |
7/31/21 |
$1,050,086 |
$1,223,233 |
$1,059,829 |
8/31/21 |
$1,050,087 |
$1,220,905 |
$1,059,862 |
9/30/21 |
$1,050,102 |
$1,210,334 |
$1,059,903 |
10/31/21 |
$1,050,107 |
$1,210,000 |
$1,059,941 |
11/30/21 |
$1,050,107 |
$1,213,580 |
$1,059,981 |
12/31/21 |
$1,050,118 |
$1,210,475 |
$1,060,025 |
1/31/22 |
$1,050,121 |
$1,184,396 |
$1,060,075 |
2/28/22 |
$1,050,121 |
$1,171,183 |
$1,060,155 |
3/31/22 |
$1,050,135 |
$1,138,645 |
$1,060,323 |
4/30/22 |
$1,050,157 |
$1,095,436 |
$1,060,623 |
5/31/22 |
$1,050,532 |
$1,102,499 |
$1,061,136 |
6/30/22 |
$1,051,221 |
$1,085,203 |
$1,061,852 |
7/31/22 |
$1,052,353 |
$1,111,719 |
$1,062,953 |
8/31/22 |
$1,054,035 |
$1,080,306 |
$1,064,534 |
9/30/22 |
$1,056,043 |
$1,033,630 |
$1,066,619 |
10/31/22 |
$1,058,291 |
$1,020,242 |
$1,069,261 |
11/30/22 |
$1,061,207 |
$1,057,762 |
$1,072,326 |
12/31/22 |
$1,064,961 |
$1,052,991 |
$1,075,945 |
1/31/23 |
$1,068,392 |
$1,085,385 |
$1,079,916 |
2/28/23 |
$1,071,932 |
$1,057,322 |
$1,083,683 |
3/31/23 |
$1,076,232 |
$1,084,180 |
$1,088,015 |
4/30/23 |
$1,080,038 |
$1,090,751 |
$1,092,346 |
5/31/23 |
$1,084,500 |
$1,078,874 |
$1,096,968 |
6/30/23 |
$1,089,161 |
$1,075,027 |
$1,101,639 |
7/31/23 |
$1,093,429 |
$1,074,277 |
$1,106,658 |
8/31/23 |
$1,098,188 |
$1,067,415 |
$1,111,804 |
9/30/23 |
$1,102,985 |
$1,040,290 |
$1,116,824 |
10/31/23 |
$1,107,666 |
$1,023,873 |
$1,122,085 |
11/30/23 |
$1,112,375 |
$1,070,241 |
$1,127,216 |
12/31/23 |
$1,117,450 |
$1,111,209 |
$1,132,519 |
1/31/24 |
$1,122,187 |
$1,108,157 |
$1,137,809 |
2/29/24 |
$1,126,775 |
$1,092,501 |
$1,142,751 |
3/31/24 |
$1,131,710 |
$1,102,589 |
$1,148,046 |
4/30/24 |
$1,136,511 |
$1,074,739 |
$1,153,200 |
5/31/24 |
$1,141,795 |
$1,092,959 |
$1,158,559 |
6/30/24 |
$1,146,323 |
$1,103,307 |
$1,163,774 |
7/31/24 |
$1,151,394 |
$1,129,077 |
$1,169,185 |
8/31/24 |
$1,156,807 |
$1,145,301 |
$1,174,577 |
9/30/24 |
$1,161,224 |
$1,160,636 |
$1,179,725 |
10/31/24 |
$1,165,860 |
$1,131,854 |
$1,184,817 |
11/30/24 |
$1,170,292 |
$1,143,821 |
$1,189,527 |
12/31/24 |
$1,174,636 |
$1,125,101 |
$1,194,204 |
1/31/25 |
$1,178,898 |
$1,131,070 |
$1,198,799 |
2/28/25 |
$1,182,682 |
$1,155,956 |
$1,202,884 |
3/31/25 |
$1,186,581 |
$1,156,391 |
$1,207,357 |
|
| Average Annual Return [Table Text Block] |
Class/Index Name |
1 Year |
5 Years |
10 Years |
I-2 |
4.85% |
2.48% |
1.73% |
Bloomberg U.S. Aggregate Index |
4.88% |
(0.40%) |
1.46% |
FTSE 3-Month Treasury Bill Index |
5.17% |
2.69% |
1.90% | |
| No Deduction of Taxes [Text Block] |
Returns shown do not reflect the deduction of taxes that a shareholder would pay on Fund distributions or the redemption of Fund shares.
|
| Performance Table Market Index Changed [Text Block] |
Differences in the Fund’s performance versus an index and related attribution information with respect to particular categories of securities or individual positions may be attributable, in part, to differences in the pricing methodologies used by the Fund and the index.
|
| Updated Performance Information Location [Text Block] |
For performance current to the most recent month-end, visit www.pimco.com/literature or via 888.87.PIMCO (888.877.4626).
|
| AssetsNet |
$ 4,462,627,000
|
| Holdings Count | Holding |
15
|
| Advisory Fees Paid, Amount |
$ 4,188,000
|
| Additional Fund Statistics [Text Block] |
Key Fund StatisticsFootnote Reference† (as of the end of the reporting period)
Total Net Assets |
$4,462,627 |
# of Portfolio Holdings |
15 |
Total Net Advisory Fees Paid During the Reporting Period |
$4,188 |
| Footnote |
Description |
Footnote† |
Dollar amounts displayed in 000's | |
| Holdings [Text Block] |
Security Type Breakdown (% of Net Asset Value)Footnote Reference*
Short-Term Instruments |
146.9% |
Other Assets and Liabilities, Net |
(46.9%) |
Total |
100.0% |
| Footnote |
Description |
Footnote* |
% of Net Asset Value includes derivatives instruments, if any, valued at the value used for determining the Fund's net asset value. The notional exposure of such derivatives investments therefore may be greater than what is depicted. | |
| Material Fund Change [Text Block] |
|
| C000103229 |
|
| Shareholder Report [Line Items] |
|
| Fund Name |
PIMCO Inflation Response Multi-Asset Fund
|
| Class Name |
Class A
|
| Trading Symbol |
PZRMX
|
| Annual or Semi-Annual Statement [Text Block] |
This annual shareholder report contains important information about the PIMCO Inflation Response Multi-Asset Fund (the "Fund") for the period of April 1, 2024 to March 31, 2025 (the "reporting period").
|
| Shareholder Report Annual or Semi-Annual |
Annual Shareholder Report
|
| Additional Information [Text Block] |
You can find additional information about the Fund at www.pimco.com/literature. You can also request this information by contacting us at 888.87.PIMCO (888.877.4626).
|
| Additional Information Phone Number |
888.87.PIMCO (888.877.4626)
|
| Expenses [Text Block] |
What were the Fund costs for the reporting period?(based on a hypothetical $10,000 investment)
Class Name |
Cost of a $10,000 investment |
Costs paid as a percentage of a $10,000 investment |
Class A |
$239 |
2.29% | |
| Expenses Paid, Amount |
$ 239
|
| Expense Ratio, Percent |
2.29%
|
| Factors Affecting Performance [Text Block] |
How did the Fund perform during the reporting period and what affected its performance?The following affected performance (on a gross basis) during the reporting period: Eurozone interest rate strategies, including short exposure to duration and exposure to swap spreads, contributed to relative performance versus the Supplemental Index ("Index"), as eurozone rates rose, while swaps spreads tightened. U.S. yield curve positioning, specifically overweight exposure to intermediate maturities relative to underweight exposure to long-term maturities, contributed to relative performance versus the Index, as the U.S. yield curve steepened. Overweight exposure to intermediate U.S. breakeven inflation contributed to relative performance versus the Index, as intermediate U.S. breakeven inflation rose. Exposure to California Carbon Allowances ("CCAs") detracted from relative performance, as CCAs posted negative returns. Positioning within the energy sector, including underweight exposure to natural gas, detracted from relative performance versus the Index, as natural gas posted positive returns. Active real estate investment trust ("REIT") strategies, including underweight exposure to healthcare REITs, detracted from relative performance versus the Index, as healthcare REITs posted positive returns.
|
| Performance Past Does Not Indicate Future [Text] |
Performance quoted represents past performance. Past performance is not a guarantee or a reliable indicator of future results.
|
| Line Graph [Table Text Block] |
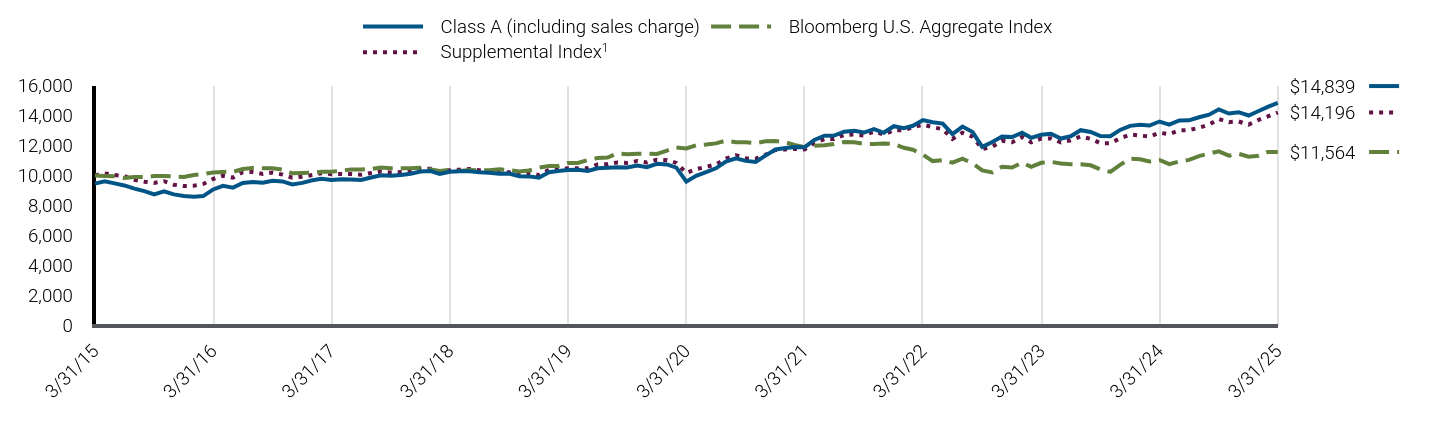
|
Class A (including sales charge) |
Bloomberg U.S. Aggregate Index |
Supplemental IndexFootnote Reference1 |
3/31/15 |
$9,448 |
$10,000 |
$10,000 |
4/30/15 |
$9,610 |
$9,964 |
$10,136 |
5/31/15 |
$9,470 |
$9,940 |
$10,028 |
6/30/15 |
$9,329 |
$9,832 |
$9,952 |
7/31/15 |
$9,122 |
$9,900 |
$9,705 |
8/31/15 |
$8,948 |
$9,886 |
$9,581 |
9/30/15 |
$8,733 |
$9,953 |
$9,499 |
10/31/15 |
$8,943 |
$9,954 |
$9,613 |
11/30/15 |
$8,733 |
$9,928 |
$9,380 |
12/31/15 |
$8,630 |
$9,896 |
$9,289 |
1/31/16 |
$8,574 |
$10,032 |
$9,316 |
2/29/16 |
$8,619 |
$10,103 |
$9,431 |
3/31/16 |
$9,063 |
$10,196 |
$9,764 |
4/30/16 |
$9,307 |
$10,235 |
$9,973 |
5/31/16 |
$9,185 |
$10,238 |
$9,855 |
6/30/16 |
$9,496 |
$10,422 |
$10,213 |
7/31/16 |
$9,563 |
$10,488 |
$10,222 |
8/31/16 |
$9,507 |
$10,476 |
$10,100 |
9/30/16 |
$9,641 |
$10,470 |
$10,186 |
10/31/16 |
$9,596 |
$10,389 |
$10,054 |
11/30/16 |
$9,396 |
$10,144 |
$9,850 |
12/31/16 |
$9,501 |
$10,158 |
$9,917 |
1/31/17 |
$9,679 |
$10,178 |
$10,025 |
2/28/17 |
$9,768 |
$10,246 |
$10,146 |
3/31/17 |
$9,699 |
$10,241 |
$10,081 |
4/30/17 |
$9,744 |
$10,320 |
$10,094 |
5/31/17 |
$9,733 |
$10,399 |
$10,087 |
6/30/17 |
$9,698 |
$10,389 |
$10,040 |
7/31/17 |
$9,856 |
$10,434 |
$10,160 |
8/31/17 |
$10,003 |
$10,527 |
$10,264 |
9/30/17 |
$9,971 |
$10,477 |
$10,196 |
10/31/17 |
$10,029 |
$10,483 |
$10,219 |
11/30/17 |
$10,109 |
$10,470 |
$10,275 |
12/31/17 |
$10,256 |
$10,518 |
$10,420 |
1/31/18 |
$10,292 |
$10,397 |
$10,450 |
2/28/18 |
$10,091 |
$10,298 |
$10,258 |
3/31/18 |
$10,244 |
$10,364 |
$10,348 |
4/30/18 |
$10,280 |
$10,287 |
$10,381 |
5/31/18 |
$10,280 |
$10,360 |
$10,420 |
6/30/18 |
$10,218 |
$10,348 |
$10,346 |
7/31/18 |
$10,170 |
$10,350 |
$10,273 |
8/31/18 |
$10,110 |
$10,417 |
$10,234 |
9/30/18 |
$10,119 |
$10,350 |
$10,206 |
10/31/18 |
$9,948 |
$10,268 |
$10,071 |
11/30/18 |
$9,935 |
$10,329 |
$10,162 |
12/31/18 |
$9,841 |
$10,519 |
$10,018 |
1/31/19 |
$10,208 |
$10,631 |
$10,374 |
2/28/19 |
$10,287 |
$10,625 |
$10,392 |
3/31/19 |
$10,353 |
$10,829 |
$10,475 |
4/30/19 |
$10,379 |
$10,831 |
$10,473 |
5/31/19 |
$10,300 |
$11,024 |
$10,485 |
6/30/19 |
$10,471 |
$11,162 |
$10,721 |
7/31/19 |
$10,511 |
$11,187 |
$10,752 |
8/31/19 |
$10,550 |
$11,476 |
$10,862 |
9/30/19 |
$10,534 |
$11,415 |
$10,831 |
10/31/19 |
$10,653 |
$11,450 |
$10,964 |
11/30/19 |
$10,547 |
$11,444 |
$10,856 |
12/31/19 |
$10,773 |
$11,436 |
$11,050 |
1/31/20 |
$10,733 |
$11,656 |
$11,019 |
2/29/20 |
$10,519 |
$11,866 |
$10,834 |
3/31/20 |
$9,585 |
$11,796 |
$10,164 |
4/30/20 |
$9,972 |
$12,006 |
$10,419 |
5/31/20 |
$10,225 |
$12,062 |
$10,568 |
6/30/20 |
$10,474 |
$12,137 |
$10,731 |
7/31/20 |
$10,929 |
$12,319 |
$11,121 |
8/31/20 |
$11,143 |
$12,219 |
$11,341 |
9/30/20 |
$10,969 |
$12,213 |
$11,146 |
10/31/20 |
$10,902 |
$12,158 |
$11,114 |
11/30/20 |
$11,317 |
$12,277 |
$11,379 |
12/31/20 |
$11,733 |
$12,294 |
$11,696 |
1/31/21 |
$11,827 |
$12,206 |
$11,732 |
2/28/21 |
$11,895 |
$12,030 |
$11,775 |
3/31/21 |
$11,881 |
$11,880 |
$11,732 |
4/30/21 |
$12,364 |
$11,974 |
$12,163 |
5/31/21 |
$12,646 |
$12,013 |
$12,429 |
6/30/21 |
$12,655 |
$12,097 |
$12,427 |
7/31/21 |
$12,918 |
$12,232 |
$12,708 |
8/31/21 |
$12,974 |
$12,209 |
$12,727 |
9/30/21 |
$12,859 |
$12,103 |
$12,666 |
10/31/21 |
$13,089 |
$12,100 |
$12,925 |
11/30/21 |
$12,845 |
$12,136 |
$12,723 |
12/31/21 |
$13,281 |
$12,105 |
$13,009 |
1/31/22 |
$13,147 |
$11,844 |
$13,013 |
2/28/22 |
$13,311 |
$11,712 |
$13,219 |
3/31/22 |
$13,688 |
$11,386 |
$13,384 |
4/30/22 |
$13,552 |
$10,954 |
$13,221 |
5/31/22 |
$13,461 |
$11,025 |
$13,082 |
6/30/22 |
$12,760 |
$10,852 |
$12,435 |
7/31/22 |
$13,258 |
$11,117 |
$12,852 |
8/31/22 |
$12,900 |
$10,803 |
$12,580 |
9/30/22 |
$11,901 |
$10,336 |
$11,754 |
10/31/22 |
$12,222 |
$10,202 |
$11,910 |
11/30/22 |
$12,591 |
$10,578 |
$12,304 |
12/31/22 |
$12,560 |
$10,530 |
$12,212 |
1/31/23 |
$12,849 |
$10,854 |
$12,562 |
2/28/23 |
$12,509 |
$10,573 |
$12,204 |
3/31/23 |
$12,713 |
$10,842 |
$12,457 |
4/30/23 |
$12,781 |
$10,908 |
$12,474 |
5/31/23 |
$12,458 |
$10,789 |
$12,199 |
6/30/23 |
$12,611 |
$10,750 |
$12,337 |
7/31/23 |
$13,018 |
$10,743 |
$12,600 |
8/31/23 |
$12,899 |
$10,674 |
$12,441 |
9/30/23 |
$12,628 |
$10,403 |
$12,151 |
10/31/23 |
$12,611 |
$10,239 |
$12,153 |
11/30/23 |
$13,035 |
$10,702 |
$12,471 |
12/31/23 |
$13,307 |
$11,112 |
$12,727 |
1/31/24 |
$13,375 |
$11,082 |
$12,659 |
2/29/24 |
$13,324 |
$10,925 |
$12,588 |
3/31/24 |
$13,595 |
$11,026 |
$12,846 |
4/30/24 |
$13,392 |
$10,747 |
$12,755 |
5/31/24 |
$13,663 |
$10,930 |
$13,002 |
6/30/24 |
$13,673 |
$11,033 |
$13,028 |
7/31/24 |
$13,879 |
$11,291 |
$13,175 |
8/31/24 |
$14,050 |
$11,453 |
$13,387 |
9/30/24 |
$14,407 |
$11,606 |
$13,758 |
10/31/24 |
$14,130 |
$11,319 |
$13,554 |
11/30/24 |
$14,216 |
$11,438 |
$13,599 |
12/31/24 |
$13,996 |
$11,251 |
$13,388 |
1/31/25 |
$14,294 |
$11,311 |
$13,708 |
2/28/25 |
$14,575 |
$11,560 |
$13,935 |
3/31/25 |
$14,839 |
$11,564 |
$14,196 |
|
| Average Annual Return [Table Text Block] |
Class/Index Name |
1 Year |
5 Years |
10 Years |
Class A (excluding sales charge) |
9.14% |
9.13% |
4.62% |
Class A (including sales charge) |
3.09% |
7.90% |
4.03% |
Bloomberg U.S. Aggregate Index |
4.88% |
(0.40%) |
1.46% |
Supplemental IndexFootnote Reference1 |
10.51% |
6.91% |
3.57% | |
| No Deduction of Taxes [Text Block] |
Returns shown do not reflect the deduction of taxes that a shareholder would pay on Fund distributions or the redemption of Fund shares.
|
| Performance Table Market Index Changed [Text Block] |
Differences in the Fund’s performance versus an index and related attribution information with respect to particular categories of securities or individual positions may be attributable, in part, to differences in the pricing methodologies used by the Fund and the index.
|
| Updated Performance Information Location [Text Block] |
For performance current to the most recent month-end, visit www.pimco.com/literature or via 888.87.PIMCO (888.877.4626).
|
| AssetsNet |
$ 1,819,828,000
|
| Holdings Count | Holding |
1,155
|
| Advisory Fees Paid, Amount |
$ 6,726,000
|
| InvestmentCompanyPortfolioTurnover |
322.00%
|
| Additional Fund Statistics [Text Block] |
Key Fund StatisticsFootnote Reference† (as of the end of the reporting period)
Total Net Assets |
$1,819,828 |
# of Portfolio Holdings |
1,155 |
Portfolio Turnover Rate |
322% |
Total Net Advisory Fees Paid During the Reporting Period |
$6,726 |
| Footnote |
Description |
Footnote† |
Dollar amounts displayed in 000's | |
| Holdings [Text Block] |
Security Type Breakdown (% of Net Asset Value)Footnote Reference*
U.S. Treasury Obligations |
60.8% |
U.S. Government Agencies |
27.7% |
Commodities |
23.2% |
Sovereign Issues |
10.4% |
Asset-Backed Securities |
7.7% |
Real Estate Investment Trusts |
4.7% |
Corporate Bonds & Notes |
1.5% |
Non-Agency Mortgage-Backed Securities |
0.7% |
Common Stocks |
0.2% |
Other Investments |
0.0%Footnote Reference^ |
Short-Term Instruments |
2.9% |
Affiliated Investments |
9.9% |
Financial Derivative Instruments |
(0.5%) |
Other Assets and Liabilities, Net |
(49.2%) |
Total |
100.0% |
| Footnote |
Description |
Footnote^ |
Rounded value of investments is less than 0.1% of net assets. |
Footnote* |
% of Net Asset Value includes derivatives instruments, if any, valued at the value used for determining the Fund's net asset value. The notional exposure of such derivatives investments therefore may be greater than what is depicted. | |
| Material Fund Change [Text Block] |
|
| C000237486 |
|
| Shareholder Report [Line Items] |
|
| Fund Name |
PIMCO Inflation Response Multi-Asset Fund
|
| Class Name |
I-3
|
| Trading Symbol |
PFRMX
|
| Annual or Semi-Annual Statement [Text Block] |
This annual shareholder report contains important information about the PIMCO Inflation Response Multi-Asset Fund (the "Fund") for the period of April 1, 2024 to March 31, 2025 (the "reporting period").
|
| Shareholder Report Annual or Semi-Annual |
Annual Shareholder Report
|
| Additional Information [Text Block] |
You can find additional information about the Fund at www.pimco.com/literature. You can also request this information by contacting us at 888.87.PIMCO (888.877.4626).
|
| Additional Information Phone Number |
888.87.PIMCO (888.877.4626)
|
| Expenses [Text Block] |
What were the Fund costs for the reporting period?(based on a hypothetical $10,000 investment)
Class Name |
Cost of a $10,000 investment |
Costs paid as a percentage of a $10,000 investment |
I-3 |
$209 |
1.99% | |
| Expenses Paid, Amount |
$ 209
|
| Expense Ratio, Percent |
1.99%
|
| Factors Affecting Performance [Text Block] |
How did the Fund perform during the reporting period and what affected its performance?The following affected performance (on a gross basis) during the reporting period: Eurozone interest rate strategies, including short exposure to duration and exposure to swap spreads, contributed to relative performance versus the Supplemental Index ("Index"), as eurozone rates rose, while swaps spreads tightened. U.S. yield curve positioning, specifically overweight exposure to intermediate maturities relative to underweight exposure to long-term maturities, contributed to relative performance versus the Index, as the U.S. yield curve steepened. Overweight exposure to intermediate U.S. breakeven inflation contributed to relative performance versus the Index, as intermediate U.S. breakeven inflation rose. Exposure to California Carbon Allowances ("CCAs") detracted from relative performance, as CCAs posted negative returns. Positioning within the energy sector, including underweight exposure to natural gas, detracted from relative performance versus the Index, as natural gas posted positive returns. Active real estate investment trust ("REIT") strategies, including underweight exposure to healthcare REITs, detracted from relative performance versus the Index, as healthcare REITs posted positive returns.
|
| Performance Past Does Not Indicate Future [Text] |
Performance quoted represents past performance. Past performance is not a guarantee or a reliable indicator of future results.
|
| Line Graph [Table Text Block] |
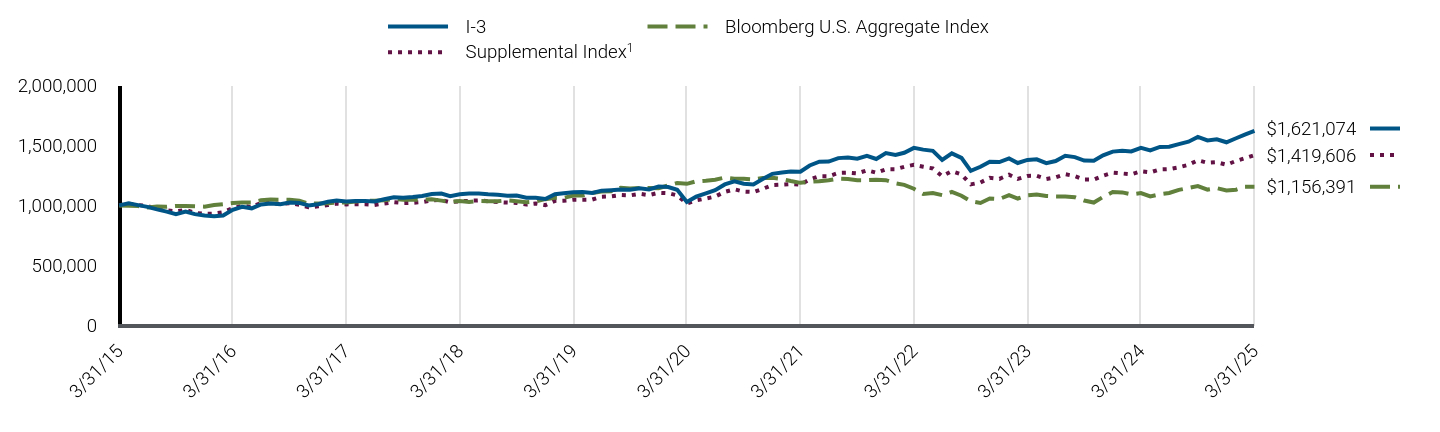
|
I-3 |
Bloomberg U.S. Aggregate Index |
Supplemental IndexFootnote Reference1 |
3/31/15 |
$1,000,000 |
$1,000,000 |
$1,000,000 |
4/30/15 |
$1,017,115 |
$996,412 |
$1,013,620 |
5/31/15 |
$1,002,376 |
$994,012 |
$1,002,830 |
6/30/15 |
$987,400 |
$983,174 |
$995,224 |
7/31/15 |
$966,784 |
$990,008 |
$970,496 |
8/31/15 |
$948,461 |
$988,586 |
$958,149 |
9/30/15 |
$925,930 |
$995,273 |
$949,942 |
10/31/15 |
$947,854 |
$995,439 |
$961,333 |
11/30/15 |
$926,857 |
$992,809 |
$937,984 |
12/31/15 |
$915,229 |
$989,601 |
$928,892 |
1/31/16 |
$910,427 |
$1,003,219 |
$931,617 |
2/29/16 |
$915,007 |
$1,010,335 |
$943,114 |
3/31/16 |
$962,922 |
$1,019,605 |
$976,404 |
4/30/16 |
$988,574 |
$1,023,519 |
$997,347 |
5/31/16 |
$975,565 |
$1,023,781 |
$985,496 |
6/30/16 |
$1,008,236 |
$1,042,177 |
$1,021,332 |
7/31/16 |
$1,016,304 |
$1,048,765 |
$1,022,217 |
8/31/16 |
$1,010,320 |
$1,047,566 |
$1,009,976 |
9/30/16 |
$1,024,244 |
$1,046,952 |
$1,018,573 |
10/31/16 |
$1,020,603 |
$1,038,944 |
$1,005,448 |
11/30/16 |
$999,412 |
$1,014,369 |
$985,036 |
12/31/16 |
$1,010,080 |
$1,015,800 |
$991,687 |
1/31/17 |
$1,029,940 |
$1,017,793 |
$1,002,512 |
2/28/17 |
$1,040,402 |
$1,024,634 |
$1,014,611 |
3/31/17 |
$1,032,775 |
$1,024,097 |
$1,008,101 |
4/30/17 |
$1,037,384 |
$1,032,000 |
$1,009,446 |
5/31/17 |
$1,036,069 |
$1,039,943 |
$1,008,738 |
6/30/17 |
$1,033,084 |
$1,038,896 |
$1,004,033 |
7/31/17 |
$1,050,928 |
$1,043,367 |
$1,015,955 |
8/31/17 |
$1,067,571 |
$1,052,726 |
$1,026,356 |
9/30/17 |
$1,064,127 |
$1,047,712 |
$1,019,564 |
10/31/17 |
$1,070,057 |
$1,048,319 |
$1,021,934 |
11/30/17 |
$1,078,417 |
$1,046,973 |
$1,027,488 |
12/31/17 |
$1,095,199 |
$1,051,778 |
$1,042,028 |
1/31/18 |
$1,098,814 |
$1,039,665 |
$1,044,964 |
2/28/18 |
$1,077,414 |
$1,029,809 |
$1,025,790 |
3/31/18 |
$1,093,543 |
$1,036,414 |
$1,034,811 |
4/30/18 |
$1,098,413 |
$1,028,705 |
$1,038,066 |
5/31/18 |
$1,098,273 |
$1,036,047 |
$1,041,957 |
6/30/18 |
$1,092,438 |
$1,034,773 |
$1,034,564 |
7/31/18 |
$1,088,476 |
$1,035,019 |
$1,027,347 |
8/31/18 |
$1,080,691 |
$1,041,679 |
$1,023,385 |
9/30/18 |
$1,082,814 |
$1,034,971 |
$1,020,625 |
10/31/18 |
$1,064,522 |
$1,026,792 |
$1,007,111 |
11/30/18 |
$1,063,095 |
$1,032,921 |
$1,016,168 |
12/31/18 |
$1,053,041 |
$1,051,898 |
$1,001,769 |
1/31/19 |
$1,093,246 |
$1,063,068 |
$1,037,394 |
2/28/19 |
$1,101,465 |
$1,062,452 |
$1,039,163 |
3/31/19 |
$1,109,668 |
$1,082,853 |
$1,047,512 |
4/30/19 |
$1,112,312 |
$1,083,130 |
$1,047,334 |
5/31/19 |
$1,103,829 |
$1,102,358 |
$1,048,467 |
6/30/19 |
$1,122,740 |
$1,116,201 |
$1,072,134 |
7/31/19 |
$1,126,781 |
$1,118,657 |
$1,075,247 |
8/31/19 |
$1,132,216 |
$1,147,643 |
$1,086,178 |
9/30/19 |
$1,130,207 |
$1,141,531 |
$1,083,065 |
10/31/19 |
$1,142,667 |
$1,144,969 |
$1,096,403 |
11/30/19 |
$1,132,724 |
$1,144,386 |
$1,085,613 |
12/31/19 |
$1,156,892 |
$1,143,588 |
$1,104,999 |
1/31/20 |
$1,152,491 |
$1,165,596 |
$1,101,851 |
2/29/20 |
$1,129,673 |
$1,186,575 |
$1,083,384 |
3/31/20 |
$1,028,903 |
$1,179,592 |
$1,016,415 |
4/30/20 |
$1,072,705 |
$1,200,561 |
$1,041,922 |
5/31/20 |
$1,099,492 |
$1,206,151 |
$1,056,816 |
6/30/20 |
$1,126,550 |
$1,213,749 |
$1,073,124 |
7/31/20 |
$1,174,705 |
$1,231,878 |
$1,112,145 |
8/31/20 |
$1,200,123 |
$1,221,935 |
$1,134,079 |
9/30/20 |
$1,180,093 |
$1,221,265 |
$1,114,621 |
10/31/20 |
$1,174,261 |
$1,215,812 |
$1,111,402 |
11/30/20 |
$1,219,550 |
$1,227,742 |
$1,137,900 |
12/31/20 |
$1,263,286 |
$1,229,433 |
$1,169,632 |
1/31/21 |
$1,274,543 |
$1,220,618 |
$1,173,241 |
2/28/21 |
$1,281,531 |
$1,202,992 |
$1,177,451 |
3/31/21 |
$1,281,367 |
$1,187,971 |
$1,173,241 |
4/30/21 |
$1,332,575 |
$1,197,356 |
$1,216,260 |
5/31/21 |
$1,363,791 |
$1,201,268 |
$1,242,863 |
6/30/21 |
$1,365,080 |
$1,209,708 |
$1,242,721 |
7/31/21 |
$1,394,293 |
$1,223,233 |
$1,270,775 |
8/31/21 |
$1,399,993 |
$1,220,905 |
$1,272,721 |
9/30/21 |
$1,388,888 |
$1,210,334 |
$1,266,566 |
10/31/21 |
$1,413,128 |
$1,210,000 |
$1,292,497 |
11/30/21 |
$1,387,010 |
$1,213,580 |
$1,272,261 |
12/31/21 |
$1,435,826 |
$1,210,475 |
$1,300,916 |
1/31/22 |
$1,419,762 |
$1,184,396 |
$1,301,306 |
2/28/22 |
$1,438,655 |
$1,171,183 |
$1,321,895 |
3/31/22 |
$1,479,584 |
$1,138,645 |
$1,338,416 |
4/30/22 |
$1,464,880 |
$1,095,436 |
$1,322,107 |
5/31/22 |
$1,455,016 |
$1,102,499 |
$1,308,169 |
6/30/22 |
$1,379,638 |
$1,085,203 |
$1,243,535 |
7/31/22 |
$1,433,920 |
$1,111,719 |
$1,285,174 |
8/31/22 |
$1,395,787 |
$1,080,306 |
$1,258,040 |
9/30/22 |
$1,287,757 |
$1,033,630 |
$1,175,364 |
10/31/22 |
$1,321,825 |
$1,020,242 |
$1,191,036 |
11/30/22 |
$1,364,409 |
$1,057,762 |
$1,230,445 |
12/31/22 |
$1,360,925 |
$1,052,991 |
$1,221,177 |
1/31/23 |
$1,391,609 |
$1,085,385 |
$1,256,235 |
2/28/23 |
$1,353,705 |
$1,057,322 |
$1,220,434 |
3/31/23 |
$1,378,974 |
$1,084,180 |
$1,245,658 |
4/30/23 |
$1,384,389 |
$1,090,751 |
$1,247,356 |
5/31/23 |
$1,351,900 |
$1,078,874 |
$1,219,939 |
6/30/23 |
$1,369,950 |
$1,075,027 |
$1,233,665 |
7/31/23 |
$1,413,268 |
$1,074,277 |
$1,259,985 |
8/31/23 |
$1,402,439 |
$1,067,415 |
$1,244,101 |
9/30/23 |
$1,373,560 |
$1,040,290 |
$1,215,057 |
10/31/23 |
$1,371,755 |
$1,023,873 |
$1,215,304 |
11/30/23 |
$1,416,878 |
$1,070,241 |
$1,247,144 |
12/31/23 |
$1,448,361 |
$1,111,209 |
$1,272,650 |
1/31/24 |
$1,455,594 |
$1,108,157 |
$1,265,893 |
2/29/24 |
$1,450,170 |
$1,092,501 |
$1,258,818 |
3/31/24 |
$1,479,790 |
$1,102,589 |
$1,284,643 |
4/30/24 |
$1,458,082 |
$1,074,739 |
$1,275,516 |
5/31/24 |
$1,487,026 |
$1,092,959 |
$1,300,174 |
6/30/24 |
$1,489,235 |
$1,103,307 |
$1,302,827 |
7/31/24 |
$1,511,189 |
$1,129,077 |
$1,317,508 |
8/31/24 |
$1,531,314 |
$1,145,301 |
$1,338,699 |
9/30/24 |
$1,570,765 |
$1,160,636 |
$1,375,809 |
10/31/24 |
$1,541,163 |
$1,131,854 |
$1,355,397 |
11/30/24 |
$1,550,414 |
$1,143,821 |
$1,359,855 |
12/31/24 |
$1,526,305 |
$1,125,101 |
$1,338,805 |
1/31/25 |
$1,560,056 |
$1,131,070 |
$1,370,821 |
2/28/25 |
$1,590,057 |
$1,155,956 |
$1,393,498 |
3/31/25 |
$1,621,074 |
$1,156,391 |
$1,419,606 |
|
| Average Annual Return [Table Text Block] |
Class/Index Name |
1 Year |
5 Years |
10 Years |
I-3 |
9.55% |
9.52% |
4.95% |
Bloomberg U.S. Aggregate Index |
4.88% |
(0.40%) |
1.46% |
Supplemental IndexFootnote Reference1 |
10.51% |
6.91% |
3.57% | |
| No Deduction of Taxes [Text Block] |
Returns shown do not reflect the deduction of taxes that a shareholder would pay on Fund distributions or the redemption of Fund shares.
|
| Performance Table Market Index Changed [Text Block] |
Differences in the Fund’s performance versus an index and related attribution information with respect to particular categories of securities or individual positions may be attributable, in part, to differences in the pricing methodologies used by the Fund and the index.
|
| Updated Performance Information Location [Text Block] |
For performance current to the most recent month-end, visit www.pimco.com/literature or via 888.87.PIMCO (888.877.4626).
|
| AssetsNet |
$ 1,819,828,000
|
| Holdings Count | Holding |
1,155
|
| Advisory Fees Paid, Amount |
$ 6,726,000
|
| InvestmentCompanyPortfolioTurnover |
322.00%
|
| Additional Fund Statistics [Text Block] |
Key Fund StatisticsFootnote Reference† (as of the end of the reporting period)
Total Net Assets |
$1,819,828 |
# of Portfolio Holdings |
1,155 |
Portfolio Turnover Rate |
322% |
Total Net Advisory Fees Paid During the Reporting Period |
$6,726 |
| Footnote |
Description |
Footnote† |
Dollar amounts displayed in 000's | |
| Holdings [Text Block] |
Security Type Breakdown (% of Net Asset Value)Footnote Reference*
U.S. Treasury Obligations |
60.8% |
U.S. Government Agencies |
27.7% |
Commodities |
23.2% |
Sovereign Issues |
10.4% |
Asset-Backed Securities |
7.7% |
Real Estate Investment Trusts |
4.7% |
Corporate Bonds & Notes |
1.5% |
Non-Agency Mortgage-Backed Securities |
0.7% |
Common Stocks |
0.2% |
Other Investments |
0.0%Footnote Reference^ |
Short-Term Instruments |
2.9% |
Affiliated Investments |
9.9% |
Financial Derivative Instruments |
(0.5%) |
Other Assets and Liabilities, Net |
(49.2%) |
Total |
100.0% |
| Footnote |
Description |
Footnote^ |
Rounded value of investments is less than 0.1% of net assets. |
Footnote* |
% of Net Asset Value includes derivatives instruments, if any, valued at the value used for determining the Fund's net asset value. The notional exposure of such derivatives investments therefore may be greater than what is depicted. | |
| Material Fund Change [Text Block] |
|
| C000103232 |
|
| Shareholder Report [Line Items] |
|
| Fund Name |
PIMCO Inflation Response Multi-Asset Fund
|
| Class Name |
Institutional Class
|
| Trading Symbol |
PIRMX
|
| Annual or Semi-Annual Statement [Text Block] |
This annual shareholder report contains important information about the PIMCO Inflation Response Multi-Asset Fund (the "Fund") for the period of April 1, 2024 to March 31, 2025 (the "reporting period").
|
| Shareholder Report Annual or Semi-Annual |
Annual Shareholder Report
|
| Additional Information [Text Block] |
You can find additional information about the Fund at www.pimco.com/literature. You can also request this information by contacting us at 888.87.PIMCO (888.877.4626).
|
| Additional Information Phone Number |
888.87.PIMCO (888.877.4626)
|
| Expenses [Text Block] |
What were the Fund costs for the reporting period?(based on a hypothetical $10,000 investment)
Class Name |
Cost of a $10,000 investment |
Costs paid as a percentage of a $10,000 investment |
Institutional Class |
$193 |
1.84% | |
| Expenses Paid, Amount |
$ 193
|
| Expense Ratio, Percent |
1.84%
|
| Factors Affecting Performance [Text Block] |
How did the Fund perform during the reporting period and what affected its performance?The following affected performance (on a gross basis) during the reporting period: Eurozone interest rate strategies, including short exposure to duration and exposure to swap spreads, contributed to relative performance versus the Supplemental Index ("Index"), as eurozone rates rose, while swaps spreads tightened. U.S. yield curve positioning, specifically overweight exposure to intermediate maturities relative to underweight exposure to long-term maturities, contributed to relative performance versus the Index, as the U.S. yield curve steepened. Overweight exposure to intermediate U.S. breakeven inflation contributed to relative performance versus the Index, as intermediate U.S. breakeven inflation rose. Exposure to California Carbon Allowances ("CCAs") detracted from relative performance, as CCAs posted negative returns. Positioning within the energy sector, including underweight exposure to natural gas, detracted from relative performance versus the Index, as natural gas posted positive returns. Active real estate investment trust ("REIT") strategies, including underweight exposure to healthcare REITs, detracted from relative performance versus the Index, as healthcare REITs posted positive returns.
|
| Performance Past Does Not Indicate Future [Text] |
Performance quoted represents past performance. Past performance is not a guarantee or a reliable indicator of future results.
|
| Line Graph [Table Text Block] |
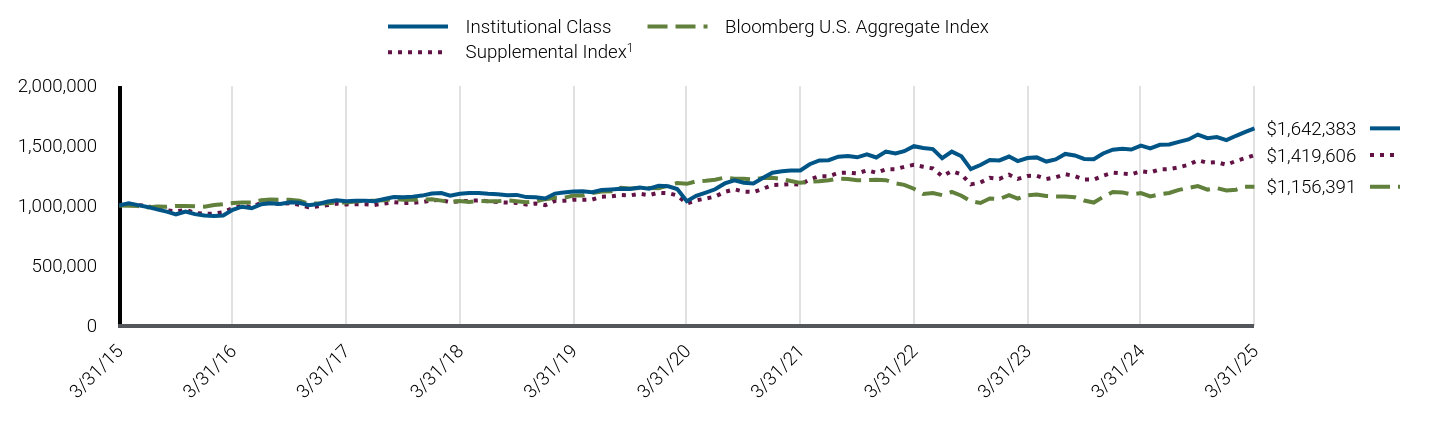
|
Institutional Class |
Bloomberg U.S. Aggregate Index |
Supplemental IndexFootnote Reference1 |
3/31/15 |
$1,000,000 |
$1,000,000 |
$1,000,000 |
4/30/15 |
$1,017,065 |
$996,412 |
$1,013,620 |
5/31/15 |
$1,002,275 |
$994,012 |
$1,002,830 |
6/30/15 |
$987,252 |
$983,174 |
$995,224 |
7/31/15 |
$966,589 |
$990,008 |
$970,496 |
8/31/15 |
$948,221 |
$988,586 |
$958,149 |
9/30/15 |
$925,650 |
$995,273 |
$949,942 |
10/31/15 |
$947,689 |
$995,439 |
$961,333 |
11/30/15 |
$926,809 |
$992,809 |
$937,984 |
12/31/15 |
$915,300 |
$989,601 |
$928,892 |
1/31/16 |
$910,612 |
$1,003,219 |
$931,617 |
2/29/16 |
$915,300 |
$1,010,335 |
$943,114 |
3/31/16 |
$963,350 |
$1,019,605 |
$976,404 |
4/30/16 |
$989,133 |
$1,023,519 |
$997,347 |
5/31/16 |
$976,241 |
$1,023,781 |
$985,496 |
6/30/16 |
$1,009,056 |
$1,042,177 |
$1,021,332 |
7/31/16 |
$1,017,260 |
$1,048,765 |
$1,022,217 |
8/31/16 |
$1,011,400 |
$1,047,566 |
$1,009,976 |
9/30/16 |
$1,025,464 |
$1,046,952 |
$1,018,573 |
10/31/16 |
$1,021,948 |
$1,038,944 |
$1,005,448 |
11/30/16 |
$1,000,853 |
$1,014,369 |
$985,036 |
12/31/16 |
$1,011,664 |
$1,015,800 |
$991,687 |
1/31/17 |
$1,031,685 |
$1,017,793 |
$1,002,512 |
2/28/17 |
$1,042,284 |
$1,024,634 |
$1,014,611 |
3/31/17 |
$1,034,775 |
$1,024,097 |
$1,008,101 |
4/30/17 |
$1,039,521 |
$1,032,000 |
$1,009,446 |
5/31/17 |
$1,038,335 |
$1,039,943 |
$1,008,738 |
6/30/17 |
$1,035,471 |
$1,038,896 |
$1,004,033 |
7/31/17 |
$1,053,489 |
$1,043,367 |
$1,015,955 |
8/31/17 |
$1,070,307 |
$1,052,726 |
$1,026,356 |
9/30/17 |
$1,066,986 |
$1,047,712 |
$1,019,564 |
10/31/17 |
$1,073,069 |
$1,048,319 |
$1,021,934 |
11/30/17 |
$1,081,586 |
$1,046,973 |
$1,027,488 |
12/31/17 |
$1,098,555 |
$1,051,778 |
$1,042,028 |
1/31/18 |
$1,102,322 |
$1,039,665 |
$1,044,964 |
2/28/18 |
$1,080,978 |
$1,029,809 |
$1,025,790 |
3/31/18 |
$1,097,300 |
$1,036,414 |
$1,034,811 |
4/30/18 |
$1,102,322 |
$1,028,705 |
$1,038,066 |
5/31/18 |
$1,102,322 |
$1,036,047 |
$1,041,957 |
6/30/18 |
$1,096,600 |
$1,034,773 |
$1,034,564 |
7/31/18 |
$1,092,761 |
$1,035,019 |
$1,027,347 |
8/31/18 |
$1,085,084 |
$1,041,679 |
$1,023,385 |
9/30/18 |
$1,087,350 |
$1,034,971 |
$1,020,625 |
10/31/18 |
$1,069,119 |
$1,026,792 |
$1,007,111 |
11/30/18 |
$1,067,816 |
$1,032,921 |
$1,016,168 |
12/31/18 |
$1,057,853 |
$1,051,898 |
$1,001,769 |
1/31/19 |
$1,098,379 |
$1,063,068 |
$1,037,394 |
2/28/19 |
$1,106,763 |
$1,062,452 |
$1,039,163 |
3/31/19 |
$1,115,148 |
$1,082,853 |
$1,047,512 |
4/30/19 |
$1,117,943 |
$1,083,130 |
$1,047,334 |
5/31/19 |
$1,109,558 |
$1,102,358 |
$1,048,467 |
6/30/19 |
$1,128,706 |
$1,116,201 |
$1,072,134 |
7/31/19 |
$1,132,912 |
$1,118,657 |
$1,075,247 |
8/31/19 |
$1,138,521 |
$1,147,643 |
$1,086,178 |
9/30/19 |
$1,136,642 |
$1,141,531 |
$1,083,065 |
10/31/19 |
$1,149,319 |
$1,144,969 |
$1,096,403 |
11/30/19 |
$1,139,459 |
$1,144,386 |
$1,085,613 |
12/31/19 |
$1,163,917 |
$1,143,588 |
$1,104,999 |
1/31/20 |
$1,159,638 |
$1,165,596 |
$1,101,851 |
2/29/20 |
$1,136,816 |
$1,186,575 |
$1,083,384 |
3/31/20 |
$1,035,544 |
$1,179,592 |
$1,016,415 |
4/30/20 |
$1,079,762 |
$1,200,561 |
$1,041,922 |
5/31/20 |
$1,106,863 |
$1,206,151 |
$1,056,816 |
6/30/20 |
$1,134,240 |
$1,213,749 |
$1,073,124 |
7/31/20 |
$1,182,871 |
$1,231,878 |
$1,112,145 |
8/31/20 |
$1,208,617 |
$1,221,935 |
$1,134,079 |
9/30/20 |
$1,188,592 |
$1,221,265 |
$1,114,621 |
10/31/20 |
$1,182,871 |
$1,215,812 |
$1,111,402 |
11/30/20 |
$1,228,641 |
$1,227,742 |
$1,137,900 |
12/31/20 |
$1,272,862 |
$1,229,433 |
$1,169,632 |
1/31/21 |
$1,284,368 |
$1,220,618 |
$1,173,241 |
2/28/21 |
$1,291,560 |
$1,202,992 |
$1,177,451 |
3/31/21 |
$1,291,560 |
$1,187,971 |
$1,173,241 |
4/30/21 |
$1,343,337 |
$1,197,356 |
$1,216,260 |
5/31/21 |
$1,374,979 |
$1,201,268 |
$1,242,863 |
6/30/21 |
$1,376,448 |
$1,209,708 |
$1,242,721 |
7/31/21 |
$1,406,081 |
$1,223,233 |
$1,270,775 |
8/31/21 |
$1,412,008 |
$1,220,905 |
$1,272,721 |
9/30/21 |
$1,400,981 |
$1,210,334 |
$1,266,566 |
10/31/21 |
$1,425,614 |
$1,210,000 |
$1,292,497 |
11/30/21 |
$1,399,441 |
$1,213,580 |
$1,272,261 |
12/31/21 |
$1,448,875 |
$1,210,475 |
$1,300,916 |
1/31/22 |
$1,432,847 |
$1,184,396 |
$1,301,306 |
2/28/22 |
$1,452,080 |
$1,171,183 |
$1,321,895 |
3/31/22 |
$1,493,581 |
$1,138,645 |
$1,338,416 |
4/30/22 |
$1,478,922 |
$1,095,436 |
$1,322,107 |
5/31/22 |
$1,469,149 |
$1,102,499 |
$1,308,169 |
6/30/22 |
$1,393,216 |
$1,085,203 |
$1,243,535 |
7/31/22 |
$1,448,211 |
$1,111,719 |
$1,285,174 |
8/31/22 |
$1,409,881 |
$1,080,306 |
$1,258,040 |
9/30/22 |
$1,302,562 |
$1,033,630 |
$1,175,364 |
10/31/22 |
$1,336,975 |
$1,020,242 |
$1,191,036 |
11/30/22 |
$1,378,272 |
$1,057,762 |
$1,230,445 |
12/31/22 |
$1,374,639 |
$1,052,991 |
$1,221,177 |
1/31/23 |
$1,407,456 |
$1,085,385 |
$1,256,235 |
2/28/23 |
$1,369,170 |
$1,057,322 |
$1,220,434 |
3/31/23 |
$1,394,694 |
$1,084,180 |
$1,245,658 |
4/30/23 |
$1,400,163 |
$1,090,751 |
$1,247,356 |
5/31/23 |
$1,365,524 |
$1,078,874 |
$1,219,939 |
6/30/23 |
$1,383,755 |
$1,075,027 |
$1,233,665 |
7/31/23 |
$1,429,333 |
$1,074,277 |
$1,259,985 |
8/31/23 |
$1,416,571 |
$1,067,415 |
$1,244,101 |
9/30/23 |
$1,387,401 |
$1,040,290 |
$1,215,057 |
10/31/23 |
$1,385,578 |
$1,023,873 |
$1,215,304 |
11/30/23 |
$1,432,979 |
$1,070,241 |
$1,247,144 |
12/31/23 |
$1,464,011 |
$1,111,209 |
$1,272,650 |
1/31/24 |
$1,471,313 |
$1,108,157 |
$1,265,893 |
2/29/24 |
$1,465,836 |
$1,092,501 |
$1,258,818 |
3/31/24 |
$1,497,815 |
$1,102,589 |
$1,284,643 |
4/30/24 |
$1,475,896 |
$1,074,739 |
$1,275,516 |
5/31/24 |
$1,505,121 |
$1,092,959 |
$1,300,174 |
6/30/24 |
$1,507,654 |
$1,103,307 |
$1,302,827 |
7/31/24 |
$1,529,825 |
$1,129,077 |
$1,317,508 |
8/31/24 |
$1,550,149 |
$1,145,301 |
$1,338,699 |
9/30/24 |
$1,590,415 |
$1,160,636 |
$1,375,809 |
10/31/24 |
$1,560,513 |
$1,131,854 |
$1,355,397 |
11/30/24 |
$1,569,858 |
$1,143,821 |
$1,359,855 |
12/31/24 |
$1,544,321 |
$1,125,101 |
$1,338,805 |
1/31/25 |
$1,580,324 |
$1,131,070 |
$1,370,821 |
2/28/25 |
$1,610,642 |
$1,155,956 |
$1,393,498 |
3/31/25 |
$1,642,383 |
$1,156,391 |
$1,419,606 |
|
| Average Annual Return [Table Text Block] |
Class/Index Name |
1 Year |
5 Years |
10 Years |
Institutional Class |
9.65% |
9.66% |
5.09% |
Bloomberg U.S. Aggregate Index |
4.88% |
(0.40%) |
1.46% |
Supplemental IndexFootnote Reference1 |
10.51% |
6.91% |
3.57% | |
| No Deduction of Taxes [Text Block] |
Returns shown do not reflect the deduction of taxes that a shareholder would pay on Fund distributions or the redemption of Fund shares.
|
| Performance Table Market Index Changed [Text Block] |
Differences in the Fund’s performance versus an index and related attribution information with respect to particular categories of securities or individual positions may be attributable, in part, to differences in the pricing methodologies used by the Fund and the index.
|
| Updated Performance Information Location [Text Block] |
For performance current to the most recent month-end, visit www.pimco.com/literature or via 888.87.PIMCO (888.877.4626).
|
| AssetsNet |
$ 1,819,828,000
|
| Holdings Count | Holding |
1,155
|
| Advisory Fees Paid, Amount |
$ 6,726,000
|
| InvestmentCompanyPortfolioTurnover |
322.00%
|
| Additional Fund Statistics [Text Block] |
Key Fund StatisticsFootnote Reference† (as of the end of the reporting period)
Total Net Assets |
$1,819,828 |
# of Portfolio Holdings |
1,155 |
Portfolio Turnover Rate |
322% |
Total Net Advisory Fees Paid During the Reporting Period |
$6,726 |
| Footnote |
Description |
Footnote† |
Dollar amounts displayed in 000's | |
| Holdings [Text Block] |
Security Type Breakdown (% of Net Asset Value)Footnote Reference*
U.S. Treasury Obligations |
60.8% |
U.S. Government Agencies |
27.7% |
Commodities |
23.2% |
Sovereign Issues |
10.4% |
Asset-Backed Securities |
7.7% |
Real Estate Investment Trusts |
4.7% |
Corporate Bonds & Notes |
1.5% |
Non-Agency Mortgage-Backed Securities |
0.7% |
Common Stocks |
0.2% |
Other Investments |
0.0%Footnote Reference^ |
Short-Term Instruments |
2.9% |
Affiliated Investments |
9.9% |
Financial Derivative Instruments |
(0.5%) |
Other Assets and Liabilities, Net |
(49.2%) |
Total |
100.0% |
| Footnote |
Description |
Footnote^ |
Rounded value of investments is less than 0.1% of net assets. |
Footnote* |
% of Net Asset Value includes derivatives instruments, if any, valued at the value used for determining the Fund's net asset value. The notional exposure of such derivatives investments therefore may be greater than what is depicted. | |
| Material Fund Change [Text Block] |
|
| C000103233 |
|
| Shareholder Report [Line Items] |
|
| Fund Name |
PIMCO Inflation Response Multi-Asset Fund
|
| Class Name |
I-2
|
| Trading Symbol |
PPRMX
|
| Annual or Semi-Annual Statement [Text Block] |
This annual shareholder report contains important information about the PIMCO Inflation Response Multi-Asset Fund (the "Fund") for the period of April 1, 2024 to March 31, 2025 (the "reporting period").
|
| Shareholder Report Annual or Semi-Annual |
Annual Shareholder Report
|
| Additional Information [Text Block] |
You can find additional information about the Fund at www.pimco.com/literature. You can also request this information by contacting us at 888.87.PIMCO (888.877.4626).
|
| Additional Information Phone Number |
888.87.PIMCO (888.877.4626)
|
| Expenses [Text Block] |
What were the Fund costs for the reporting period?(based on a hypothetical $10,000 investment)
Class Name |
Cost of a $10,000 investment |
Costs paid as a percentage of a $10,000 investment |
I-2 |
$203 |
1.94% | |
| Expenses Paid, Amount |
$ 203
|
| Expense Ratio, Percent |
1.94%
|
| Factors Affecting Performance [Text Block] |
How did the Fund perform during the reporting period and what affected its performance?The following affected performance (on a gross basis) during the reporting period: Eurozone interest rate strategies, including short exposure to duration and exposure to swap spreads, contributed to relative performance versus the Supplemental Index ("Index"), as eurozone rates rose, while swaps spreads tightened. U.S. yield curve positioning, specifically overweight exposure to intermediate maturities relative to underweight exposure to long-term maturities, contributed to relative performance versus the Index, as the U.S. yield curve steepened. Overweight exposure to intermediate U.S. breakeven inflation contributed to relative performance versus the Index, as intermediate U.S. breakeven inflation rose. Exposure to California Carbon Allowances ("CCAs") detracted from relative performance, as CCAs posted negative returns. Positioning within the energy sector, including underweight exposure to natural gas, detracted from relative performance versus the Index, as natural gas posted positive returns. Active real estate investment trust ("REIT") strategies, including underweight exposure to healthcare REITs, detracted from relative performance versus the Index, as healthcare REITs posted positive returns.
|
| Performance Past Does Not Indicate Future [Text] |
Performance quoted represents past performance. Past performance is not a guarantee or a reliable indicator of future results.
|
| Line Graph [Table Text Block] |

|
I-2 |
Bloomberg U.S. Aggregate Index |
Supplemental IndexFootnote Reference1 |
3/31/15 |
$1,000,000 |
$1,000,000 |
$1,000,000 |
4/30/15 |
$1,018,203 |
$996,412 |
$1,013,620 |
5/31/15 |
$1,002,275 |
$994,012 |
$1,002,830 |
6/30/15 |
$988,170 |
$983,174 |
$995,224 |
7/31/15 |
$966,363 |
$990,008 |
$970,496 |
8/31/15 |
$948,000 |
$988,586 |
$958,149 |
9/30/15 |
$926,318 |
$995,273 |
$949,942 |
10/31/15 |
$948,345 |
$995,439 |
$961,333 |
11/30/15 |
$926,318 |
$992,809 |
$937,984 |
12/31/15 |
$915,461 |
$989,601 |
$928,892 |
1/31/16 |
$909,608 |
$1,003,219 |
$931,617 |
2/29/16 |
$914,291 |
$1,010,335 |
$943,114 |
3/31/16 |
$962,288 |
$1,019,605 |
$976,404 |
4/30/16 |
$988,043 |
$1,023,519 |
$997,347 |
5/31/16 |
$976,336 |
$1,023,781 |
$985,496 |
6/30/16 |
$1,009,115 |
$1,042,177 |
$1,021,332 |
7/31/16 |
$1,017,309 |
$1,048,765 |
$1,022,217 |
8/31/16 |
$1,011,456 |
$1,047,566 |
$1,009,976 |
9/30/16 |
$1,025,504 |
$1,046,952 |
$1,018,573 |
10/31/16 |
$1,021,992 |
$1,038,944 |
$1,005,448 |
11/30/16 |
$1,000,920 |
$1,014,369 |
$985,036 |
12/31/16 |
$1,011,314 |
$1,015,800 |
$991,687 |
1/31/17 |
$1,031,305 |
$1,017,793 |
$1,002,512 |
2/28/17 |
$1,041,889 |
$1,024,634 |
$1,014,611 |
3/31/17 |
$1,034,216 |
$1,024,097 |
$1,008,101 |
4/30/17 |
$1,038,954 |
$1,032,000 |
$1,009,446 |
5/31/17 |
$1,037,770 |
$1,039,943 |
$1,008,738 |
6/30/17 |
$1,034,783 |
$1,038,896 |
$1,004,033 |
7/31/17 |
$1,051,570 |
$1,043,367 |
$1,015,955 |
8/31/17 |
$1,068,357 |
$1,052,726 |
$1,026,356 |
9/30/17 |
$1,064,807 |
$1,047,712 |
$1,019,564 |
10/31/17 |
$1,072,092 |
$1,048,319 |
$1,021,934 |
11/30/17 |
$1,080,591 |
$1,046,973 |
$1,027,488 |
12/31/17 |
$1,096,048 |
$1,051,778 |
$1,042,028 |
1/31/18 |
$1,101,059 |
$1,039,665 |
$1,044,964 |
2/28/18 |
$1,079,764 |
$1,029,809 |
$1,025,790 |
3/31/18 |
$1,096,048 |
$1,036,414 |
$1,034,811 |
4/30/18 |
$1,099,806 |
$1,028,705 |
$1,038,066 |
5/31/18 |
$1,099,806 |
$1,036,047 |
$1,041,957 |
6/30/18 |
$1,094,027 |
$1,034,773 |
$1,034,564 |
7/31/18 |
$1,090,198 |
$1,035,019 |
$1,027,347 |
8/31/18 |
$1,082,538 |
$1,041,679 |
$1,023,385 |
9/30/18 |
$1,084,529 |
$1,034,971 |
$1,020,625 |
10/31/18 |
$1,067,644 |
$1,026,792 |
$1,007,111 |
11/30/18 |
$1,065,047 |
$1,032,921 |
$1,016,168 |
12/31/18 |
$1,054,914 |
$1,051,898 |
$1,001,769 |
1/31/19 |
$1,095,327 |
$1,063,068 |
$1,037,394 |
2/28/19 |
$1,103,688 |
$1,062,452 |
$1,039,163 |
3/31/19 |
$1,112,050 |
$1,082,853 |
$1,047,512 |
4/30/19 |
$1,114,837 |
$1,083,130 |
$1,047,334 |
5/31/19 |
$1,106,476 |
$1,102,358 |
$1,048,467 |
6/30/19 |
$1,125,375 |
$1,116,201 |
$1,072,134 |
7/31/19 |
$1,129,569 |
$1,118,657 |
$1,075,247 |
8/31/19 |
$1,135,161 |
$1,147,643 |
$1,086,178 |
9/30/19 |
$1,134,414 |
$1,141,531 |
$1,083,065 |
10/31/19 |
$1,145,646 |
$1,144,969 |
$1,096,403 |
11/30/19 |
$1,135,818 |
$1,144,386 |
$1,085,613 |
12/31/19 |
$1,159,843 |
$1,143,588 |
$1,104,999 |
1/31/20 |
$1,155,579 |
$1,165,596 |
$1,101,851 |
2/29/20 |
$1,132,837 |
$1,186,575 |
$1,083,384 |
3/31/20 |
$1,031,919 |
$1,179,592 |
$1,016,415 |
4/30/20 |
$1,074,561 |
$1,200,561 |
$1,041,922 |
5/31/20 |
$1,102,988 |
$1,206,151 |
$1,056,816 |
6/30/20 |
$1,128,738 |
$1,213,749 |
$1,073,124 |
7/31/20 |
$1,178,619 |
$1,231,878 |
$1,112,145 |
8/31/20 |
$1,202,847 |
$1,221,935 |
$1,134,079 |
9/30/20 |
$1,182,895 |
$1,221,265 |
$1,114,621 |
10/31/20 |
$1,177,194 |
$1,215,812 |
$1,111,402 |
11/30/20 |
$1,222,800 |
$1,227,742 |
$1,137,900 |
12/31/20 |
$1,267,929 |
$1,229,433 |
$1,169,632 |
1/31/21 |
$1,277,958 |
$1,220,618 |
$1,173,241 |
2/28/21 |
$1,286,554 |
$1,202,992 |
$1,177,451 |
3/31/21 |
$1,285,121 |
$1,187,971 |
$1,173,241 |
4/30/21 |
$1,338,131 |
$1,197,356 |
$1,216,260 |
5/31/21 |
$1,368,217 |
$1,201,268 |
$1,242,863 |
6/30/21 |
$1,369,505 |
$1,209,708 |
$1,242,721 |
7/31/21 |
$1,399,021 |
$1,223,233 |
$1,270,775 |
8/31/21 |
$1,404,924 |
$1,220,905 |
$1,272,721 |
9/30/21 |
$1,393,851 |
$1,210,334 |
$1,266,566 |
10/31/21 |
$1,418,385 |
$1,210,000 |
$1,292,497 |
11/30/21 |
$1,392,317 |
$1,213,580 |
$1,272,261 |
12/31/21 |
$1,441,532 |
$1,210,475 |
$1,300,916 |
1/31/22 |
$1,425,568 |
$1,184,396 |
$1,301,306 |
2/28/22 |
$1,444,724 |
$1,171,183 |
$1,321,895 |
3/31/22 |
$1,485,925 |
$1,138,645 |
$1,338,416 |
4/30/22 |
$1,471,325 |
$1,095,436 |
$1,322,107 |
5/31/22 |
$1,461,592 |
$1,102,499 |
$1,308,169 |
6/30/22 |
$1,385,912 |
$1,085,203 |
$1,243,535 |
7/31/22 |
$1,440,684 |
$1,111,719 |
$1,285,174 |
8/31/22 |
$1,400,850 |
$1,080,306 |
$1,258,040 |
9/30/22 |
$1,295,258 |
$1,033,630 |
$1,175,364 |
10/31/22 |
$1,327,811 |
$1,020,242 |
$1,191,036 |
11/30/22 |
$1,370,643 |
$1,057,762 |
$1,230,445 |
12/31/22 |
$1,366,108 |
$1,052,991 |
$1,221,177 |
1/31/23 |
$1,398,764 |
$1,085,385 |
$1,256,235 |
2/28/23 |
$1,360,665 |
$1,057,322 |
$1,220,434 |
3/31/23 |
$1,384,250 |
$1,084,180 |
$1,245,658 |
4/30/23 |
$1,391,507 |
$1,090,751 |
$1,247,356 |
5/31/23 |
$1,357,037 |
$1,078,874 |
$1,219,939 |
6/30/23 |
$1,375,179 |
$1,075,027 |
$1,233,665 |
7/31/23 |
$1,418,720 |
$1,074,277 |
$1,259,985 |
8/31/23 |
$1,407,835 |
$1,067,415 |
$1,244,101 |
9/30/23 |
$1,378,807 |
$1,040,290 |
$1,215,057 |
10/31/23 |
$1,376,993 |
$1,023,873 |
$1,215,304 |
11/30/23 |
$1,422,348 |
$1,070,241 |
$1,247,144 |
12/31/23 |
$1,453,192 |
$1,111,209 |
$1,272,650 |
1/31/24 |
$1,460,449 |
$1,108,157 |
$1,265,893 |
2/29/24 |
$1,455,006 |
$1,092,501 |
$1,258,818 |
3/31/24 |
$1,486,447 |
$1,102,589 |
$1,284,643 |
4/30/24 |
$1,464,667 |
$1,074,739 |
$1,275,516 |
5/31/24 |
$1,493,707 |
$1,092,959 |
$1,300,174 |
6/30/24 |
$1,495,929 |
$1,103,307 |
$1,302,827 |
7/31/24 |
$1,517,955 |
$1,129,077 |
$1,317,508 |
8/31/24 |
$1,538,145 |
$1,145,301 |
$1,338,699 |
9/30/24 |
$1,577,359 |
$1,160,636 |
$1,375,809 |
10/31/24 |
$1,547,668 |
$1,131,854 |
$1,355,397 |
11/30/24 |
$1,556,946 |
$1,143,821 |
$1,359,855 |
12/31/24 |
$1,532,881 |
$1,125,101 |
$1,338,805 |
1/31/25 |
$1,566,736 |
$1,131,070 |
$1,370,821 |
2/28/25 |
$1,598,711 |
$1,155,956 |
$1,393,498 |
3/31/25 |
$1,628,035 |
$1,156,391 |
$1,419,606 |
|
| Average Annual Return [Table Text Block] |
Class/Index Name |
1 Year |
5 Years |
10 Years |
I-2 |
9.53% |
9.55% |
4.99% |
Bloomberg U.S. Aggregate Index |
4.88% |
(0.40%) |
1.46% |
Supplemental IndexFootnote Reference1 |
10.51% |
6.91% |
3.57% | |
| No Deduction of Taxes [Text Block] |
Returns shown do not reflect the deduction of taxes that a shareholder would pay on Fund distributions or the redemption of Fund shares.
|
| Performance Table Market Index Changed [Text Block] |
Differences in the Fund’s performance versus an index and related attribution information with respect to particular categories of securities or individual positions may be attributable, in part, to differences in the pricing methodologies used by the Fund and the index.
|
| Updated Performance Information Location [Text Block] |
For performance current to the most recent month-end, visit www.pimco.com/literature or via 888.87.PIMCO (888.877.4626).
|
| AssetsNet |
$ 1,819,828,000
|
| Holdings Count | Holding |
1,155
|
| Advisory Fees Paid, Amount |
$ 6,726,000
|
| InvestmentCompanyPortfolioTurnover |
322.00%
|
| Additional Fund Statistics [Text Block] |
Key Fund StatisticsFootnote Reference† (as of the end of the reporting period)
Total Net Assets |
$1,819,828 |
# of Portfolio Holdings |
1,155 |
Portfolio Turnover Rate |
322% |
Total Net Advisory Fees Paid During the Reporting Period |
$6,726 |
| Footnote |
Description |
Footnote† |
Dollar amounts displayed in 000's | |
| Holdings [Text Block] |
Security Type Breakdown (% of Net Asset Value)Footnote Reference*
U.S. Treasury Obligations |
60.8% |
U.S. Government Agencies |
27.7% |
Commodities |
23.2% |
Sovereign Issues |
10.4% |
Asset-Backed Securities |
7.7% |
Real Estate Investment Trusts |
4.7% |
Corporate Bonds & Notes |
1.5% |
Non-Agency Mortgage-Backed Securities |
0.7% |
Common Stocks |
0.2% |
Other Investments |
0.0%Footnote Reference^ |
Short-Term Instruments |
2.9% |
Affiliated Investments |
9.9% |
Financial Derivative Instruments |
(0.5%) |
Other Assets and Liabilities, Net |
(49.2%) |
Total |
100.0% |
| Footnote |
Description |
Footnote^ |
Rounded value of investments is less than 0.1% of net assets. |
Footnote* |
% of Net Asset Value includes derivatives instruments, if any, valued at the value used for determining the Fund's net asset value. The notional exposure of such derivatives investments therefore may be greater than what is depicted. | |
| Material Fund Change [Text Block] |
|
| C000026605 |
|
| Shareholder Report [Line Items] |
|
| Fund Name |
PIMCO Long-Term Real Return Fund
|
| Class Name |
Institutional Class
|
| Trading Symbol |
PRAIX
|
| Annual or Semi-Annual Statement [Text Block] |
This annual shareholder report contains important information about the PIMCO Long-Term Real Return Fund (the "Fund") for the period of April 1, 2024 to March 31, 2025 (the "reporting period").
|
| Shareholder Report Annual or Semi-Annual |
Annual Shareholder Report
|
| Additional Information [Text Block] |
You can find additional information about the Fund at www.pimco.com/literature. You can also request this information by contacting us at 888.87.PIMCO (888.877.4626).
|
| Material Fund Change Notice [Text Block] |
This report describes changes to the Fund that occurred during the reporting period.
|
| Additional Information Phone Number |
888.87.PIMCO (888.877.4626)
|
| Expenses [Text Block] |
What were the Fund costs for the reporting period?(based on a hypothetical $10,000 investment)
Class Name |
Cost of a $10,000 investment |
Costs paid as a percentage of a $10,000 investment |
Institutional Class |
$236 |
2.33% | |
| Expenses Paid, Amount |
$ 236
|
| Expense Ratio, Percent |
2.33%
|
| Factors Affecting Performance [Text Block] |
How did the Fund perform during the reporting period and what affected its performance?The following affected performance (on a gross basis) during the reporting period: Eurozone interest rate strategies, including short exposure to duration and exposure to swap spreads, contributed to relative performance versus the Bloomberg U.S. Treasury Inflation Notes: 10+ Year Index ("Index"), as eurozone rates rose, while swaps spreads tightened. Exposure to securitized assets, including U.S. non-agency residential mortgage-backed securities and collateralized loan obligations, contributed to relative performance versus the Index, as spreads broadly tightened across these sectors. U.S. yield curve positioning, specifically overweight exposure to intermediate maturities relative to underweight exposure to long-term maturities, contributed to relative performance versus the Index, as the U.S. yield curve steepened. Overweight exposure to intermediate U.S. breakeven inflation contributed to relative performance versus the Index, as intermediate U.S. breakeven inflation rose. Long exposure to U.K. interest rates detracted from relative performance versus the Index, as U.K. interest rates broadly moved higher. There were no other material detractors for this Fund.
|
| Performance Past Does Not Indicate Future [Text] |
Performance quoted represents past performance. Past performance is not a guarantee or a reliable indicator of future results.
|
| Line Graph [Table Text Block] |
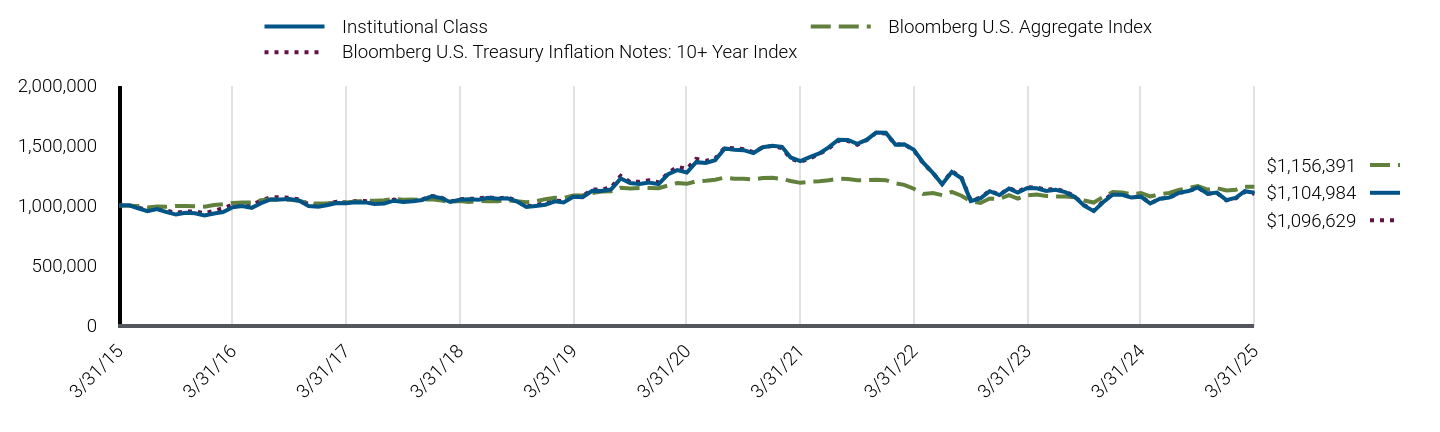
|
Institutional Class |
Bloomberg U.S. Aggregate Index |
Bloomberg U.S. Treasury Inflation Notes: 10+ Year Index |
3/31/15 |
$1,000,000 |
$1,000,000 |
$1,000,000 |
4/30/15 |
$1,001,497 |
$996,412 |
$1,002,961 |
5/31/15 |
$975,993 |
$994,012 |
$983,064 |
6/30/15 |
$951,986 |
$983,174 |
$958,896 |
7/31/15 |
$968,716 |
$990,008 |
$970,457 |
8/31/15 |
$944,468 |
$988,586 |
$955,377 |
9/30/15 |
$923,442 |
$995,273 |
$938,686 |
10/31/15 |
$938,121 |
$995,439 |
$948,489 |
11/30/15 |
$934,858 |
$992,809 |
$948,895 |
12/31/15 |
$916,151 |
$989,601 |
$934,793 |
1/31/16 |
$931,971 |
$1,003,219 |
$955,245 |
2/29/16 |
$944,202 |
$1,010,335 |
$976,618 |
3/31/16 |
$984,016 |
$1,019,605 |
$1,007,581 |
4/30/16 |
$993,933 |
$1,023,519 |
$1,014,213 |
5/31/16 |
$979,894 |
$1,023,781 |
$1,002,077 |
6/30/16 |
$1,018,554 |
$1,042,177 |
$1,039,793 |
7/31/16 |
$1,049,504 |
$1,048,765 |
$1,069,288 |
8/31/16 |
$1,048,539 |
$1,047,566 |
$1,066,656 |
9/30/16 |
$1,053,896 |
$1,046,952 |
$1,064,302 |
10/31/16 |
$1,038,726 |
$1,038,944 |
$1,049,095 |
11/30/16 |
$995,065 |
$1,014,369 |
$1,011,716 |
12/31/16 |
$988,351 |
$1,015,800 |
$1,002,823 |
1/31/17 |
$1,003,117 |
$1,017,793 |
$1,015,086 |
2/28/17 |
$1,018,980 |
$1,024,634 |
$1,029,665 |
3/31/17 |
$1,016,865 |
$1,024,097 |
$1,024,102 |
4/30/17 |
$1,025,754 |
$1,032,000 |
$1,036,389 |
5/31/17 |
$1,024,882 |
$1,039,943 |
$1,036,213 |
6/30/17 |
$1,011,605 |
$1,038,896 |
$1,019,899 |
7/31/17 |
$1,015,451 |
$1,043,367 |
$1,022,099 |
8/31/17 |
$1,039,057 |
$1,052,726 |
$1,048,130 |
9/30/17 |
$1,028,013 |
$1,047,712 |
$1,035,022 |
10/31/17 |
$1,035,252 |
$1,048,319 |
$1,039,398 |
11/30/17 |
$1,045,340 |
$1,046,973 |
$1,050,565 |
12/31/17 |
$1,075,584 |
$1,051,778 |
$1,078,444 |
1/31/18 |
$1,060,680 |
$1,039,665 |
$1,064,749 |
2/28/18 |
$1,028,277 |
$1,029,809 |
$1,030,473 |
3/31/18 |
$1,047,034 |
$1,036,414 |
$1,051,723 |
4/30/18 |
$1,050,124 |
$1,028,705 |
$1,054,617 |
5/31/18 |
$1,046,589 |
$1,036,047 |
$1,057,284 |
6/30/18 |
$1,064,243 |
$1,034,773 |
$1,067,335 |
7/31/18 |
$1,054,882 |
$1,035,019 |
$1,057,712 |
8/31/18 |
$1,059,451 |
$1,041,679 |
$1,067,611 |
9/30/18 |
$1,034,095 |
$1,034,971 |
$1,038,690 |
10/31/18 |
$987,618 |
$1,026,792 |
$991,165 |
11/30/18 |
$995,629 |
$1,032,921 |
$1,003,422 |
12/31/18 |
$1,005,451 |
$1,051,898 |
$1,015,717 |
1/31/19 |
$1,034,301 |
$1,063,068 |
$1,040,565 |
2/28/19 |
$1,024,334 |
$1,062,452 |
$1,034,220 |
3/31/19 |
$1,071,248 |
$1,082,853 |
$1,080,573 |
4/30/19 |
$1,068,522 |
$1,083,130 |
$1,078,601 |
5/31/19 |
$1,122,157 |
$1,102,358 |
$1,131,342 |
6/30/19 |
$1,119,291 |
$1,116,201 |
$1,132,490 |
7/31/19 |
$1,133,751 |
$1,118,657 |
$1,149,611 |
8/31/19 |
$1,224,664 |
$1,147,643 |
$1,246,674 |
9/30/19 |
$1,187,048 |
$1,141,531 |
$1,196,329 |
10/31/19 |
$1,178,309 |
$1,144,969 |
$1,197,884 |
11/30/19 |
$1,191,255 |
$1,144,386 |
$1,208,466 |
12/31/19 |
$1,177,407 |
$1,143,588 |
$1,192,422 |
1/31/20 |
$1,259,972 |
$1,165,596 |
$1,270,902 |
2/29/20 |
$1,293,865 |
$1,186,575 |
$1,322,599 |
3/31/20 |
$1,274,078 |
$1,179,592 |
$1,303,718 |
4/30/20 |
$1,360,685 |
$1,200,561 |
$1,388,176 |
5/31/20 |
$1,354,011 |
$1,206,151 |
$1,371,538 |
6/30/20 |
$1,377,238 |
$1,213,749 |
$1,390,293 |
7/31/20 |
$1,475,244 |
$1,231,878 |
$1,481,930 |
8/31/20 |
$1,464,478 |
$1,221,935 |
$1,475,507 |
9/30/20 |
$1,460,514 |
$1,221,265 |
$1,468,840 |
10/31/20 |
$1,436,458 |
$1,215,812 |
$1,443,348 |
11/30/20 |
$1,484,722 |
$1,227,742 |
$1,484,248 |
12/31/20 |
$1,497,756 |
$1,229,433 |
$1,494,441 |
1/31/21 |
$1,488,513 |
$1,220,618 |
$1,478,208 |
2/28/21 |
$1,399,526 |
$1,202,992 |
$1,390,029 |
3/31/21 |
$1,369,817 |
$1,187,971 |
$1,363,027 |
4/30/21 |
$1,401,861 |
$1,197,356 |
$1,390,948 |
5/31/21 |
$1,433,444 |
$1,201,268 |
$1,427,473 |
6/30/21 |
$1,483,600 |
$1,209,708 |
$1,473,662 |
7/31/21 |
$1,547,637 |
$1,223,233 |
$1,539,450 |
8/31/21 |
$1,545,504 |
$1,220,905 |
$1,537,493 |
9/30/21 |
$1,513,447 |
$1,210,334 |
$1,505,719 |
10/31/21 |
$1,547,710 |
$1,210,000 |
$1,545,506 |
11/30/21 |
$1,607,477 |
$1,213,580 |
$1,606,373 |
12/31/21 |
$1,606,495 |
$1,210,475 |
$1,599,393 |
1/31/22 |
$1,506,214 |
$1,184,396 |
$1,506,507 |
2/28/22 |
$1,508,746 |
$1,171,183 |
$1,511,103 |
3/31/22 |
$1,463,492 |
$1,138,645 |
$1,457,676 |
4/30/22 |
$1,356,127 |
$1,095,436 |
$1,350,992 |
5/31/22 |
$1,270,517 |
$1,102,499 |
$1,270,527 |
6/30/22 |
$1,175,645 |
$1,085,203 |
$1,180,538 |
7/31/22 |
$1,279,295 |
$1,111,719 |
$1,285,379 |
8/31/22 |
$1,226,633 |
$1,080,306 |
$1,231,576 |
9/30/22 |
$1,036,090 |
$1,033,630 |
$1,041,486 |
10/31/22 |
$1,057,819 |
$1,020,242 |
$1,064,093 |
11/30/22 |
$1,118,162 |
$1,057,762 |
$1,123,631 |
12/31/22 |
$1,086,088 |
$1,052,991 |
$1,088,536 |
1/31/23 |
$1,139,577 |
$1,085,385 |
$1,142,921 |
2/28/23 |
$1,107,597 |
$1,057,322 |
$1,114,546 |
3/31/23 |
$1,145,822 |
$1,084,180 |
$1,152,540 |
4/30/23 |
$1,142,662 |
$1,090,751 |
$1,148,125 |
5/31/23 |
$1,120,414 |
$1,078,874 |
$1,130,244 |
6/30/23 |
$1,129,499 |
$1,075,027 |
$1,136,383 |
7/31/23 |
$1,110,575 |
$1,074,277 |
$1,115,191 |
8/31/23 |
$1,070,090 |
$1,067,415 |
$1,075,144 |
9/30/23 |
$997,119 |
$1,040,290 |
$1,001,920 |
10/31/23 |
$951,997 |
$1,023,873 |
$955,870 |
11/30/23 |
$1,026,661 |
$1,070,241 |
$1,032,909 |
12/31/23 |
$1,088,990 |
$1,111,209 |
$1,101,149 |
1/31/24 |
$1,088,217 |
$1,108,157 |
$1,090,034 |
2/29/24 |
$1,065,038 |
$1,092,501 |
$1,066,913 |
3/31/24 |
$1,072,922 |
$1,102,589 |
$1,077,145 |
4/30/24 |
$1,015,699 |
$1,074,739 |
$1,016,960 |
5/31/24 |
$1,054,852 |
$1,092,959 |
$1,055,033 |
6/30/24 |
$1,064,443 |
$1,103,307 |
$1,064,706 |
7/31/24 |
$1,104,401 |
$1,129,077 |
$1,103,148 |
8/31/24 |
$1,119,549 |
$1,145,301 |
$1,117,882 |
9/30/24 |
$1,149,619 |
$1,160,636 |
$1,148,312 |
10/31/24 |
$1,097,332 |
$1,131,854 |
$1,096,921 |
11/30/24 |
$1,106,688 |
$1,143,821 |
$1,104,375 |
12/31/24 |
$1,043,937 |
$1,125,101 |
$1,041,911 |
1/31/25 |
$1,065,077 |
$1,131,070 |
$1,061,051 |
2/28/25 |
$1,118,335 |
$1,155,956 |
$1,113,003 |
3/31/25 |
$1,104,984 |
$1,156,391 |
$1,096,629 |
|
| Average Annual Return [Table Text Block] |
Class/Index Name |
1 Year |
5 Years |
10 Years |
Institutional Class |
2.99% |
(2.81%) |
1.00% |
Bloomberg U.S. Aggregate Index |
4.88% |
(0.40%) |
1.46% |
Bloomberg U.S. Treasury Inflation Notes: 10+ Year Index |
1.81% |
(3.40%) |
0.93% | |
| No Deduction of Taxes [Text Block] |
Returns shown do not reflect the deduction of taxes that a shareholder would pay on Fund distributions or the redemption of Fund shares.
|
| Performance Table Market Index Changed [Text Block] |
Differences in the Fund’s performance versus an index and related attribution information with respect to particular categories of securities or individual positions may be attributable, in part, to differences in the pricing methodologies used by the Fund and the index.
|
| Updated Performance Information Location [Text Block] |
For performance current to the most recent month-end, visit www.pimco.com/literature or via 888.87.PIMCO (888.877.4626).
|
| AssetsNet |
$ 410,299,000
|
| Holdings Count | Holding |
635
|
| Advisory Fees Paid, Amount |
$ 1,022,000
|
| InvestmentCompanyPortfolioTurnover |
188.00%
|
| Additional Fund Statistics [Text Block] |
Key Fund StatisticsFootnote Reference† (as of the end of the reporting period)
Total Net Assets |
$410,299 |
# of Portfolio Holdings |
635 |
Portfolio Turnover Rate |
188% |
Total Net Advisory Fees Paid During the Reporting Period |
$1,022 |
| Footnote |
Description |
Footnote† |
Dollar amounts displayed in 000's | |
| Holdings [Text Block] |
Security Type Breakdown (% of Net Asset Value)Footnote Reference*
U.S. Treasury Obligations |
106.5% |
U.S. Government Agencies |
16.4% |
Sovereign Issues |
8.7% |
Asset-Backed Securities |
8.0% |
Non-Agency Mortgage-Backed Securities |
2.9% |
Other Investments |
0.1% |
Short-Term Instruments |
0.1% |
Affiliated Investments |
0.0%Footnote Reference^ |
Financial Derivative Instruments |
(0.4%) |
Other Assets and Liabilities, Net |
(42.3%) |
Total |
100.0% |
| Footnote |
Description |
Footnote^ |
Rounded value of investments is less than 0.1% of net assets. |
Footnote* |
% of Net Asset Value includes derivatives instruments, if any, valued at the value used for determining the Fund's net asset value. The notional exposure of such derivatives investments therefore may be greater than what is depicted. | |
| Material Fund Change [Text Block] |
This is a summary of certain changes and planned changes of the Fund since the beginning of the reporting period. For more information, you may refer to the Fund's next prospectus, which we expect to be available by July 31, 2025 or upon request at 888.87.PIMCO (888.877.4626). Changes to Total Annual Fund Operating Expenses. Annual fund operating expenses increased during the year by 0.05% as a result of higher expenses related to interest. |
| Material Fund Change Expenses [Text Block] |
Changes to Total Annual Fund Operating Expenses. Annual fund operating expenses increased during the year by 0.05% as a result of higher expenses related to interest.
|
| Summary of Change Legend [Text Block] |
This is a summary of certain changes and planned changes of the Fund since the beginning of the reporting period. For more information, you may refer to the Fund's next prospectus, which we expect to be available by July 31, 2025 or upon request at 888.87.PIMCO (888.877.4626).
|
| C000096286 |
|
| Shareholder Report [Line Items] |
|
| Fund Name |
PIMCO Long-Term Real Return Fund
|
| Class Name |
I-2
|
| Trading Symbol |
PRTPX
|
| Annual or Semi-Annual Statement [Text Block] |
This annual shareholder report contains important information about the PIMCO Long-Term Real Return Fund (the "Fund") for the period of April 1, 2024 to March 31, 2025 (the "reporting period").
|
| Shareholder Report Annual or Semi-Annual |
Annual Shareholder Report
|
| Additional Information [Text Block] |
You can find additional information about the Fund at www.pimco.com/literature. You can also request this information by contacting us at 888.87.PIMCO (888.877.4626).
|
| Material Fund Change Notice [Text Block] |
This report describes changes to the Fund that occurred during the reporting period.
|
| Additional Information Phone Number |
888.87.PIMCO (888.877.4626)
|
| Expenses [Text Block] |
What were the Fund costs for the reporting period?(based on a hypothetical $10,000 investment)
Class Name |
Cost of a $10,000 investment |
Costs paid as a percentage of a $10,000 investment |
I-2 |
$247 |
2.43% | |
| Expenses Paid, Amount |
$ 247
|
| Expense Ratio, Percent |
2.43%
|
| Factors Affecting Performance [Text Block] |
How did the Fund perform during the reporting period and what affected its performance?The following affected performance (on a gross basis) during the reporting period: Eurozone interest rate strategies, including short exposure to duration and exposure to swap spreads, contributed to relative performance versus the Bloomberg U.S. Treasury Inflation Notes: 10+ Year Index ("Index"), as eurozone rates rose, while swaps spreads tightened. Exposure to securitized assets, including U.S. non-agency residential mortgage-backed securities and collateralized loan obligations, contributed to relative performance versus the Index, as spreads broadly tightened across these sectors. U.S. yield curve positioning, specifically overweight exposure to intermediate maturities relative to underweight exposure to long-term maturities, contributed to relative performance versus the Index, as the U.S. yield curve steepened. Overweight exposure to intermediate U.S. breakeven inflation contributed to relative performance versus the Index, as intermediate U.S. breakeven inflation rose. Long exposure to U.K. interest rates detracted from relative performance versus the Index, as U.K. interest rates broadly moved higher. There were no other material detractors for this Fund.
|
| Performance Past Does Not Indicate Future [Text] |
Performance quoted represents past performance. Past performance is not a guarantee or a reliable indicator of future results.
|
| Line Graph [Table Text Block] |
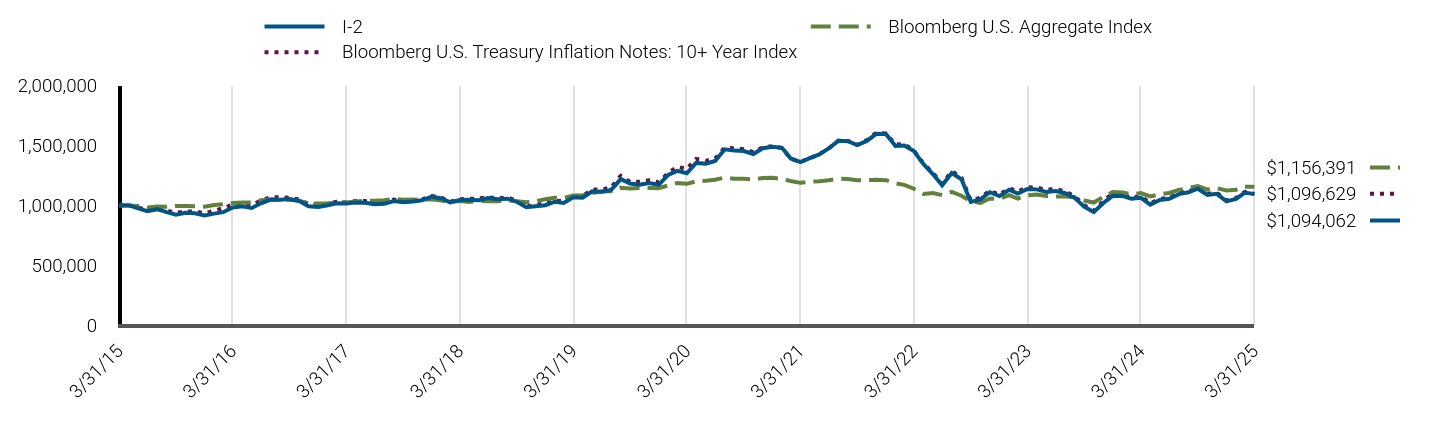
|
I-2 |
Bloomberg U.S. Aggregate Index |
Bloomberg U.S. Treasury Inflation Notes: 10+ Year Index |
3/31/15 |
$1,000,000 |
$1,000,000 |
$1,000,000 |
4/30/15 |
$1,001,416 |
$996,412 |
$1,002,961 |
5/31/15 |
$975,831 |
$994,012 |
$983,064 |
6/30/15 |
$951,749 |
$983,174 |
$958,896 |
7/31/15 |
$968,389 |
$990,008 |
$970,457 |
8/31/15 |
$944,074 |
$988,586 |
$955,377 |
9/30/15 |
$922,981 |
$995,273 |
$938,686 |
10/31/15 |
$937,570 |
$995,439 |
$948,489 |
11/30/15 |
$934,234 |
$992,809 |
$948,895 |
12/31/15 |
$915,455 |
$989,601 |
$934,793 |
1/31/16 |
$931,195 |
$1,003,219 |
$955,245 |
2/29/16 |
$943,344 |
$1,010,335 |
$976,618 |
3/31/16 |
$983,043 |
$1,019,605 |
$1,007,581 |
4/30/16 |
$992,868 |
$1,023,519 |
$1,014,213 |
5/31/16 |
$978,765 |
$1,023,781 |
$1,002,077 |
6/30/16 |
$1,017,302 |
$1,042,177 |
$1,039,793 |
7/31/16 |
$1,048,132 |
$1,048,765 |
$1,069,288 |
8/31/16 |
$1,047,090 |
$1,047,566 |
$1,066,656 |
9/30/16 |
$1,052,350 |
$1,046,952 |
$1,064,302 |
10/31/16 |
$1,037,120 |
$1,038,944 |
$1,049,095 |
11/30/16 |
$993,446 |
$1,014,369 |
$1,011,716 |
12/31/16 |
$986,653 |
$1,015,800 |
$1,002,823 |
1/31/17 |
$1,001,316 |
$1,017,793 |
$1,015,086 |
2/28/17 |
$1,017,075 |
$1,024,634 |
$1,029,665 |
3/31/17 |
$1,014,874 |
$1,024,097 |
$1,024,102 |
4/30/17 |
$1,023,668 |
$1,032,000 |
$1,036,389 |
5/31/17 |
$1,022,712 |
$1,039,943 |
$1,036,213 |
6/30/17 |
$1,009,374 |
$1,038,896 |
$1,019,899 |
7/31/17 |
$1,013,131 |
$1,043,367 |
$1,022,099 |
8/31/17 |
$1,036,597 |
$1,052,726 |
$1,048,130 |
9/30/17 |
$1,025,491 |
$1,047,712 |
$1,035,022 |
10/31/17 |
$1,032,625 |
$1,048,319 |
$1,039,398 |
11/30/17 |
$1,042,601 |
$1,046,973 |
$1,050,565 |
12/31/17 |
$1,072,673 |
$1,051,778 |
$1,078,444 |
1/31/18 |
$1,057,723 |
$1,039,665 |
$1,064,749 |
2/28/18 |
$1,025,331 |
$1,029,809 |
$1,030,473 |
3/31/18 |
$1,043,947 |
$1,036,414 |
$1,051,723 |
4/30/18 |
$1,046,945 |
$1,028,705 |
$1,054,617 |
5/31/18 |
$1,043,333 |
$1,036,047 |
$1,057,284 |
6/30/18 |
$1,060,844 |
$1,034,773 |
$1,067,335 |
7/31/18 |
$1,051,426 |
$1,035,019 |
$1,057,712 |
8/31/18 |
$1,055,883 |
$1,041,679 |
$1,067,611 |
9/30/18 |
$1,030,536 |
$1,034,971 |
$1,038,690 |
10/31/18 |
$984,135 |
$1,026,792 |
$991,165 |
11/30/18 |
$992,031 |
$1,032,921 |
$1,003,422 |
12/31/18 |
$1,001,732 |
$1,051,898 |
$1,015,717 |
1/31/19 |
$1,030,381 |
$1,063,068 |
$1,040,565 |
2/28/19 |
$1,020,368 |
$1,062,452 |
$1,034,220 |
3/31/19 |
$1,067,011 |
$1,082,853 |
$1,080,573 |
4/30/19 |
$1,064,209 |
$1,083,130 |
$1,078,601 |
5/31/19 |
$1,117,531 |
$1,102,358 |
$1,131,342 |
6/30/19 |
$1,114,593 |
$1,116,201 |
$1,132,490 |
7/31/19 |
$1,128,897 |
$1,118,657 |
$1,149,611 |
8/31/19 |
$1,219,317 |
$1,147,643 |
$1,246,674 |
9/30/19 |
$1,181,774 |
$1,141,531 |
$1,196,329 |
10/31/19 |
$1,172,972 |
$1,144,969 |
$1,197,884 |
11/30/19 |
$1,185,758 |
$1,144,386 |
$1,208,466 |
12/31/19 |
$1,171,875 |
$1,143,588 |
$1,192,422 |
1/31/20 |
$1,253,946 |
$1,165,596 |
$1,270,902 |
2/29/20 |
$1,287,582 |
$1,186,575 |
$1,322,599 |
3/31/20 |
$1,267,788 |
$1,179,592 |
$1,303,718 |
4/30/20 |
$1,353,866 |
$1,200,561 |
$1,388,176 |
5/31/20 |
$1,347,118 |
$1,206,151 |
$1,371,538 |
6/30/20 |
$1,370,111 |
$1,213,749 |
$1,390,293 |
7/31/20 |
$1,467,493 |
$1,231,878 |
$1,481,930 |
8/31/20 |
$1,456,673 |
$1,221,935 |
$1,475,507 |
9/30/20 |
$1,452,616 |
$1,221,265 |
$1,468,840 |
10/31/20 |
$1,428,564 |
$1,215,812 |
$1,443,348 |
11/30/20 |
$1,476,449 |
$1,227,742 |
$1,484,248 |
12/31/20 |
$1,489,280 |
$1,229,433 |
$1,494,441 |
1/31/21 |
$1,479,972 |
$1,220,618 |
$1,478,208 |
2/28/21 |
$1,391,386 |
$1,202,992 |
$1,390,029 |
3/31/21 |
$1,361,731 |
$1,187,971 |
$1,363,027 |
4/30/21 |
$1,393,465 |
$1,197,356 |
$1,390,948 |
5/31/21 |
$1,424,749 |
$1,201,268 |
$1,427,473 |
6/30/21 |
$1,474,482 |
$1,209,708 |
$1,473,662 |
7/31/21 |
$1,537,994 |
$1,223,233 |
$1,539,450 |
8/31/21 |
$1,535,743 |
$1,220,905 |
$1,537,493 |
9/30/21 |
$1,503,761 |
$1,210,334 |
$1,505,719 |
10/31/21 |
$1,537,660 |
$1,210,000 |
$1,545,506 |
11/30/21 |
$1,596,911 |
$1,213,580 |
$1,606,373 |
12/31/21 |
$1,595,799 |
$1,210,475 |
$1,599,393 |
1/31/22 |
$1,496,070 |
$1,184,396 |
$1,506,507 |
2/28/22 |
$1,498,473 |
$1,171,183 |
$1,511,103 |
3/31/22 |
$1,453,394 |
$1,138,645 |
$1,457,676 |
4/30/22 |
$1,346,655 |
$1,095,436 |
$1,350,992 |
5/31/22 |
$1,261,547 |
$1,102,499 |
$1,270,527 |
6/30/22 |
$1,167,243 |
$1,085,203 |
$1,180,538 |
7/31/22 |
$1,270,053 |
$1,111,719 |
$1,285,379 |
8/31/22 |
$1,217,667 |
$1,080,306 |
$1,231,576 |
9/30/22 |
$1,028,408 |
$1,033,630 |
$1,041,486 |
10/31/22 |
$1,049,885 |
$1,020,242 |
$1,064,093 |
11/30/22 |
$1,109,686 |
$1,057,762 |
$1,123,631 |
12/31/22 |
$1,077,753 |
$1,052,991 |
$1,088,536 |
1/31/23 |
$1,130,741 |
$1,085,385 |
$1,142,921 |
2/28/23 |
$1,098,924 |
$1,057,322 |
$1,114,546 |
3/31/23 |
$1,136,748 |
$1,084,180 |
$1,152,540 |
4/30/23 |
$1,133,528 |
$1,090,751 |
$1,148,125 |
5/31/23 |
$1,111,365 |
$1,078,874 |
$1,130,244 |
6/30/23 |
$1,120,279 |
$1,075,027 |
$1,136,383 |
7/31/23 |
$1,101,422 |
$1,074,277 |
$1,115,191 |
8/31/23 |
$1,061,182 |
$1,067,415 |
$1,075,144 |
9/30/23 |
$988,732 |
$1,040,290 |
$1,001,920 |
10/31/23 |
$943,916 |
$1,023,873 |
$955,870 |
11/30/23 |
$1,017,864 |
$1,070,241 |
$1,032,909 |
12/31/23 |
$1,079,567 |
$1,111,209 |
$1,101,149 |
1/31/24 |
$1,078,713 |
$1,108,157 |
$1,090,034 |
2/29/24 |
$1,055,653 |
$1,092,501 |
$1,066,913 |
3/31/24 |
$1,063,379 |
$1,102,589 |
$1,077,145 |
4/30/24 |
$1,006,580 |
$1,074,739 |
$1,016,960 |
5/31/24 |
$1,045,288 |
$1,092,959 |
$1,055,033 |
6/30/24 |
$1,054,711 |
$1,103,307 |
$1,064,706 |
7/31/24 |
$1,094,207 |
$1,129,077 |
$1,103,148 |
8/31/24 |
$1,109,114 |
$1,145,301 |
$1,117,882 |
9/30/24 |
$1,138,818 |
$1,160,636 |
$1,148,312 |
10/31/24 |
$1,086,930 |
$1,131,854 |
$1,096,921 |
11/30/24 |
$1,096,107 |
$1,143,821 |
$1,104,375 |
12/31/24 |
$1,033,866 |
$1,125,101 |
$1,041,911 |
1/31/25 |
$1,054,710 |
$1,131,070 |
$1,061,051 |
2/28/25 |
$1,107,367 |
$1,155,956 |
$1,113,003 |
3/31/25 |
$1,094,062 |
$1,156,391 |
$1,096,629 |
|
| Average Annual Return [Table Text Block] |
Class/Index Name |
1 Year |
5 Years |
10 Years |
I-2 |
2.89% |
(2.90%) |
0.90% |
Bloomberg U.S. Aggregate Index |
4.88% |
(0.40%) |
1.46% |
Bloomberg U.S. Treasury Inflation Notes: 10+ Year Index |
1.81% |
(3.40%) |
0.93% | |
| No Deduction of Taxes [Text Block] |
Returns shown do not reflect the deduction of taxes that a shareholder would pay on Fund distributions or the redemption of Fund shares.
|
| Performance Table Market Index Changed [Text Block] |
Differences in the Fund’s performance versus an index and related attribution information with respect to particular categories of securities or individual positions may be attributable, in part, to differences in the pricing methodologies used by the Fund and the index.
|
| Updated Performance Information Location [Text Block] |
For performance current to the most recent month-end, visit www.pimco.com/literature or via 888.87.PIMCO (888.877.4626).
|
| AssetsNet |
$ 410,299,000
|
| Holdings Count | Holding |
635
|
| Advisory Fees Paid, Amount |
$ 1,022,000
|
| InvestmentCompanyPortfolioTurnover |
188.00%
|
| Additional Fund Statistics [Text Block] |
Key Fund StatisticsFootnote Reference† (as of the end of the reporting period)
Total Net Assets |
$410,299 |
# of Portfolio Holdings |
635 |
Portfolio Turnover Rate |
188% |
Total Net Advisory Fees Paid During the Reporting Period |
$1,022 |
| Footnote |
Description |
Footnote† |
Dollar amounts displayed in 000's | |
| Holdings [Text Block] |
Security Type Breakdown (% of Net Asset Value)Footnote Reference*
U.S. Treasury Obligations |
106.5% |
U.S. Government Agencies |
16.4% |
Sovereign Issues |
8.7% |
Asset-Backed Securities |
8.0% |
Non-Agency Mortgage-Backed Securities |
2.9% |
Other Investments |
0.1% |
Short-Term Instruments |
0.1% |
Affiliated Investments |
0.0%Footnote Reference^ |
Financial Derivative Instruments |
(0.4%) |
Other Assets and Liabilities, Net |
(42.3%) |
Total |
100.0% |
| Footnote |
Description |
Footnote^ |
Rounded value of investments is less than 0.1% of net assets. |
Footnote* |
% of Net Asset Value includes derivatives instruments, if any, valued at the value used for determining the Fund's net asset value. The notional exposure of such derivatives investments therefore may be greater than what is depicted. | |
| Material Fund Change [Text Block] |
This is a summary of certain changes and planned changes of the Fund since the beginning of the reporting period. For more information, you may refer to the Fund's next prospectus, which we expect to be available by July 31, 2025 or upon request at 888.87.PIMCO (888.877.4626). Changes to Total Annual Fund Operating Expenses. Annual fund operating expenses increased during the year by 0.05% as a result of higher expenses related to interest. |
| Material Fund Change Expenses [Text Block] |
Changes to Total Annual Fund Operating Expenses. Annual fund operating expenses increased during the year by 0.05% as a result of higher expenses related to interest.
|
| Summary of Change Legend [Text Block] |
This is a summary of certain changes and planned changes of the Fund since the beginning of the reporting period. For more information, you may refer to the Fund's next prospectus, which we expect to be available by July 31, 2025 or upon request at 888.87.PIMCO (888.877.4626).
|
| C000026584 |
|
| Shareholder Report [Line Items] |
|
| Fund Name |
PIMCO Low Duration ESG Fund
|
| Class Name |
Institutional Class
|
| Trading Symbol |
PLDIX
|
| Annual or Semi-Annual Statement [Text Block] |
This annual shareholder report contains important information about the PIMCO Low Duration ESG Fund (the "Fund") for the period of April 1, 2024 to March 31, 2025 (the "reporting period").
|
| Shareholder Report Annual or Semi-Annual |
Annual Shareholder Report
|
| Additional Information [Text Block] |
You can find additional information about the Fund at www.pimco.com/literature. You can also request this information by contacting us at 888.87.PIMCO (888.877.4626).
|
| Material Fund Change Notice [Text Block] |
This report describes changes to the Fund that occurred during the reporting period.
|
| Additional Information Phone Number |
888.87.PIMCO (888.877.4626)
|
| Expenses [Text Block] |
What were the Fund costs for the reporting period?(based on a hypothetical $10,000 investment)
Class Name |
Cost of a $10,000 investment |
Costs paid as a percentage of a $10,000 investment |
Institutional Class |
$54 |
0.52% | |
| Expenses Paid, Amount |
$ 54
|
| Expense Ratio, Percent |
0.52%
|
| Factors Affecting Performance [Text Block] |
How did the Fund perform during the reporting period and what affected its performance?The following affected performance (on a gross basis) during the reporting period: Overweight exposure to U.S. duration, specifically the 2-year part of the curve, contributed to relative performance versus the ICE BofA 1-3 Year U.S. Treasury Index ("Index"), as interest rates fell. Overweight commercial mortgage-backed securities ("MBS") contributed to relative performance versus the Index, as short term commercial MBS had positive return. Overweight exposure to investment grade corporate credit, specifically financials, contributed to relative performance versus the Index, as investment grade corporate bonds had positive returns. Long exposure to U.K. duration, particularly on the 5-year part of the curve, detracted from relative performance versus the Index, as interest rates rose. There were no other material detractors for this Fund.
|
| Performance Past Does Not Indicate Future [Text] |
Performance quoted represents past performance. Past performance is not a guarantee or a reliable indicator of future results.
|
| Line Graph [Table Text Block] |
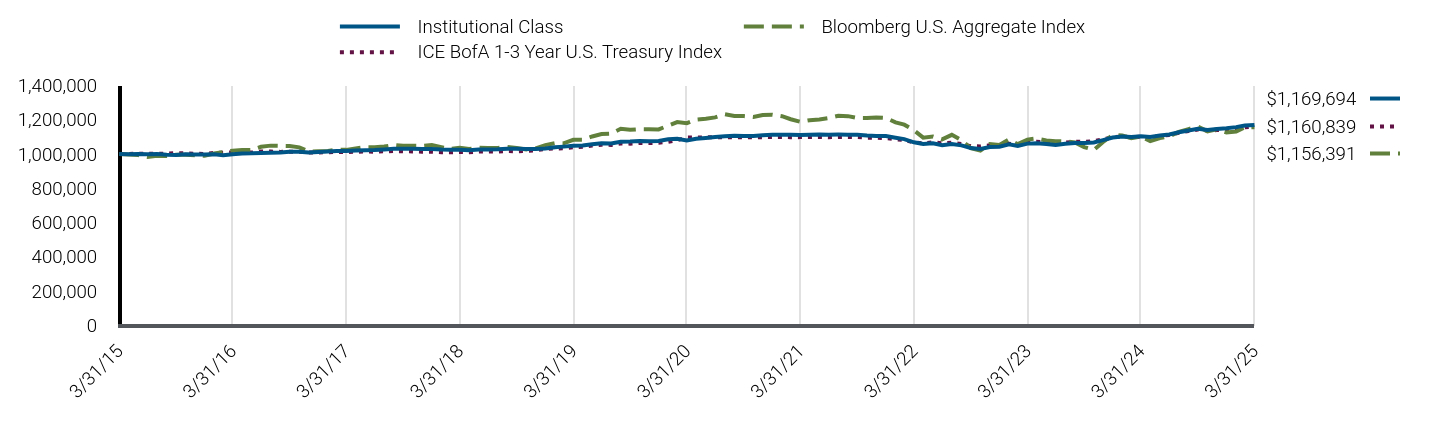
|
Institutional Class |
Bloomberg U.S. Aggregate Index |
ICE BofA 1-3 Year U.S. Treasury Index |
3/31/15 |
$1,000,000 |
$1,000,000 |
$1,000,000 |
4/30/15 |
$999,089 |
$996,412 |
$1,000,460 |
5/31/15 |
$1,000,664 |
$994,012 |
$1,001,200 |
6/30/15 |
$998,459 |
$983,174 |
$1,001,451 |
7/31/15 |
$1,000,041 |
$990,008 |
$1,001,971 |
8/31/15 |
$996,023 |
$988,586 |
$1,001,551 |
9/30/15 |
$993,828 |
$995,273 |
$1,004,585 |
10/31/15 |
$998,604 |
$995,439 |
$1,003,601 |
11/30/15 |
$997,672 |
$992,809 |
$1,001,132 |
12/31/15 |
$997,066 |
$989,601 |
$1,000,191 |
1/31/16 |
$997,756 |
$1,003,219 |
$1,006,282 |
2/29/16 |
$992,128 |
$1,010,335 |
$1,007,439 |
3/31/16 |
$999,032 |
$1,019,605 |
$1,009,192 |
4/30/16 |
$1,002,662 |
$1,023,519 |
$1,009,555 |
5/31/16 |
$1,003,628 |
$1,023,781 |
$1,008,485 |
6/30/16 |
$1,005,812 |
$1,042,177 |
$1,014,526 |
7/31/16 |
$1,006,798 |
$1,048,765 |
$1,013,948 |
8/31/16 |
$1,008,602 |
$1,047,566 |
$1,012,265 |
9/30/16 |
$1,013,375 |
$1,046,952 |
$1,013,439 |
10/31/16 |
$1,012,675 |
$1,038,944 |
$1,012,760 |
11/30/16 |
$1,008,197 |
$1,014,369 |
$1,008,739 |
12/31/16 |
$1,012,149 |
$1,015,800 |
$1,009,042 |
1/31/17 |
$1,014,626 |
$1,017,793 |
$1,010,313 |
2/28/17 |
$1,017,780 |
$1,024,634 |
$1,011,344 |
3/31/17 |
$1,017,923 |
$1,024,097 |
$1,011,667 |
4/30/17 |
$1,019,967 |
$1,032,000 |
$1,013,074 |
5/31/17 |
$1,021,791 |
$1,039,943 |
$1,014,249 |
6/30/17 |
$1,022,618 |
$1,038,896 |
$1,013,437 |
7/31/17 |
$1,026,553 |
$1,043,367 |
$1,015,596 |
8/31/17 |
$1,030,533 |
$1,052,726 |
$1,017,516 |
9/30/17 |
$1,031,303 |
$1,047,712 |
$1,015,847 |
10/31/17 |
$1,031,005 |
$1,048,319 |
$1,015,227 |
11/30/17 |
$1,028,501 |
$1,046,973 |
$1,013,176 |
12/31/17 |
$1,029,237 |
$1,051,778 |
$1,013,298 |
1/31/18 |
$1,025,570 |
$1,039,665 |
$1,010,390 |
2/28/18 |
$1,024,231 |
$1,029,809 |
$1,010,006 |
3/31/18 |
$1,024,102 |
$1,036,414 |
$1,011,985 |
4/30/18 |
$1,022,080 |
$1,028,705 |
$1,010,417 |
5/31/18 |
$1,025,635 |
$1,036,047 |
$1,014,075 |
6/30/18 |
$1,026,024 |
$1,034,773 |
$1,014,227 |
7/31/18 |
$1,027,455 |
$1,035,019 |
$1,014,176 |
8/31/18 |
$1,031,297 |
$1,041,679 |
$1,017,401 |
9/30/18 |
$1,030,498 |
$1,034,971 |
$1,016,201 |
10/31/18 |
$1,028,828 |
$1,026,792 |
$1,017,745 |
11/30/18 |
$1,029,758 |
$1,032,921 |
$1,021,277 |
12/31/18 |
$1,032,413 |
$1,051,898 |
$1,029,345 |
1/31/19 |
$1,039,867 |
$1,063,068 |
$1,032,114 |
2/28/19 |
$1,042,993 |
$1,062,452 |
$1,033,156 |
3/31/19 |
$1,047,462 |
$1,082,853 |
$1,039,469 |
4/30/19 |
$1,049,875 |
$1,083,130 |
$1,041,579 |
5/31/19 |
$1,056,991 |
$1,102,358 |
$1,048,974 |
6/30/19 |
$1,063,017 |
$1,116,201 |
$1,054,418 |
7/31/19 |
$1,060,889 |
$1,118,657 |
$1,053,174 |
8/31/19 |
$1,071,885 |
$1,147,643 |
$1,061,673 |
9/30/19 |
$1,072,728 |
$1,141,531 |
$1,060,495 |
10/31/19 |
$1,075,643 |
$1,144,969 |
$1,063,984 |
11/30/19 |
$1,074,193 |
$1,144,386 |
$1,063,643 |
12/31/19 |
$1,076,272 |
$1,143,588 |
$1,065,898 |
1/31/20 |
$1,085,785 |
$1,165,596 |
$1,071,665 |
2/29/20 |
$1,089,407 |
$1,186,575 |
$1,080,999 |
3/31/20 |
$1,078,848 |
$1,179,592 |
$1,095,830 |
4/30/20 |
$1,089,321 |
$1,200,561 |
$1,096,290 |
5/31/20 |
$1,093,843 |
$1,206,151 |
$1,097,003 |
6/30/20 |
$1,098,744 |
$1,213,749 |
$1,097,288 |
7/31/20 |
$1,103,114 |
$1,231,878 |
$1,098,397 |
8/31/20 |
$1,106,195 |
$1,221,935 |
$1,098,133 |
9/30/20 |
$1,104,776 |
$1,221,265 |
$1,098,429 |
10/31/20 |
$1,105,617 |
$1,215,812 |
$1,097,968 |
11/30/20 |
$1,109,823 |
$1,227,742 |
$1,098,473 |
12/31/20 |
$1,111,764 |
$1,229,433 |
$1,098,978 |
1/31/21 |
$1,112,396 |
$1,220,618 |
$1,099,143 |
2/28/21 |
$1,111,987 |
$1,202,992 |
$1,098,264 |
3/31/21 |
$1,110,391 |
$1,187,971 |
$1,098,473 |
4/30/21 |
$1,112,281 |
$1,197,356 |
$1,098,967 |
5/31/21 |
$1,114,064 |
$1,201,268 |
$1,099,802 |
6/30/21 |
$1,112,488 |
$1,209,708 |
$1,098,097 |
7/31/21 |
$1,113,230 |
$1,223,233 |
$1,099,920 |
8/31/21 |
$1,112,763 |
$1,220,905 |
$1,099,832 |
9/30/21 |
$1,112,373 |
$1,210,334 |
$1,098,732 |
10/31/21 |
$1,107,426 |
$1,210,000 |
$1,095,392 |
11/30/21 |
$1,104,790 |
$1,213,580 |
$1,095,601 |
12/31/21 |
$1,104,543 |
$1,210,475 |
$1,092,883 |
1/31/22 |
$1,094,971 |
$1,184,396 |
$1,085,725 |
2/28/22 |
$1,086,686 |
$1,171,183 |
$1,081,664 |
3/31/22 |
$1,068,042 |
$1,138,645 |
$1,067,267 |
4/30/22 |
$1,058,722 |
$1,095,436 |
$1,062,198 |
5/31/22 |
$1,062,135 |
$1,102,499 |
$1,068,072 |
6/30/22 |
$1,050,611 |
$1,085,203 |
$1,061,898 |
7/31/22 |
$1,057,820 |
$1,111,719 |
$1,065,456 |
8/31/22 |
$1,050,225 |
$1,080,306 |
$1,057,784 |
9/30/22 |
$1,034,679 |
$1,033,630 |
$1,045,324 |
10/31/22 |
$1,029,602 |
$1,020,242 |
$1,044,289 |
11/30/22 |
$1,041,178 |
$1,057,762 |
$1,050,858 |
12/31/22 |
$1,042,959 |
$1,052,991 |
$1,053,012 |
1/31/23 |
$1,056,001 |
$1,085,385 |
$1,060,225 |
2/28/23 |
$1,046,664 |
$1,057,322 |
$1,052,570 |
3/31/23 |
$1,060,522 |
$1,084,180 |
$1,069,359 |
4/30/23 |
$1,062,188 |
$1,090,751 |
$1,072,128 |
5/31/23 |
$1,058,171 |
$1,078,874 |
$1,068,429 |
6/30/23 |
$1,052,812 |
$1,075,027 |
$1,063,247 |
7/31/23 |
$1,059,136 |
$1,074,277 |
$1,067,033 |
8/31/23 |
$1,064,673 |
$1,067,415 |
$1,071,226 |
9/30/23 |
$1,064,100 |
$1,040,290 |
$1,071,130 |
10/31/23 |
$1,067,040 |
$1,023,873 |
$1,074,750 |
11/30/23 |
$1,081,022 |
$1,070,241 |
$1,085,648 |
12/31/23 |
$1,096,049 |
$1,111,209 |
$1,097,818 |
1/31/24 |
$1,102,367 |
$1,108,157 |
$1,102,045 |
2/29/24 |
$1,098,883 |
$1,092,501 |
$1,097,504 |
3/31/24 |
$1,103,101 |
$1,102,589 |
$1,101,071 |
4/30/24 |
$1,098,851 |
$1,074,739 |
$1,097,504 |
5/31/24 |
$1,108,326 |
$1,092,959 |
$1,105,044 |
6/30/24 |
$1,113,824 |
$1,103,307 |
$1,111,420 |
7/31/24 |
$1,127,181 |
$1,129,077 |
$1,124,134 |
8/31/24 |
$1,136,889 |
$1,145,301 |
$1,134,218 |
9/30/24 |
$1,147,560 |
$1,160,636 |
$1,143,337 |
10/31/24 |
$1,139,847 |
$1,131,854 |
$1,136,637 |
11/30/24 |
$1,145,924 |
$1,143,821 |
$1,139,967 |
12/31/24 |
$1,150,649 |
$1,125,101 |
$1,142,658 |
1/31/25 |
$1,156,750 |
$1,131,070 |
$1,147,594 |
2/28/25 |
$1,166,327 |
$1,155,956 |
$1,155,455 |
3/31/25 |
$1,169,694 |
$1,156,391 |
$1,160,839 |
|
| Average Annual Return [Table Text Block] |
Class/Index Name |
1 Year |
5 Years |
10 Years |
Institutional Class |
6.04% |
1.63% |
1.58% |
Bloomberg U.S. Aggregate Index |
4.88% |
(0.40%) |
1.46% |
ICE BofA 1-3 Year U.S. Treasury Index |
5.43% |
1.16% |
1.50% | |
| No Deduction of Taxes [Text Block] |
Returns shown do not reflect the deduction of taxes that a shareholder would pay on Fund distributions or the redemption of Fund shares.
|
| Performance Table Market Index Changed [Text Block] |
Differences in the Fund’s performance versus an index and related attribution information with respect to particular categories of securities or individual positions may be attributable, in part, to differences in the pricing methodologies used by the Fund and the index.
|
| Updated Performance Information Location [Text Block] |
For performance current to the most recent month-end, visit www.pimco.com/literature or via 888.87.PIMCO (888.877.4626).
|
| AssetsNet |
$ 310,858,000
|
| Holdings Count | Holding |
499
|
| Advisory Fees Paid, Amount |
$ 792,000
|
| InvestmentCompanyPortfolioTurnover |
80.00%
|
| Additional Fund Statistics [Text Block] |
Key Fund StatisticsFootnote Reference† (as of the end of the reporting period)
Total Net Assets |
$310,858 |
# of Portfolio Holdings |
499 |
Portfolio Turnover Rate |
80% |
Total Net Advisory Fees Paid During the Reporting Period |
$792 |
| Footnote |
Description |
Footnote† |
Dollar amounts displayed in 000's | |
| Holdings [Text Block] |
Security Type Breakdown (% of Net Asset Value)Footnote Reference*
U.S. Government Agencies |
36.3% |
Corporate Bonds & Notes |
19.0% |
U.S. Treasury Obligations |
14.8% |
Asset-Backed Securities |
11.4% |
Non-Agency Mortgage-Backed Securities |
10.2% |
Municipal Bonds & Notes |
0.7% |
Sovereign Issues |
0.8% |
Short-Term Instruments |
7.5% |
Financial Derivative Instruments |
(0.1%) |
Other Assets and Liabilities, Net |
(0.6%) |
Total |
100.0% |
| Footnote |
Description |
Footnote* |
% of Net Asset Value includes derivatives instruments, if any, valued at the value used for determining the Fund's net asset value. The notional exposure of such derivatives investments therefore may be greater than what is depicted. | |
| Material Fund Change [Text Block] |
This is a summary of certain changes and planned changes of the Fund since the beginning of the reporting period. For more information, you may refer to the Fund's next prospectus, which we expect to be available by July 31, 2025 or upon request at 888.87.PIMCO (888.877.4626). Changes to Total Annual Fund Operating Expenses. Annual fund operating expenses decreased during the year by 0.09% as a result of lower expenses related to interest. |
| Material Fund Change Expenses [Text Block] |
Changes to Total Annual Fund Operating Expenses. Annual fund operating expenses decreased during the year by 0.09% as a result of lower expenses related to interest.
|
| Summary of Change Legend [Text Block] |
This is a summary of certain changes and planned changes of the Fund since the beginning of the reporting period. For more information, you may refer to the Fund's next prospectus, which we expect to be available by July 31, 2025 or upon request at 888.87.PIMCO (888.877.4626).
|
| C000066770 |
|
| Shareholder Report [Line Items] |
|
| Fund Name |
PIMCO Low Duration ESG Fund
|
| Class Name |
I-2
|
| Trading Symbol |
PLUPX
|
| Annual or Semi-Annual Statement [Text Block] |
This annual shareholder report contains important information about the PIMCO Low Duration ESG Fund (the "Fund") for the period of April 1, 2024 to March 31, 2025 (the "reporting period").
|
| Shareholder Report Annual or Semi-Annual |
Annual Shareholder Report
|
| Additional Information [Text Block] |
You can find additional information about the Fund at www.pimco.com/literature. You can also request this information by contacting us at 888.87.PIMCO (888.877.4626).
|
| Material Fund Change Notice [Text Block] |
This report describes changes to the Fund that occurred during the reporting period.
|
| Additional Information Phone Number |
888.87.PIMCO (888.877.4626)
|
| Expenses [Text Block] |
What were the Fund costs for the reporting period?(based on a hypothetical $10,000 investment)
Class Name |
Cost of a $10,000 investment |
Costs paid as a percentage of a $10,000 investment |
I-2 |
$64 |
0.62% | |
| Expenses Paid, Amount |
$ 64
|
| Expense Ratio, Percent |
0.62%
|
| Factors Affecting Performance [Text Block] |
How did the Fund perform during the reporting period and what affected its performance?The following affected performance (on a gross basis) during the reporting period: Overweight exposure to U.S. duration, specifically the 2-year part of the curve, contributed to relative performance versus the ICE BofA 1-3 Year U.S. Treasury Index ("Index"), as interest rates fell. Overweight commercial mortgage-backed securities ("MBS") contributed to relative performance versus the Index, as short term commercial MBS had positive return. Overweight exposure to investment grade corporate credit, specifically financials, contributed to relative performance versus the Index, as investment grade corporate bonds had positive returns. Long exposure to U.K. duration, particularly on the 5-year part of the curve, detracted from relative performance versus the Index, as interest rates rose. There were no other material detractors for this Fund.
|
| Performance Past Does Not Indicate Future [Text] |
Performance quoted represents past performance. Past performance is not a guarantee or a reliable indicator of future results.
|
| Line Graph [Table Text Block] |
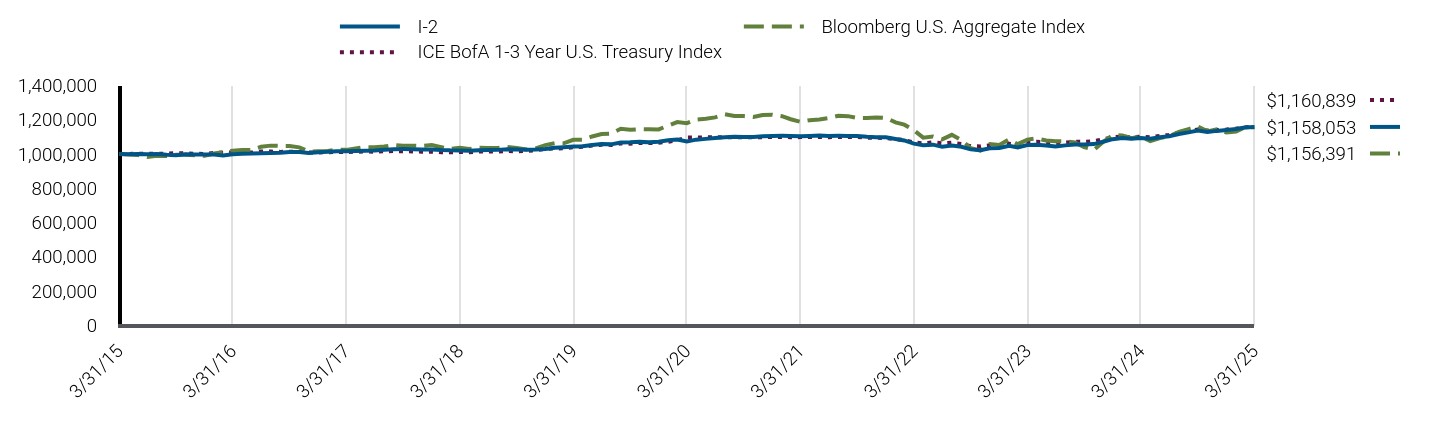
|
I-2 |
Bloomberg U.S. Aggregate Index |
ICE BofA 1-3 Year U.S. Treasury Index |
3/31/15 |
$1,000,000 |
$1,000,000 |
$1,000,000 |
4/30/15 |
$999,006 |
$996,412 |
$1,000,460 |
5/31/15 |
$1,000,499 |
$994,012 |
$1,001,200 |
6/30/15 |
$998,212 |
$983,174 |
$1,001,451 |
7/31/15 |
$999,704 |
$990,008 |
$1,001,971 |
8/31/15 |
$995,609 |
$988,586 |
$1,001,551 |
9/30/15 |
$993,334 |
$995,273 |
$1,004,585 |
10/31/15 |
$998,020 |
$995,439 |
$1,003,601 |
11/30/15 |
$997,009 |
$992,809 |
$1,001,132 |
12/31/15 |
$996,311 |
$989,601 |
$1,000,191 |
1/31/16 |
$996,925 |
$1,003,219 |
$1,006,282 |
2/29/16 |
$991,222 |
$1,010,335 |
$1,007,439 |
3/31/16 |
$998,034 |
$1,019,605 |
$1,009,192 |
4/30/16 |
$1,001,577 |
$1,023,519 |
$1,009,555 |
5/31/16 |
$1,002,459 |
$1,023,781 |
$1,008,485 |
6/30/16 |
$1,004,559 |
$1,042,177 |
$1,014,526 |
7/31/16 |
$1,005,451 |
$1,048,765 |
$1,013,948 |
8/31/16 |
$1,007,167 |
$1,047,566 |
$1,012,265 |
9/30/16 |
$1,011,845 |
$1,046,952 |
$1,013,439 |
10/31/16 |
$1,011,066 |
$1,038,944 |
$1,012,760 |
11/30/16 |
$1,006,515 |
$1,014,369 |
$1,008,739 |
12/31/16 |
$1,010,370 |
$1,015,800 |
$1,009,042 |
1/31/17 |
$1,012,762 |
$1,017,793 |
$1,010,313 |
2/28/17 |
$1,015,832 |
$1,024,634 |
$1,011,344 |
3/31/17 |
$1,015,882 |
$1,024,097 |
$1,011,667 |
4/30/17 |
$1,017,844 |
$1,032,000 |
$1,013,074 |
5/31/17 |
$1,019,576 |
$1,039,943 |
$1,014,249 |
6/30/17 |
$1,020,312 |
$1,038,896 |
$1,013,437 |
7/31/17 |
$1,024,157 |
$1,043,367 |
$1,015,596 |
8/31/17 |
$1,028,040 |
$1,052,726 |
$1,017,516 |
9/30/17 |
$1,028,721 |
$1,047,712 |
$1,015,847 |
10/31/17 |
$1,028,339 |
$1,048,319 |
$1,015,227 |
11/30/17 |
$1,025,757 |
$1,046,973 |
$1,013,176 |
12/31/17 |
$1,026,401 |
$1,051,778 |
$1,013,298 |
1/31/18 |
$1,022,659 |
$1,039,665 |
$1,010,390 |
2/28/18 |
$1,021,244 |
$1,029,809 |
$1,010,006 |
3/31/18 |
$1,021,029 |
$1,036,414 |
$1,011,985 |
4/30/18 |
$1,018,932 |
$1,028,705 |
$1,010,417 |
5/31/18 |
$1,022,390 |
$1,036,047 |
$1,014,075 |
6/30/18 |
$1,022,691 |
$1,034,773 |
$1,014,227 |
7/31/18 |
$1,024,033 |
$1,035,019 |
$1,014,176 |
8/31/18 |
$1,027,767 |
$1,041,679 |
$1,017,401 |
9/30/18 |
$1,026,886 |
$1,034,971 |
$1,016,201 |
10/31/18 |
$1,025,141 |
$1,026,792 |
$1,017,745 |
11/30/18 |
$1,025,979 |
$1,032,921 |
$1,021,277 |
12/31/18 |
$1,028,539 |
$1,051,898 |
$1,029,345 |
1/31/19 |
$1,035,880 |
$1,063,068 |
$1,032,114 |
2/28/19 |
$1,038,915 |
$1,062,452 |
$1,033,156 |
3/31/19 |
$1,043,278 |
$1,082,853 |
$1,039,469 |
4/30/19 |
$1,045,596 |
$1,083,130 |
$1,041,579 |
5/31/19 |
$1,052,591 |
$1,102,358 |
$1,048,974 |
6/30/19 |
$1,058,512 |
$1,116,201 |
$1,054,418 |
7/31/19 |
$1,056,304 |
$1,118,657 |
$1,053,174 |
8/31/19 |
$1,067,157 |
$1,147,643 |
$1,061,673 |
9/30/19 |
$1,067,916 |
$1,141,531 |
$1,060,495 |
10/31/19 |
$1,070,727 |
$1,144,969 |
$1,063,984 |
11/30/19 |
$1,069,193 |
$1,144,386 |
$1,063,643 |
12/31/19 |
$1,071,172 |
$1,143,588 |
$1,065,898 |
1/31/20 |
$1,080,546 |
$1,165,596 |
$1,071,665 |
2/29/20 |
$1,084,069 |
$1,186,575 |
$1,080,999 |
3/31/20 |
$1,073,476 |
$1,179,592 |
$1,095,830 |
4/30/20 |
$1,083,807 |
$1,200,561 |
$1,096,290 |
5/31/20 |
$1,088,214 |
$1,206,151 |
$1,097,003 |
6/30/20 |
$1,092,999 |
$1,213,749 |
$1,097,288 |
7/31/20 |
$1,097,240 |
$1,231,878 |
$1,098,397 |
8/31/20 |
$1,100,217 |
$1,221,935 |
$1,098,133 |
9/30/20 |
$1,098,715 |
$1,221,265 |
$1,098,429 |
10/31/20 |
$1,099,455 |
$1,215,812 |
$1,097,968 |
11/30/20 |
$1,103,549 |
$1,227,742 |
$1,098,473 |
12/31/20 |
$1,105,380 |
$1,229,433 |
$1,098,978 |
1/31/21 |
$1,105,924 |
$1,220,618 |
$1,099,143 |
2/28/21 |
$1,105,433 |
$1,202,992 |
$1,098,264 |
3/31/21 |
$1,103,752 |
$1,187,971 |
$1,098,473 |
4/30/21 |
$1,105,533 |
$1,197,356 |
$1,098,967 |
5/31/21 |
$1,107,218 |
$1,201,268 |
$1,099,802 |
6/30/21 |
$1,105,561 |
$1,209,708 |
$1,098,097 |
7/31/21 |
$1,106,201 |
$1,223,233 |
$1,099,920 |
8/31/21 |
$1,105,646 |
$1,220,905 |
$1,099,832 |
9/30/21 |
$1,105,169 |
$1,210,334 |
$1,098,732 |
10/31/21 |
$1,100,159 |
$1,210,000 |
$1,095,392 |
11/30/21 |
$1,097,450 |
$1,213,580 |
$1,095,601 |
12/31/21 |
$1,097,106 |
$1,210,475 |
$1,092,883 |
1/31/22 |
$1,087,511 |
$1,184,396 |
$1,085,725 |
2/28/22 |
$1,079,200 |
$1,171,183 |
$1,081,664 |
3/31/22 |
$1,060,593 |
$1,138,645 |
$1,067,267 |
4/30/22 |
$1,051,249 |
$1,095,436 |
$1,062,198 |
5/31/22 |
$1,054,550 |
$1,102,499 |
$1,068,072 |
6/30/22 |
$1,043,024 |
$1,085,203 |
$1,061,898 |
7/31/22 |
$1,050,092 |
$1,111,719 |
$1,065,456 |
8/31/22 |
$1,042,463 |
$1,080,306 |
$1,057,784 |
9/30/22 |
$1,026,941 |
$1,033,630 |
$1,045,324 |
10/31/22 |
$1,021,821 |
$1,020,242 |
$1,044,289 |
11/30/22 |
$1,033,226 |
$1,057,762 |
$1,050,858 |
12/31/22 |
$1,034,900 |
$1,052,991 |
$1,053,012 |
1/31/23 |
$1,047,758 |
$1,085,385 |
$1,060,225 |
2/28/23 |
$1,038,413 |
$1,057,322 |
$1,052,570 |
3/31/23 |
$1,052,067 |
$1,084,180 |
$1,069,359 |
4/30/23 |
$1,053,640 |
$1,090,751 |
$1,072,128 |
5/31/23 |
$1,049,565 |
$1,078,874 |
$1,068,429 |
6/30/23 |
$1,044,158 |
$1,075,027 |
$1,063,247 |
7/31/23 |
$1,050,346 |
$1,074,277 |
$1,067,033 |
8/31/23 |
$1,055,749 |
$1,067,415 |
$1,071,226 |
9/30/23 |
$1,055,087 |
$1,040,290 |
$1,071,130 |
10/31/23 |
$1,057,916 |
$1,023,873 |
$1,074,750 |
11/30/23 |
$1,071,691 |
$1,070,241 |
$1,085,648 |
12/31/23 |
$1,086,494 |
$1,111,209 |
$1,097,818 |
1/31/24 |
$1,092,667 |
$1,108,157 |
$1,102,045 |
2/29/24 |
$1,089,127 |
$1,092,501 |
$1,097,504 |
3/31/24 |
$1,093,215 |
$1,102,589 |
$1,101,071 |
4/30/24 |
$1,088,913 |
$1,074,739 |
$1,097,504 |
5/31/24 |
$1,098,203 |
$1,092,959 |
$1,105,044 |
6/30/24 |
$1,103,567 |
$1,103,307 |
$1,111,420 |
7/31/24 |
$1,116,707 |
$1,129,077 |
$1,124,134 |
8/31/24 |
$1,126,223 |
$1,145,301 |
$1,134,218 |
9/30/24 |
$1,136,706 |
$1,160,636 |
$1,143,337 |
10/31/24 |
$1,128,968 |
$1,131,854 |
$1,136,637 |
11/30/24 |
$1,134,891 |
$1,143,821 |
$1,139,967 |
12/31/24 |
$1,139,474 |
$1,125,101 |
$1,142,658 |
1/31/25 |
$1,145,416 |
$1,131,070 |
$1,147,594 |
2/28/25 |
$1,154,811 |
$1,155,956 |
$1,155,455 |
3/31/25 |
$1,158,053 |
$1,156,391 |
$1,160,839 |
|
| Average Annual Return [Table Text Block] |
Class/Index Name |
1 Year |
5 Years |
10 Years |
I-2 |
5.93% |
1.53% |
1.48% |
Bloomberg U.S. Aggregate Index |
4.88% |
(0.40%) |
1.46% |
ICE BofA 1-3 Year U.S. Treasury Index |
5.43% |
1.16% |
1.50% | |
| No Deduction of Taxes [Text Block] |
Returns shown do not reflect the deduction of taxes that a shareholder would pay on Fund distributions or the redemption of Fund shares.
|
| Performance Table Market Index Changed [Text Block] |
Differences in the Fund’s performance versus an index and related attribution information with respect to particular categories of securities or individual positions may be attributable, in part, to differences in the pricing methodologies used by the Fund and the index.
|
| Updated Performance Information Location [Text Block] |
For performance current to the most recent month-end, visit www.pimco.com/literature or via 888.87.PIMCO (888.877.4626).
|
| AssetsNet |
$ 310,858,000
|
| Holdings Count | Holding |
499
|
| Advisory Fees Paid, Amount |
$ 792,000
|
| InvestmentCompanyPortfolioTurnover |
80.00%
|
| Additional Fund Statistics [Text Block] |
Key Fund StatisticsFootnote Reference† (as of the end of the reporting period)
Total Net Assets |
$310,858 |
# of Portfolio Holdings |
499 |
Portfolio Turnover Rate |
80% |
Total Net Advisory Fees Paid During the Reporting Period |
$792 |
| Footnote |
Description |
Footnote† |
Dollar amounts displayed in 000's | |
| Holdings [Text Block] |
Security Type Breakdown (% of Net Asset Value)Footnote Reference*
U.S. Government Agencies |
36.3% |
Corporate Bonds & Notes |
19.0% |
U.S. Treasury Obligations |
14.8% |
Asset-Backed Securities |
11.4% |
Non-Agency Mortgage-Backed Securities |
10.2% |
Municipal Bonds & Notes |
0.7% |
Sovereign Issues |
0.8% |
Short-Term Instruments |
7.5% |
Financial Derivative Instruments |
(0.1%) |
Other Assets and Liabilities, Net |
(0.6%) |
Total |
100.0% |
| Footnote |
Description |
Footnote* |
% of Net Asset Value includes derivatives instruments, if any, valued at the value used for determining the Fund's net asset value. The notional exposure of such derivatives investments therefore may be greater than what is depicted. | |
| Material Fund Change [Text Block] |
This is a summary of certain changes and planned changes of the Fund since the beginning of the reporting period. For more information, you may refer to the Fund's next prospectus, which we expect to be available by July 31, 2025 or upon request at 888.87.PIMCO (888.877.4626). Changes to Total Annual Fund Operating Expenses. Annual fund operating expenses decreased during the year by 0.09% as a result of lower expenses related to interest. |
| Material Fund Change Expenses [Text Block] |
Changes to Total Annual Fund Operating Expenses. Annual fund operating expenses decreased during the year by 0.09% as a result of lower expenses related to interest.
|
| Summary of Change Legend [Text Block] |
This is a summary of certain changes and planned changes of the Fund since the beginning of the reporting period. For more information, you may refer to the Fund's next prospectus, which we expect to be available by July 31, 2025 or upon request at 888.87.PIMCO (888.877.4626).
|
| C000026577 |
|
| Shareholder Report [Line Items] |
|
| Fund Name |
PIMCO Low Duration Fund
|
| Class Name |
Class A
|
| Trading Symbol |
PTLAX
|
| Annual or Semi-Annual Statement [Text Block] |
This annual shareholder report contains important information about the PIMCO Low Duration Fund (the "Fund") for the period of April 1, 2024 to March 31, 2025 (the "reporting period").
|
| Shareholder Report Annual or Semi-Annual |
Annual Shareholder Report
|
| Additional Information [Text Block] |
You can find additional information about the Fund at www.pimco.com/literature. You can also request this information by contacting us at 888.87.PIMCO (888.877.4626).
|
| Additional Information Phone Number |
888.87.PIMCO (888.877.4626)
|
| Expenses [Text Block] |
What were the Fund costs for the reporting period?(based on a hypothetical $10,000 investment)
Class Name |
Cost of a $10,000 investment |
Costs paid as a percentage of a $10,000 investment |
Class A |
$79 |
0.77% | |
| Expenses Paid, Amount |
$ 79
|
| Expense Ratio, Percent |
0.77%
|
| Factors Affecting Performance [Text Block] |
How did the Fund perform during the reporting period and what affected its performance?The following affected performance (on a gross basis) during the reporting period: Overweight exposure to U.S. duration, specifically the 2-year part of the curve, contributed to relative performance versus the ICE BofA 1-3 Year U.S. Treasury Index ("Index"), as interest rates fell. Overweight exposure to agency mortgage-backed securities contributed to relative performance versus the Index, as spreads tightened. Overweight exposure to select securitized credit, particularly collateralized loan obligations, contributed to relative performance versus the Index, as spreads tightened. Long exposure to U.K. duration, particularly on the 5-year part of the curve, detracted from relative performance versus the Index, as interest rates rose. There were no other material detractors for this Fund.
|
| Performance Past Does Not Indicate Future [Text] |
Performance quoted represents past performance. Past performance is not a guarantee or a reliable indicator of future results.
|
| Line Graph [Table Text Block] |
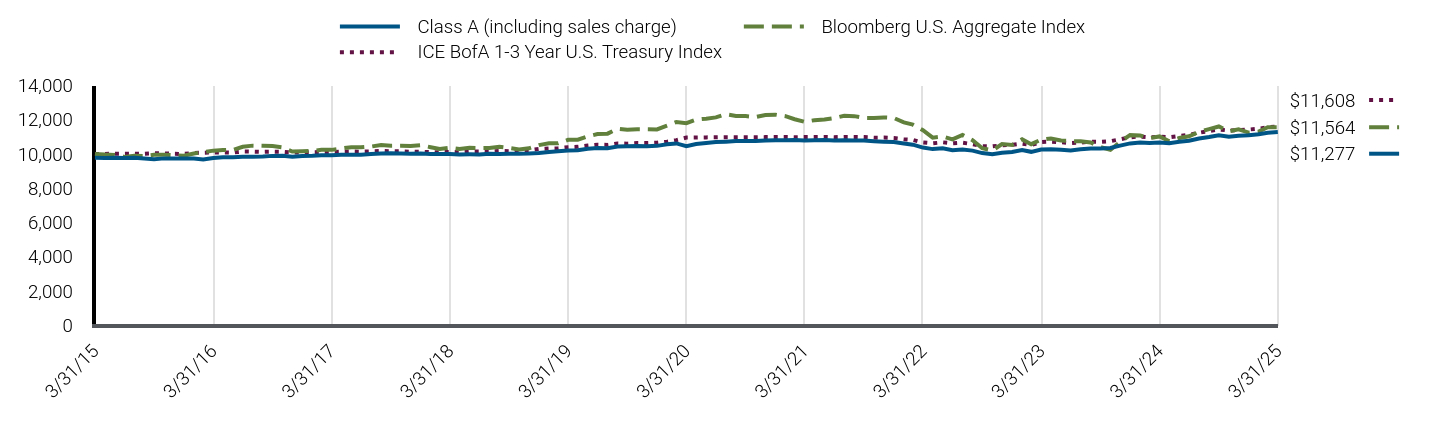
|
Class A (including sales charge) |
Bloomberg U.S. Aggregate Index |
ICE BofA 1-3 Year U.S. Treasury Index |
3/31/15 |
$9,775 |
$10,000 |
$10,000 |
4/30/15 |
$9,769 |
$9,964 |
$10,005 |
5/31/15 |
$9,774 |
$9,940 |
$10,012 |
6/30/15 |
$9,763 |
$9,832 |
$10,015 |
7/31/15 |
$9,778 |
$9,900 |
$10,020 |
8/31/15 |
$9,732 |
$9,886 |
$10,016 |
9/30/15 |
$9,690 |
$9,953 |
$10,046 |
10/31/15 |
$9,744 |
$9,954 |
$10,036 |
11/30/15 |
$9,735 |
$9,928 |
$10,011 |
12/31/15 |
$9,733 |
$9,896 |
$10,002 |
1/31/16 |
$9,740 |
$10,032 |
$10,063 |
2/29/16 |
$9,686 |
$10,103 |
$10,074 |
3/31/16 |
$9,772 |
$10,196 |
$10,092 |
4/30/16 |
$9,805 |
$10,235 |
$10,096 |
5/31/16 |
$9,813 |
$10,238 |
$10,085 |
6/30/16 |
$9,833 |
$10,422 |
$10,145 |
7/31/16 |
$9,841 |
$10,488 |
$10,139 |
8/31/16 |
$9,856 |
$10,476 |
$10,123 |
9/30/16 |
$9,890 |
$10,470 |
$10,134 |
10/31/16 |
$9,893 |
$10,389 |
$10,128 |
11/30/16 |
$9,840 |
$10,144 |
$10,087 |
12/31/16 |
$9,885 |
$10,158 |
$10,090 |
1/31/17 |
$9,897 |
$10,178 |
$10,103 |
2/28/17 |
$9,920 |
$10,246 |
$10,113 |
3/31/17 |
$9,926 |
$10,241 |
$10,117 |
4/30/17 |
$9,949 |
$10,320 |
$10,131 |
5/31/17 |
$9,962 |
$10,399 |
$10,142 |
6/30/17 |
$9,963 |
$10,389 |
$10,134 |
7/31/17 |
$9,993 |
$10,434 |
$10,156 |
8/31/17 |
$10,034 |
$10,527 |
$10,175 |
9/30/17 |
$10,045 |
$10,477 |
$10,158 |
10/31/17 |
$10,034 |
$10,483 |
$10,152 |
11/30/17 |
$10,014 |
$10,470 |
$10,132 |
12/31/17 |
$10,033 |
$10,518 |
$10,133 |
1/31/18 |
$10,001 |
$10,397 |
$10,104 |
2/28/18 |
$10,001 |
$10,298 |
$10,100 |
3/31/18 |
$10,003 |
$10,364 |
$10,120 |
4/30/18 |
$9,975 |
$10,287 |
$10,104 |
5/31/18 |
$9,981 |
$10,360 |
$10,141 |
6/30/18 |
$9,975 |
$10,348 |
$10,142 |
7/31/18 |
$10,011 |
$10,350 |
$10,142 |
8/31/18 |
$9,997 |
$10,417 |
$10,174 |
9/30/18 |
$10,012 |
$10,350 |
$10,162 |
10/31/18 |
$10,017 |
$10,268 |
$10,177 |
11/30/18 |
$10,029 |
$10,329 |
$10,213 |
12/31/18 |
$10,055 |
$10,519 |
$10,293 |
1/31/19 |
$10,121 |
$10,631 |
$10,321 |
2/28/19 |
$10,158 |
$10,625 |
$10,332 |
3/31/19 |
$10,197 |
$10,829 |
$10,395 |
4/30/19 |
$10,225 |
$10,831 |
$10,416 |
5/31/19 |
$10,300 |
$11,024 |
$10,490 |
6/30/19 |
$10,353 |
$11,162 |
$10,544 |
7/31/19 |
$10,340 |
$11,187 |
$10,532 |
8/31/19 |
$10,439 |
$11,476 |
$10,617 |
9/30/19 |
$10,451 |
$11,415 |
$10,605 |
10/31/19 |
$10,471 |
$11,450 |
$10,640 |
11/30/19 |
$10,450 |
$11,444 |
$10,636 |
12/31/19 |
$10,475 |
$11,436 |
$10,659 |
1/31/20 |
$10,567 |
$11,656 |
$10,717 |
2/29/20 |
$10,617 |
$11,866 |
$10,810 |
3/31/20 |
$10,460 |
$11,796 |
$10,958 |
4/30/20 |
$10,585 |
$12,006 |
$10,963 |
5/31/20 |
$10,643 |
$12,062 |
$10,970 |
6/30/20 |
$10,699 |
$12,137 |
$10,973 |
7/31/20 |
$10,721 |
$12,319 |
$10,984 |
8/31/20 |
$10,753 |
$12,219 |
$10,981 |
9/30/20 |
$10,753 |
$12,213 |
$10,984 |
10/31/20 |
$10,752 |
$12,158 |
$10,980 |
11/30/20 |
$10,781 |
$12,277 |
$10,985 |
12/31/20 |
$10,800 |
$12,294 |
$10,990 |
1/31/21 |
$10,806 |
$12,206 |
$10,991 |
2/28/21 |
$10,811 |
$12,030 |
$10,983 |
3/31/21 |
$10,793 |
$11,880 |
$10,985 |
4/30/21 |
$10,798 |
$11,974 |
$10,990 |
5/31/21 |
$10,814 |
$12,013 |
$10,998 |
6/30/21 |
$10,785 |
$12,097 |
$10,981 |
7/31/21 |
$10,800 |
$12,232 |
$10,999 |
8/31/21 |
$10,782 |
$12,209 |
$10,998 |
9/30/21 |
$10,788 |
$12,103 |
$10,987 |
10/31/21 |
$10,738 |
$12,100 |
$10,954 |
11/30/21 |
$10,711 |
$12,136 |
$10,956 |
12/31/21 |
$10,695 |
$12,105 |
$10,929 |
1/31/22 |
$10,613 |
$11,844 |
$10,857 |
2/28/22 |
$10,543 |
$11,712 |
$10,817 |
3/31/22 |
$10,374 |
$11,386 |
$10,673 |
4/30/22 |
$10,285 |
$10,954 |
$10,622 |
5/31/22 |
$10,339 |
$11,025 |
$10,681 |
6/30/22 |
$10,220 |
$10,852 |
$10,619 |
7/31/22 |
$10,256 |
$11,117 |
$10,655 |
8/31/22 |
$10,196 |
$10,803 |
$10,578 |
9/30/22 |
$10,053 |
$10,336 |
$10,453 |
10/31/22 |
$9,986 |
$10,202 |
$10,443 |
11/30/22 |
$10,077 |
$10,578 |
$10,509 |
12/31/22 |
$10,112 |
$10,530 |
$10,530 |
1/31/23 |
$10,230 |
$10,854 |
$10,602 |
2/28/23 |
$10,126 |
$10,573 |
$10,526 |
3/31/23 |
$10,263 |
$10,842 |
$10,694 |
4/30/23 |
$10,283 |
$10,908 |
$10,721 |
5/31/23 |
$10,249 |
$10,789 |
$10,684 |
6/30/23 |
$10,204 |
$10,750 |
$10,632 |
7/31/23 |
$10,279 |
$10,743 |
$10,670 |
8/31/23 |
$10,323 |
$10,674 |
$10,712 |
9/30/23 |
$10,323 |
$10,403 |
$10,711 |
10/31/23 |
$10,354 |
$10,239 |
$10,748 |
11/30/23 |
$10,491 |
$10,702 |
$10,856 |
12/31/23 |
$10,619 |
$11,112 |
$10,978 |
1/31/24 |
$10,673 |
$11,082 |
$11,020 |
2/29/24 |
$10,636 |
$10,925 |
$10,975 |
3/31/24 |
$10,671 |
$11,026 |
$11,011 |
4/30/24 |
$10,624 |
$10,747 |
$10,975 |
5/31/24 |
$10,719 |
$10,930 |
$11,050 |
6/30/24 |
$10,775 |
$11,033 |
$11,114 |
7/31/24 |
$10,906 |
$11,291 |
$11,241 |
8/31/24 |
$10,992 |
$11,453 |
$11,342 |
9/30/24 |
$11,096 |
$11,606 |
$11,433 |
10/31/24 |
$11,013 |
$11,319 |
$11,366 |
11/30/24 |
$11,062 |
$11,438 |
$11,400 |
12/31/24 |
$11,098 |
$11,251 |
$11,427 |
1/31/25 |
$11,158 |
$11,311 |
$11,476 |
2/28/25 |
$11,240 |
$11,560 |
$11,555 |
3/31/25 |
$11,277 |
$11,564 |
$11,608 |
|
| Average Annual Return [Table Text Block] |
Class/Index Name |
1 Year |
5 Years |
10 Years |
Class A (excluding sales charge) |
5.68% |
1.52% |
1.44% |
Class A (including sales charge) |
3.30% |
1.06% |
1.21% |
Bloomberg U.S. Aggregate Index |
4.88% |
(0.40%) |
1.46% |
ICE BofA 1-3 Year U.S. Treasury Index |
5.43% |
1.16% |
1.50% | |
| No Deduction of Taxes [Text Block] |
Returns shown do not reflect the deduction of taxes that a shareholder would pay on Fund distributions or the redemption of Fund shares.
|
| Performance Table Market Index Changed [Text Block] |
Differences in the Fund’s performance versus an index and related attribution information with respect to particular categories of securities or individual positions may be attributable, in part, to differences in the pricing methodologies used by the Fund and the index.
|
| Updated Performance Information Location [Text Block] |
For performance current to the most recent month-end, visit www.pimco.com/literature or via 888.87.PIMCO (888.877.4626).
|
| AssetsNet |
$ 6,633,082,000
|
| Holdings Count | Holding |
1,339
|
| Advisory Fees Paid, Amount |
$ 14,852,000
|
| InvestmentCompanyPortfolioTurnover |
497.00%
|
| Additional Fund Statistics [Text Block] |
Key Fund StatisticsFootnote Reference† (as of the end of the reporting period)
Total Net Assets |
$6,633,082 |
# of Portfolio Holdings |
1,339 |
Portfolio Turnover Rate |
497% |
Total Net Advisory Fees Paid During the Reporting Period |
$14,852 |
| Footnote |
Description |
Footnote† |
Dollar amounts displayed in 000's | |
| Holdings [Text Block] |
Security Type Breakdown (% of Net Asset Value)Footnote Reference*
U.S. Government Agencies |
39.6% |
U.S. Treasury Obligations |
17.5% |
Corporate Bonds & Notes |
12.6% |
Asset-Backed Securities |
7.4% |
Non-Agency Mortgage-Backed Securities |
4.6% |
Sovereign Issues |
2.3% |
Short-Term Instruments |
33.5% |
Affiliated Investments |
13.6% |
Financial Derivative Instruments |
0.0%Footnote Reference^ |
Other Assets and Liabilities, Net |
(31.1%) |
Total |
100.0% |
| Footnote |
Description |
Footnote^ |
Rounded value of investments is less than 0.1% of net assets. |
Footnote* |
% of Net Asset Value includes derivatives instruments, if any, valued at the value used for determining the Fund's net asset value. The notional exposure of such derivatives investments therefore may be greater than what is depicted. | |
| Material Fund Change [Text Block] |
|
| C000026576 |
|
| Shareholder Report [Line Items] |
|
| Fund Name |
PIMCO Low Duration Fund
|
| Class Name |
Administrative Class
|
| Trading Symbol |
PLDAX
|
| Annual or Semi-Annual Statement [Text Block] |
This annual shareholder report contains important information about the PIMCO Low Duration Fund (the "Fund") for the period of April 1, 2024 to March 31, 2025 (the "reporting period").
|
| Shareholder Report Annual or Semi-Annual |
Annual Shareholder Report
|
| Additional Information [Text Block] |
You can find additional information about the Fund at www.pimco.com/literature. You can also request this information by contacting us at 888.87.PIMCO (888.877.4626).
|
| Additional Information Phone Number |
888.87.PIMCO (888.877.4626)
|
| Expenses [Text Block] |
What were the Fund costs for the reporting period?(based on a hypothetical $10,000 investment)
Class Name |
Cost of a $10,000 investment |
Costs paid as a percentage of a $10,000 investment |
Administrative Class |
$75 |
0.73% | |
| Expenses Paid, Amount |
$ 75
|
| Expense Ratio, Percent |
0.73%
|
| Factors Affecting Performance [Text Block] |
How did the Fund perform during the reporting period and what affected its performance?The following affected performance (on a gross basis) during the reporting period: Overweight exposure to U.S. duration, specifically the 2-year part of the curve, contributed to relative performance versus the ICE BofA 1-3 Year U.S. Treasury Index ("Index"), as interest rates fell. Overweight exposure to agency mortgage-backed securities contributed to relative performance versus the Index, as spreads tightened. Overweight exposure to select securitized credit, particularly collateralized loan obligations, contributed to relative performance versus the Index, as spreads tightened. Long exposure to U.K. duration, particularly on the 5-year part of the curve, detracted from relative performance versus the Index, as interest rates rose. There were no other material detractors for this Fund.
|
| Performance Past Does Not Indicate Future [Text] |
Performance quoted represents past performance. Past performance is not a guarantee or a reliable indicator of future results.
|
| Line Graph [Table Text Block] |
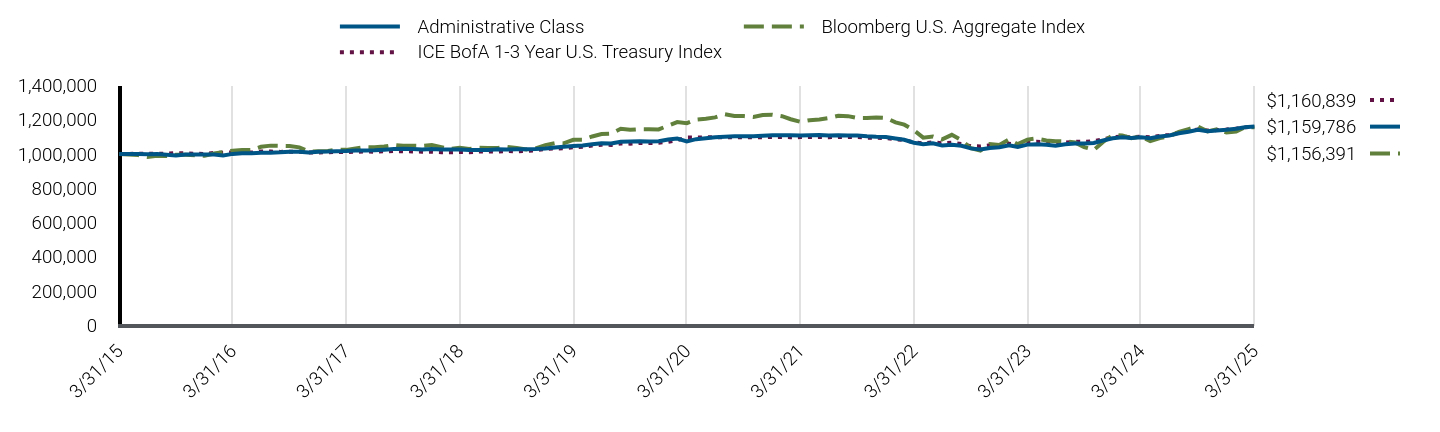
|
Administrative Class |
Bloomberg U.S. Aggregate Index |
ICE BofA 1-3 Year U.S. Treasury Index |
3/31/15 |
$1,000,000 |
$1,000,000 |
$1,000,000 |
4/30/15 |
$999,437 |
$996,412 |
$1,000,460 |
5/31/15 |
$1,000,065 |
$994,012 |
$1,001,200 |
6/30/15 |
$998,983 |
$983,174 |
$1,001,451 |
7/31/15 |
$1,000,627 |
$990,008 |
$1,001,971 |
8/31/15 |
$995,934 |
$988,586 |
$1,001,551 |
9/30/15 |
$991,762 |
$995,273 |
$1,004,585 |
10/31/15 |
$997,342 |
$995,439 |
$1,003,601 |
11/30/15 |
$996,551 |
$992,809 |
$1,001,132 |
12/31/15 |
$996,353 |
$989,601 |
$1,000,191 |
1/31/16 |
$997,138 |
$1,003,219 |
$1,006,282 |
2/29/16 |
$991,719 |
$1,010,335 |
$1,007,439 |
3/31/16 |
$1,000,554 |
$1,019,605 |
$1,009,192 |
4/30/16 |
$1,004,080 |
$1,023,519 |
$1,009,555 |
5/31/16 |
$1,004,986 |
$1,023,781 |
$1,008,485 |
6/30/16 |
$1,007,051 |
$1,042,177 |
$1,014,526 |
7/31/16 |
$1,007,944 |
$1,048,765 |
$1,013,948 |
8/31/16 |
$1,009,602 |
$1,047,566 |
$1,012,265 |
9/30/16 |
$1,013,105 |
$1,046,952 |
$1,013,439 |
10/31/16 |
$1,013,476 |
$1,038,944 |
$1,012,760 |
11/30/16 |
$1,008,182 |
$1,014,369 |
$1,008,739 |
12/31/16 |
$1,012,882 |
$1,015,800 |
$1,009,042 |
1/31/17 |
$1,014,136 |
$1,017,793 |
$1,010,313 |
2/28/17 |
$1,016,587 |
$1,024,634 |
$1,011,344 |
3/31/17 |
$1,017,282 |
$1,024,097 |
$1,011,667 |
4/30/17 |
$1,019,742 |
$1,032,000 |
$1,013,074 |
5/31/17 |
$1,021,061 |
$1,039,943 |
$1,014,249 |
6/30/17 |
$1,021,322 |
$1,038,896 |
$1,013,437 |
7/31/17 |
$1,024,431 |
$1,043,367 |
$1,015,596 |
8/31/17 |
$1,028,719 |
$1,052,726 |
$1,017,516 |
9/30/17 |
$1,029,877 |
$1,047,712 |
$1,015,847 |
10/31/17 |
$1,028,857 |
$1,048,319 |
$1,015,227 |
11/30/17 |
$1,026,849 |
$1,046,973 |
$1,013,176 |
12/31/17 |
$1,028,961 |
$1,051,778 |
$1,013,298 |
1/31/18 |
$1,025,734 |
$1,039,665 |
$1,010,390 |
2/28/18 |
$1,025,763 |
$1,029,809 |
$1,010,006 |
3/31/18 |
$1,025,993 |
$1,036,414 |
$1,011,985 |
4/30/18 |
$1,023,218 |
$1,028,705 |
$1,010,417 |
5/31/18 |
$1,023,794 |
$1,036,047 |
$1,014,075 |
6/30/18 |
$1,023,288 |
$1,034,773 |
$1,014,227 |
7/31/18 |
$1,027,009 |
$1,035,019 |
$1,014,176 |
8/31/18 |
$1,025,597 |
$1,041,679 |
$1,017,401 |
9/30/18 |
$1,027,121 |
$1,034,971 |
$1,016,201 |
10/31/18 |
$1,027,665 |
$1,026,792 |
$1,017,745 |
11/30/18 |
$1,028,995 |
$1,032,921 |
$1,021,277 |
12/31/18 |
$1,031,673 |
$1,051,898 |
$1,029,345 |
1/31/19 |
$1,038,534 |
$1,063,068 |
$1,032,114 |
2/28/19 |
$1,042,355 |
$1,062,452 |
$1,033,156 |
3/31/19 |
$1,046,323 |
$1,082,853 |
$1,039,469 |
4/30/19 |
$1,049,291 |
$1,083,130 |
$1,041,579 |
5/31/19 |
$1,056,937 |
$1,102,358 |
$1,048,974 |
6/30/19 |
$1,062,381 |
$1,116,201 |
$1,054,418 |
7/31/19 |
$1,061,014 |
$1,118,657 |
$1,053,174 |
8/31/19 |
$1,071,264 |
$1,147,643 |
$1,061,673 |
9/30/19 |
$1,072,478 |
$1,141,531 |
$1,060,495 |
10/31/19 |
$1,074,614 |
$1,144,969 |
$1,063,984 |
11/30/19 |
$1,072,497 |
$1,144,386 |
$1,063,643 |
12/31/19 |
$1,075,043 |
$1,143,588 |
$1,065,898 |
1/31/20 |
$1,084,591 |
$1,165,596 |
$1,071,665 |
2/29/20 |
$1,089,686 |
$1,186,575 |
$1,080,999 |
3/31/20 |
$1,073,589 |
$1,179,592 |
$1,095,830 |
4/30/20 |
$1,086,509 |
$1,200,561 |
$1,096,290 |
5/31/20 |
$1,092,448 |
$1,206,151 |
$1,097,003 |
6/30/20 |
$1,098,227 |
$1,213,749 |
$1,097,288 |
7/31/20 |
$1,100,607 |
$1,231,878 |
$1,098,397 |
8/31/20 |
$1,103,887 |
$1,221,935 |
$1,098,133 |
9/30/20 |
$1,103,890 |
$1,221,265 |
$1,098,429 |
10/31/20 |
$1,103,848 |
$1,215,812 |
$1,097,968 |
11/30/20 |
$1,106,930 |
$1,227,742 |
$1,098,473 |
12/31/20 |
$1,108,920 |
$1,229,433 |
$1,098,978 |
1/31/21 |
$1,109,475 |
$1,220,618 |
$1,099,143 |
2/28/21 |
$1,110,033 |
$1,202,992 |
$1,098,264 |
3/31/21 |
$1,108,290 |
$1,187,971 |
$1,098,473 |
4/30/21 |
$1,108,833 |
$1,197,356 |
$1,098,967 |
5/31/21 |
$1,110,432 |
$1,201,268 |
$1,099,802 |
6/30/21 |
$1,107,547 |
$1,209,708 |
$1,098,097 |
7/31/21 |
$1,109,108 |
$1,223,233 |
$1,099,920 |
8/31/21 |
$1,107,343 |
$1,220,905 |
$1,099,832 |
9/30/21 |
$1,107,921 |
$1,210,334 |
$1,098,732 |
10/31/21 |
$1,102,902 |
$1,210,000 |
$1,095,392 |
11/30/21 |
$1,100,130 |
$1,213,580 |
$1,095,601 |
12/31/21 |
$1,098,548 |
$1,210,475 |
$1,092,883 |
1/31/22 |
$1,090,133 |
$1,184,396 |
$1,085,725 |
2/28/22 |
$1,082,997 |
$1,171,183 |
$1,081,664 |
3/31/22 |
$1,065,699 |
$1,138,645 |
$1,067,267 |
4/30/22 |
$1,056,533 |
$1,095,436 |
$1,062,198 |
5/31/22 |
$1,062,165 |
$1,102,499 |
$1,068,072 |
6/30/22 |
$1,049,973 |
$1,085,203 |
$1,061,898 |
7/31/22 |
$1,053,624 |
$1,111,719 |
$1,065,456 |
8/31/22 |
$1,047,550 |
$1,080,306 |
$1,057,784 |
9/30/22 |
$1,032,850 |
$1,033,630 |
$1,045,324 |
10/31/22 |
$1,026,017 |
$1,020,242 |
$1,044,289 |
11/30/22 |
$1,035,468 |
$1,057,762 |
$1,050,858 |
12/31/22 |
$1,039,111 |
$1,052,991 |
$1,053,012 |
1/31/23 |
$1,051,206 |
$1,085,385 |
$1,060,225 |
2/28/23 |
$1,040,580 |
$1,057,322 |
$1,052,570 |
3/31/23 |
$1,054,713 |
$1,084,180 |
$1,069,359 |
4/30/23 |
$1,056,800 |
$1,090,751 |
$1,072,128 |
5/31/23 |
$1,053,315 |
$1,078,874 |
$1,068,429 |
6/30/23 |
$1,048,723 |
$1,075,027 |
$1,063,247 |
7/31/23 |
$1,056,445 |
$1,074,277 |
$1,067,033 |
8/31/23 |
$1,061,004 |
$1,067,415 |
$1,071,226 |
9/30/23 |
$1,061,017 |
$1,040,290 |
$1,071,130 |
10/31/23 |
$1,064,237 |
$1,023,873 |
$1,074,750 |
11/30/23 |
$1,078,382 |
$1,070,241 |
$1,085,648 |
12/31/23 |
$1,091,550 |
$1,111,209 |
$1,097,818 |
1/31/24 |
$1,097,151 |
$1,108,157 |
$1,102,045 |
2/29/24 |
$1,093,391 |
$1,092,501 |
$1,097,504 |
3/31/24 |
$1,097,041 |
$1,102,589 |
$1,101,071 |
4/30/24 |
$1,092,229 |
$1,074,739 |
$1,097,504 |
5/31/24 |
$1,102,083 |
$1,092,959 |
$1,105,044 |
6/30/24 |
$1,107,875 |
$1,103,307 |
$1,111,420 |
7/31/24 |
$1,121,395 |
$1,129,077 |
$1,124,134 |
8/31/24 |
$1,130,207 |
$1,145,301 |
$1,134,218 |
9/30/24 |
$1,141,001 |
$1,160,636 |
$1,143,337 |
10/31/24 |
$1,132,505 |
$1,131,854 |
$1,136,637 |
11/30/24 |
$1,137,582 |
$1,143,821 |
$1,139,967 |
12/31/24 |
$1,141,323 |
$1,125,101 |
$1,142,658 |
1/31/25 |
$1,147,538 |
$1,131,070 |
$1,147,594 |
2/28/25 |
$1,155,937 |
$1,155,956 |
$1,155,455 |
3/31/25 |
$1,159,786 |
$1,156,391 |
$1,160,839 |
|
| Average Annual Return [Table Text Block] |
Class/Index Name |
1 Year |
5 Years |
10 Years |
Administrative Class |
5.72% |
1.56% |
1.49% |
Bloomberg U.S. Aggregate Index |
4.88% |
(0.40%) |
1.46% |
ICE BofA 1-3 Year U.S. Treasury Index |
5.43% |
1.16% |
1.50% | |
| No Deduction of Taxes [Text Block] |
Returns shown do not reflect the deduction of taxes that a shareholder would pay on Fund distributions or the redemption of Fund shares.
|
| Performance Table Market Index Changed [Text Block] |
Differences in the Fund’s performance versus an index and related attribution information with respect to particular categories of securities or individual positions may be attributable, in part, to differences in the pricing methodologies used by the Fund and the index.
|
| Updated Performance Information Location [Text Block] |
For performance current to the most recent month-end, visit www.pimco.com/literature or via 888.87.PIMCO (888.877.4626).
|
| AssetsNet |
$ 6,633,082,000
|
| Holdings Count | Holding |
1,339
|
| Advisory Fees Paid, Amount |
$ 14,852,000
|
| InvestmentCompanyPortfolioTurnover |
497.00%
|
| Additional Fund Statistics [Text Block] |
Key Fund StatisticsFootnote Reference† (as of the end of the reporting period)
Total Net Assets |
$6,633,082 |
# of Portfolio Holdings |
1,339 |
Portfolio Turnover Rate |
497% |
Total Net Advisory Fees Paid During the Reporting Period |
$14,852 |
| Footnote |
Description |
Footnote† |
Dollar amounts displayed in 000's | |
| Holdings [Text Block] |
Security Type Breakdown (% of Net Asset Value)Footnote Reference*
U.S. Government Agencies |
39.6% |
U.S. Treasury Obligations |
17.5% |
Corporate Bonds & Notes |
12.6% |
Asset-Backed Securities |
7.4% |
Non-Agency Mortgage-Backed Securities |
4.6% |
Sovereign Issues |
2.3% |
Short-Term Instruments |
33.5% |
Affiliated Investments |
13.6% |
Financial Derivative Instruments |
0.0%Footnote Reference^ |
Other Assets and Liabilities, Net |
(31.1%) |
Total |
100.0% |
| Footnote |
Description |
Footnote^ |
Rounded value of investments is less than 0.1% of net assets. |
Footnote* |
% of Net Asset Value includes derivatives instruments, if any, valued at the value used for determining the Fund's net asset value. The notional exposure of such derivatives investments therefore may be greater than what is depicted. | |
| Material Fund Change [Text Block] |
|
| C000026579 |
|
| Shareholder Report [Line Items] |
|
| Fund Name |
PIMCO Low Duration Fund
|
| Class Name |
Class C
|
| Trading Symbol |
PTLCX
|
| Annual or Semi-Annual Statement [Text Block] |
This annual shareholder report contains important information about the PIMCO Low Duration Fund (the "Fund") for the period of April 1, 2024 to March 31, 2025 (the "reporting period").
|
| Shareholder Report Annual or Semi-Annual |
Annual Shareholder Report
|
| Additional Information [Text Block] |
You can find additional information about the Fund at www.pimco.com/literature. You can also request this information by contacting us at 888.87.PIMCO (888.877.4626).
|
| Additional Information Phone Number |
888.87.PIMCO (888.877.4626)
|
| Expenses [Text Block] |
What were the Fund costs for the reporting period?(based on a hypothetical $10,000 investment)
Class Name |
Cost of a $10,000 investment |
Costs paid as a percentage of a $10,000 investment |
Class C |
$115 |
1.12% | |
| Expenses Paid, Amount |
$ 115
|
| Expense Ratio, Percent |
1.12%
|
| Factors Affecting Performance [Text Block] |
How did the Fund perform during the reporting period and what affected its performance?The following affected performance (on a gross basis) during the reporting period: Overweight exposure to U.S. duration, specifically the 2-year part of the curve, contributed to relative performance versus the ICE BofA 1-3 Year U.S. Treasury Index ("Index"), as interest rates fell. Overweight exposure to agency mortgage-backed securities contributed to relative performance versus the Index, as spreads tightened. Overweight exposure to select securitized credit, particularly collateralized loan obligations, contributed to relative performance versus the Index, as spreads tightened. Long exposure to U.K. duration, particularly on the 5-year part of the curve, detracted from relative performance versus the Index, as interest rates rose. There were no other material detractors for this Fund.
|
| Performance Past Does Not Indicate Future [Text] |
Performance quoted represents past performance. Past performance is not a guarantee or a reliable indicator of future results.
|
| Line Graph [Table Text Block] |
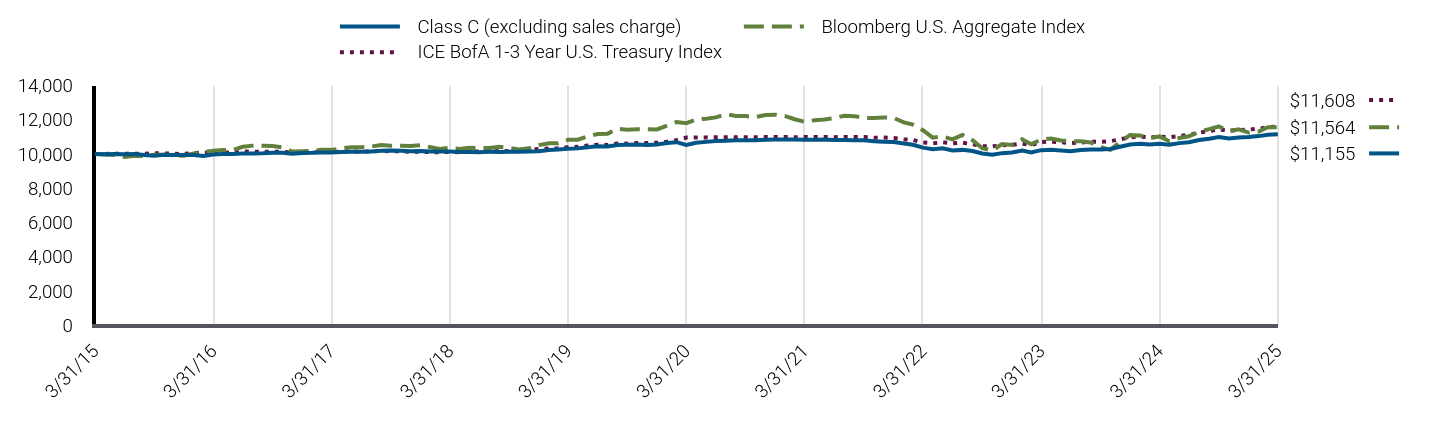
|
Class C (excluding sales charge) |
Bloomberg U.S. Aggregate Index |
ICE BofA 1-3 Year U.S. Treasury Index |
3/31/15 |
$10,000 |
$10,000 |
$10,000 |
4/30/15 |
$9,991 |
$9,964 |
$10,005 |
5/31/15 |
$9,994 |
$9,940 |
$10,012 |
6/30/15 |
$9,980 |
$9,832 |
$10,015 |
7/31/15 |
$9,993 |
$9,900 |
$10,020 |
8/31/15 |
$9,943 |
$9,886 |
$10,016 |
9/30/15 |
$9,898 |
$9,953 |
$10,046 |
10/31/15 |
$9,951 |
$9,954 |
$10,036 |
11/30/15 |
$9,940 |
$9,928 |
$10,011 |
12/31/15 |
$9,934 |
$9,896 |
$10,002 |
1/31/16 |
$9,939 |
$10,032 |
$10,063 |
2/29/16 |
$9,882 |
$10,103 |
$10,074 |
3/31/16 |
$9,967 |
$10,196 |
$10,092 |
4/30/16 |
$9,999 |
$10,235 |
$10,096 |
5/31/16 |
$10,004 |
$10,238 |
$10,085 |
6/30/16 |
$10,022 |
$10,422 |
$10,145 |
7/31/16 |
$10,027 |
$10,488 |
$10,139 |
8/31/16 |
$10,041 |
$10,476 |
$10,123 |
9/30/16 |
$10,072 |
$10,470 |
$10,134 |
10/31/16 |
$10,073 |
$10,389 |
$10,128 |
11/30/16 |
$10,017 |
$10,144 |
$10,087 |
12/31/16 |
$10,060 |
$10,158 |
$10,090 |
1/31/17 |
$10,069 |
$10,178 |
$10,103 |
2/28/17 |
$10,091 |
$10,246 |
$10,113 |
3/31/17 |
$10,094 |
$10,241 |
$10,117 |
4/30/17 |
$10,115 |
$10,320 |
$10,131 |
5/31/17 |
$10,125 |
$10,399 |
$10,142 |
6/30/17 |
$10,124 |
$10,389 |
$10,134 |
7/31/17 |
$10,152 |
$10,434 |
$10,156 |
8/31/17 |
$10,191 |
$10,527 |
$10,175 |
9/30/17 |
$10,199 |
$10,477 |
$10,158 |
10/31/17 |
$10,186 |
$10,483 |
$10,152 |
11/30/17 |
$10,163 |
$10,470 |
$10,132 |
12/31/17 |
$10,180 |
$10,518 |
$10,133 |
1/31/18 |
$10,145 |
$10,397 |
$10,104 |
2/28/18 |
$10,142 |
$10,298 |
$10,100 |
3/31/18 |
$10,141 |
$10,364 |
$10,120 |
4/30/18 |
$10,110 |
$10,287 |
$10,104 |
5/31/18 |
$10,113 |
$10,360 |
$10,141 |
6/30/18 |
$10,104 |
$10,348 |
$10,142 |
7/31/18 |
$10,138 |
$10,350 |
$10,142 |
8/31/18 |
$10,120 |
$10,417 |
$10,174 |
9/30/18 |
$10,132 |
$10,350 |
$10,162 |
10/31/18 |
$10,134 |
$10,268 |
$10,177 |
11/30/18 |
$10,144 |
$10,329 |
$10,213 |
12/31/18 |
$10,167 |
$10,519 |
$10,293 |
1/31/19 |
$10,231 |
$10,631 |
$10,321 |
2/28/19 |
$10,266 |
$10,625 |
$10,332 |
3/31/19 |
$10,302 |
$10,829 |
$10,395 |
4/30/19 |
$10,328 |
$10,831 |
$10,416 |
5/31/19 |
$10,399 |
$11,024 |
$10,490 |
6/30/19 |
$10,450 |
$11,162 |
$10,544 |
7/31/19 |
$10,433 |
$11,187 |
$10,532 |
8/31/19 |
$10,530 |
$11,476 |
$10,617 |
9/30/19 |
$10,539 |
$11,415 |
$10,605 |
10/31/19 |
$10,556 |
$11,450 |
$10,640 |
11/30/19 |
$10,532 |
$11,444 |
$10,636 |
12/31/19 |
$10,554 |
$11,436 |
$10,659 |
1/31/20 |
$10,644 |
$11,656 |
$10,717 |
2/29/20 |
$10,691 |
$11,866 |
$10,810 |
3/31/20 |
$10,529 |
$11,796 |
$10,958 |
4/30/20 |
$10,653 |
$12,006 |
$10,963 |
5/31/20 |
$10,707 |
$12,062 |
$10,970 |
6/30/20 |
$10,761 |
$12,137 |
$10,973 |
7/31/20 |
$10,780 |
$12,319 |
$10,984 |
8/31/20 |
$10,809 |
$12,219 |
$10,981 |
9/30/20 |
$10,805 |
$12,213 |
$10,984 |
10/31/20 |
$10,801 |
$12,158 |
$10,980 |
11/30/20 |
$10,828 |
$12,277 |
$10,985 |
12/31/20 |
$10,844 |
$12,294 |
$10,990 |
1/31/21 |
$10,846 |
$12,206 |
$10,991 |
2/28/21 |
$10,848 |
$12,030 |
$10,983 |
3/31/21 |
$10,827 |
$11,880 |
$10,985 |
4/30/21 |
$10,829 |
$11,974 |
$10,990 |
5/31/21 |
$10,841 |
$12,013 |
$10,998 |
6/30/21 |
$10,810 |
$12,097 |
$10,981 |
7/31/21 |
$10,821 |
$12,232 |
$10,999 |
8/31/21 |
$10,800 |
$12,209 |
$10,998 |
9/30/21 |
$10,803 |
$12,103 |
$10,987 |
10/31/21 |
$10,750 |
$12,100 |
$10,954 |
11/30/21 |
$10,720 |
$12,136 |
$10,956 |
12/31/21 |
$10,700 |
$12,105 |
$10,929 |
1/31/22 |
$10,615 |
$11,844 |
$10,857 |
2/28/22 |
$10,542 |
$11,712 |
$10,817 |
3/31/22 |
$10,371 |
$11,386 |
$10,673 |
4/30/22 |
$10,278 |
$10,954 |
$10,622 |
5/31/22 |
$10,329 |
$11,025 |
$10,681 |
6/30/22 |
$10,208 |
$10,852 |
$10,619 |
7/31/22 |
$10,240 |
$11,117 |
$10,655 |
8/31/22 |
$10,177 |
$10,803 |
$10,578 |
9/30/22 |
$10,031 |
$10,336 |
$10,453 |
10/31/22 |
$9,962 |
$10,202 |
$10,443 |
11/30/22 |
$10,050 |
$10,578 |
$10,509 |
12/31/22 |
$10,082 |
$10,530 |
$10,530 |
1/31/23 |
$10,196 |
$10,854 |
$10,602 |
2/28/23 |
$10,090 |
$10,573 |
$10,526 |
3/31/23 |
$10,224 |
$10,842 |
$10,694 |
4/30/23 |
$10,241 |
$10,908 |
$10,721 |
5/31/23 |
$10,204 |
$10,789 |
$10,684 |
6/30/23 |
$10,156 |
$10,750 |
$10,632 |
7/31/23 |
$10,227 |
$10,743 |
$10,670 |
8/31/23 |
$10,268 |
$10,674 |
$10,712 |
9/30/23 |
$10,265 |
$10,403 |
$10,711 |
10/31/23 |
$10,293 |
$10,239 |
$10,748 |
11/30/23 |
$10,426 |
$10,702 |
$10,856 |
12/31/23 |
$10,550 |
$11,112 |
$10,978 |
1/31/24 |
$10,601 |
$11,082 |
$11,020 |
2/29/24 |
$10,561 |
$10,925 |
$10,975 |
3/31/24 |
$10,593 |
$11,026 |
$11,011 |
4/30/24 |
$10,543 |
$10,747 |
$10,975 |
5/31/24 |
$10,634 |
$10,930 |
$11,050 |
6/30/24 |
$10,687 |
$11,033 |
$11,114 |
7/31/24 |
$10,814 |
$11,291 |
$11,241 |
8/31/24 |
$10,895 |
$11,453 |
$11,342 |
9/30/24 |
$10,996 |
$11,606 |
$11,433 |
10/31/24 |
$10,910 |
$11,319 |
$11,366 |
11/30/24 |
$10,956 |
$11,438 |
$11,400 |
12/31/24 |
$10,988 |
$11,251 |
$11,427 |
1/31/25 |
$11,044 |
$11,311 |
$11,476 |
2/28/25 |
$11,122 |
$11,560 |
$11,555 |
3/31/25 |
$11,155 |
$11,564 |
$11,608 |
|
| Average Annual Return [Table Text Block] |
Class/Index Name |
1 Year |
5 Years |
10 Years |
Class C (excluding sales charge) |
5.31% |
1.16% |
1.10% |
Class C (including sales charge) |
4.31% |
1.16% |
1.10% |
Bloomberg U.S. Aggregate Index |
4.88% |
(0.40%) |
1.46% |
ICE BofA 1-3 Year U.S. Treasury Index |
5.43% |
1.16% |
1.50% | |
| No Deduction of Taxes [Text Block] |
Returns shown do not reflect the deduction of taxes that a shareholder would pay on Fund distributions or the redemption of Fund shares.
|
| Performance Table Market Index Changed [Text Block] |
Differences in the Fund’s performance versus an index and related attribution information with respect to particular categories of securities or individual positions may be attributable, in part, to differences in the pricing methodologies used by the Fund and the index.
|
| Updated Performance Information Location [Text Block] |
For performance current to the most recent month-end, visit www.pimco.com/literature or via 888.87.PIMCO (888.877.4626).
|
| AssetsNet |
$ 6,633,082,000
|
| Holdings Count | Holding |
1,339
|
| Advisory Fees Paid, Amount |
$ 14,852,000
|
| InvestmentCompanyPortfolioTurnover |
497.00%
|
| Additional Fund Statistics [Text Block] |
Key Fund StatisticsFootnote Reference† (as of the end of the reporting period)
Total Net Assets |
$6,633,082 |
# of Portfolio Holdings |
1,339 |
Portfolio Turnover Rate |
497% |
Total Net Advisory Fees Paid During the Reporting Period |
$14,852 |
| Footnote |
Description |
Footnote† |
Dollar amounts displayed in 000's | |
| Holdings [Text Block] |
Security Type Breakdown (% of Net Asset Value)Footnote Reference*
U.S. Government Agencies |
39.6% |
U.S. Treasury Obligations |
17.5% |
Corporate Bonds & Notes |
12.6% |
Asset-Backed Securities |
7.4% |
Non-Agency Mortgage-Backed Securities |
4.6% |
Sovereign Issues |
2.3% |
Short-Term Instruments |
33.5% |
Affiliated Investments |
13.6% |
Financial Derivative Instruments |
0.0%Footnote Reference^ |
Other Assets and Liabilities, Net |
(31.1%) |
Total |
100.0% |
| Footnote |
Description |
Footnote^ |
Rounded value of investments is less than 0.1% of net assets. |
Footnote* |
% of Net Asset Value includes derivatives instruments, if any, valued at the value used for determining the Fund's net asset value. The notional exposure of such derivatives investments therefore may be greater than what is depicted. | |
| Material Fund Change [Text Block] |
|
| C000222833 |
|
| Shareholder Report [Line Items] |
|
| Fund Name |
PIMCO Low Duration Fund
|
| Class Name |
Class C-2
|
| Trading Symbol |
PLCCX
|
| Annual or Semi-Annual Statement [Text Block] |
This annual shareholder report contains important information about the PIMCO Low Duration Fund (the "Fund") for the period of April 1, 2024 to March 31, 2025 (the "reporting period").
|
| Shareholder Report Annual or Semi-Annual |
Annual Shareholder Report
|
| Additional Information [Text Block] |
You can find additional information about the Fund at www.pimco.com/literature. You can also request this information by contacting us at 888.87.PIMCO (888.877.4626).
|
| Additional Information Phone Number |
888.87.PIMCO (888.877.4626)
|
| Expenses [Text Block] |
What were the Fund costs for the reporting period?(based on a hypothetical $10,000 investment)
Class Name |
Cost of a $10,000 investment |
Costs paid as a percentage of a $10,000 investment |
Class C-2 |
$135 |
1.32% | |
| Expenses Paid, Amount |
$ 135
|
| Expense Ratio, Percent |
1.32%
|
| Factors Affecting Performance [Text Block] |
How did the Fund perform during the reporting period and what affected its performance?The following affected performance (on a gross basis) during the reporting period: Overweight exposure to U.S. duration, specifically the 2-year part of the curve, contributed to relative performance versus the ICE BofA 1-3 Year U.S. Treasury Index ("Index"), as interest rates fell. Overweight exposure to agency mortgage-backed securities contributed to relative performance versus the Index, as spreads tightened. Overweight exposure to select securitized credit, particularly collateralized loan obligations, contributed to relative performance versus the Index, as spreads tightened. Long exposure to U.K. duration, particularly on the 5-year part of the curve, detracted from relative performance versus the Index, as interest rates rose. There were no other material detractors for this Fund.
|
| Performance Past Does Not Indicate Future [Text] |
Performance quoted represents past performance. Past performance is not a guarantee or a reliable indicator of future results.
|
| Line Graph [Table Text Block] |
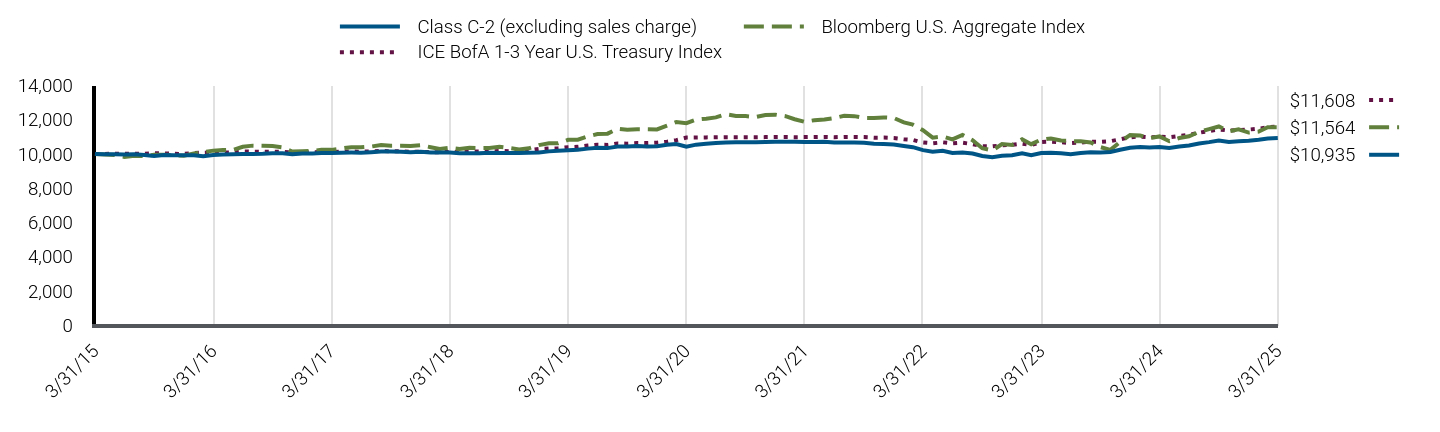
|
Class C-2 (excluding sales charge) |
Bloomberg U.S. Aggregate Index |
ICE BofA 1-3 Year U.S. Treasury Index |
3/31/15 |
$10,000 |
$10,000 |
$10,000 |
4/30/15 |
$9,990 |
$9,964 |
$10,005 |
5/31/15 |
$9,991 |
$9,940 |
$10,012 |
6/30/15 |
$9,975 |
$9,832 |
$10,015 |
7/31/15 |
$9,987 |
$9,900 |
$10,020 |
8/31/15 |
$9,935 |
$9,886 |
$10,016 |
9/30/15 |
$9,888 |
$9,953 |
$10,046 |
10/31/15 |
$9,939 |
$9,954 |
$10,036 |
11/30/15 |
$9,926 |
$9,928 |
$10,011 |
12/31/15 |
$9,920 |
$9,896 |
$10,002 |
1/31/16 |
$9,922 |
$10,032 |
$10,063 |
2/29/16 |
$9,864 |
$10,103 |
$10,074 |
3/31/16 |
$9,947 |
$10,196 |
$10,092 |
4/30/16 |
$9,977 |
$10,235 |
$10,096 |
5/31/16 |
$9,981 |
$10,238 |
$10,085 |
6/30/16 |
$9,997 |
$10,422 |
$10,145 |
7/31/16 |
$10,001 |
$10,488 |
$10,139 |
8/31/16 |
$10,012 |
$10,476 |
$10,123 |
9/30/16 |
$10,042 |
$10,470 |
$10,134 |
10/31/16 |
$10,041 |
$10,389 |
$10,128 |
11/30/16 |
$9,983 |
$10,144 |
$10,087 |
12/31/16 |
$10,025 |
$10,158 |
$10,090 |
1/31/17 |
$10,032 |
$10,178 |
$10,103 |
2/28/17 |
$10,052 |
$10,246 |
$10,113 |
3/31/17 |
$10,054 |
$10,241 |
$10,117 |
4/30/17 |
$10,073 |
$10,320 |
$10,131 |
5/31/17 |
$10,081 |
$10,399 |
$10,142 |
6/30/17 |
$10,079 |
$10,389 |
$10,134 |
7/31/17 |
$10,105 |
$10,434 |
$10,156 |
8/31/17 |
$10,142 |
$10,527 |
$10,175 |
9/30/17 |
$10,148 |
$10,477 |
$10,158 |
10/31/17 |
$10,133 |
$10,483 |
$10,152 |
11/30/17 |
$10,108 |
$10,470 |
$10,132 |
12/31/17 |
$10,124 |
$10,518 |
$10,133 |
1/31/18 |
$10,087 |
$10,397 |
$10,104 |
2/28/18 |
$10,083 |
$10,298 |
$10,100 |
3/31/18 |
$10,080 |
$10,364 |
$10,120 |
4/30/18 |
$10,048 |
$10,287 |
$10,104 |
5/31/18 |
$10,049 |
$10,360 |
$10,141 |
6/30/18 |
$10,039 |
$10,348 |
$10,142 |
7/31/18 |
$10,070 |
$10,350 |
$10,142 |
8/31/18 |
$10,052 |
$10,417 |
$10,174 |
9/30/18 |
$10,062 |
$10,350 |
$10,162 |
10/31/18 |
$10,062 |
$10,268 |
$10,177 |
11/30/18 |
$10,070 |
$10,329 |
$10,213 |
12/31/18 |
$10,091 |
$10,519 |
$10,293 |
1/31/19 |
$10,153 |
$10,631 |
$10,321 |
2/28/19 |
$10,186 |
$10,625 |
$10,332 |
3/31/19 |
$10,220 |
$10,829 |
$10,395 |
4/30/19 |
$10,244 |
$10,831 |
$10,416 |
5/31/19 |
$10,313 |
$11,024 |
$10,490 |
6/30/19 |
$10,361 |
$11,162 |
$10,544 |
7/31/19 |
$10,343 |
$11,187 |
$10,532 |
8/31/19 |
$10,438 |
$11,476 |
$10,617 |
9/30/19 |
$10,444 |
$11,415 |
$10,605 |
10/31/19 |
$10,460 |
$11,450 |
$10,640 |
11/30/19 |
$10,434 |
$11,444 |
$10,636 |
12/31/19 |
$10,454 |
$11,436 |
$10,659 |
1/31/20 |
$10,542 |
$11,656 |
$10,717 |
2/29/20 |
$10,586 |
$11,866 |
$10,810 |
3/31/20 |
$10,425 |
$11,796 |
$10,958 |
4/30/20 |
$10,545 |
$12,006 |
$10,963 |
5/31/20 |
$10,597 |
$12,062 |
$10,970 |
6/30/20 |
$10,648 |
$12,137 |
$10,973 |
7/31/20 |
$10,666 |
$12,319 |
$10,984 |
8/31/20 |
$10,692 |
$12,219 |
$10,981 |
9/30/20 |
$10,687 |
$12,213 |
$10,984 |
10/31/20 |
$10,681 |
$12,158 |
$10,980 |
11/30/20 |
$10,705 |
$12,277 |
$10,985 |
12/31/20 |
$10,719 |
$12,294 |
$10,990 |
1/31/21 |
$10,719 |
$12,206 |
$10,991 |
2/28/21 |
$10,720 |
$12,030 |
$10,983 |
3/31/21 |
$10,698 |
$11,880 |
$10,985 |
4/30/21 |
$10,698 |
$11,974 |
$10,990 |
5/31/21 |
$10,709 |
$12,013 |
$10,998 |
6/30/21 |
$10,677 |
$12,097 |
$10,981 |
7/31/21 |
$10,677 |
$12,232 |
$10,999 |
8/31/21 |
$10,666 |
$12,209 |
$10,998 |
9/30/21 |
$10,655 |
$12,103 |
$10,987 |
10/31/21 |
$10,601 |
$12,100 |
$10,954 |
11/30/21 |
$10,580 |
$12,136 |
$10,956 |
12/31/21 |
$10,558 |
$12,105 |
$10,929 |
1/31/22 |
$10,472 |
$11,844 |
$10,857 |
2/28/22 |
$10,398 |
$11,712 |
$10,817 |
3/31/22 |
$10,227 |
$11,386 |
$10,673 |
4/30/22 |
$10,134 |
$10,954 |
$10,622 |
5/31/22 |
$10,183 |
$11,025 |
$10,681 |
6/30/22 |
$10,061 |
$10,852 |
$10,619 |
7/31/22 |
$10,091 |
$11,117 |
$10,655 |
8/31/22 |
$10,028 |
$10,803 |
$10,578 |
9/30/22 |
$9,882 |
$10,336 |
$10,453 |
10/31/22 |
$9,812 |
$10,202 |
$10,443 |
11/30/22 |
$9,897 |
$10,578 |
$10,509 |
12/31/22 |
$9,927 |
$10,530 |
$10,530 |
1/31/23 |
$10,038 |
$10,854 |
$10,602 |
2/28/23 |
$9,932 |
$10,573 |
$10,526 |
3/31/23 |
$10,062 |
$10,842 |
$10,694 |
4/30/23 |
$10,077 |
$10,908 |
$10,721 |
5/31/23 |
$10,039 |
$10,789 |
$10,684 |
6/30/23 |
$9,990 |
$10,750 |
$10,632 |
7/31/23 |
$10,058 |
$10,743 |
$10,670 |
8/31/23 |
$10,097 |
$10,674 |
$10,712 |
9/30/23 |
$10,092 |
$10,403 |
$10,711 |
10/31/23 |
$10,117 |
$10,239 |
$10,748 |
11/30/23 |
$10,247 |
$10,702 |
$10,856 |
12/31/23 |
$10,367 |
$11,112 |
$10,978 |
1/31/24 |
$10,415 |
$11,082 |
$11,020 |
2/29/24 |
$10,375 |
$10,925 |
$10,975 |
3/31/24 |
$10,404 |
$11,026 |
$11,011 |
4/30/24 |
$10,353 |
$10,747 |
$10,975 |
5/31/24 |
$10,441 |
$10,930 |
$11,050 |
6/30/24 |
$10,491 |
$11,033 |
$11,114 |
7/31/24 |
$10,614 |
$11,291 |
$11,241 |
8/31/24 |
$10,692 |
$11,453 |
$11,342 |
9/30/24 |
$10,789 |
$11,606 |
$11,433 |
10/31/24 |
$10,703 |
$11,319 |
$11,366 |
11/30/24 |
$10,746 |
$11,438 |
$11,400 |
12/31/24 |
$10,776 |
$11,251 |
$11,427 |
1/31/25 |
$10,829 |
$11,311 |
$11,476 |
2/28/25 |
$10,904 |
$11,560 |
$11,555 |
3/31/25 |
$10,935 |
$11,564 |
$11,608 |
|
| Average Annual Return [Table Text Block] |
Class/Index Name |
1 Year |
5 Years |
10 Years |
Class C-2 (excluding sales charge) |
5.10% |
0.96% |
0.90% |
Class C-2 (including sales charge) |
4.10% |
0.96% |
0.90% |
Bloomberg U.S. Aggregate Index |
4.88% |
(0.40%) |
1.46% |
ICE BofA 1-3 Year U.S. Treasury Index |
5.43% |
1.16% |
1.50% | |
| No Deduction of Taxes [Text Block] |
Returns shown do not reflect the deduction of taxes that a shareholder would pay on Fund distributions or the redemption of Fund shares.
|
| Performance Table Market Index Changed [Text Block] |
Differences in the Fund’s performance versus an index and related attribution information with respect to particular categories of securities or individual positions may be attributable, in part, to differences in the pricing methodologies used by the Fund and the index.
|
| Updated Performance Information Location [Text Block] |
For performance current to the most recent month-end, visit www.pimco.com/literature or via 888.87.PIMCO (888.877.4626).
|
| AssetsNet |
$ 6,633,082,000
|
| Holdings Count | Holding |
1,339
|
| Advisory Fees Paid, Amount |
$ 14,852,000
|
| InvestmentCompanyPortfolioTurnover |
497.00%
|
| Additional Fund Statistics [Text Block] |
Key Fund StatisticsFootnote Reference† (as of the end of the reporting period)
Total Net Assets |
$6,633,082 |
# of Portfolio Holdings |
1,339 |
Portfolio Turnover Rate |
497% |
Total Net Advisory Fees Paid During the Reporting Period |
$14,852 |
| Footnote |
Description |
Footnote† |
Dollar amounts displayed in 000's | |
| Holdings [Text Block] |
Security Type Breakdown (% of Net Asset Value)Footnote Reference*
U.S. Government Agencies |
39.6% |
U.S. Treasury Obligations |
17.5% |
Corporate Bonds & Notes |
12.6% |
Asset-Backed Securities |
7.4% |
Non-Agency Mortgage-Backed Securities |
4.6% |
Sovereign Issues |
2.3% |
Short-Term Instruments |
33.5% |
Affiliated Investments |
13.6% |
Financial Derivative Instruments |
0.0%Footnote Reference^ |
Other Assets and Liabilities, Net |
(31.1%) |
Total |
100.0% |
| Footnote |
Description |
Footnote^ |
Rounded value of investments is less than 0.1% of net assets. |
Footnote* |
% of Net Asset Value includes derivatives instruments, if any, valued at the value used for determining the Fund's net asset value. The notional exposure of such derivatives investments therefore may be greater than what is depicted. | |
| Material Fund Change [Text Block] |
|
| C000200445 |
|
| Shareholder Report [Line Items] |
|
| Fund Name |
PIMCO Low Duration Fund
|
| Class Name |
I-3
|
| Trading Symbol |
PTLNX
|
| Annual or Semi-Annual Statement [Text Block] |
This annual shareholder report contains important information about the PIMCO Low Duration Fund (the "Fund") for the period of April 1, 2024 to March 31, 2025 (the "reporting period").
|
| Shareholder Report Annual or Semi-Annual |
Annual Shareholder Report
|
| Additional Information [Text Block] |
You can find additional information about the Fund at www.pimco.com/literature. You can also request this information by contacting us at 888.87.PIMCO (888.877.4626).
|
| Additional Information Phone Number |
888.87.PIMCO (888.877.4626)
|
| Expenses [Text Block] |
What were the Fund costs for the reporting period?(based on a hypothetical $10,000 investment)
Class Name |
Cost of a $10,000 investment |
Costs paid as a percentage of a $10,000 investment |
I-3 |
$65 |
0.63% | |
| Expenses Paid, Amount |
$ 65
|
| Expense Ratio, Percent |
0.63%
|
| Factors Affecting Performance [Text Block] |
How did the Fund perform during the reporting period and what affected its performance?The following affected performance (on a gross basis) during the reporting period: Overweight exposure to U.S. duration, specifically the 2-year part of the curve, contributed to relative performance versus the ICE BofA 1-3 Year U.S. Treasury Index ("Index"), as interest rates fell. Overweight exposure to agency mortgage-backed securities contributed to relative performance versus the Index, as spreads tightened. Overweight exposure to select securitized credit, particularly collateralized loan obligations, contributed to relative performance versus the Index, as spreads tightened. Long exposure to U.K. duration, particularly on the 5-year part of the curve, detracted from relative performance versus the Index, as interest rates rose. There were no other material detractors for this Fund.
|
| Performance Past Does Not Indicate Future [Text] |
Performance quoted represents past performance. Past performance is not a guarantee or a reliable indicator of future results.
|
| Line Graph [Table Text Block] |
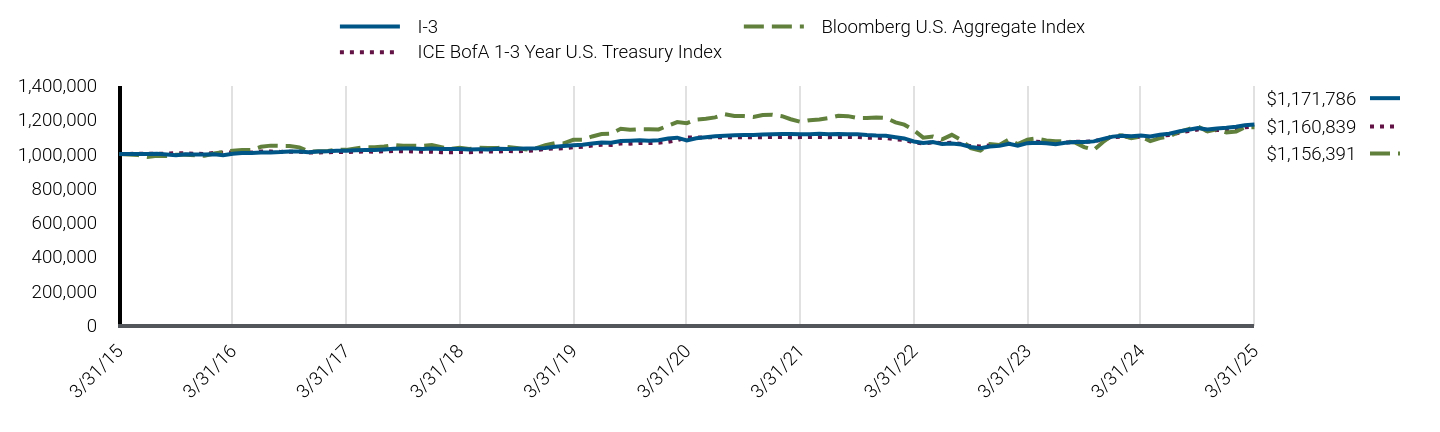
|
I-3 |
Bloomberg U.S. Aggregate Index |
ICE BofA 1-3 Year U.S. Treasury Index |
3/31/15 |
$1,000,000 |
$1,000,000 |
$1,000,000 |
4/30/15 |
$999,520 |
$996,412 |
$1,000,460 |
5/31/15 |
$1,000,234 |
$994,012 |
$1,001,200 |
6/30/15 |
$999,233 |
$983,174 |
$1,001,451 |
7/31/15 |
$1,000,976 |
$990,008 |
$1,001,971 |
8/31/15 |
$996,352 |
$988,586 |
$1,001,551 |
9/30/15 |
$992,260 |
$995,273 |
$1,004,585 |
10/31/15 |
$997,936 |
$995,439 |
$1,003,601 |
11/30/15 |
$997,219 |
$992,809 |
$1,001,132 |
12/31/15 |
$997,127 |
$989,601 |
$1,000,191 |
1/31/16 |
$997,976 |
$1,003,219 |
$1,006,282 |
2/29/16 |
$992,633 |
$1,010,335 |
$1,007,439 |
3/31/16 |
$1,001,560 |
$1,019,605 |
$1,009,192 |
4/30/16 |
$1,005,180 |
$1,023,519 |
$1,009,555 |
5/31/16 |
$1,006,166 |
$1,023,781 |
$1,008,485 |
6/30/16 |
$1,008,317 |
$1,042,177 |
$1,014,526 |
7/31/16 |
$1,009,297 |
$1,048,765 |
$1,013,948 |
8/31/16 |
$1,011,043 |
$1,047,566 |
$1,012,265 |
9/30/16 |
$1,014,648 |
$1,046,952 |
$1,013,439 |
10/31/16 |
$1,015,093 |
$1,038,944 |
$1,012,760 |
11/30/16 |
$1,009,877 |
$1,014,369 |
$1,008,739 |
12/31/16 |
$1,014,686 |
$1,015,800 |
$1,009,042 |
1/31/17 |
$1,016,015 |
$1,017,793 |
$1,010,313 |
2/28/17 |
$1,018,548 |
$1,024,634 |
$1,011,344 |
3/31/17 |
$1,019,345 |
$1,024,097 |
$1,011,667 |
4/30/17 |
$1,021,881 |
$1,032,000 |
$1,013,074 |
5/31/17 |
$1,023,289 |
$1,039,943 |
$1,014,249 |
6/30/17 |
$1,023,652 |
$1,038,896 |
$1,013,437 |
7/31/17 |
$1,026,841 |
$1,043,367 |
$1,015,596 |
8/31/17 |
$1,031,226 |
$1,052,726 |
$1,017,516 |
9/30/17 |
$1,032,480 |
$1,047,712 |
$1,015,847 |
10/31/17 |
$1,031,537 |
$1,048,319 |
$1,015,227 |
11/30/17 |
$1,029,608 |
$1,046,973 |
$1,013,176 |
12/31/17 |
$1,031,821 |
$1,051,778 |
$1,013,298 |
1/31/18 |
$1,028,667 |
$1,039,665 |
$1,010,390 |
2/28/18 |
$1,028,776 |
$1,029,809 |
$1,010,006 |
3/31/18 |
$1,029,100 |
$1,036,414 |
$1,011,985 |
4/30/18 |
$1,026,400 |
$1,028,705 |
$1,010,417 |
5/31/18 |
$1,027,054 |
$1,036,047 |
$1,014,075 |
6/30/18 |
$1,026,650 |
$1,034,773 |
$1,014,227 |
7/31/18 |
$1,030,485 |
$1,035,019 |
$1,014,176 |
8/31/18 |
$1,029,163 |
$1,041,679 |
$1,017,401 |
9/30/18 |
$1,030,768 |
$1,034,971 |
$1,016,201 |
10/31/18 |
$1,031,395 |
$1,026,792 |
$1,017,745 |
11/30/18 |
$1,032,821 |
$1,032,921 |
$1,021,277 |
12/31/18 |
$1,035,601 |
$1,051,898 |
$1,029,345 |
1/31/19 |
$1,042,586 |
$1,063,068 |
$1,032,114 |
2/28/19 |
$1,046,508 |
$1,062,452 |
$1,033,156 |
3/31/19 |
$1,050,589 |
$1,082,853 |
$1,039,469 |
4/30/19 |
$1,053,664 |
$1,083,130 |
$1,041,579 |
5/31/19 |
$1,061,448 |
$1,102,358 |
$1,048,974 |
6/30/19 |
$1,067,002 |
$1,116,201 |
$1,054,418 |
7/31/19 |
$1,065,716 |
$1,118,657 |
$1,053,174 |
8/31/19 |
$1,076,114 |
$1,147,643 |
$1,061,673 |
9/30/19 |
$1,077,427 |
$1,141,531 |
$1,060,495 |
10/31/19 |
$1,079,665 |
$1,144,969 |
$1,063,984 |
11/30/19 |
$1,077,642 |
$1,144,386 |
$1,063,643 |
12/31/19 |
$1,080,297 |
$1,143,588 |
$1,065,898 |
1/31/20 |
$1,089,997 |
$1,165,596 |
$1,071,665 |
2/29/20 |
$1,095,213 |
$1,186,575 |
$1,080,999 |
3/31/20 |
$1,079,131 |
$1,179,592 |
$1,095,830 |
4/30/20 |
$1,092,197 |
$1,200,561 |
$1,096,290 |
5/31/20 |
$1,098,267 |
$1,206,151 |
$1,097,003 |
6/30/20 |
$1,104,181 |
$1,213,749 |
$1,097,288 |
7/31/20 |
$1,106,664 |
$1,231,878 |
$1,098,397 |
8/31/20 |
$1,110,055 |
$1,221,935 |
$1,098,133 |
9/30/20 |
$1,110,150 |
$1,221,265 |
$1,098,429 |
10/31/20 |
$1,110,206 |
$1,215,812 |
$1,097,968 |
11/30/20 |
$1,113,393 |
$1,227,742 |
$1,098,473 |
12/31/20 |
$1,115,501 |
$1,229,433 |
$1,098,978 |
1/31/21 |
$1,116,143 |
$1,220,618 |
$1,099,143 |
2/28/21 |
$1,116,790 |
$1,202,992 |
$1,098,264 |
3/31/21 |
$1,115,138 |
$1,187,971 |
$1,098,473 |
4/30/21 |
$1,115,785 |
$1,197,356 |
$1,098,967 |
5/31/21 |
$1,117,484 |
$1,201,268 |
$1,099,802 |
6/30/21 |
$1,114,673 |
$1,209,708 |
$1,098,097 |
7/31/21 |
$1,116,343 |
$1,223,233 |
$1,099,920 |
8/31/21 |
$1,114,659 |
$1,220,905 |
$1,099,832 |
9/30/21 |
$1,115,334 |
$1,210,334 |
$1,098,732 |
10/31/21 |
$1,110,376 |
$1,210,000 |
$1,095,392 |
11/30/21 |
$1,107,675 |
$1,213,580 |
$1,095,601 |
12/31/21 |
$1,106,183 |
$1,210,475 |
$1,092,883 |
1/31/22 |
$1,097,795 |
$1,184,396 |
$1,085,725 |
2/28/22 |
$1,090,692 |
$1,171,183 |
$1,081,664 |
3/31/22 |
$1,073,359 |
$1,138,645 |
$1,067,267 |
4/30/22 |
$1,064,214 |
$1,095,436 |
$1,062,198 |
5/31/22 |
$1,069,978 |
$1,102,499 |
$1,068,072 |
6/30/22 |
$1,057,777 |
$1,085,203 |
$1,061,898 |
7/31/22 |
$1,061,550 |
$1,111,719 |
$1,065,456 |
8/31/22 |
$1,055,512 |
$1,080,306 |
$1,057,784 |
9/30/22 |
$1,040,772 |
$1,033,630 |
$1,045,324 |
10/31/22 |
$1,033,963 |
$1,020,242 |
$1,044,289 |
11/30/22 |
$1,043,588 |
$1,057,762 |
$1,050,858 |
12/31/22 |
$1,047,352 |
$1,052,991 |
$1,053,012 |
1/31/23 |
$1,059,641 |
$1,085,385 |
$1,060,225 |
2/28/23 |
$1,048,996 |
$1,057,322 |
$1,052,570 |
3/31/23 |
$1,063,358 |
$1,084,180 |
$1,069,359 |
4/30/23 |
$1,065,542 |
$1,090,751 |
$1,072,128 |
5/31/23 |
$1,062,106 |
$1,078,874 |
$1,068,429 |
6/30/23 |
$1,057,556 |
$1,075,027 |
$1,063,247 |
7/31/23 |
$1,065,430 |
$1,074,277 |
$1,067,033 |
8/31/23 |
$1,070,133 |
$1,067,415 |
$1,071,226 |
9/30/23 |
$1,070,243 |
$1,040,290 |
$1,071,130 |
10/31/23 |
$1,073,591 |
$1,023,873 |
$1,074,750 |
11/30/23 |
$1,087,975 |
$1,070,241 |
$1,085,648 |
12/31/23 |
$1,101,379 |
$1,111,209 |
$1,097,818 |
1/31/24 |
$1,107,134 |
$1,108,157 |
$1,102,045 |
2/29/24 |
$1,103,429 |
$1,092,501 |
$1,097,504 |
3/31/24 |
$1,107,210 |
$1,102,589 |
$1,101,071 |
4/30/24 |
$1,102,439 |
$1,074,739 |
$1,097,504 |
5/31/24 |
$1,112,492 |
$1,092,959 |
$1,105,044 |
6/30/24 |
$1,118,430 |
$1,103,307 |
$1,111,420 |
7/31/24 |
$1,132,200 |
$1,129,077 |
$1,124,134 |
8/31/24 |
$1,141,209 |
$1,145,301 |
$1,134,218 |
9/30/24 |
$1,152,201 |
$1,160,636 |
$1,143,337 |
10/31/24 |
$1,143,685 |
$1,131,854 |
$1,136,637 |
11/30/24 |
$1,148,923 |
$1,143,821 |
$1,139,967 |
12/31/24 |
$1,152,805 |
$1,125,101 |
$1,142,658 |
1/31/25 |
$1,159,201 |
$1,131,070 |
$1,147,594 |
2/28/25 |
$1,167,795 |
$1,155,956 |
$1,155,455 |
3/31/25 |
$1,171,786 |
$1,156,391 |
$1,160,839 |
|
| Average Annual Return [Table Text Block] |
Class/Index Name |
1 Year |
5 Years |
10 Years |
I-3 |
5.83% |
1.66% |
1.60% |
Bloomberg U.S. Aggregate Index |
4.88% |
(0.40%) |
1.46% |
ICE BofA 1-3 Year U.S. Treasury Index |
5.43% |
1.16% |
1.50% | |
| No Deduction of Taxes [Text Block] |
Returns shown do not reflect the deduction of taxes that a shareholder would pay on Fund distributions or the redemption of Fund shares.
|
| Performance Table Market Index Changed [Text Block] |
Differences in the Fund’s performance versus an index and related attribution information with respect to particular categories of securities or individual positions may be attributable, in part, to differences in the pricing methodologies used by the Fund and the index.
|
| Updated Performance Information Location [Text Block] |
For performance current to the most recent month-end, visit www.pimco.com/literature or via 888.87.PIMCO (888.877.4626).
|
| AssetsNet |
$ 6,633,082,000
|
| Holdings Count | Holding |
1,339
|
| Advisory Fees Paid, Amount |
$ 14,852,000
|
| InvestmentCompanyPortfolioTurnover |
497.00%
|
| Additional Fund Statistics [Text Block] |
Key Fund StatisticsFootnote Reference† (as of the end of the reporting period)
Total Net Assets |
$6,633,082 |
# of Portfolio Holdings |
1,339 |
Portfolio Turnover Rate |
497% |
Total Net Advisory Fees Paid During the Reporting Period |
$14,852 |
| Footnote |
Description |
Footnote† |
Dollar amounts displayed in 000's | |
| Holdings [Text Block] |
Security Type Breakdown (% of Net Asset Value)Footnote Reference*
U.S. Government Agencies |
39.6% |
U.S. Treasury Obligations |
17.5% |
Corporate Bonds & Notes |
12.6% |
Asset-Backed Securities |
7.4% |
Non-Agency Mortgage-Backed Securities |
4.6% |
Sovereign Issues |
2.3% |
Short-Term Instruments |
33.5% |
Affiliated Investments |
13.6% |
Financial Derivative Instruments |
0.0%Footnote Reference^ |
Other Assets and Liabilities, Net |
(31.1%) |
Total |
100.0% |
| Footnote |
Description |
Footnote^ |
Rounded value of investments is less than 0.1% of net assets. |
Footnote* |
% of Net Asset Value includes derivatives instruments, if any, valued at the value used for determining the Fund's net asset value. The notional exposure of such derivatives investments therefore may be greater than what is depicted. | |
| Material Fund Change [Text Block] |
|
| C000026575 |
|
| Shareholder Report [Line Items] |
|
| Fund Name |
PIMCO Low Duration Fund
|
| Class Name |
Institutional Class
|
| Trading Symbol |
PTLDX
|
| Annual or Semi-Annual Statement [Text Block] |
This annual shareholder report contains important information about the PIMCO Low Duration Fund (the "Fund") for the period of April 1, 2024 to March 31, 2025 (the "reporting period").
|
| Shareholder Report Annual or Semi-Annual |
Annual Shareholder Report
|
| Additional Information [Text Block] |
You can find additional information about the Fund at www.pimco.com/literature. You can also request this information by contacting us at 888.87.PIMCO (888.877.4626).
|
| Additional Information Phone Number |
888.87.PIMCO (888.877.4626)
|
| Expenses [Text Block] |
What were the Fund costs for the reporting period?(based on a hypothetical $10,000 investment)
Class Name |
Cost of a $10,000 investment |
Costs paid as a percentage of a $10,000 investment |
Institutional Class |
$49 |
0.48% | |
| Expenses Paid, Amount |
$ 49
|
| Expense Ratio, Percent |
0.48%
|
| Factors Affecting Performance [Text Block] |
How did the Fund perform during the reporting period and what affected its performance?The following affected performance (on a gross basis) during the reporting period: Overweight exposure to U.S. duration, specifically the 2-year part of the curve, contributed to relative performance versus the ICE BofA 1-3 Year U.S. Treasury Index ("Index"), as interest rates fell. Overweight exposure to agency mortgage-backed securities contributed to relative performance versus the Index, as spreads tightened. Overweight exposure to select securitized credit, particularly collateralized loan obligations, contributed to relative performance versus the Index, as spreads tightened. Long exposure to U.K. duration, particularly on the 5-year part of the curve, detracted from relative performance versus the Index, as interest rates rose. There were no other material detractors for this Fund.
|
| Performance Past Does Not Indicate Future [Text] |
Performance quoted represents past performance. Past performance is not a guarantee or a reliable indicator of future results.
|
| Line Graph [Table Text Block] |
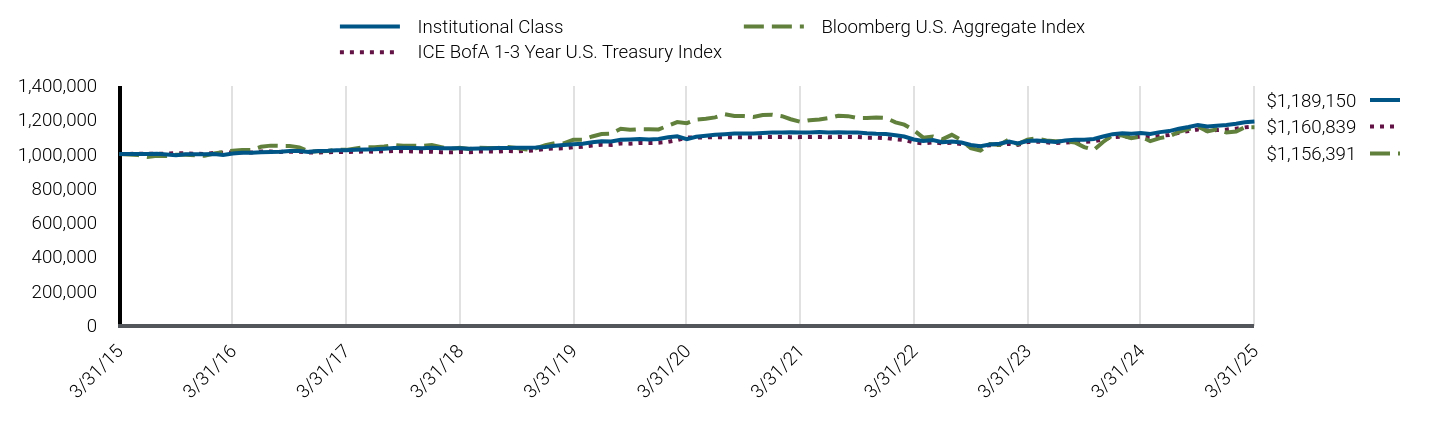
|
Institutional Class |
Bloomberg U.S. Aggregate Index |
ICE BofA 1-3 Year U.S. Treasury Index |
3/31/15 |
$1,000,000 |
$1,000,000 |
$1,000,000 |
4/30/15 |
$999,643 |
$996,412 |
$1,000,460 |
5/31/15 |
$1,000,485 |
$994,012 |
$1,001,200 |
6/30/15 |
$999,607 |
$983,174 |
$1,001,451 |
7/31/15 |
$1,001,478 |
$990,008 |
$1,001,971 |
8/31/15 |
$996,978 |
$988,586 |
$1,001,551 |
9/30/15 |
$993,006 |
$995,273 |
$1,004,585 |
10/31/15 |
$998,813 |
$995,439 |
$1,003,601 |
11/30/15 |
$998,218 |
$992,809 |
$1,001,132 |
12/31/15 |
$998,253 |
$989,601 |
$1,000,191 |
1/31/16 |
$999,230 |
$1,003,219 |
$1,006,282 |
2/29/16 |
$993,999 |
$1,010,335 |
$1,007,439 |
3/31/16 |
$1,003,065 |
$1,019,605 |
$1,009,192 |
4/30/16 |
$1,006,813 |
$1,023,519 |
$1,009,555 |
5/31/16 |
$1,007,929 |
$1,023,781 |
$1,008,485 |
6/30/16 |
$1,010,207 |
$1,042,177 |
$1,014,526 |
7/31/16 |
$1,011,317 |
$1,048,765 |
$1,013,948 |
8/31/16 |
$1,013,196 |
$1,047,566 |
$1,012,265 |
9/30/16 |
$1,016,933 |
$1,046,952 |
$1,013,439 |
10/31/16 |
$1,017,508 |
$1,038,944 |
$1,012,760 |
11/30/16 |
$1,012,404 |
$1,014,369 |
$1,008,739 |
12/31/16 |
$1,017,354 |
$1,015,800 |
$1,009,042 |
1/31/17 |
$1,018,816 |
$1,017,793 |
$1,010,313 |
2/28/17 |
$1,021,473 |
$1,024,634 |
$1,011,344 |
3/31/17 |
$1,022,402 |
$1,024,097 |
$1,011,667 |
4/30/17 |
$1,025,072 |
$1,032,000 |
$1,013,074 |
5/31/17 |
$1,026,615 |
$1,039,943 |
$1,014,249 |
6/30/17 |
$1,027,106 |
$1,038,896 |
$1,013,437 |
7/31/17 |
$1,030,436 |
$1,043,367 |
$1,015,596 |
8/31/17 |
$1,034,968 |
$1,052,726 |
$1,017,516 |
9/30/17 |
$1,036,354 |
$1,047,712 |
$1,015,847 |
10/31/17 |
$1,035,540 |
$1,048,319 |
$1,015,227 |
11/30/17 |
$1,033,731 |
$1,046,973 |
$1,013,176 |
12/31/17 |
$1,036,085 |
$1,051,778 |
$1,013,298 |
1/31/18 |
$1,033,049 |
$1,039,665 |
$1,010,390 |
2/28/18 |
$1,033,277 |
$1,029,809 |
$1,010,006 |
3/31/18 |
$1,033,735 |
$1,036,414 |
$1,011,985 |
4/30/18 |
$1,031,144 |
$1,028,705 |
$1,010,417 |
5/31/18 |
$1,031,943 |
$1,036,047 |
$1,014,075 |
6/30/18 |
$1,031,652 |
$1,034,773 |
$1,014,227 |
7/31/18 |
$1,035,616 |
$1,035,019 |
$1,014,176 |
8/31/18 |
$1,034,435 |
$1,041,679 |
$1,017,401 |
9/30/18 |
$1,036,163 |
$1,034,971 |
$1,016,201 |
10/31/18 |
$1,036,929 |
$1,026,792 |
$1,017,745 |
11/30/18 |
$1,038,499 |
$1,032,921 |
$1,021,277 |
12/31/18 |
$1,041,415 |
$1,051,898 |
$1,029,345 |
1/31/19 |
$1,048,556 |
$1,063,068 |
$1,032,114 |
2/28/19 |
$1,052,615 |
$1,062,452 |
$1,033,156 |
3/31/19 |
$1,056,844 |
$1,082,853 |
$1,039,469 |
4/30/19 |
$1,060,058 |
$1,083,130 |
$1,041,579 |
5/31/19 |
$1,068,015 |
$1,102,358 |
$1,048,974 |
6/30/19 |
$1,073,720 |
$1,116,201 |
$1,054,418 |
7/31/19 |
$1,072,565 |
$1,118,657 |
$1,053,174 |
8/31/19 |
$1,083,170 |
$1,147,643 |
$1,061,673 |
9/30/19 |
$1,084,610 |
$1,141,531 |
$1,060,495 |
10/31/19 |
$1,087,000 |
$1,144,969 |
$1,063,984 |
11/30/19 |
$1,085,101 |
$1,144,386 |
$1,063,643 |
12/31/19 |
$1,087,907 |
$1,143,588 |
$1,065,898 |
1/31/20 |
$1,097,807 |
$1,165,596 |
$1,071,665 |
2/29/20 |
$1,103,176 |
$1,186,575 |
$1,080,999 |
3/31/20 |
$1,087,106 |
$1,179,592 |
$1,095,830 |
4/30/20 |
$1,100,414 |
$1,200,561 |
$1,096,290 |
5/31/20 |
$1,106,662 |
$1,206,151 |
$1,097,003 |
6/30/20 |
$1,112,745 |
$1,213,749 |
$1,097,288 |
7/31/20 |
$1,115,408 |
$1,231,878 |
$1,098,397 |
8/31/20 |
$1,118,955 |
$1,221,935 |
$1,098,133 |
9/30/20 |
$1,119,187 |
$1,221,265 |
$1,098,429 |
10/31/20 |
$1,119,391 |
$1,215,812 |
$1,097,968 |
11/30/20 |
$1,122,738 |
$1,227,742 |
$1,098,473 |
12/31/20 |
$1,125,020 |
$1,229,433 |
$1,098,978 |
1/31/21 |
$1,125,799 |
$1,220,618 |
$1,099,143 |
2/28/21 |
$1,126,581 |
$1,202,992 |
$1,098,264 |
3/31/21 |
$1,125,051 |
$1,187,971 |
$1,098,473 |
4/30/21 |
$1,125,851 |
$1,197,356 |
$1,098,967 |
5/31/21 |
$1,127,700 |
$1,201,268 |
$1,099,802 |
6/30/21 |
$1,125,003 |
$1,209,708 |
$1,098,097 |
7/31/21 |
$1,126,834 |
$1,223,233 |
$1,099,920 |
8/31/21 |
$1,125,273 |
$1,220,905 |
$1,099,832 |
9/30/21 |
$1,126,093 |
$1,210,334 |
$1,098,732 |
10/31/21 |
$1,121,230 |
$1,210,000 |
$1,095,392 |
11/30/21 |
$1,118,643 |
$1,213,580 |
$1,095,601 |
12/31/21 |
$1,117,287 |
$1,210,475 |
$1,092,883 |
1/31/22 |
$1,108,949 |
$1,184,396 |
$1,085,725 |
2/28/22 |
$1,101,901 |
$1,171,183 |
$1,081,664 |
3/31/22 |
$1,084,533 |
$1,138,645 |
$1,067,267 |
4/30/22 |
$1,075,435 |
$1,095,436 |
$1,062,198 |
5/31/22 |
$1,081,389 |
$1,102,499 |
$1,068,072 |
6/30/22 |
$1,069,196 |
$1,085,203 |
$1,061,898 |
7/31/22 |
$1,073,141 |
$1,111,719 |
$1,065,456 |
8/31/22 |
$1,067,180 |
$1,080,306 |
$1,057,784 |
9/30/22 |
$1,052,436 |
$1,033,630 |
$1,045,324 |
10/31/22 |
$1,045,679 |
$1,020,242 |
$1,044,289 |
11/30/22 |
$1,055,526 |
$1,057,762 |
$1,050,858 |
12/31/22 |
$1,059,476 |
$1,052,991 |
$1,053,012 |
1/31/23 |
$1,072,022 |
$1,085,385 |
$1,060,225 |
2/28/23 |
$1,061,389 |
$1,057,322 |
$1,052,570 |
3/31/23 |
$1,076,048 |
$1,084,180 |
$1,069,359 |
4/30/23 |
$1,078,383 |
$1,090,751 |
$1,072,128 |
5/31/23 |
$1,075,054 |
$1,078,874 |
$1,068,429 |
6/30/23 |
$1,070,599 |
$1,075,027 |
$1,063,247 |
7/31/23 |
$1,078,691 |
$1,074,277 |
$1,067,033 |
8/31/23 |
$1,083,577 |
$1,067,415 |
$1,071,226 |
9/30/23 |
$1,083,823 |
$1,040,290 |
$1,071,130 |
10/31/23 |
$1,087,337 |
$1,023,873 |
$1,074,750 |
11/30/23 |
$1,102,014 |
$1,070,241 |
$1,085,648 |
12/31/23 |
$1,115,717 |
$1,111,209 |
$1,097,818 |
1/31/24 |
$1,121,671 |
$1,108,157 |
$1,102,045 |
2/29/24 |
$1,118,049 |
$1,092,501 |
$1,097,504 |
3/31/24 |
$1,122,018 |
$1,102,589 |
$1,101,071 |
4/30/24 |
$1,117,325 |
$1,074,739 |
$1,097,504 |
5/31/24 |
$1,127,659 |
$1,092,959 |
$1,105,044 |
6/30/24 |
$1,133,803 |
$1,103,307 |
$1,111,420 |
7/31/24 |
$1,147,880 |
$1,129,077 |
$1,124,134 |
8/31/24 |
$1,157,161 |
$1,145,301 |
$1,134,218 |
9/30/24 |
$1,168,434 |
$1,160,636 |
$1,143,337 |
10/31/24 |
$1,159,981 |
$1,131,854 |
$1,136,637 |
11/30/24 |
$1,165,428 |
$1,143,821 |
$1,139,967 |
12/31/24 |
$1,169,508 |
$1,125,101 |
$1,142,658 |
1/31/25 |
$1,176,134 |
$1,131,070 |
$1,147,594 |
2/28/25 |
$1,184,968 |
$1,155,956 |
$1,155,455 |
3/31/25 |
$1,189,150 |
$1,156,391 |
$1,160,839 |
|
| Average Annual Return [Table Text Block] |
Class/Index Name |
1 Year |
5 Years |
10 Years |
Institutional Class |
5.98% |
1.81% |
1.75% |
Bloomberg U.S. Aggregate Index |
4.88% |
(0.40%) |
1.46% |
ICE BofA 1-3 Year U.S. Treasury Index |
5.43% |
1.16% |
1.50% | |
| No Deduction of Taxes [Text Block] |
Returns shown do not reflect the deduction of taxes that a shareholder would pay on Fund distributions or the redemption of Fund shares.
|
| Performance Table Market Index Changed [Text Block] |
Differences in the Fund’s performance versus an index and related attribution information with respect to particular categories of securities or individual positions may be attributable, in part, to differences in the pricing methodologies used by the Fund and the index.
|
| Updated Performance Information Location [Text Block] |
For performance current to the most recent month-end, visit www.pimco.com/literature or via 888.87.PIMCO (888.877.4626).
|
| AssetsNet |
$ 6,633,082,000
|
| Holdings Count | Holding |
1,339
|
| Advisory Fees Paid, Amount |
$ 14,852,000
|
| InvestmentCompanyPortfolioTurnover |
497.00%
|
| Additional Fund Statistics [Text Block] |
Key Fund StatisticsFootnote Reference† (as of the end of the reporting period)
Total Net Assets |
$6,633,082 |
# of Portfolio Holdings |
1,339 |
Portfolio Turnover Rate |
497% |
Total Net Advisory Fees Paid During the Reporting Period |
$14,852 |
| Footnote |
Description |
Footnote† |
Dollar amounts displayed in 000's | |
| Holdings [Text Block] |
Security Type Breakdown (% of Net Asset Value)Footnote Reference*
U.S. Government Agencies |
39.6% |
U.S. Treasury Obligations |
17.5% |
Corporate Bonds & Notes |
12.6% |
Asset-Backed Securities |
7.4% |
Non-Agency Mortgage-Backed Securities |
4.6% |
Sovereign Issues |
2.3% |
Short-Term Instruments |
33.5% |
Affiliated Investments |
13.6% |
Financial Derivative Instruments |
0.0%Footnote Reference^ |
Other Assets and Liabilities, Net |
(31.1%) |
Total |
100.0% |
| Footnote |
Description |
Footnote^ |
Rounded value of investments is less than 0.1% of net assets. |
Footnote* |
% of Net Asset Value includes derivatives instruments, if any, valued at the value used for determining the Fund's net asset value. The notional exposure of such derivatives investments therefore may be greater than what is depicted. | |
| Material Fund Change [Text Block] |
|
| C000064143 |
|
| Shareholder Report [Line Items] |
|
| Fund Name |
PIMCO Low Duration Fund
|
| Class Name |
I-2
|
| Trading Symbol |
PLDPX
|
| Annual or Semi-Annual Statement [Text Block] |
This annual shareholder report contains important information about the PIMCO Low Duration Fund (the "Fund") for the period of April 1, 2024 to March 31, 2025 (the "reporting period").
|
| Shareholder Report Annual or Semi-Annual |
Annual Shareholder Report
|
| Additional Information [Text Block] |
You can find additional information about the Fund at www.pimco.com/literature. You can also request this information by contacting us at 888.87.PIMCO (888.877.4626).
|
| Additional Information Phone Number |
888.87.PIMCO (888.877.4626)
|
| Expenses [Text Block] |
What were the Fund costs for the reporting period?(based on a hypothetical $10,000 investment)
Class Name |
Cost of a $10,000 investment |
Costs paid as a percentage of a $10,000 investment |
I-2 |
$60 |
0.58% | |
| Expenses Paid, Amount |
$ 60
|
| Expense Ratio, Percent |
0.58%
|
| Factors Affecting Performance [Text Block] |
How did the Fund perform during the reporting period and what affected its performance?The following affected performance (on a gross basis) during the reporting period: Overweight exposure to U.S. duration, specifically the 2-year part of the curve, contributed to relative performance versus the ICE BofA 1-3 Year U.S. Treasury Index ("Index"), as interest rates fell. Overweight exposure to agency mortgage-backed securities contributed to relative performance versus the Index, as spreads tightened. Overweight exposure to select securitized credit, particularly collateralized loan obligations, contributed to relative performance versus the Index, as spreads tightened. Long exposure to U.K. duration, particularly on the 5-year part of the curve, detracted from relative performance versus the Index, as interest rates rose. There were no other material detractors for this Fund.
|
| Performance Past Does Not Indicate Future [Text] |
Performance quoted represents past performance. Past performance is not a guarantee or a reliable indicator of future results.
|
| Line Graph [Table Text Block] |
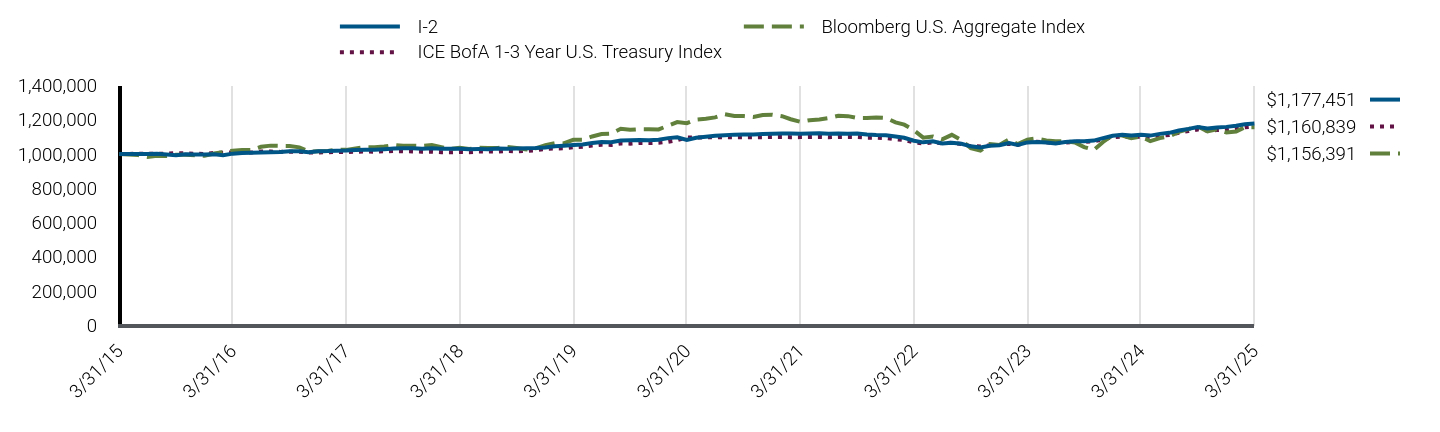
|
I-2 |
Bloomberg U.S. Aggregate Index |
ICE BofA 1-3 Year U.S. Treasury Index |
3/31/15 |
$1,000,000 |
$1,000,000 |
$1,000,000 |
4/30/15 |
$999,560 |
$996,412 |
$1,000,460 |
5/31/15 |
$1,000,317 |
$994,012 |
$1,001,200 |
6/30/15 |
$999,357 |
$983,174 |
$1,001,451 |
7/31/15 |
$1,001,138 |
$990,008 |
$1,001,971 |
8/31/15 |
$996,561 |
$988,586 |
$1,001,551 |
9/30/15 |
$992,508 |
$995,273 |
$1,004,585 |
10/31/15 |
$998,224 |
$995,439 |
$1,003,601 |
11/30/15 |
$997,551 |
$992,809 |
$1,001,132 |
12/31/15 |
$997,492 |
$989,601 |
$1,000,191 |
1/31/16 |
$998,392 |
$1,003,219 |
$1,006,282 |
2/29/16 |
$993,087 |
$1,010,335 |
$1,007,439 |
3/31/16 |
$1,002,061 |
$1,019,605 |
$1,009,192 |
4/30/16 |
$1,005,720 |
$1,023,519 |
$1,009,555 |
5/31/16 |
$1,006,752 |
$1,023,781 |
$1,008,485 |
6/30/16 |
$1,008,945 |
$1,042,177 |
$1,014,526 |
7/31/16 |
$1,009,968 |
$1,048,765 |
$1,013,948 |
8/31/16 |
$1,011,759 |
$1,047,566 |
$1,012,265 |
9/30/16 |
$1,015,402 |
$1,046,952 |
$1,013,439 |
10/31/16 |
$1,015,895 |
$1,038,944 |
$1,012,760 |
11/30/16 |
$1,010,715 |
$1,014,369 |
$1,008,739 |
12/31/16 |
$1,015,565 |
$1,015,800 |
$1,009,042 |
1/31/17 |
$1,016,944 |
$1,017,793 |
$1,010,313 |
2/28/17 |
$1,019,518 |
$1,024,634 |
$1,011,344 |
3/31/17 |
$1,020,353 |
$1,024,097 |
$1,011,667 |
4/30/17 |
$1,022,939 |
$1,032,000 |
$1,013,074 |
5/31/17 |
$1,024,393 |
$1,039,943 |
$1,014,249 |
6/30/17 |
$1,024,792 |
$1,038,896 |
$1,013,437 |
7/31/17 |
$1,028,034 |
$1,043,367 |
$1,015,596 |
8/31/17 |
$1,032,468 |
$1,052,726 |
$1,017,516 |
9/30/17 |
$1,033,762 |
$1,047,712 |
$1,015,847 |
10/31/17 |
$1,032,866 |
$1,048,319 |
$1,015,227 |
11/30/17 |
$1,030,976 |
$1,046,973 |
$1,013,176 |
12/31/17 |
$1,033,234 |
$1,051,778 |
$1,013,298 |
1/31/18 |
$1,030,121 |
$1,039,665 |
$1,010,390 |
2/28/18 |
$1,030,270 |
$1,029,809 |
$1,010,006 |
3/31/18 |
$1,030,635 |
$1,036,414 |
$1,011,985 |
4/30/18 |
$1,027,970 |
$1,028,705 |
$1,010,417 |
5/31/18 |
$1,028,682 |
$1,036,047 |
$1,014,075 |
6/30/18 |
$1,028,304 |
$1,034,773 |
$1,014,227 |
7/31/18 |
$1,032,171 |
$1,035,019 |
$1,014,176 |
8/31/18 |
$1,030,897 |
$1,041,679 |
$1,017,401 |
9/30/18 |
$1,032,544 |
$1,034,971 |
$1,016,201 |
10/31/18 |
$1,033,220 |
$1,026,792 |
$1,017,745 |
11/30/18 |
$1,034,693 |
$1,032,921 |
$1,021,277 |
12/31/18 |
$1,037,515 |
$1,051,898 |
$1,029,345 |
1/31/19 |
$1,044,543 |
$1,063,068 |
$1,032,114 |
2/28/19 |
$1,048,508 |
$1,062,452 |
$1,033,156 |
3/31/19 |
$1,052,632 |
$1,082,853 |
$1,039,469 |
4/30/19 |
$1,055,749 |
$1,083,130 |
$1,041,579 |
5/31/19 |
$1,063,686 |
$1,102,358 |
$1,048,974 |
6/30/19 |
$1,069,287 |
$1,116,201 |
$1,054,418 |
7/31/19 |
$1,068,047 |
$1,118,657 |
$1,053,174 |
8/31/19 |
$1,078,510 |
$1,147,643 |
$1,061,673 |
9/30/19 |
$1,079,862 |
$1,141,531 |
$1,060,495 |
10/31/19 |
$1,082,151 |
$1,144,969 |
$1,063,984 |
11/30/19 |
$1,080,175 |
$1,144,386 |
$1,063,643 |
12/31/19 |
$1,082,877 |
$1,143,588 |
$1,065,898 |
1/31/20 |
$1,092,637 |
$1,165,596 |
$1,071,665 |
2/29/20 |
$1,097,897 |
$1,186,575 |
$1,080,999 |
3/31/20 |
$1,081,816 |
$1,179,592 |
$1,095,830 |
4/30/20 |
$1,094,970 |
$1,200,561 |
$1,096,290 |
5/31/20 |
$1,101,095 |
$1,206,151 |
$1,097,003 |
6/30/20 |
$1,107,055 |
$1,213,749 |
$1,097,288 |
7/31/20 |
$1,109,604 |
$1,231,878 |
$1,098,397 |
8/31/20 |
$1,113,044 |
$1,221,935 |
$1,098,133 |
9/30/20 |
$1,113,184 |
$1,221,265 |
$1,098,429 |
10/31/20 |
$1,113,289 |
$1,215,812 |
$1,097,968 |
11/30/20 |
$1,116,530 |
$1,227,742 |
$1,098,473 |
12/31/20 |
$1,118,695 |
$1,229,433 |
$1,098,978 |
1/31/21 |
$1,119,384 |
$1,220,618 |
$1,099,143 |
2/28/21 |
$1,120,075 |
$1,202,992 |
$1,098,264 |
3/31/21 |
$1,118,459 |
$1,187,971 |
$1,098,473 |
4/30/21 |
$1,119,157 |
$1,197,356 |
$1,098,967 |
5/31/21 |
$1,120,906 |
$1,201,268 |
$1,099,802 |
6/30/21 |
$1,118,132 |
$1,209,708 |
$1,098,097 |
7/31/21 |
$1,119,855 |
$1,223,233 |
$1,099,920 |
8/31/21 |
$1,118,211 |
$1,220,905 |
$1,099,832 |
9/30/21 |
$1,118,934 |
$1,210,334 |
$1,098,732 |
10/31/21 |
$1,114,008 |
$1,210,000 |
$1,095,392 |
11/30/21 |
$1,111,345 |
$1,213,580 |
$1,095,601 |
12/31/21 |
$1,109,897 |
$1,210,475 |
$1,092,883 |
1/31/22 |
$1,101,527 |
$1,184,396 |
$1,085,725 |
2/28/22 |
$1,094,442 |
$1,171,183 |
$1,081,664 |
3/31/22 |
$1,077,099 |
$1,138,645 |
$1,067,267 |
4/30/22 |
$1,067,973 |
$1,095,436 |
$1,062,198 |
5/31/22 |
$1,073,792 |
$1,102,499 |
$1,068,072 |
6/30/22 |
$1,061,598 |
$1,085,203 |
$1,061,898 |
7/31/22 |
$1,065,426 |
$1,111,719 |
$1,065,456 |
8/31/22 |
$1,059,414 |
$1,080,306 |
$1,057,784 |
9/30/22 |
$1,044,684 |
$1,033,630 |
$1,045,324 |
10/31/22 |
$1,037,895 |
$1,020,242 |
$1,044,289 |
11/30/22 |
$1,047,580 |
$1,057,762 |
$1,050,858 |
12/31/22 |
$1,051,406 |
$1,052,991 |
$1,053,012 |
1/31/23 |
$1,063,771 |
$1,085,385 |
$1,060,225 |
2/28/23 |
$1,053,140 |
$1,057,322 |
$1,052,570 |
3/31/23 |
$1,067,589 |
$1,084,180 |
$1,069,359 |
4/30/23 |
$1,069,824 |
$1,090,751 |
$1,072,128 |
5/31/23 |
$1,066,430 |
$1,078,874 |
$1,068,429 |
6/30/23 |
$1,061,917 |
$1,075,027 |
$1,063,247 |
7/31/23 |
$1,069,859 |
$1,074,277 |
$1,067,033 |
8/31/23 |
$1,074,614 |
$1,067,415 |
$1,071,226 |
9/30/23 |
$1,074,767 |
$1,040,290 |
$1,071,130 |
10/31/23 |
$1,078,163 |
$1,023,873 |
$1,074,750 |
11/30/23 |
$1,092,628 |
$1,070,241 |
$1,085,648 |
12/31/23 |
$1,106,117 |
$1,111,209 |
$1,097,818 |
1/31/24 |
$1,111,929 |
$1,108,157 |
$1,102,045 |
2/29/24 |
$1,108,251 |
$1,092,501 |
$1,097,504 |
3/31/24 |
$1,112,091 |
$1,102,589 |
$1,101,071 |
4/30/24 |
$1,107,350 |
$1,074,739 |
$1,097,504 |
5/31/24 |
$1,117,490 |
$1,092,959 |
$1,105,044 |
6/30/24 |
$1,123,493 |
$1,103,307 |
$1,111,420 |
7/31/24 |
$1,137,347 |
$1,129,077 |
$1,124,134 |
8/31/24 |
$1,146,439 |
$1,145,301 |
$1,134,218 |
9/30/24 |
$1,157,519 |
$1,160,636 |
$1,143,337 |
10/31/24 |
$1,149,042 |
$1,131,854 |
$1,136,637 |
11/30/24 |
$1,154,340 |
$1,143,821 |
$1,139,967 |
12/31/24 |
$1,158,283 |
$1,125,101 |
$1,142,658 |
1/31/25 |
$1,164,744 |
$1,131,070 |
$1,147,594 |
2/28/25 |
$1,173,403 |
$1,155,956 |
$1,155,455 |
3/31/25 |
$1,177,451 |
$1,156,391 |
$1,160,839 |
|
| Average Annual Return [Table Text Block] |
Class/Index Name |
1 Year |
5 Years |
10 Years |
I-2 |
5.88% |
1.71% |
1.65% |
Bloomberg U.S. Aggregate Index |
4.88% |
(0.40%) |
1.46% |
ICE BofA 1-3 Year U.S. Treasury Index |
5.43% |
1.16% |
1.50% | |
| No Deduction of Taxes [Text Block] |
Returns shown do not reflect the deduction of taxes that a shareholder would pay on Fund distributions or the redemption of Fund shares.
|
| Performance Table Market Index Changed [Text Block] |
Differences in the Fund’s performance versus an index and related attribution information with respect to particular categories of securities or individual positions may be attributable, in part, to differences in the pricing methodologies used by the Fund and the index.
|
| Updated Performance Information Location [Text Block] |
For performance current to the most recent month-end, visit www.pimco.com/literature or via 888.87.PIMCO (888.877.4626).
|
| AssetsNet |
$ 6,633,082,000
|
| Holdings Count | Holding |
1,339
|
| Advisory Fees Paid, Amount |
$ 14,852,000
|
| InvestmentCompanyPortfolioTurnover |
497.00%
|
| Additional Fund Statistics [Text Block] |
Key Fund StatisticsFootnote Reference† (as of the end of the reporting period)
Total Net Assets |
$6,633,082 |
# of Portfolio Holdings |
1,339 |
Portfolio Turnover Rate |
497% |
Total Net Advisory Fees Paid During the Reporting Period |
$14,852 |
| Footnote |
Description |
Footnote† |
Dollar amounts displayed in 000's | |
| Holdings [Text Block] |
Security Type Breakdown (% of Net Asset Value)Footnote Reference*
U.S. Government Agencies |
39.6% |
U.S. Treasury Obligations |
17.5% |
Corporate Bonds & Notes |
12.6% |
Asset-Backed Securities |
7.4% |
Non-Agency Mortgage-Backed Securities |
4.6% |
Sovereign Issues |
2.3% |
Short-Term Instruments |
33.5% |
Affiliated Investments |
13.6% |
Financial Derivative Instruments |
0.0%Footnote Reference^ |
Other Assets and Liabilities, Net |
(31.1%) |
Total |
100.0% |
| Footnote |
Description |
Footnote^ |
Rounded value of investments is less than 0.1% of net assets. |
Footnote* |
% of Net Asset Value includes derivatives instruments, if any, valued at the value used for determining the Fund's net asset value. The notional exposure of such derivatives investments therefore may be greater than what is depicted. | |
| Material Fund Change [Text Block] |
|
| C000026581 |
|
| Shareholder Report [Line Items] |
|
| Fund Name |
PIMCO Low Duration Fund
|
| Class Name |
Class R
|
| Trading Symbol |
PLDRX
|
| Annual or Semi-Annual Statement [Text Block] |
This annual shareholder report contains important information about the PIMCO Low Duration Fund (the "Fund") for the period of April 1, 2024 to March 31, 2025 (the "reporting period").
|
| Shareholder Report Annual or Semi-Annual |
Annual Shareholder Report
|
| Additional Information [Text Block] |
You can find additional information about the Fund at www.pimco.com/literature. You can also request this information by contacting us at 888.87.PIMCO (888.877.4626).
|
| Additional Information Phone Number |
888.87.PIMCO (888.877.4626)
|
| Expenses [Text Block] |
What were the Fund costs for the reporting period?(based on a hypothetical $10,000 investment)
Class Name |
Cost of a $10,000 investment |
Costs paid as a percentage of a $10,000 investment |
Class R |
$110 |
1.07% | |
| Expenses Paid, Amount |
$ 110
|
| Expense Ratio, Percent |
1.07%
|
| Factors Affecting Performance [Text Block] |
How did the Fund perform during the reporting period and what affected its performance?The following affected performance (on a gross basis) during the reporting period: Overweight exposure to U.S. duration, specifically the 2-year part of the curve, contributed to relative performance versus the ICE BofA 1-3 Year U.S. Treasury Index ("Index"), as interest rates fell. Overweight exposure to agency mortgage-backed securities contributed to relative performance versus the Index, as spreads tightened. Overweight exposure to select securitized credit, particularly collateralized loan obligations, contributed to relative performance versus the Index, as spreads tightened. Long exposure to U.K. duration, particularly on the 5-year part of the curve, detracted from relative performance versus the Index, as interest rates rose. There were no other material detractors for this Fund.
|
| Performance Past Does Not Indicate Future [Text] |
Performance quoted represents past performance. Past performance is not a guarantee or a reliable indicator of future results.
|
| Line Graph [Table Text Block] |
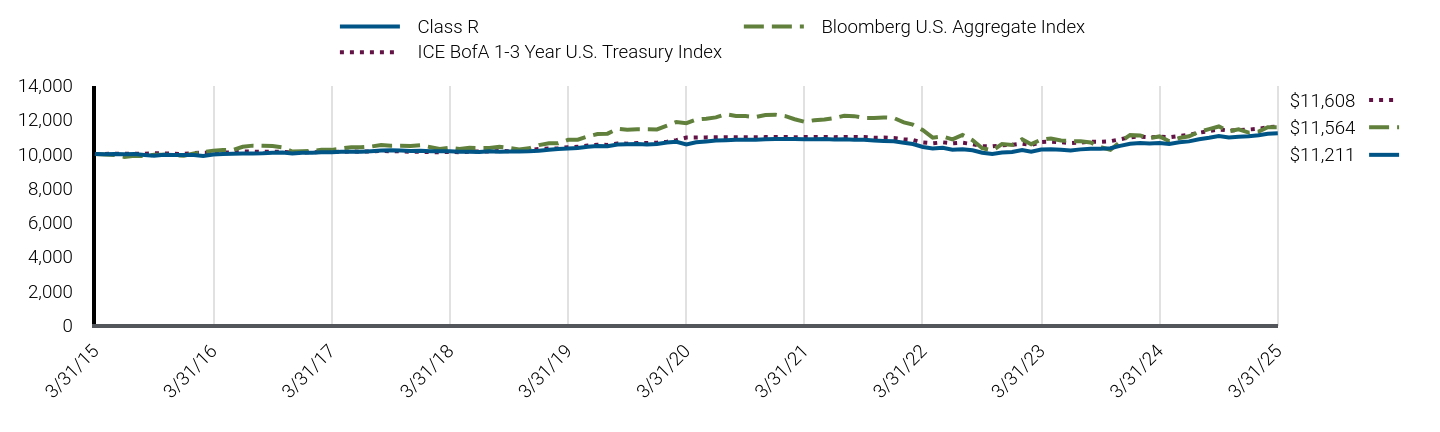
|
Class R |
Bloomberg U.S. Aggregate Index |
ICE BofA 1-3 Year U.S. Treasury Index |
3/31/15 |
$10,000 |
$10,000 |
$10,000 |
4/30/15 |
$9,992 |
$9,964 |
$10,005 |
5/31/15 |
$9,995 |
$9,940 |
$10,012 |
6/30/15 |
$9,981 |
$9,832 |
$10,015 |
7/31/15 |
$9,995 |
$9,900 |
$10,020 |
8/31/15 |
$9,945 |
$9,886 |
$10,016 |
9/30/15 |
$9,901 |
$9,953 |
$10,046 |
10/31/15 |
$9,954 |
$9,954 |
$10,036 |
11/30/15 |
$9,943 |
$9,928 |
$10,011 |
12/31/15 |
$9,938 |
$9,896 |
$10,002 |
1/31/16 |
$9,943 |
$10,032 |
$10,063 |
2/29/16 |
$9,886 |
$10,103 |
$10,074 |
3/31/16 |
$9,972 |
$10,196 |
$10,092 |
4/30/16 |
$10,004 |
$10,235 |
$10,096 |
5/31/16 |
$10,010 |
$10,238 |
$10,085 |
6/30/16 |
$10,028 |
$10,422 |
$10,145 |
7/31/16 |
$10,034 |
$10,488 |
$10,139 |
8/31/16 |
$10,048 |
$10,476 |
$10,123 |
9/30/16 |
$10,079 |
$10,470 |
$10,134 |
10/31/16 |
$10,080 |
$10,389 |
$10,128 |
11/30/16 |
$10,025 |
$10,144 |
$10,087 |
12/31/16 |
$10,069 |
$10,158 |
$10,090 |
1/31/17 |
$10,078 |
$10,178 |
$10,103 |
2/28/17 |
$10,100 |
$10,246 |
$10,113 |
3/31/17 |
$10,104 |
$10,241 |
$10,117 |
4/30/17 |
$10,126 |
$10,320 |
$10,131 |
5/31/17 |
$10,136 |
$10,399 |
$10,142 |
6/30/17 |
$10,135 |
$10,389 |
$10,134 |
7/31/17 |
$10,164 |
$10,434 |
$10,156 |
8/31/17 |
$10,203 |
$10,527 |
$10,175 |
9/30/17 |
$10,212 |
$10,477 |
$10,158 |
10/31/17 |
$10,199 |
$10,483 |
$10,152 |
11/30/17 |
$10,176 |
$10,470 |
$10,132 |
12/31/17 |
$10,194 |
$10,518 |
$10,133 |
1/31/18 |
$10,159 |
$10,397 |
$10,104 |
2/28/18 |
$10,157 |
$10,298 |
$10,100 |
3/31/18 |
$10,156 |
$10,364 |
$10,120 |
4/30/18 |
$10,126 |
$10,287 |
$10,104 |
5/31/18 |
$10,128 |
$10,360 |
$10,141 |
6/30/18 |
$10,121 |
$10,348 |
$10,142 |
7/31/18 |
$10,155 |
$10,350 |
$10,142 |
8/31/18 |
$10,137 |
$10,417 |
$10,174 |
9/30/18 |
$10,150 |
$10,350 |
$10,162 |
10/31/18 |
$10,152 |
$10,268 |
$10,177 |
11/30/18 |
$10,162 |
$10,329 |
$10,213 |
12/31/18 |
$10,186 |
$10,519 |
$10,293 |
1/31/19 |
$10,251 |
$10,631 |
$10,321 |
2/28/19 |
$10,286 |
$10,625 |
$10,332 |
3/31/19 |
$10,322 |
$10,829 |
$10,395 |
4/30/19 |
$10,349 |
$10,831 |
$10,416 |
5/31/19 |
$10,421 |
$11,024 |
$10,490 |
6/30/19 |
$10,472 |
$11,162 |
$10,544 |
7/31/19 |
$10,455 |
$11,187 |
$10,532 |
8/31/19 |
$10,553 |
$11,476 |
$10,617 |
9/30/19 |
$10,562 |
$11,415 |
$10,605 |
10/31/19 |
$10,580 |
$11,450 |
$10,640 |
11/30/19 |
$10,557 |
$11,444 |
$10,636 |
12/31/19 |
$10,579 |
$11,436 |
$10,659 |
1/31/20 |
$10,670 |
$11,656 |
$10,717 |
2/29/20 |
$10,717 |
$11,866 |
$10,810 |
3/31/20 |
$10,556 |
$11,796 |
$10,958 |
4/30/20 |
$10,680 |
$12,006 |
$10,963 |
5/31/20 |
$10,735 |
$12,062 |
$10,970 |
6/30/20 |
$10,789 |
$12,137 |
$10,973 |
7/31/20 |
$10,809 |
$12,319 |
$10,984 |
8/31/20 |
$10,838 |
$12,219 |
$10,981 |
9/30/20 |
$10,835 |
$12,213 |
$10,984 |
10/31/20 |
$10,832 |
$12,158 |
$10,980 |
11/30/20 |
$10,859 |
$12,277 |
$10,985 |
12/31/20 |
$10,875 |
$12,294 |
$10,990 |
1/31/21 |
$10,878 |
$12,206 |
$10,991 |
2/28/21 |
$10,880 |
$12,030 |
$10,983 |
3/31/21 |
$10,860 |
$11,880 |
$10,985 |
4/30/21 |
$10,862 |
$11,974 |
$10,990 |
5/31/21 |
$10,875 |
$12,013 |
$10,998 |
6/30/21 |
$10,844 |
$12,097 |
$10,981 |
7/31/21 |
$10,856 |
$12,232 |
$10,999 |
8/31/21 |
$10,835 |
$12,209 |
$10,998 |
9/30/21 |
$10,838 |
$12,103 |
$10,987 |
10/31/21 |
$10,786 |
$12,100 |
$10,954 |
11/30/21 |
$10,756 |
$12,136 |
$10,956 |
12/31/21 |
$10,737 |
$12,105 |
$10,929 |
1/31/22 |
$10,652 |
$11,844 |
$10,857 |
2/28/22 |
$10,579 |
$11,712 |
$10,817 |
3/31/22 |
$10,407 |
$11,386 |
$10,673 |
4/30/22 |
$10,315 |
$10,954 |
$10,622 |
5/31/22 |
$10,367 |
$11,025 |
$10,681 |
6/30/22 |
$10,245 |
$10,852 |
$10,619 |
7/31/22 |
$10,278 |
$11,117 |
$10,655 |
8/31/22 |
$10,215 |
$10,803 |
$10,578 |
9/30/22 |
$10,069 |
$10,336 |
$10,453 |
10/31/22 |
$10,000 |
$10,202 |
$10,443 |
11/30/22 |
$10,089 |
$10,578 |
$10,509 |
12/31/22 |
$10,121 |
$10,530 |
$10,530 |
1/31/23 |
$10,236 |
$10,854 |
$10,602 |
2/28/23 |
$10,130 |
$10,573 |
$10,526 |
3/31/23 |
$10,265 |
$10,842 |
$10,694 |
4/30/23 |
$10,282 |
$10,908 |
$10,721 |
5/31/23 |
$10,245 |
$10,789 |
$10,684 |
6/30/23 |
$10,198 |
$10,750 |
$10,632 |
7/31/23 |
$10,270 |
$10,743 |
$10,670 |
8/31/23 |
$10,311 |
$10,674 |
$10,712 |
9/30/23 |
$10,309 |
$10,403 |
$10,711 |
10/31/23 |
$10,337 |
$10,239 |
$10,748 |
11/30/23 |
$10,471 |
$10,702 |
$10,856 |
12/31/23 |
$10,596 |
$11,112 |
$10,978 |
1/31/24 |
$10,648 |
$11,082 |
$11,020 |
2/29/24 |
$10,608 |
$10,925 |
$10,975 |
3/31/24 |
$10,641 |
$11,026 |
$11,011 |
4/30/24 |
$10,591 |
$10,747 |
$10,975 |
5/31/24 |
$10,683 |
$10,930 |
$11,050 |
6/30/24 |
$10,737 |
$11,033 |
$11,114 |
7/31/24 |
$10,865 |
$11,291 |
$11,241 |
8/31/24 |
$10,947 |
$11,453 |
$11,342 |
9/30/24 |
$11,048 |
$11,606 |
$11,433 |
10/31/24 |
$10,963 |
$11,319 |
$11,366 |
11/30/24 |
$11,009 |
$11,438 |
$11,400 |
12/31/24 |
$11,042 |
$11,251 |
$11,427 |
1/31/25 |
$11,099 |
$11,311 |
$11,476 |
2/28/25 |
$11,177 |
$11,560 |
$11,555 |
3/31/25 |
$11,211 |
$11,564 |
$11,608 |
|
| Average Annual Return [Table Text Block] |
Class/Index Name |
1 Year |
5 Years |
10 Years |
Class R |
5.36% |
1.21% |
1.15% |
Bloomberg U.S. Aggregate Index |
4.88% |
(0.40%) |
1.46% |
ICE BofA 1-3 Year U.S. Treasury Index |
5.43% |
1.16% |
1.50% | |
| No Deduction of Taxes [Text Block] |
Returns shown do not reflect the deduction of taxes that a shareholder would pay on Fund distributions or the redemption of Fund shares.
|
| Performance Table Market Index Changed [Text Block] |
Differences in the Fund’s performance versus an index and related attribution information with respect to particular categories of securities or individual positions may be attributable, in part, to differences in the pricing methodologies used by the Fund and the index.
|
| Updated Performance Information Location [Text Block] |
For performance current to the most recent month-end, visit www.pimco.com/literature or via 888.87.PIMCO (888.877.4626).
|
| AssetsNet |
$ 6,633,082,000
|
| Holdings Count | Holding |
1,339
|
| Advisory Fees Paid, Amount |
$ 14,852,000
|
| InvestmentCompanyPortfolioTurnover |
497.00%
|
| Additional Fund Statistics [Text Block] |
Key Fund StatisticsFootnote Reference† (as of the end of the reporting period)
Total Net Assets |
$6,633,082 |
# of Portfolio Holdings |
1,339 |
Portfolio Turnover Rate |
497% |
Total Net Advisory Fees Paid During the Reporting Period |
$14,852 |
| Footnote |
Description |
Footnote† |
Dollar amounts displayed in 000's | |
| Holdings [Text Block] |
Security Type Breakdown (% of Net Asset Value)Footnote Reference*
U.S. Government Agencies |
39.6% |
U.S. Treasury Obligations |
17.5% |
Corporate Bonds & Notes |
12.6% |
Asset-Backed Securities |
7.4% |
Non-Agency Mortgage-Backed Securities |
4.6% |
Sovereign Issues |
2.3% |
Short-Term Instruments |
33.5% |
Affiliated Investments |
13.6% |
Financial Derivative Instruments |
0.0%Footnote Reference^ |
Other Assets and Liabilities, Net |
(31.1%) |
Total |
100.0% |
| Footnote |
Description |
Footnote^ |
Rounded value of investments is less than 0.1% of net assets. |
Footnote* |
% of Net Asset Value includes derivatives instruments, if any, valued at the value used for determining the Fund's net asset value. The notional exposure of such derivatives investments therefore may be greater than what is depicted. | |
| Material Fund Change [Text Block] |
|
| C000026583 |
|
| Shareholder Report [Line Items] |
|
| Fund Name |
PIMCO Low Duration Fund II
|
| Class Name |
Administrative Class
|
| Trading Symbol |
PDFAX
|
| Annual or Semi-Annual Statement [Text Block] |
This annual shareholder report contains important information about the PIMCO Low Duration Fund II (the "Fund") for the period of April 1, 2024 to March 31, 2025 (the "reporting period").
|
| Shareholder Report Annual or Semi-Annual |
Annual Shareholder Report
|
| Additional Information [Text Block] |
You can find additional information about the Fund at www.pimco.com/literature. You can also request this information by contacting us at 888.87.PIMCO (888.877.4626).
|
| Additional Information Phone Number |
888.87.PIMCO (888.877.4626)
|
| Expenses [Text Block] |
What were the Fund costs for the reporting period?(based on a hypothetical $10,000 investment)
Class Name |
Cost of a $10,000 investment |
Costs paid as a percentage of a $10,000 investment |
Administrative Class |
$78 |
0.76% | |
| Expenses Paid, Amount |
$ 78
|
| Expense Ratio, Percent |
0.76%
|
| Factors Affecting Performance [Text Block] |
How did the Fund perform during the reporting period and what affected its performance?The following affected performance (on a gross basis) during the reporting period: Overweight exposure to U.S. duration, specifically the 2-year part of the curve, contributed to relative performance versus the ICE BofA 1-3 Year U.S. Treasury Index ("Index"), as interest rates fell. Overweight exposure to agency mortgage-backed securities ("MBS") contributed to relative performance versus the Index, as spreads tightened. Overweight commercial MBS contributed to relative performance versus the Index, as short term commercial MBS had positive return. There were no material detractors for this Fund.
|
| Performance Past Does Not Indicate Future [Text] |
Performance quoted represents past performance. Past performance is not a guarantee or a reliable indicator of future results.
|
| Line Graph [Table Text Block] |
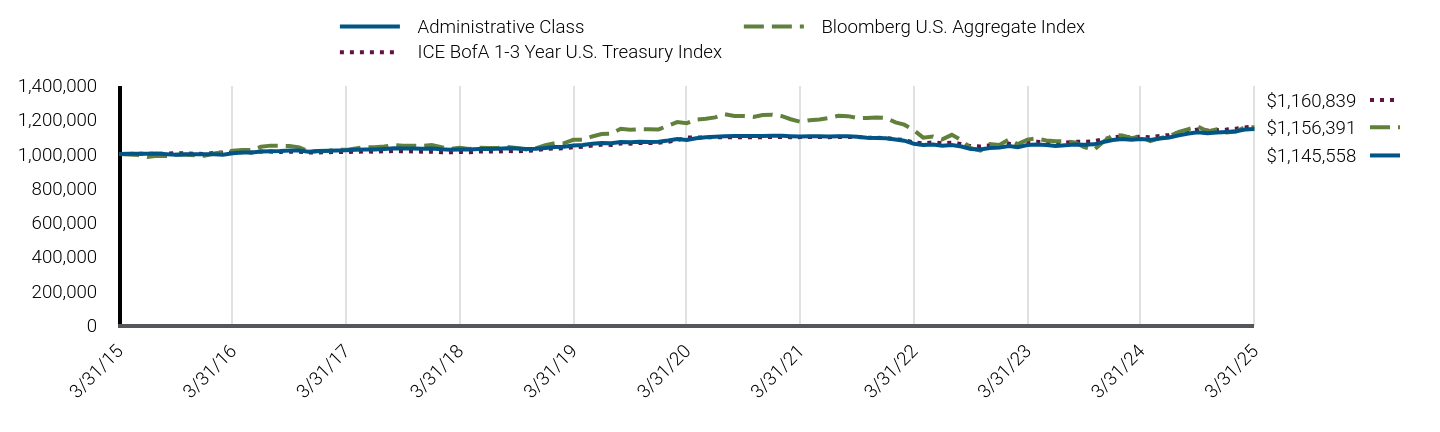
|
Administrative Class |
Bloomberg U.S. Aggregate Index |
ICE BofA 1-3 Year U.S. Treasury Index |
3/31/15 |
$1,000,000 |
$1,000,000 |
$1,000,000 |
4/30/15 |
$1,002,090 |
$996,412 |
$1,000,460 |
5/31/15 |
$1,001,700 |
$994,012 |
$1,001,200 |
6/30/15 |
$1,001,841 |
$983,174 |
$1,001,451 |
7/31/15 |
$1,002,343 |
$990,008 |
$1,001,971 |
8/31/15 |
$998,468 |
$988,586 |
$1,001,551 |
9/30/15 |
$995,399 |
$995,273 |
$1,004,585 |
10/31/15 |
$998,249 |
$995,439 |
$1,003,601 |
11/30/15 |
$997,911 |
$992,809 |
$1,001,132 |
12/31/15 |
$997,875 |
$989,601 |
$1,000,191 |
1/31/16 |
$998,399 |
$1,003,219 |
$1,006,282 |
2/29/16 |
$995,645 |
$1,010,335 |
$1,007,439 |
3/31/16 |
$1,004,057 |
$1,019,605 |
$1,009,192 |
4/30/16 |
$1,008,359 |
$1,023,519 |
$1,009,555 |
5/31/16 |
$1,009,041 |
$1,023,781 |
$1,008,485 |
6/30/16 |
$1,014,043 |
$1,042,177 |
$1,014,526 |
7/31/16 |
$1,015,918 |
$1,048,765 |
$1,013,948 |
8/31/16 |
$1,017,541 |
$1,047,566 |
$1,012,265 |
9/30/16 |
$1,021,035 |
$1,046,952 |
$1,013,439 |
10/31/16 |
$1,020,860 |
$1,038,944 |
$1,012,760 |
11/30/16 |
$1,013,788 |
$1,014,369 |
$1,008,739 |
12/31/16 |
$1,017,178 |
$1,015,800 |
$1,009,042 |
1/31/17 |
$1,018,897 |
$1,017,793 |
$1,010,313 |
2/28/17 |
$1,020,768 |
$1,024,634 |
$1,011,344 |
3/31/17 |
$1,021,833 |
$1,024,097 |
$1,011,667 |
4/30/17 |
$1,024,818 |
$1,032,000 |
$1,013,074 |
5/31/17 |
$1,026,711 |
$1,039,943 |
$1,014,249 |
6/30/17 |
$1,025,704 |
$1,038,896 |
$1,013,437 |
7/31/17 |
$1,028,695 |
$1,043,367 |
$1,015,596 |
8/31/17 |
$1,032,814 |
$1,052,726 |
$1,017,516 |
9/30/17 |
$1,031,704 |
$1,047,712 |
$1,015,847 |
10/31/17 |
$1,031,580 |
$1,048,319 |
$1,015,227 |
11/30/17 |
$1,030,446 |
$1,046,973 |
$1,013,176 |
12/31/17 |
$1,031,465 |
$1,051,778 |
$1,013,298 |
1/31/18 |
$1,027,223 |
$1,039,665 |
$1,010,390 |
2/28/18 |
$1,025,190 |
$1,029,809 |
$1,010,006 |
3/31/18 |
$1,026,582 |
$1,036,414 |
$1,011,985 |
4/30/18 |
$1,025,841 |
$1,028,705 |
$1,010,417 |
5/31/18 |
$1,029,527 |
$1,036,047 |
$1,014,075 |
6/30/18 |
$1,029,062 |
$1,034,773 |
$1,014,227 |
7/31/18 |
$1,030,641 |
$1,035,019 |
$1,014,176 |
8/31/18 |
$1,033,570 |
$1,041,679 |
$1,017,401 |
9/30/18 |
$1,032,051 |
$1,034,971 |
$1,016,201 |
10/31/18 |
$1,028,629 |
$1,026,792 |
$1,017,745 |
11/30/18 |
$1,030,756 |
$1,032,921 |
$1,021,277 |
12/31/18 |
$1,035,196 |
$1,051,898 |
$1,029,345 |
1/31/19 |
$1,041,195 |
$1,063,068 |
$1,032,114 |
2/28/19 |
$1,042,967 |
$1,062,452 |
$1,033,156 |
3/31/19 |
$1,049,553 |
$1,082,853 |
$1,039,469 |
4/30/19 |
$1,052,002 |
$1,083,130 |
$1,041,579 |
5/31/19 |
$1,059,178 |
$1,102,358 |
$1,048,974 |
6/30/19 |
$1,064,152 |
$1,116,201 |
$1,054,418 |
7/31/19 |
$1,063,151 |
$1,118,657 |
$1,053,174 |
8/31/19 |
$1,070,564 |
$1,147,643 |
$1,061,673 |
9/30/19 |
$1,069,259 |
$1,141,531 |
$1,060,495 |
10/31/19 |
$1,070,918 |
$1,144,969 |
$1,063,984 |
11/30/19 |
$1,069,409 |
$1,144,386 |
$1,063,643 |
12/31/19 |
$1,071,919 |
$1,143,588 |
$1,065,898 |
1/31/20 |
$1,078,816 |
$1,165,596 |
$1,071,665 |
2/29/20 |
$1,087,734 |
$1,186,575 |
$1,080,999 |
3/31/20 |
$1,081,835 |
$1,179,592 |
$1,095,830 |
4/30/20 |
$1,091,825 |
$1,200,561 |
$1,096,290 |
5/31/20 |
$1,097,229 |
$1,206,151 |
$1,097,003 |
6/30/20 |
$1,100,273 |
$1,213,749 |
$1,097,288 |
7/31/20 |
$1,103,205 |
$1,231,878 |
$1,098,397 |
8/31/20 |
$1,104,881 |
$1,221,935 |
$1,098,133 |
9/30/20 |
$1,104,376 |
$1,221,265 |
$1,098,429 |
10/31/20 |
$1,104,847 |
$1,215,812 |
$1,097,968 |
11/30/20 |
$1,105,187 |
$1,227,742 |
$1,098,473 |
12/31/20 |
$1,105,923 |
$1,229,433 |
$1,098,978 |
1/31/21 |
$1,106,084 |
$1,220,618 |
$1,099,143 |
2/28/21 |
$1,103,975 |
$1,202,992 |
$1,098,264 |
3/31/21 |
$1,101,746 |
$1,187,971 |
$1,098,473 |
4/30/21 |
$1,102,863 |
$1,197,356 |
$1,098,967 |
5/31/21 |
$1,103,979 |
$1,201,268 |
$1,099,802 |
6/30/21 |
$1,101,746 |
$1,209,708 |
$1,098,097 |
7/31/21 |
$1,103,979 |
$1,223,233 |
$1,099,920 |
8/31/21 |
$1,102,863 |
$1,220,905 |
$1,099,832 |
9/30/21 |
$1,100,630 |
$1,210,334 |
$1,098,732 |
10/31/21 |
$1,095,049 |
$1,210,000 |
$1,095,392 |
11/30/21 |
$1,093,933 |
$1,213,580 |
$1,095,601 |
12/31/21 |
$1,092,090 |
$1,210,475 |
$1,092,883 |
1/31/22 |
$1,084,273 |
$1,184,396 |
$1,085,725 |
2/28/22 |
$1,077,573 |
$1,171,183 |
$1,081,664 |
3/31/22 |
$1,059,707 |
$1,138,645 |
$1,067,267 |
4/30/22 |
$1,051,897 |
$1,095,436 |
$1,062,198 |
5/31/22 |
$1,055,805 |
$1,102,499 |
$1,068,072 |
6/30/22 |
$1,048,839 |
$1,085,203 |
$1,061,898 |
7/31/22 |
$1,052,168 |
$1,111,719 |
$1,065,456 |
8/31/22 |
$1,043,587 |
$1,080,306 |
$1,057,784 |
9/30/22 |
$1,029,710 |
$1,033,630 |
$1,045,324 |
10/31/22 |
$1,025,929 |
$1,020,242 |
$1,044,289 |
11/30/22 |
$1,035,011 |
$1,057,762 |
$1,050,858 |
12/31/22 |
$1,037,169 |
$1,052,991 |
$1,053,012 |
1/31/23 |
$1,046,666 |
$1,085,385 |
$1,060,225 |
2/28/23 |
$1,039,234 |
$1,057,322 |
$1,052,570 |
3/31/23 |
$1,052,839 |
$1,084,180 |
$1,069,359 |
4/30/23 |
$1,055,748 |
$1,090,751 |
$1,072,128 |
5/31/23 |
$1,052,206 |
$1,078,874 |
$1,068,429 |
6/30/23 |
$1,046,392 |
$1,075,027 |
$1,063,247 |
7/31/23 |
$1,050,620 |
$1,074,277 |
$1,067,033 |
8/31/23 |
$1,055,190 |
$1,067,415 |
$1,071,226 |
9/30/23 |
$1,053,988 |
$1,040,290 |
$1,071,130 |
10/31/23 |
$1,056,189 |
$1,023,873 |
$1,074,750 |
11/30/23 |
$1,068,965 |
$1,070,241 |
$1,085,648 |
12/31/23 |
$1,081,901 |
$1,111,209 |
$1,097,818 |
1/31/24 |
$1,087,596 |
$1,108,157 |
$1,102,045 |
2/29/24 |
$1,083,846 |
$1,092,501 |
$1,097,504 |
3/31/24 |
$1,087,393 |
$1,102,589 |
$1,101,071 |
4/30/24 |
$1,082,534 |
$1,074,739 |
$1,097,504 |
5/31/24 |
$1,091,020 |
$1,092,959 |
$1,105,044 |
6/30/24 |
$1,096,548 |
$1,103,307 |
$1,111,420 |
7/31/24 |
$1,108,462 |
$1,129,077 |
$1,124,134 |
8/31/24 |
$1,119,321 |
$1,145,301 |
$1,134,218 |
9/30/24 |
$1,127,358 |
$1,160,636 |
$1,143,337 |
10/31/24 |
$1,121,230 |
$1,131,854 |
$1,136,637 |
11/30/24 |
$1,124,806 |
$1,143,821 |
$1,139,967 |
12/31/24 |
$1,128,521 |
$1,125,101 |
$1,142,658 |
1/31/25 |
$1,133,123 |
$1,131,070 |
$1,147,594 |
2/28/25 |
$1,142,341 |
$1,155,956 |
$1,155,455 |
3/31/25 |
$1,145,558 |
$1,156,391 |
$1,160,839 |
|
| Average Annual Return [Table Text Block] |
Class/Index Name |
1 Year |
5 Years |
10 Years |
Administrative Class |
5.35% |
1.15% |
1.37% |
Bloomberg U.S. Aggregate Index |
4.88% |
(0.40%) |
1.46% |
ICE BofA 1-3 Year U.S. Treasury Index |
5.43% |
1.16% |
1.50% | |
| No Deduction of Taxes [Text Block] |
Returns shown do not reflect the deduction of taxes that a shareholder would pay on Fund distributions or the redemption of Fund shares.
|
| Performance Table Market Index Changed [Text Block] |
Differences in the Fund’s performance versus an index and related attribution information with respect to particular categories of securities or individual positions may be attributable, in part, to differences in the pricing methodologies used by the Fund and the index.
|
| Updated Performance Information Location [Text Block] |
For performance current to the most recent month-end, visit www.pimco.com/literature or via 888.87.PIMCO (888.877.4626).
|
| AssetsNet |
$ 273,595,000
|
| Holdings Count | Holding |
329
|
| Advisory Fees Paid, Amount |
$ 733,000
|
| InvestmentCompanyPortfolioTurnover |
322.00%
|
| Additional Fund Statistics [Text Block] |
Key Fund StatisticsFootnote Reference† (as of the end of the reporting period)
Total Net Assets |
$273,595 |
# of Portfolio Holdings |
329 |
Portfolio Turnover Rate |
322% |
Total Net Advisory Fees Paid During the Reporting Period |
$733 |
| Footnote |
Description |
Footnote† |
Dollar amounts displayed in 000's | |
| Holdings [Text Block] |
Security Type Breakdown (% of Net Asset Value)Footnote Reference*
U.S. Government Agencies |
43.1% |
U.S. Treasury Obligations |
20.1% |
Non-Agency Mortgage-Backed Securities |
8.5% |
Corporate Bonds & Notes |
7.3% |
Asset-Backed Securities |
6.2% |
Short-Term Instruments |
19.2% |
Affiliated Investments |
15.5% |
Financial Derivative Instruments |
0.0%Footnote Reference^ |
Other Assets and Liabilities, Net |
(19.9%) |
Total |
100.0% |
| Footnote |
Description |
Footnote^ |
Rounded value of investments is less than 0.1% of net assets. |
Footnote* |
% of Net Asset Value includes derivatives instruments, if any, valued at the value used for determining the Fund's net asset value. The notional exposure of such derivatives investments therefore may be greater than what is depicted. | |
| Material Fund Change [Text Block] |
|
| C000026582 |
|
| Shareholder Report [Line Items] |
|
| Fund Name |
PIMCO Low Duration Fund II
|
| Class Name |
Institutional Class
|
| Trading Symbol |
PLDTX
|
| Annual or Semi-Annual Statement [Text Block] |
This annual shareholder report contains important information about the PIMCO Low Duration Fund II (the "Fund") for the period of April 1, 2024 to March 31, 2025 (the "reporting period").
|
| Shareholder Report Annual or Semi-Annual |
Annual Shareholder Report
|
| Additional Information [Text Block] |
You can find additional information about the Fund at www.pimco.com/literature. You can also request this information by contacting us at 888.87.PIMCO (888.877.4626).
|
| Additional Information Phone Number |
888.87.PIMCO (888.877.4626)
|
| Expenses [Text Block] |
What were the Fund costs for the reporting period?(based on a hypothetical $10,000 investment)
Class Name |
Cost of a $10,000 investment |
Costs paid as a percentage of a $10,000 investment |
Institutional Class |
$52 |
0.51% | |
| Expenses Paid, Amount |
$ 52
|
| Expense Ratio, Percent |
0.51%
|
| Factors Affecting Performance [Text Block] |
How did the Fund perform during the reporting period and what affected its performance?The following affected performance (on a gross basis) during the reporting period: Overweight exposure to U.S. duration, specifically the 2-year part of the curve, contributed to relative performance versus the ICE BofA 1-3 Year U.S. Treasury Index ("Index"), as interest rates fell. Overweight exposure to agency mortgage-backed securities ("MBS") contributed to relative performance versus the Index, as spreads tightened. Overweight commercial MBS contributed to relative performance versus the Index, as short term commercial MBS had positive return. There were no material detractors for this Fund.
|
| Performance Past Does Not Indicate Future [Text] |
Performance quoted represents past performance. Past performance is not a guarantee or a reliable indicator of future results.
|
| Line Graph [Table Text Block] |
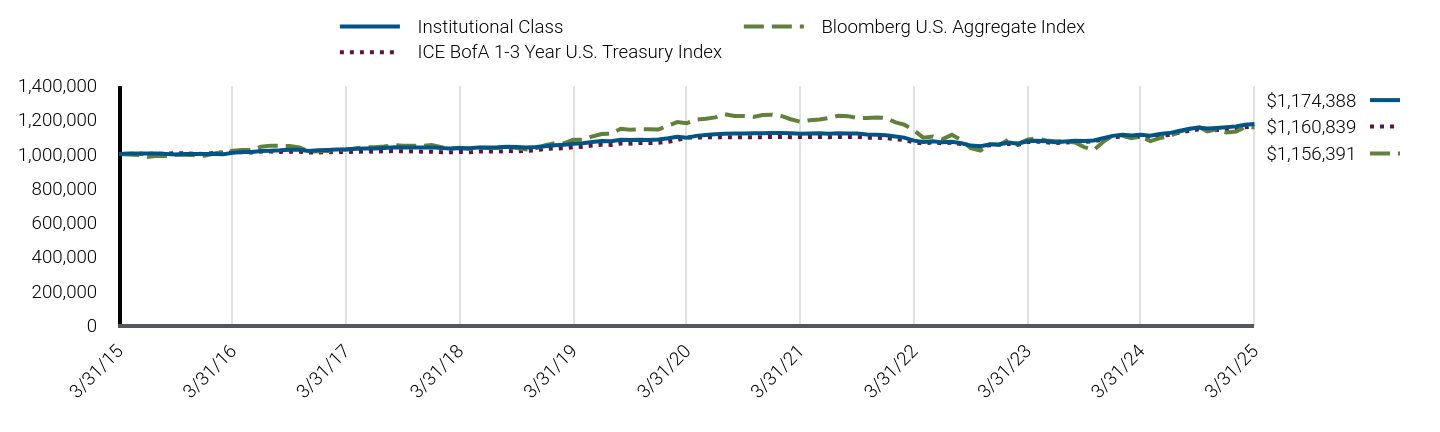
|
Institutional Class |
Bloomberg U.S. Aggregate Index |
ICE BofA 1-3 Year U.S. Treasury Index |
3/31/15 |
$1,000,000 |
$1,000,000 |
$1,000,000 |
4/30/15 |
$1,002,320 |
$996,412 |
$1,000,460 |
5/31/15 |
$1,002,142 |
$994,012 |
$1,001,200 |
6/30/15 |
$1,002,488 |
$983,174 |
$1,001,451 |
7/31/15 |
$1,003,216 |
$990,008 |
$1,001,971 |
8/31/15 |
$999,537 |
$988,586 |
$1,001,551 |
9/30/15 |
$996,669 |
$995,273 |
$1,004,585 |
10/31/15 |
$999,741 |
$995,439 |
$1,003,601 |
11/30/15 |
$999,599 |
$992,809 |
$1,001,132 |
12/31/15 |
$999,795 |
$989,601 |
$1,000,191 |
1/31/16 |
$1,000,511 |
$1,003,219 |
$1,006,282 |
2/29/16 |
$997,949 |
$1,010,335 |
$1,007,439 |
3/31/16 |
$1,006,592 |
$1,019,605 |
$1,009,192 |
4/30/16 |
$1,011,117 |
$1,023,519 |
$1,009,555 |
5/31/16 |
$1,012,003 |
$1,023,781 |
$1,008,485 |
6/30/16 |
$1,017,227 |
$1,042,177 |
$1,014,526 |
7/31/16 |
$1,019,325 |
$1,048,765 |
$1,013,948 |
8/31/16 |
$1,021,169 |
$1,047,566 |
$1,012,265 |
9/30/16 |
$1,024,900 |
$1,046,952 |
$1,013,439 |
10/31/16 |
$1,024,929 |
$1,038,944 |
$1,012,760 |
11/30/16 |
$1,018,038 |
$1,014,369 |
$1,008,739 |
12/31/16 |
$1,021,672 |
$1,015,800 |
$1,009,042 |
1/31/17 |
$1,023,600 |
$1,017,793 |
$1,010,313 |
2/28/17 |
$1,025,676 |
$1,024,634 |
$1,011,344 |
3/31/17 |
$1,026,978 |
$1,024,097 |
$1,011,667 |
4/30/17 |
$1,030,175 |
$1,032,000 |
$1,013,074 |
5/31/17 |
$1,032,298 |
$1,039,943 |
$1,014,249 |
6/30/17 |
$1,031,511 |
$1,038,896 |
$1,013,437 |
7/31/17 |
$1,034,724 |
$1,043,367 |
$1,015,596 |
8/31/17 |
$1,039,088 |
$1,052,726 |
$1,017,516 |
9/30/17 |
$1,038,191 |
$1,047,712 |
$1,015,847 |
10/31/17 |
$1,038,280 |
$1,048,319 |
$1,015,227 |
11/30/17 |
$1,037,351 |
$1,046,973 |
$1,013,176 |
12/31/17 |
$1,038,604 |
$1,051,778 |
$1,013,298 |
1/31/18 |
$1,034,546 |
$1,039,665 |
$1,010,390 |
2/28/18 |
$1,032,696 |
$1,029,809 |
$1,010,006 |
3/31/18 |
$1,034,325 |
$1,036,414 |
$1,011,985 |
4/30/18 |
$1,033,784 |
$1,028,705 |
$1,010,417 |
5/31/18 |
$1,037,718 |
$1,036,047 |
$1,014,075 |
6/30/18 |
$1,037,470 |
$1,034,773 |
$1,014,227 |
7/31/18 |
$1,039,274 |
$1,035,019 |
$1,014,176 |
8/31/18 |
$1,042,471 |
$1,041,679 |
$1,017,401 |
9/30/18 |
$1,041,130 |
$1,034,971 |
$1,016,201 |
10/31/18 |
$1,037,898 |
$1,026,792 |
$1,017,745 |
11/30/18 |
$1,040,272 |
$1,032,921 |
$1,021,277 |
12/31/18 |
$1,044,967 |
$1,051,898 |
$1,029,345 |
1/31/19 |
$1,051,238 |
$1,063,068 |
$1,032,114 |
2/28/19 |
$1,053,229 |
$1,062,452 |
$1,033,156 |
3/31/19 |
$1,060,103 |
$1,082,853 |
$1,039,469 |
4/30/19 |
$1,062,793 |
$1,083,130 |
$1,041,579 |
5/31/19 |
$1,070,275 |
$1,102,358 |
$1,048,974 |
6/30/19 |
$1,075,506 |
$1,116,201 |
$1,054,418 |
7/31/19 |
$1,074,722 |
$1,118,657 |
$1,053,174 |
8/31/19 |
$1,082,459 |
$1,147,643 |
$1,061,673 |
9/30/19 |
$1,081,346 |
$1,141,531 |
$1,060,495 |
10/31/19 |
$1,083,252 |
$1,144,969 |
$1,063,984 |
11/30/19 |
$1,081,955 |
$1,144,386 |
$1,063,643 |
12/31/19 |
$1,084,723 |
$1,143,588 |
$1,065,898 |
1/31/20 |
$1,091,940 |
$1,165,596 |
$1,071,665 |
2/29/20 |
$1,101,175 |
$1,186,575 |
$1,080,999 |
3/31/20 |
$1,095,428 |
$1,179,592 |
$1,095,830 |
4/30/20 |
$1,105,769 |
$1,200,561 |
$1,096,290 |
5/31/20 |
$1,111,478 |
$1,206,151 |
$1,097,003 |
6/30/20 |
$1,114,790 |
$1,213,749 |
$1,097,288 |
7/31/20 |
$1,118,013 |
$1,231,878 |
$1,098,397 |
8/31/20 |
$1,119,933 |
$1,221,935 |
$1,098,133 |
9/30/20 |
$1,119,651 |
$1,221,265 |
$1,098,429 |
10/31/20 |
$1,120,374 |
$1,215,812 |
$1,097,968 |
11/30/20 |
$1,120,941 |
$1,227,742 |
$1,098,473 |
12/31/20 |
$1,121,950 |
$1,229,433 |
$1,098,978 |
1/31/21 |
$1,122,328 |
$1,220,618 |
$1,099,143 |
2/28/21 |
$1,120,403 |
$1,202,992 |
$1,098,264 |
3/31/21 |
$1,118,362 |
$1,187,971 |
$1,098,473 |
4/30/21 |
$1,119,698 |
$1,197,356 |
$1,098,967 |
5/31/21 |
$1,120,980 |
$1,201,268 |
$1,099,802 |
6/30/21 |
$1,118,845 |
$1,209,708 |
$1,098,097 |
7/31/21 |
$1,121,213 |
$1,223,233 |
$1,099,920 |
8/31/21 |
$1,120,166 |
$1,220,905 |
$1,099,832 |
9/30/21 |
$1,119,195 |
$1,210,334 |
$1,098,732 |
10/31/21 |
$1,113,692 |
$1,210,000 |
$1,095,392 |
11/30/21 |
$1,111,608 |
$1,213,580 |
$1,095,601 |
12/31/21 |
$1,110,017 |
$1,210,475 |
$1,092,883 |
1/31/22 |
$1,102,246 |
$1,184,396 |
$1,085,725 |
2/28/22 |
$1,095,721 |
$1,171,183 |
$1,081,664 |
3/31/22 |
$1,077,932 |
$1,138,645 |
$1,067,267 |
4/30/22 |
$1,070,568 |
$1,095,436 |
$1,062,198 |
5/31/22 |
$1,074,764 |
$1,102,499 |
$1,068,072 |
6/30/22 |
$1,067,893 |
$1,085,203 |
$1,061,898 |
7/31/22 |
$1,071,509 |
$1,111,719 |
$1,065,456 |
8/31/22 |
$1,062,997 |
$1,080,306 |
$1,057,784 |
9/30/22 |
$1,049,093 |
$1,033,630 |
$1,045,324 |
10/31/22 |
$1,045,448 |
$1,020,242 |
$1,044,289 |
11/30/22 |
$1,054,919 |
$1,057,762 |
$1,050,858 |
12/31/22 |
$1,057,357 |
$1,052,991 |
$1,053,012 |
1/31/23 |
$1,067,249 |
$1,085,385 |
$1,060,225 |
2/28/23 |
$1,059,873 |
$1,057,322 |
$1,052,570 |
3/31/23 |
$1,073,990 |
$1,084,180 |
$1,069,359 |
4/30/23 |
$1,077,163 |
$1,090,751 |
$1,072,128 |
5/31/23 |
$1,073,776 |
$1,078,874 |
$1,068,429 |
6/30/23 |
$1,068,077 |
$1,075,027 |
$1,063,247 |
7/31/23 |
$1,072,604 |
$1,074,277 |
$1,067,033 |
8/31/23 |
$1,077,497 |
$1,067,415 |
$1,071,226 |
9/30/23 |
$1,076,497 |
$1,040,290 |
$1,071,130 |
10/31/23 |
$1,078,966 |
$1,023,873 |
$1,074,750 |
11/30/23 |
$1,092,239 |
$1,070,241 |
$1,085,648 |
12/31/23 |
$1,105,697 |
$1,111,209 |
$1,097,818 |
1/31/24 |
$1,111,743 |
$1,108,157 |
$1,102,045 |
2/29/24 |
$1,108,129 |
$1,092,501 |
$1,097,504 |
3/31/24 |
$1,111,990 |
$1,102,589 |
$1,101,071 |
4/30/24 |
$1,107,248 |
$1,074,739 |
$1,097,504 |
5/31/24 |
$1,116,179 |
$1,092,959 |
$1,105,044 |
6/30/24 |
$1,122,049 |
$1,103,307 |
$1,111,420 |
7/31/24 |
$1,134,478 |
$1,129,077 |
$1,124,134 |
8/31/24 |
$1,145,850 |
$1,145,301 |
$1,134,218 |
9/30/24 |
$1,154,297 |
$1,160,636 |
$1,143,337 |
10/31/24 |
$1,148,266 |
$1,131,854 |
$1,136,637 |
11/30/24 |
$1,152,172 |
$1,143,821 |
$1,139,967 |
12/31/24 |
$1,156,222 |
$1,125,101 |
$1,142,658 |
1/31/25 |
$1,161,189 |
$1,131,070 |
$1,147,594 |
2/28/25 |
$1,170,858 |
$1,155,956 |
$1,155,455 |
3/31/25 |
$1,174,388 |
$1,156,391 |
$1,160,839 |
|
| Average Annual Return [Table Text Block] |
Class/Index Name |
1 Year |
5 Years |
10 Years |
Institutional Class |
5.61% |
1.40% |
1.62% |
Bloomberg U.S. Aggregate Index |
4.88% |
(0.40%) |
1.46% |
ICE BofA 1-3 Year U.S. Treasury Index |
5.43% |
1.16% |
1.50% | |
| No Deduction of Taxes [Text Block] |
Returns shown do not reflect the deduction of taxes that a shareholder would pay on Fund distributions or the redemption of Fund shares.
|
| Performance Table Market Index Changed [Text Block] |
Differences in the Fund’s performance versus an index and related attribution information with respect to particular categories of securities or individual positions may be attributable, in part, to differences in the pricing methodologies used by the Fund and the index.
|
| Updated Performance Information Location [Text Block] |
For performance current to the most recent month-end, visit www.pimco.com/literature or via 888.87.PIMCO (888.877.4626).
|
| AssetsNet |
$ 273,595,000
|
| Holdings Count | Holding |
329
|
| Advisory Fees Paid, Amount |
$ 733,000
|
| InvestmentCompanyPortfolioTurnover |
322.00%
|
| Additional Fund Statistics [Text Block] |
Key Fund StatisticsFootnote Reference† (as of the end of the reporting period)
Total Net Assets |
$273,595 |
# of Portfolio Holdings |
329 |
Portfolio Turnover Rate |
322% |
Total Net Advisory Fees Paid During the Reporting Period |
$733 |
| Footnote |
Description |
Footnote† |
Dollar amounts displayed in 000's | |
| Holdings [Text Block] |
Security Type Breakdown (% of Net Asset Value)Footnote Reference*
U.S. Government Agencies |
43.1% |
U.S. Treasury Obligations |
20.1% |
Non-Agency Mortgage-Backed Securities |
8.5% |
Corporate Bonds & Notes |
7.3% |
Asset-Backed Securities |
6.2% |
Short-Term Instruments |
19.2% |
Affiliated Investments |
15.5% |
Financial Derivative Instruments |
0.0%Footnote Reference^ |
Other Assets and Liabilities, Net |
(19.9%) |
Total |
100.0% |
| Footnote |
Description |
Footnote^ |
Rounded value of investments is less than 0.1% of net assets. |
Footnote* |
% of Net Asset Value includes derivatives instruments, if any, valued at the value used for determining the Fund's net asset value. The notional exposure of such derivatives investments therefore may be greater than what is depicted. | |
| Material Fund Change [Text Block] |
|
| C000026608 |
|
| Shareholder Report [Line Items] |
|
| Fund Name |
PIMCO Real Return Fund
|
| Class Name |
Class A
|
| Trading Symbol |
PRTNX
|
| Annual or Semi-Annual Statement [Text Block] |
This annual shareholder report contains important information about the PIMCO Real Return Fund (the "Fund") for the period of April 1, 2024 to March 31, 2025 (the "reporting period").
|
| Shareholder Report Annual or Semi-Annual |
Annual Shareholder Report
|
| Additional Information [Text Block] |
You can find additional information about the Fund at www.pimco.com/literature. You can also request this information by contacting us at 888.87.PIMCO (888.877.4626).
|
| Material Fund Change Notice [Text Block] |
This report describes changes to the Fund that occurred during the reporting period.
|
| Additional Information Phone Number |
888.87.PIMCO (888.877.4626)
|
| Expenses [Text Block] |
What were the Fund costs for the reporting period?(based on a hypothetical $10,000 investment)
Class Name |
Cost of a $10,000 investment |
Costs paid as a percentage of a $10,000 investment |
Class A |
$98 |
0.95% | |
| Expenses Paid, Amount |
$ 98
|
| Expense Ratio, Percent |
0.95%
|
| Factors Affecting Performance [Text Block] |
How did the Fund perform during the reporting period and what affected its performance?The following affected performance (on a gross basis) during the reporting period: Eurozone interest rate strategies, including short exposure to duration and exposure to swap spreads, contributed to relative performance versus the Bloomberg U.S. TIPS Index ("Index"), as eurozone rates rose, while swaps spreads tightened. U.S. yield curve positioning, specifically overweight exposure to intermediate maturities relative to underweight exposure to long-term maturities, contributed to relative performance versus the Index, as the U.S. yield curve steepened. Overweight exposure to intermediate U.S. breakeven inflation contributed to relative performance versus the Index, as intermediate U.S. breakeven inflation rose. Exposure to securitized assets, including non-agency residential mortgage-backed securities and collateralized loan obligations, contributed to relative performance versus the Index, as spreads broadly tightened across these sectors. Long exposure to U.K. duration detracted from relative performance versus the Index, as U.K. interest rates broadly moved higher. There were no other material detractors for this Fund.
|
| Performance Past Does Not Indicate Future [Text] |
Performance quoted represents past performance. Past performance is not a guarantee or a reliable indicator of future results.
|
| Line Graph [Table Text Block] |

|
Class A (including sales charge) |
Bloomberg U.S. Aggregate Index |
Bloomberg U.S. TIPS Index |
3/31/15 |
$9,625 |
$10,000 |
$10,000 |
4/30/15 |
$9,664 |
$9,964 |
$10,074 |
5/31/15 |
$9,555 |
$9,940 |
$9,991 |
6/30/15 |
$9,454 |
$9,832 |
$9,894 |
7/31/15 |
$9,528 |
$9,900 |
$9,914 |
8/31/15 |
$9,384 |
$9,886 |
$9,838 |
9/30/15 |
$9,274 |
$9,953 |
$9,780 |
10/31/15 |
$9,339 |
$9,954 |
$9,805 |
11/30/15 |
$9,299 |
$9,928 |
$9,795 |
12/31/15 |
$9,188 |
$9,896 |
$9,718 |
1/31/16 |
$9,297 |
$10,032 |
$9,862 |
2/29/16 |
$9,318 |
$10,103 |
$9,972 |
3/31/16 |
$9,558 |
$10,196 |
$10,151 |
4/30/16 |
$9,606 |
$10,235 |
$10,186 |
5/31/16 |
$9,522 |
$10,238 |
$10,114 |
6/30/16 |
$9,728 |
$10,422 |
$10,324 |
7/31/16 |
$9,811 |
$10,488 |
$10,414 |
8/31/16 |
$9,780 |
$10,476 |
$10,367 |
9/30/16 |
$9,854 |
$10,470 |
$10,424 |
10/31/16 |
$9,814 |
$10,389 |
$10,382 |
11/30/16 |
$9,617 |
$10,144 |
$10,183 |
12/31/16 |
$9,613 |
$10,158 |
$10,173 |
1/31/17 |
$9,723 |
$10,178 |
$10,259 |
2/28/17 |
$9,770 |
$10,246 |
$10,307 |
3/31/17 |
$9,784 |
$10,241 |
$10,301 |
4/30/17 |
$9,838 |
$10,320 |
$10,362 |
5/31/17 |
$9,831 |
$10,399 |
$10,358 |
6/30/17 |
$9,745 |
$10,389 |
$10,260 |
7/31/17 |
$9,790 |
$10,434 |
$10,305 |
8/31/17 |
$9,888 |
$10,527 |
$10,415 |
9/30/17 |
$9,830 |
$10,477 |
$10,348 |
10/31/17 |
$9,849 |
$10,483 |
$10,370 |
11/30/17 |
$9,855 |
$10,470 |
$10,384 |
12/31/17 |
$9,950 |
$10,518 |
$10,479 |
1/31/18 |
$9,864 |
$10,397 |
$10,389 |
2/28/18 |
$9,760 |
$10,298 |
$10,288 |
3/31/18 |
$9,840 |
$10,364 |
$10,396 |
4/30/18 |
$9,836 |
$10,287 |
$10,390 |
5/31/18 |
$9,840 |
$10,360 |
$10,434 |
6/30/18 |
$9,906 |
$10,348 |
$10,476 |
7/31/18 |
$9,871 |
$10,350 |
$10,426 |
8/31/18 |
$9,904 |
$10,417 |
$10,501 |
9/30/18 |
$9,816 |
$10,350 |
$10,390 |
10/31/18 |
$9,655 |
$10,268 |
$10,242 |
11/30/18 |
$9,690 |
$10,329 |
$10,290 |
12/31/18 |
$9,715 |
$10,519 |
$10,347 |
1/31/19 |
$9,885 |
$10,631 |
$10,486 |
2/28/19 |
$9,870 |
$10,625 |
$10,484 |
3/31/19 |
$10,049 |
$10,829 |
$10,677 |
4/30/19 |
$10,081 |
$10,831 |
$10,713 |
5/31/19 |
$10,248 |
$11,024 |
$10,890 |
6/30/19 |
$10,310 |
$11,162 |
$10,983 |
7/31/19 |
$10,343 |
$11,187 |
$11,022 |
8/31/19 |
$10,525 |
$11,476 |
$11,284 |
9/30/19 |
$10,416 |
$11,415 |
$11,131 |
10/31/19 |
$10,420 |
$11,450 |
$11,159 |
11/30/19 |
$10,445 |
$11,444 |
$11,176 |
12/31/19 |
$10,501 |
$11,436 |
$11,219 |
1/31/20 |
$10,730 |
$11,656 |
$11,454 |
2/29/20 |
$10,818 |
$11,866 |
$11,613 |
3/31/20 |
$10,571 |
$11,796 |
$11,409 |
4/30/20 |
$10,905 |
$12,006 |
$11,726 |
5/31/20 |
$10,984 |
$12,062 |
$11,761 |
6/30/20 |
$11,130 |
$12,137 |
$11,892 |
7/31/20 |
$11,417 |
$12,319 |
$12,166 |
8/31/20 |
$11,543 |
$12,219 |
$12,299 |
9/30/20 |
$11,501 |
$12,213 |
$12,253 |
10/31/20 |
$11,428 |
$12,158 |
$12,174 |
11/30/20 |
$11,579 |
$12,277 |
$12,311 |
12/31/20 |
$11,723 |
$12,294 |
$12,452 |
1/31/21 |
$11,785 |
$12,206 |
$12,493 |
2/28/21 |
$11,579 |
$12,030 |
$12,292 |
3/31/21 |
$11,556 |
$11,880 |
$12,269 |
4/30/21 |
$11,733 |
$11,974 |
$12,440 |
5/31/21 |
$11,861 |
$12,013 |
$12,591 |
6/30/21 |
$11,916 |
$12,097 |
$12,667 |
7/31/21 |
$12,213 |
$12,232 |
$13,005 |
8/31/21 |
$12,187 |
$12,209 |
$12,982 |
9/30/21 |
$12,093 |
$12,103 |
$12,889 |
10/31/21 |
$12,172 |
$12,100 |
$13,035 |
11/30/21 |
$12,269 |
$12,136 |
$13,152 |
12/31/21 |
$12,339 |
$12,105 |
$13,194 |
1/31/22 |
$12,042 |
$11,844 |
$12,927 |
2/28/22 |
$12,121 |
$11,712 |
$13,037 |
3/31/22 |
$11,953 |
$11,386 |
$12,795 |
4/30/22 |
$11,702 |
$10,954 |
$12,533 |
5/31/22 |
$11,572 |
$11,025 |
$12,409 |
6/30/22 |
$11,174 |
$10,852 |
$12,016 |
7/31/22 |
$11,668 |
$11,117 |
$12,539 |
8/31/22 |
$11,348 |
$10,803 |
$12,206 |
9/30/22 |
$10,558 |
$10,336 |
$11,398 |
10/31/22 |
$10,722 |
$10,202 |
$11,540 |
11/30/22 |
$10,910 |
$10,578 |
$11,750 |
12/31/22 |
$10,832 |
$10,530 |
$11,631 |
1/31/23 |
$11,020 |
$10,854 |
$11,844 |
2/28/23 |
$10,862 |
$10,573 |
$11,681 |
3/31/23 |
$11,146 |
$10,842 |
$12,019 |
4/30/23 |
$11,160 |
$10,908 |
$12,032 |
5/31/23 |
$11,004 |
$10,789 |
$11,888 |
6/30/23 |
$10,979 |
$10,750 |
$11,848 |
7/31/23 |
$11,008 |
$10,743 |
$11,863 |
8/31/23 |
$10,906 |
$10,674 |
$11,757 |
9/30/23 |
$10,714 |
$10,403 |
$11,540 |
10/31/23 |
$10,624 |
$10,239 |
$11,457 |
11/30/23 |
$10,919 |
$10,702 |
$11,767 |
12/31/23 |
$11,192 |
$11,112 |
$12,084 |
1/31/24 |
$11,241 |
$11,082 |
$12,105 |
2/29/24 |
$11,134 |
$10,925 |
$11,975 |
3/31/24 |
$11,218 |
$11,026 |
$12,074 |
4/30/24 |
$11,027 |
$10,747 |
$11,870 |
5/31/24 |
$11,235 |
$10,930 |
$12,074 |
6/30/24 |
$11,309 |
$11,033 |
$12,169 |
7/31/24 |
$11,531 |
$11,291 |
$12,386 |
8/31/24 |
$11,620 |
$11,453 |
$12,483 |
9/30/24 |
$11,784 |
$11,606 |
$12,670 |
10/31/24 |
$11,552 |
$11,319 |
$12,443 |
11/30/24 |
$11,627 |
$11,438 |
$12,503 |
12/31/24 |
$11,436 |
$11,251 |
$12,306 |
1/31/25 |
$11,601 |
$11,311 |
$12,465 |
2/28/25 |
$11,870 |
$11,560 |
$12,736 |
3/31/25 |
$11,963 |
$11,564 |
$12,818 |
|
| Average Annual Return [Table Text Block] |
Class/Index Name |
1 Year |
5 Years |
10 Years |
Class A (excluding sales charge) |
6.64% |
2.50% |
2.20% |
Class A (including sales charge) |
2.64% |
1.72% |
1.81% |
Bloomberg U.S. Aggregate Index |
4.88% |
(0.40%) |
1.46% |
Bloomberg U.S. TIPS Index |
6.17% |
2.36% |
2.51% | |
| No Deduction of Taxes [Text Block] |
Returns shown do not reflect the deduction of taxes that a shareholder would pay on Fund distributions or the redemption of Fund shares.
|
| Performance Table Market Index Changed [Text Block] |
Differences in the Fund’s performance versus an index and related attribution information with respect to particular categories of securities or individual positions may be attributable, in part, to differences in the pricing methodologies used by the Fund and the index.
|
| Updated Performance Information Location [Text Block] |
For performance current to the most recent month-end, visit www.pimco.com/literature or via 888.87.PIMCO (888.877.4626).
|
| AssetsNet |
$ 7,684,588,000
|
| Holdings Count | Holding |
1,305
|
| Advisory Fees Paid, Amount |
$ 19,202,000
|
| InvestmentCompanyPortfolioTurnover |
227.00%
|
| Additional Fund Statistics [Text Block] |
Key Fund StatisticsFootnote Reference† (as of the end of the reporting period)
Total Net Assets |
$7,684,588 |
# of Portfolio Holdings |
1,305 |
Portfolio Turnover Rate |
227% |
Total Net Advisory Fees Paid During the Reporting Period |
$19,202 |
| Footnote |
Description |
Footnote† |
Dollar amounts displayed in 000's | |
| Holdings [Text Block] |
Security Type Breakdown (% of Net Asset Value)Footnote Reference*
U.S. Treasury Obligations |
89.4% |
U.S. Government Agencies |
14.9% |
Asset-Backed Securities |
8.4% |
Sovereign Issues |
8.1% |
Non-Agency Mortgage-Backed Securities |
1.3% |
Corporate Bonds & Notes |
0.3% |
Other Investments |
0.1% |
Short-Term Instruments |
0.2% |
Affiliated Investments |
0.2% |
Financial Derivative Instruments |
(0.1%) |
Other Assets and Liabilities, Net |
(22.8%) |
Total |
100.0% |
| Footnote |
Description |
Footnote* |
% of Net Asset Value includes derivatives instruments, if any, valued at the value used for determining the Fund's net asset value. The notional exposure of such derivatives investments therefore may be greater than what is depicted. | |
| Material Fund Change [Text Block] |
This is a summary of certain changes and planned changes of the Fund since the beginning of the reporting period. For more information, you may refer to the Fund's next prospectus, which we expect to be available by July 31, 2025 or upon request at 888.87.PIMCO (888.877.4626). Changes to Total Annual Fund Operating Expenses. Annual fund operating expenses increased during the year by 0.05% as a result of higher expenses related to interest. |
| Material Fund Change Expenses [Text Block] |
Changes to Total Annual Fund Operating Expenses. Annual fund operating expenses increased during the year by 0.05% as a result of higher expenses related to interest.
|
| Summary of Change Legend [Text Block] |
This is a summary of certain changes and planned changes of the Fund since the beginning of the reporting period. For more information, you may refer to the Fund's next prospectus, which we expect to be available by July 31, 2025 or upon request at 888.87.PIMCO (888.877.4626).
|
| C000026607 |
|
| Shareholder Report [Line Items] |
|
| Fund Name |
PIMCO Real Return Fund
|
| Class Name |
Administrative Class
|
| Trading Symbol |
PARRX
|
| Annual or Semi-Annual Statement [Text Block] |
This annual shareholder report contains important information about the PIMCO Real Return Fund (the "Fund") for the period of April 1, 2024 to March 31, 2025 (the "reporting period").
|
| Shareholder Report Annual or Semi-Annual |
Annual Shareholder Report
|
| Additional Information [Text Block] |
You can find additional information about the Fund at www.pimco.com/literature. You can also request this information by contacting us at 888.87.PIMCO (888.877.4626).
|
| Material Fund Change Notice [Text Block] |
This report describes changes to the Fund that occurred during the reporting period.
|
| Additional Information Phone Number |
888.87.PIMCO (888.877.4626)
|
| Expenses [Text Block] |
What were the Fund costs for the reporting period?(based on a hypothetical $10,000 investment)
Class Name |
Cost of a $10,000 investment |
Costs paid as a percentage of a $10,000 investment |
Administrative Class |
$83 |
0.80% | |
| Expenses Paid, Amount |
$ 83
|
| Expense Ratio, Percent |
0.80%
|
| Factors Affecting Performance [Text Block] |
How did the Fund perform during the reporting period and what affected its performance?The following affected performance (on a gross basis) during the reporting period: Eurozone interest rate strategies, including short exposure to duration and exposure to swap spreads, contributed to relative performance versus the Bloomberg U.S. TIPS Index ("Index"), as eurozone rates rose, while swaps spreads tightened. U.S. yield curve positioning, specifically overweight exposure to intermediate maturities relative to underweight exposure to long-term maturities, contributed to relative performance versus the Index, as the U.S. yield curve steepened. Overweight exposure to intermediate U.S. breakeven inflation contributed to relative performance versus the Index, as intermediate U.S. breakeven inflation rose. Exposure to securitized assets, including non-agency residential mortgage-backed securities and collateralized loan obligations, contributed to relative performance versus the Index, as spreads broadly tightened across these sectors. Long exposure to U.K. duration detracted from relative performance versus the Index, as U.K. interest rates broadly moved higher. There were no other material detractors for this Fund.
|
| Performance Past Does Not Indicate Future [Text] |
Performance quoted represents past performance. Past performance is not a guarantee or a reliable indicator of future results.
|
| Line Graph [Table Text Block] |
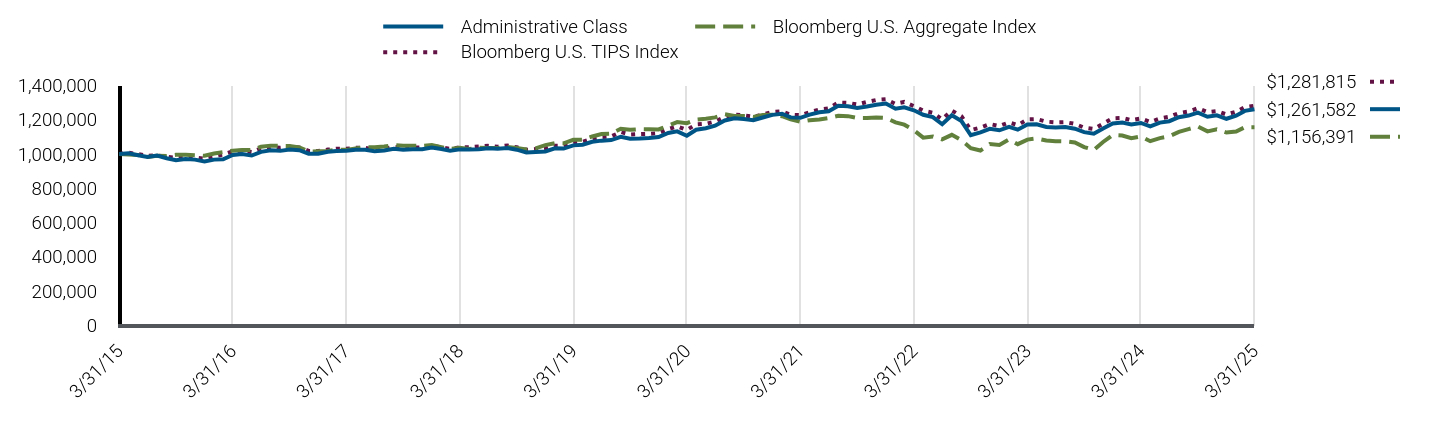
|
Administrative Class |
Bloomberg U.S. Aggregate Index |
Bloomberg U.S. TIPS Index |
3/31/15 |
$1,000,000 |
$1,000,000 |
$1,000,000 |
4/30/15 |
$1,004,153 |
$996,412 |
$1,007,358 |
5/31/15 |
$992,924 |
$994,012 |
$999,089 |
6/30/15 |
$982,586 |
$983,174 |
$989,363 |
7/31/15 |
$990,407 |
$990,008 |
$991,398 |
8/31/15 |
$975,507 |
$988,586 |
$983,840 |
9/30/15 |
$964,236 |
$995,273 |
$978,028 |
10/31/15 |
$971,139 |
$995,439 |
$980,501 |
11/30/15 |
$967,097 |
$992,809 |
$979,546 |
12/31/15 |
$955,719 |
$989,601 |
$971,787 |
1/31/16 |
$967,106 |
$1,003,219 |
$986,217 |
2/29/16 |
$969,421 |
$1,010,335 |
$997,187 |
3/31/16 |
$994,534 |
$1,019,605 |
$1,015,106 |
4/30/16 |
$999,636 |
$1,023,519 |
$1,018,620 |
5/31/16 |
$991,055 |
$1,023,781 |
$1,011,416 |
6/30/16 |
$1,012,560 |
$1,042,177 |
$1,032,440 |
7/31/16 |
$1,021,331 |
$1,048,765 |
$1,041,390 |
8/31/16 |
$1,018,242 |
$1,047,566 |
$1,036,719 |
9/30/16 |
$1,026,127 |
$1,046,952 |
$1,042,394 |
10/31/16 |
$1,022,085 |
$1,038,944 |
$1,038,223 |
11/30/16 |
$1,001,685 |
$1,014,369 |
$1,018,300 |
12/31/16 |
$1,001,392 |
$1,015,800 |
$1,017,300 |
1/31/17 |
$1,012,917 |
$1,017,793 |
$1,025,852 |
2/28/17 |
$1,018,011 |
$1,024,634 |
$1,030,684 |
3/31/17 |
$1,019,538 |
$1,024,097 |
$1,030,132 |
4/30/17 |
$1,025,314 |
$1,032,000 |
$1,036,226 |
5/31/17 |
$1,024,672 |
$1,039,943 |
$1,035,781 |
6/30/17 |
$1,015,919 |
$1,038,896 |
$1,025,961 |
7/31/17 |
$1,020,638 |
$1,043,367 |
$1,030,532 |
8/31/17 |
$1,031,027 |
$1,052,726 |
$1,041,497 |
9/30/17 |
$1,025,083 |
$1,047,712 |
$1,034,823 |
10/31/17 |
$1,027,244 |
$1,048,319 |
$1,037,037 |
11/30/17 |
$1,027,987 |
$1,046,973 |
$1,038,383 |
12/31/17 |
$1,038,057 |
$1,051,778 |
$1,047,889 |
1/31/18 |
$1,029,222 |
$1,039,665 |
$1,038,904 |
2/28/18 |
$1,018,461 |
$1,029,809 |
$1,028,807 |
3/31/18 |
$1,026,905 |
$1,036,414 |
$1,039,614 |
4/30/18 |
$1,026,621 |
$1,028,705 |
$1,039,018 |
5/31/18 |
$1,027,174 |
$1,036,047 |
$1,043,447 |
6/30/18 |
$1,034,151 |
$1,034,773 |
$1,047,633 |
7/31/18 |
$1,030,614 |
$1,035,019 |
$1,042,593 |
8/31/18 |
$1,034,272 |
$1,041,679 |
$1,050,102 |
9/30/18 |
$1,025,190 |
$1,034,971 |
$1,039,044 |
10/31/18 |
$1,008,510 |
$1,026,792 |
$1,024,151 |
11/30/18 |
$1,012,316 |
$1,032,921 |
$1,029,044 |
12/31/18 |
$1,015,047 |
$1,051,898 |
$1,034,667 |
1/31/19 |
$1,032,894 |
$1,063,068 |
$1,048,586 |
2/28/19 |
$1,031,485 |
$1,062,452 |
$1,048,450 |
3/31/19 |
$1,050,343 |
$1,082,853 |
$1,067,721 |
4/30/19 |
$1,053,790 |
$1,083,130 |
$1,071,271 |
5/31/19 |
$1,071,406 |
$1,102,358 |
$1,088,971 |
6/30/19 |
$1,077,980 |
$1,116,201 |
$1,098,308 |
7/31/19 |
$1,081,526 |
$1,118,657 |
$1,102,211 |
8/31/19 |
$1,100,702 |
$1,147,643 |
$1,128,442 |
9/30/19 |
$1,089,458 |
$1,141,531 |
$1,113,082 |
10/31/19 |
$1,090,000 |
$1,144,969 |
$1,115,928 |
11/30/19 |
$1,092,744 |
$1,144,386 |
$1,117,630 |
12/31/19 |
$1,098,768 |
$1,143,588 |
$1,121,867 |
1/31/20 |
$1,122,860 |
$1,165,596 |
$1,145,423 |
2/29/20 |
$1,132,222 |
$1,186,575 |
$1,161,276 |
3/31/20 |
$1,106,544 |
$1,179,592 |
$1,140,859 |
4/30/20 |
$1,141,549 |
$1,200,561 |
$1,172,593 |
5/31/20 |
$1,150,042 |
$1,206,151 |
$1,176,117 |
6/30/20 |
$1,165,404 |
$1,213,749 |
$1,189,245 |
7/31/20 |
$1,195,609 |
$1,231,878 |
$1,216,571 |
8/31/20 |
$1,209,022 |
$1,221,935 |
$1,229,861 |
9/30/20 |
$1,204,744 |
$1,221,265 |
$1,225,326 |
10/31/20 |
$1,197,212 |
$1,215,812 |
$1,217,412 |
11/30/20 |
$1,213,209 |
$1,227,742 |
$1,231,063 |
12/31/20 |
$1,228,513 |
$1,229,433 |
$1,245,186 |
1/31/21 |
$1,235,135 |
$1,220,618 |
$1,249,304 |
2/28/21 |
$1,213,720 |
$1,202,992 |
$1,229,179 |
3/31/21 |
$1,211,375 |
$1,187,971 |
$1,226,855 |
4/30/21 |
$1,230,094 |
$1,197,356 |
$1,244,024 |
5/31/21 |
$1,243,756 |
$1,201,268 |
$1,259,091 |
6/30/21 |
$1,249,579 |
$1,209,708 |
$1,266,717 |
7/31/21 |
$1,280,910 |
$1,223,233 |
$1,300,475 |
8/31/21 |
$1,278,423 |
$1,220,905 |
$1,298,188 |
9/30/21 |
$1,268,642 |
$1,210,334 |
$1,288,906 |
10/31/21 |
$1,277,094 |
$1,210,000 |
$1,303,532 |
11/30/21 |
$1,287,413 |
$1,213,580 |
$1,315,189 |
12/31/21 |
$1,294,979 |
$1,210,475 |
$1,319,351 |
1/31/22 |
$1,263,911 |
$1,184,396 |
$1,292,667 |
2/28/22 |
$1,272,407 |
$1,171,183 |
$1,303,707 |
3/31/22 |
$1,254,943 |
$1,138,645 |
$1,279,468 |
4/30/22 |
$1,228,699 |
$1,095,436 |
$1,253,318 |
5/31/22 |
$1,215,206 |
$1,102,499 |
$1,240,883 |
6/30/22 |
$1,173,595 |
$1,085,203 |
$1,201,616 |
7/31/22 |
$1,225,551 |
$1,111,719 |
$1,253,928 |
8/31/22 |
$1,192,093 |
$1,080,306 |
$1,220,580 |
9/30/22 |
$1,109,317 |
$1,033,630 |
$1,139,803 |
10/31/22 |
$1,126,686 |
$1,020,242 |
$1,153,964 |
11/30/22 |
$1,146,557 |
$1,057,762 |
$1,175,039 |
12/31/22 |
$1,138,457 |
$1,052,991 |
$1,163,065 |
1/31/23 |
$1,158,427 |
$1,085,385 |
$1,184,372 |
2/28/23 |
$1,141,898 |
$1,057,322 |
$1,168,130 |
3/31/23 |
$1,171,893 |
$1,084,180 |
$1,201,894 |
4/30/23 |
$1,173,583 |
$1,090,751 |
$1,203,212 |
5/31/23 |
$1,157,318 |
$1,078,874 |
$1,188,819 |
6/30/23 |
$1,154,864 |
$1,075,027 |
$1,184,814 |
7/31/23 |
$1,157,999 |
$1,074,277 |
$1,186,301 |
8/31/23 |
$1,147,366 |
$1,067,415 |
$1,175,707 |
9/30/23 |
$1,127,402 |
$1,040,290 |
$1,154,005 |
10/31/23 |
$1,118,022 |
$1,023,873 |
$1,145,656 |
11/30/23 |
$1,149,201 |
$1,070,241 |
$1,176,694 |
12/31/23 |
$1,178,100 |
$1,111,209 |
$1,208,370 |
1/31/24 |
$1,183,427 |
$1,108,157 |
$1,210,515 |
2/29/24 |
$1,172,279 |
$1,092,501 |
$1,197,508 |
3/31/24 |
$1,181,293 |
$1,102,589 |
$1,207,363 |
4/30/24 |
$1,161,351 |
$1,074,739 |
$1,187,004 |
5/31/24 |
$1,183,341 |
$1,092,959 |
$1,207,395 |
6/30/24 |
$1,191,332 |
$1,103,307 |
$1,216,871 |
7/31/24 |
$1,214,840 |
$1,129,077 |
$1,238,574 |
8/31/24 |
$1,224,369 |
$1,145,301 |
$1,248,291 |
9/30/24 |
$1,241,782 |
$1,160,636 |
$1,267,030 |
10/31/24 |
$1,217,542 |
$1,131,854 |
$1,244,299 |
11/30/24 |
$1,225,522 |
$1,143,821 |
$1,250,329 |
12/31/24 |
$1,205,544 |
$1,125,101 |
$1,230,558 |
1/31/25 |
$1,223,164 |
$1,131,070 |
$1,246,472 |
2/28/25 |
$1,251,606 |
$1,155,956 |
$1,273,649 |
3/31/25 |
$1,261,582 |
$1,156,391 |
$1,281,815 |
|
| Average Annual Return [Table Text Block] |
Class/Index Name |
1 Year |
5 Years |
10 Years |
Administrative Class |
6.80% |
2.66% |
2.35% |
Bloomberg U.S. Aggregate Index |
4.88% |
(0.40%) |
1.46% |
Bloomberg U.S. TIPS Index |
6.17% |
2.36% |
2.51% | |
| No Deduction of Taxes [Text Block] |
Returns shown do not reflect the deduction of taxes that a shareholder would pay on Fund distributions or the redemption of Fund shares.
|
| Performance Table Market Index Changed [Text Block] |
Differences in the Fund’s performance versus an index and related attribution information with respect to particular categories of securities or individual positions may be attributable, in part, to differences in the pricing methodologies used by the Fund and the index.
|
| Updated Performance Information Location [Text Block] |
For performance current to the most recent month-end, visit www.pimco.com/literature or via 888.87.PIMCO (888.877.4626).
|
| AssetsNet |
$ 7,684,588,000
|
| Holdings Count | Holding |
1,305
|
| Advisory Fees Paid, Amount |
$ 19,202,000
|
| InvestmentCompanyPortfolioTurnover |
227.00%
|
| Additional Fund Statistics [Text Block] |
Key Fund StatisticsFootnote Reference† (as of the end of the reporting period)
Total Net Assets |
$7,684,588 |
# of Portfolio Holdings |
1,305 |
Portfolio Turnover Rate |
227% |
Total Net Advisory Fees Paid During the Reporting Period |
$19,202 |
| Footnote |
Description |
Footnote† |
Dollar amounts displayed in 000's | |
| Holdings [Text Block] |
Security Type Breakdown (% of Net Asset Value)Footnote Reference*
U.S. Treasury Obligations |
89.4% |
U.S. Government Agencies |
14.9% |
Asset-Backed Securities |
8.4% |
Sovereign Issues |
8.1% |
Non-Agency Mortgage-Backed Securities |
1.3% |
Corporate Bonds & Notes |
0.3% |
Other Investments |
0.1% |
Short-Term Instruments |
0.2% |
Affiliated Investments |
0.2% |
Financial Derivative Instruments |
(0.1%) |
Other Assets and Liabilities, Net |
(22.8%) |
Total |
100.0% |
| Footnote |
Description |
Footnote* |
% of Net Asset Value includes derivatives instruments, if any, valued at the value used for determining the Fund's net asset value. The notional exposure of such derivatives investments therefore may be greater than what is depicted. | |
| Material Fund Change [Text Block] |
This is a summary of certain changes and planned changes of the Fund since the beginning of the reporting period. For more information, you may refer to the Fund's next prospectus, which we expect to be available by July 31, 2025 or upon request at 888.87.PIMCO (888.877.4626). Changes to Total Annual Fund Operating Expenses. Annual fund operating expenses increased during the year by 0.05% as a result of higher expenses related to interest. |
| Material Fund Change Expenses [Text Block] |
Changes to Total Annual Fund Operating Expenses. Annual fund operating expenses increased during the year by 0.05% as a result of higher expenses related to interest.
|
| Summary of Change Legend [Text Block] |
This is a summary of certain changes and planned changes of the Fund since the beginning of the reporting period. For more information, you may refer to the Fund's next prospectus, which we expect to be available by July 31, 2025 or upon request at 888.87.PIMCO (888.877.4626).
|
| C000026610 |
|
| Shareholder Report [Line Items] |
|
| Fund Name |
PIMCO Real Return Fund
|
| Class Name |
Class C
|
| Trading Symbol |
PRTCX
|
| Annual or Semi-Annual Statement [Text Block] |
This annual shareholder report contains important information about the PIMCO Real Return Fund (the "Fund") for the period of April 1, 2024 to March 31, 2025 (the "reporting period").
|
| Shareholder Report Annual or Semi-Annual |
Annual Shareholder Report
|
| Additional Information [Text Block] |
You can find additional information about the Fund at www.pimco.com/literature. You can also request this information by contacting us at 888.87.PIMCO (888.877.4626).
|
| Material Fund Change Notice [Text Block] |
This report describes changes to the Fund that occurred during the reporting period.
|
| Additional Information Phone Number |
888.87.PIMCO (888.877.4626)
|
| Expenses [Text Block] |
What were the Fund costs for the reporting period?(based on a hypothetical $10,000 investment)
Class Name |
Cost of a $10,000 investment |
Costs paid as a percentage of a $10,000 investment |
Class C |
$149 |
1.45% | |
| Expenses Paid, Amount |
$ 149
|
| Expense Ratio, Percent |
1.45%
|
| Factors Affecting Performance [Text Block] |
How did the Fund perform during the reporting period and what affected its performance?The following affected performance (on a gross basis) during the reporting period: Eurozone interest rate strategies, including short exposure to duration and exposure to swap spreads, contributed to relative performance versus the Bloomberg U.S. TIPS Index ("Index"), as eurozone rates rose, while swaps spreads tightened. U.S. yield curve positioning, specifically overweight exposure to intermediate maturities relative to underweight exposure to long-term maturities, contributed to relative performance versus the Index, as the U.S. yield curve steepened. Overweight exposure to intermediate U.S. breakeven inflation contributed to relative performance versus the Index, as intermediate U.S. breakeven inflation rose. Exposure to securitized assets, including non-agency residential mortgage-backed securities and collateralized loan obligations, contributed to relative performance versus the Index, as spreads broadly tightened across these sectors. Long exposure to U.K. duration detracted from relative performance versus the Index, as U.K. interest rates broadly moved higher. There were no other material detractors for this Fund.
|
| Performance Past Does Not Indicate Future [Text] |
Performance quoted represents past performance. Past performance is not a guarantee or a reliable indicator of future results.
|
| Line Graph [Table Text Block] |
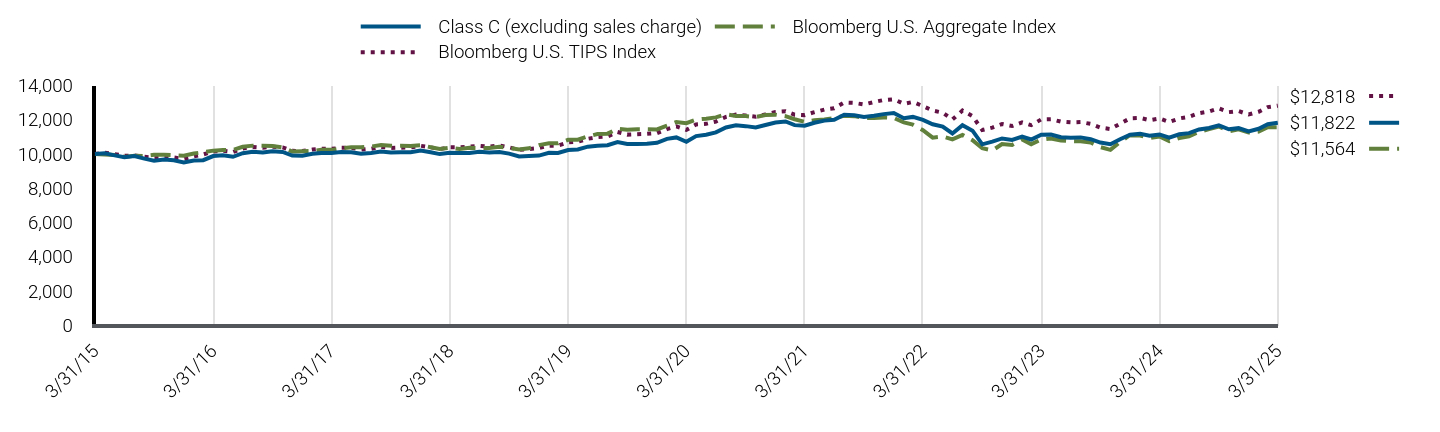
|
Class C (excluding sales charge) |
Bloomberg U.S. Aggregate Index |
Bloomberg U.S. TIPS Index |
3/31/15 |
$10,000 |
$10,000 |
$10,000 |
4/30/15 |
$10,036 |
$9,964 |
$10,074 |
5/31/15 |
$9,919 |
$9,940 |
$9,991 |
6/30/15 |
$9,810 |
$9,832 |
$9,894 |
7/31/15 |
$9,882 |
$9,900 |
$9,914 |
8/31/15 |
$9,729 |
$9,886 |
$9,838 |
9/30/15 |
$9,611 |
$9,953 |
$9,780 |
10/31/15 |
$9,675 |
$9,954 |
$9,805 |
11/30/15 |
$9,629 |
$9,928 |
$9,795 |
12/31/15 |
$9,510 |
$9,896 |
$9,718 |
1/31/16 |
$9,619 |
$10,032 |
$9,862 |
2/29/16 |
$9,637 |
$10,103 |
$9,972 |
3/31/16 |
$9,881 |
$10,196 |
$10,151 |
4/30/16 |
$9,926 |
$10,235 |
$10,186 |
5/31/16 |
$9,836 |
$10,238 |
$10,114 |
6/30/16 |
$10,044 |
$10,422 |
$10,324 |
7/31/16 |
$10,126 |
$10,488 |
$10,414 |
8/31/16 |
$10,089 |
$10,476 |
$10,367 |
9/30/16 |
$10,162 |
$10,470 |
$10,424 |
10/31/16 |
$10,117 |
$10,389 |
$10,382 |
11/30/16 |
$9,909 |
$10,144 |
$10,183 |
12/31/16 |
$9,901 |
$10,158 |
$10,173 |
1/31/17 |
$10,009 |
$10,178 |
$10,259 |
2/28/17 |
$10,055 |
$10,246 |
$10,307 |
3/31/17 |
$10,064 |
$10,241 |
$10,301 |
4/30/17 |
$10,116 |
$10,320 |
$10,362 |
5/31/17 |
$10,104 |
$10,399 |
$10,358 |
6/30/17 |
$10,012 |
$10,389 |
$10,260 |
7/31/17 |
$10,053 |
$10,434 |
$10,305 |
8/31/17 |
$10,150 |
$10,527 |
$10,415 |
9/30/17 |
$10,086 |
$10,477 |
$10,348 |
10/31/17 |
$10,102 |
$10,483 |
$10,370 |
11/30/17 |
$10,104 |
$10,470 |
$10,384 |
12/31/17 |
$10,197 |
$10,518 |
$10,479 |
1/31/18 |
$10,105 |
$10,397 |
$10,389 |
2/28/18 |
$9,994 |
$10,298 |
$10,288 |
3/31/18 |
$10,071 |
$10,364 |
$10,396 |
4/30/18 |
$10,063 |
$10,287 |
$10,390 |
5/31/18 |
$10,063 |
$10,360 |
$10,434 |
6/30/18 |
$10,126 |
$10,348 |
$10,476 |
7/31/18 |
$10,086 |
$10,350 |
$10,426 |
8/31/18 |
$10,116 |
$10,417 |
$10,501 |
9/30/18 |
$10,022 |
$10,350 |
$10,390 |
10/31/18 |
$9,853 |
$10,268 |
$10,242 |
11/30/18 |
$9,885 |
$10,329 |
$10,290 |
12/31/18 |
$9,906 |
$10,519 |
$10,347 |
1/31/19 |
$10,075 |
$10,631 |
$10,486 |
2/28/19 |
$10,056 |
$10,625 |
$10,484 |
3/31/19 |
$10,235 |
$10,829 |
$10,677 |
4/30/19 |
$10,263 |
$10,831 |
$10,713 |
5/31/19 |
$10,429 |
$11,024 |
$10,890 |
6/30/19 |
$10,487 |
$11,162 |
$10,983 |
7/31/19 |
$10,516 |
$11,187 |
$11,022 |
8/31/19 |
$10,697 |
$11,476 |
$11,284 |
9/30/19 |
$10,582 |
$11,415 |
$11,131 |
10/31/19 |
$10,582 |
$11,450 |
$11,159 |
11/30/19 |
$10,602 |
$11,444 |
$11,176 |
12/31/19 |
$10,654 |
$11,436 |
$11,219 |
1/31/20 |
$10,882 |
$11,656 |
$11,454 |
2/29/20 |
$10,967 |
$11,866 |
$11,613 |
3/31/20 |
$10,713 |
$11,796 |
$11,409 |
4/30/20 |
$11,046 |
$12,006 |
$11,726 |
5/31/20 |
$11,122 |
$12,062 |
$11,761 |
6/30/20 |
$11,264 |
$12,137 |
$11,892 |
7/31/20 |
$11,550 |
$12,319 |
$12,166 |
8/31/20 |
$11,673 |
$12,219 |
$12,299 |
9/30/20 |
$11,626 |
$12,213 |
$12,253 |
10/31/20 |
$11,546 |
$12,158 |
$12,174 |
11/30/20 |
$11,695 |
$12,277 |
$12,311 |
12/31/20 |
$11,840 |
$12,294 |
$12,452 |
1/31/21 |
$11,898 |
$12,206 |
$12,493 |
2/28/21 |
$11,685 |
$12,030 |
$12,292 |
3/31/21 |
$11,650 |
$11,880 |
$12,269 |
4/30/21 |
$11,823 |
$11,974 |
$12,440 |
5/31/21 |
$11,948 |
$12,013 |
$12,591 |
6/30/21 |
$11,998 |
$12,097 |
$12,667 |
7/31/21 |
$12,292 |
$12,232 |
$13,005 |
8/31/21 |
$12,261 |
$12,209 |
$12,982 |
9/30/21 |
$12,161 |
$12,103 |
$12,889 |
10/31/21 |
$12,236 |
$12,100 |
$13,035 |
11/30/21 |
$12,328 |
$12,136 |
$13,152 |
12/31/21 |
$12,393 |
$12,105 |
$13,194 |
1/31/22 |
$12,090 |
$11,844 |
$12,927 |
2/28/22 |
$12,165 |
$11,712 |
$13,037 |
3/31/22 |
$11,991 |
$11,386 |
$12,795 |
4/30/22 |
$11,734 |
$10,954 |
$12,533 |
5/31/22 |
$11,599 |
$11,025 |
$12,409 |
6/30/22 |
$11,196 |
$10,852 |
$12,016 |
7/31/22 |
$11,685 |
$11,117 |
$12,539 |
8/31/22 |
$11,360 |
$10,803 |
$12,206 |
9/30/22 |
$10,565 |
$10,336 |
$11,398 |
10/31/22 |
$10,725 |
$10,202 |
$11,540 |
11/30/22 |
$10,908 |
$10,578 |
$11,750 |
12/31/22 |
$10,825 |
$10,530 |
$11,631 |
1/31/23 |
$11,009 |
$10,854 |
$11,844 |
2/28/23 |
$10,846 |
$10,573 |
$11,681 |
3/31/23 |
$11,125 |
$10,842 |
$12,019 |
4/30/23 |
$11,135 |
$10,908 |
$12,032 |
5/31/23 |
$10,975 |
$10,789 |
$11,888 |
6/30/23 |
$10,945 |
$10,750 |
$11,848 |
7/31/23 |
$10,969 |
$10,743 |
$11,863 |
8/31/23 |
$10,863 |
$10,674 |
$11,757 |
9/30/23 |
$10,668 |
$10,403 |
$11,540 |
10/31/23 |
$10,573 |
$10,239 |
$11,457 |
11/30/23 |
$10,862 |
$10,702 |
$11,767 |
12/31/23 |
$11,129 |
$11,112 |
$12,084 |
1/31/24 |
$11,174 |
$11,082 |
$12,105 |
2/29/24 |
$11,063 |
$10,925 |
$11,975 |
3/31/24 |
$11,142 |
$11,026 |
$12,074 |
4/30/24 |
$10,948 |
$10,747 |
$11,870 |
5/31/24 |
$11,148 |
$10,930 |
$12,074 |
6/30/24 |
$11,218 |
$11,033 |
$12,169 |
7/31/24 |
$11,433 |
$11,291 |
$12,386 |
8/31/24 |
$11,516 |
$11,453 |
$12,483 |
9/30/24 |
$11,674 |
$11,606 |
$12,670 |
10/31/24 |
$11,440 |
$11,319 |
$12,443 |
11/30/24 |
$11,508 |
$11,438 |
$12,503 |
12/31/24 |
$11,315 |
$11,251 |
$12,306 |
1/31/25 |
$11,473 |
$11,311 |
$12,465 |
2/28/25 |
$11,734 |
$11,560 |
$12,736 |
3/31/25 |
$11,822 |
$11,564 |
$12,818 |
|
| Average Annual Return [Table Text Block] |
Class/Index Name |
1 Year |
5 Years |
10 Years |
Class C (excluding sales charge) |
6.11% |
1.99% |
1.69% |
Class C (including sales charge) |
5.11% |
1.99% |
1.69% |
Bloomberg U.S. Aggregate Index |
4.88% |
(0.40%) |
1.46% |
Bloomberg U.S. TIPS Index |
6.17% |
2.36% |
2.51% | |
| No Deduction of Taxes [Text Block] |
Returns shown do not reflect the deduction of taxes that a shareholder would pay on Fund distributions or the redemption of Fund shares.
|
| Performance Table Market Index Changed [Text Block] |
Differences in the Fund’s performance versus an index and related attribution information with respect to particular categories of securities or individual positions may be attributable, in part, to differences in the pricing methodologies used by the Fund and the index.
|
| Updated Performance Information Location [Text Block] |
For performance current to the most recent month-end, visit www.pimco.com/literature or via 888.87.PIMCO (888.877.4626).
|
| AssetsNet |
$ 7,684,588,000
|
| Holdings Count | Holding |
1,305
|
| Advisory Fees Paid, Amount |
$ 19,202,000
|
| InvestmentCompanyPortfolioTurnover |
227.00%
|
| Additional Fund Statistics [Text Block] |
Key Fund StatisticsFootnote Reference† (as of the end of the reporting period)
Total Net Assets |
$7,684,588 |
# of Portfolio Holdings |
1,305 |
Portfolio Turnover Rate |
227% |
Total Net Advisory Fees Paid During the Reporting Period |
$19,202 |
| Footnote |
Description |
Footnote† |
Dollar amounts displayed in 000's | |
| Holdings [Text Block] |
Security Type Breakdown (% of Net Asset Value)Footnote Reference*
U.S. Treasury Obligations |
89.4% |
U.S. Government Agencies |
14.9% |
Asset-Backed Securities |
8.4% |
Sovereign Issues |
8.1% |
Non-Agency Mortgage-Backed Securities |
1.3% |
Corporate Bonds & Notes |
0.3% |
Other Investments |
0.1% |
Short-Term Instruments |
0.2% |
Affiliated Investments |
0.2% |
Financial Derivative Instruments |
(0.1%) |
Other Assets and Liabilities, Net |
(22.8%) |
Total |
100.0% |
| Footnote |
Description |
Footnote* |
% of Net Asset Value includes derivatives instruments, if any, valued at the value used for determining the Fund's net asset value. The notional exposure of such derivatives investments therefore may be greater than what is depicted. | |
| Material Fund Change [Text Block] |
This is a summary of certain changes and planned changes of the Fund since the beginning of the reporting period. For more information, you may refer to the Fund's next prospectus, which we expect to be available by July 31, 2025 or upon request at 888.87.PIMCO (888.877.4626). Changes to Total Annual Fund Operating Expenses. Annual fund operating expenses increased during the year by 0.05% as a result of higher expenses related to interest. |
| Material Fund Change Expenses [Text Block] |
Changes to Total Annual Fund Operating Expenses. Annual fund operating expenses increased during the year by 0.05% as a result of higher expenses related to interest.
|
| Summary of Change Legend [Text Block] |
This is a summary of certain changes and planned changes of the Fund since the beginning of the reporting period. For more information, you may refer to the Fund's next prospectus, which we expect to be available by July 31, 2025 or upon request at 888.87.PIMCO (888.877.4626).
|
| C000200446 |
|
| Shareholder Report [Line Items] |
|
| Fund Name |
PIMCO Real Return Fund
|
| Class Name |
I-3
|
| Trading Symbol |
PRNPX
|
| Annual or Semi-Annual Statement [Text Block] |
This annual shareholder report contains important information about the PIMCO Real Return Fund (the "Fund") for the period of April 1, 2024 to March 31, 2025 (the "reporting period").
|
| Shareholder Report Annual or Semi-Annual |
Annual Shareholder Report
|
| Additional Information [Text Block] |
You can find additional information about the Fund at www.pimco.com/literature. You can also request this information by contacting us at 888.87.PIMCO (888.877.4626).
|
| Material Fund Change Notice [Text Block] |
This report describes changes to the Fund that occurred during the reporting period.
|
| Additional Information Phone Number |
888.87.PIMCO (888.877.4626)
|
| Expenses [Text Block] |
What were the Fund costs for the reporting period?(based on a hypothetical $10,000 investment)
Class Name |
Cost of a $10,000 investment |
Costs paid as a percentage of a $10,000 investment |
I-3 |
$72 |
0.70% | |
| Expenses Paid, Amount |
$ 72
|
| Expense Ratio, Percent |
0.70%
|
| Factors Affecting Performance [Text Block] |
How did the Fund perform during the reporting period and what affected its performance?The following affected performance (on a gross basis) during the reporting period: Eurozone interest rate strategies, including short exposure to duration and exposure to swap spreads, contributed to relative performance versus the Bloomberg U.S. TIPS Index ("Index"), as eurozone rates rose, while swaps spreads tightened. U.S. yield curve positioning, specifically overweight exposure to intermediate maturities relative to underweight exposure to long-term maturities, contributed to relative performance versus the Index, as the U.S. yield curve steepened. Overweight exposure to intermediate U.S. breakeven inflation contributed to relative performance versus the Index, as intermediate U.S. breakeven inflation rose. Exposure to securitized assets, including non-agency residential mortgage-backed securities and collateralized loan obligations, contributed to relative performance versus the Index, as spreads broadly tightened across these sectors. Long exposure to U.K. duration detracted from relative performance versus the Index, as U.K. interest rates broadly moved higher. There were no other material detractors for this Fund.
|
| Performance Past Does Not Indicate Future [Text] |
Performance quoted represents past performance. Past performance is not a guarantee or a reliable indicator of future results.
|
| Line Graph [Table Text Block] |

|
I-3 |
Bloomberg U.S. Aggregate Index |
Bloomberg U.S. TIPS Index |
3/31/15 |
$1,000,000 |
$1,000,000 |
$1,000,000 |
4/30/15 |
$1,004,235 |
$996,412 |
$1,007,358 |
5/31/15 |
$993,103 |
$994,012 |
$999,089 |
6/30/15 |
$982,842 |
$983,174 |
$989,363 |
7/31/15 |
$990,763 |
$990,008 |
$991,398 |
8/31/15 |
$975,927 |
$988,586 |
$983,840 |
9/30/15 |
$964,731 |
$995,273 |
$978,028 |
10/31/15 |
$971,725 |
$995,439 |
$980,501 |
11/30/15 |
$967,753 |
$992,809 |
$979,546 |
12/31/15 |
$956,467 |
$989,601 |
$971,787 |
1/31/16 |
$967,925 |
$1,003,219 |
$986,217 |
2/29/16 |
$970,317 |
$1,010,335 |
$997,187 |
3/31/16 |
$995,537 |
$1,019,605 |
$1,015,106 |
4/30/16 |
$1,000,732 |
$1,023,519 |
$1,018,620 |
5/31/16 |
$992,221 |
$1,023,781 |
$1,011,416 |
6/30/16 |
$1,013,833 |
$1,042,177 |
$1,032,440 |
7/31/16 |
$1,022,703 |
$1,048,765 |
$1,041,390 |
8/31/16 |
$1,019,697 |
$1,047,566 |
$1,036,719 |
9/30/16 |
$1,027,693 |
$1,046,952 |
$1,042,394 |
10/31/16 |
$1,023,718 |
$1,038,944 |
$1,038,223 |
11/30/16 |
$1,003,369 |
$1,014,369 |
$1,018,300 |
12/31/16 |
$1,003,175 |
$1,015,800 |
$1,017,300 |
1/31/17 |
$1,014,792 |
$1,017,793 |
$1,025,852 |
2/28/17 |
$1,019,973 |
$1,024,634 |
$1,030,684 |
3/31/17 |
$1,021,603 |
$1,024,097 |
$1,030,132 |
4/30/17 |
$1,027,462 |
$1,032,000 |
$1,036,226 |
5/31/17 |
$1,026,905 |
$1,039,943 |
$1,035,781 |
6/30/17 |
$1,018,231 |
$1,038,896 |
$1,025,961 |
7/31/17 |
$1,023,034 |
$1,043,367 |
$1,030,532 |
8/31/17 |
$1,033,535 |
$1,052,726 |
$1,041,497 |
9/30/17 |
$1,027,669 |
$1,047,712 |
$1,034,823 |
10/31/17 |
$1,029,915 |
$1,048,319 |
$1,037,037 |
11/30/17 |
$1,030,745 |
$1,046,973 |
$1,038,383 |
12/31/17 |
$1,040,937 |
$1,051,778 |
$1,047,889 |
1/31/18 |
$1,032,159 |
$1,039,665 |
$1,038,904 |
2/28/18 |
$1,021,447 |
$1,029,809 |
$1,028,807 |
3/31/18 |
$1,030,009 |
$1,036,414 |
$1,039,614 |
4/30/18 |
$1,029,809 |
$1,028,705 |
$1,039,018 |
5/31/18 |
$1,030,436 |
$1,036,047 |
$1,043,447 |
6/30/18 |
$1,037,540 |
$1,034,773 |
$1,047,633 |
7/31/18 |
$1,034,094 |
$1,035,019 |
$1,042,593 |
8/31/18 |
$1,037,849 |
$1,041,679 |
$1,050,102 |
9/30/18 |
$1,028,817 |
$1,034,971 |
$1,039,044 |
10/31/18 |
$1,012,162 |
$1,026,792 |
$1,024,151 |
11/30/18 |
$1,016,085 |
$1,032,921 |
$1,029,044 |
12/31/18 |
$1,018,916 |
$1,051,898 |
$1,034,667 |
1/31/19 |
$1,036,916 |
$1,063,068 |
$1,048,586 |
2/28/19 |
$1,035,581 |
$1,062,452 |
$1,048,450 |
3/31/19 |
$1,054,603 |
$1,082,853 |
$1,067,721 |
4/30/19 |
$1,058,112 |
$1,083,130 |
$1,071,271 |
5/31/19 |
$1,075,892 |
$1,102,358 |
$1,088,971 |
6/30/19 |
$1,082,541 |
$1,116,201 |
$1,098,308 |
7/31/19 |
$1,086,191 |
$1,118,657 |
$1,102,211 |
8/31/19 |
$1,105,535 |
$1,147,643 |
$1,128,442 |
9/30/19 |
$1,094,324 |
$1,141,531 |
$1,113,082 |
10/31/19 |
$1,094,962 |
$1,144,969 |
$1,115,928 |
11/30/19 |
$1,097,813 |
$1,144,386 |
$1,117,630 |
12/31/19 |
$1,103,958 |
$1,143,588 |
$1,121,867 |
1/31/20 |
$1,128,264 |
$1,165,596 |
$1,145,423 |
2/29/20 |
$1,137,758 |
$1,186,575 |
$1,161,276 |
3/31/20 |
$1,112,045 |
$1,179,592 |
$1,140,859 |
4/30/20 |
$1,147,321 |
$1,200,561 |
$1,172,593 |
5/31/20 |
$1,155,954 |
$1,206,151 |
$1,176,117 |
6/30/20 |
$1,171,496 |
$1,213,749 |
$1,189,245 |
7/31/20 |
$1,201,965 |
$1,231,878 |
$1,216,571 |
8/31/20 |
$1,215,545 |
$1,221,935 |
$1,229,861 |
9/30/20 |
$1,211,343 |
$1,221,265 |
$1,225,326 |
10/31/20 |
$1,203,869 |
$1,215,812 |
$1,217,412 |
11/30/20 |
$1,220,049 |
$1,227,742 |
$1,231,063 |
12/31/20 |
$1,235,552 |
$1,229,433 |
$1,245,186 |
1/31/21 |
$1,242,308 |
$1,220,618 |
$1,249,304 |
2/28/21 |
$1,220,862 |
$1,202,992 |
$1,229,179 |
3/31/21 |
$1,218,604 |
$1,187,971 |
$1,226,855 |
4/30/21 |
$1,237,542 |
$1,197,356 |
$1,244,024 |
5/31/21 |
$1,251,385 |
$1,201,268 |
$1,259,091 |
6/30/21 |
$1,257,345 |
$1,209,708 |
$1,266,717 |
7/31/21 |
$1,288,982 |
$1,223,233 |
$1,300,475 |
8/31/21 |
$1,286,585 |
$1,220,905 |
$1,298,188 |
9/30/21 |
$1,276,861 |
$1,210,334 |
$1,288,906 |
10/31/21 |
$1,285,486 |
$1,210,000 |
$1,303,532 |
11/30/21 |
$1,295,980 |
$1,213,580 |
$1,315,189 |
12/31/21 |
$1,303,715 |
$1,210,475 |
$1,319,351 |
1/31/22 |
$1,272,537 |
$1,184,396 |
$1,292,667 |
2/28/22 |
$1,281,186 |
$1,171,183 |
$1,303,707 |
3/31/22 |
$1,263,710 |
$1,138,645 |
$1,279,468 |
4/30/22 |
$1,237,389 |
$1,095,436 |
$1,253,318 |
5/31/22 |
$1,223,898 |
$1,102,499 |
$1,240,883 |
6/30/22 |
$1,182,089 |
$1,085,203 |
$1,201,616 |
7/31/22 |
$1,234,522 |
$1,111,719 |
$1,253,928 |
8/31/22 |
$1,200,922 |
$1,080,306 |
$1,220,580 |
9/30/22 |
$1,117,636 |
$1,033,630 |
$1,139,803 |
10/31/22 |
$1,135,224 |
$1,020,242 |
$1,153,964 |
11/30/22 |
$1,155,339 |
$1,057,762 |
$1,175,039 |
12/31/22 |
$1,147,281 |
$1,052,991 |
$1,163,065 |
1/31/23 |
$1,167,498 |
$1,085,385 |
$1,184,372 |
2/28/23 |
$1,150,928 |
$1,057,322 |
$1,168,130 |
3/31/23 |
$1,181,265 |
$1,084,180 |
$1,201,894 |
4/30/23 |
$1,183,059 |
$1,090,751 |
$1,203,212 |
5/31/23 |
$1,166,762 |
$1,078,874 |
$1,188,819 |
6/30/23 |
$1,164,390 |
$1,075,027 |
$1,184,814 |
7/31/23 |
$1,167,643 |
$1,074,277 |
$1,186,301 |
8/31/23 |
$1,157,017 |
$1,067,415 |
$1,175,707 |
9/30/23 |
$1,136,980 |
$1,040,290 |
$1,154,005 |
10/31/23 |
$1,127,612 |
$1,023,873 |
$1,145,656 |
11/30/23 |
$1,159,157 |
$1,070,241 |
$1,176,694 |
12/31/23 |
$1,188,408 |
$1,111,209 |
$1,208,370 |
1/31/24 |
$1,193,878 |
$1,108,157 |
$1,210,515 |
2/29/24 |
$1,182,716 |
$1,092,501 |
$1,197,508 |
3/31/24 |
$1,191,911 |
$1,102,589 |
$1,207,363 |
4/30/24 |
$1,171,887 |
$1,074,739 |
$1,187,004 |
5/31/24 |
$1,194,183 |
$1,092,959 |
$1,207,395 |
6/30/24 |
$1,202,339 |
$1,103,307 |
$1,216,871 |
7/31/24 |
$1,226,167 |
$1,129,077 |
$1,238,574 |
8/31/24 |
$1,235,894 |
$1,145,301 |
$1,248,291 |
9/30/24 |
$1,253,567 |
$1,160,636 |
$1,267,030 |
10/31/24 |
$1,229,201 |
$1,131,854 |
$1,244,299 |
11/30/24 |
$1,237,361 |
$1,143,821 |
$1,250,329 |
12/31/24 |
$1,217,294 |
$1,125,101 |
$1,230,558 |
1/31/25 |
$1,235,195 |
$1,131,070 |
$1,246,472 |
2/28/25 |
$1,264,011 |
$1,155,956 |
$1,273,649 |
3/31/25 |
$1,274,186 |
$1,156,391 |
$1,281,815 |
|
| Average Annual Return [Table Text Block] |
Class/Index Name |
1 Year |
5 Years |
10 Years |
I-3 |
6.90% |
2.76% |
2.45% |
Bloomberg U.S. Aggregate Index |
4.88% |
(0.40%) |
1.46% |
Bloomberg U.S. TIPS Index |
6.17% |
2.36% |
2.51% | |
| No Deduction of Taxes [Text Block] |
Returns shown do not reflect the deduction of taxes that a shareholder would pay on Fund distributions or the redemption of Fund shares.
|
| Performance Table Market Index Changed [Text Block] |
Differences in the Fund’s performance versus an index and related attribution information with respect to particular categories of securities or individual positions may be attributable, in part, to differences in the pricing methodologies used by the Fund and the index.
|
| Updated Performance Information Location [Text Block] |
For performance current to the most recent month-end, visit www.pimco.com/literature or via 888.87.PIMCO (888.877.4626).
|
| AssetsNet |
$ 7,684,588,000
|
| Holdings Count | Holding |
1,305
|
| Advisory Fees Paid, Amount |
$ 19,202,000
|
| InvestmentCompanyPortfolioTurnover |
227.00%
|
| Additional Fund Statistics [Text Block] |
Key Fund StatisticsFootnote Reference† (as of the end of the reporting period)
Total Net Assets |
$7,684,588 |
# of Portfolio Holdings |
1,305 |
Portfolio Turnover Rate |
227% |
Total Net Advisory Fees Paid During the Reporting Period |
$19,202 |
| Footnote |
Description |
Footnote† |
Dollar amounts displayed in 000's | |
| Holdings [Text Block] |
Security Type Breakdown (% of Net Asset Value)Footnote Reference*
U.S. Treasury Obligations |
89.4% |
U.S. Government Agencies |
14.9% |
Asset-Backed Securities |
8.4% |
Sovereign Issues |
8.1% |
Non-Agency Mortgage-Backed Securities |
1.3% |
Corporate Bonds & Notes |
0.3% |
Other Investments |
0.1% |
Short-Term Instruments |
0.2% |
Affiliated Investments |
0.2% |
Financial Derivative Instruments |
(0.1%) |
Other Assets and Liabilities, Net |
(22.8%) |
Total |
100.0% |
| Footnote |
Description |
Footnote* |
% of Net Asset Value includes derivatives instruments, if any, valued at the value used for determining the Fund's net asset value. The notional exposure of such derivatives investments therefore may be greater than what is depicted. | |
| Material Fund Change [Text Block] |
This is a summary of certain changes and planned changes of the Fund since the beginning of the reporting period. For more information, you may refer to the Fund's next prospectus, which we expect to be available by July 31, 2025 or upon request at 888.87.PIMCO (888.877.4626). Changes to Total Annual Fund Operating Expenses. Annual fund operating expenses increased during the year by 0.05% as a result of higher expenses related to interest. |
| Material Fund Change Expenses [Text Block] |
Changes to Total Annual Fund Operating Expenses. Annual fund operating expenses increased during the year by 0.05% as a result of higher expenses related to interest.
|
| Summary of Change Legend [Text Block] |
This is a summary of certain changes and planned changes of the Fund since the beginning of the reporting period. For more information, you may refer to the Fund's next prospectus, which we expect to be available by July 31, 2025 or upon request at 888.87.PIMCO (888.877.4626).
|
| C000026606 |
|
| Shareholder Report [Line Items] |
|
| Fund Name |
PIMCO Real Return Fund
|
| Class Name |
Institutional Class
|
| Trading Symbol |
PRRIX
|
| Annual or Semi-Annual Statement [Text Block] |
This annual shareholder report contains important information about the PIMCO Real Return Fund (the "Fund") for the period of April 1, 2024 to March 31, 2025 (the "reporting period").
|
| Shareholder Report Annual or Semi-Annual |
Annual Shareholder Report
|
| Additional Information [Text Block] |
You can find additional information about the Fund at www.pimco.com/literature. You can also request this information by contacting us at 888.87.PIMCO (888.877.4626).
|
| Material Fund Change Notice [Text Block] |
This report describes changes to the Fund that occurred during the reporting period.
|
| Additional Information Phone Number |
888.87.PIMCO (888.877.4626)
|
| Expenses [Text Block] |
What were the Fund costs for the reporting period?(based on a hypothetical $10,000 investment)
Class Name |
Cost of a $10,000 investment |
Costs paid as a percentage of a $10,000 investment |
Institutional Class |
$57 |
0.55% | |
| Expenses Paid, Amount |
$ 57
|
| Expense Ratio, Percent |
0.55%
|
| Factors Affecting Performance [Text Block] |
How did the Fund perform during the reporting period and what affected its performance?The following affected performance (on a gross basis) during the reporting period: Eurozone interest rate strategies, including short exposure to duration and exposure to swap spreads, contributed to relative performance versus the Bloomberg U.S. TIPS Index ("Index"), as eurozone rates rose, while swaps spreads tightened. U.S. yield curve positioning, specifically overweight exposure to intermediate maturities relative to underweight exposure to long-term maturities, contributed to relative performance versus the Index, as the U.S. yield curve steepened. Overweight exposure to intermediate U.S. breakeven inflation contributed to relative performance versus the Index, as intermediate U.S. breakeven inflation rose. Exposure to securitized assets, including non-agency residential mortgage-backed securities and collateralized loan obligations, contributed to relative performance versus the Index, as spreads broadly tightened across these sectors. Long exposure to U.K. duration detracted from relative performance versus the Index, as U.K. interest rates broadly moved higher. There were no other material detractors for this Fund.
|
| Performance Past Does Not Indicate Future [Text] |
Performance quoted represents past performance. Past performance is not a guarantee or a reliable indicator of future results.
|
| Line Graph [Table Text Block] |
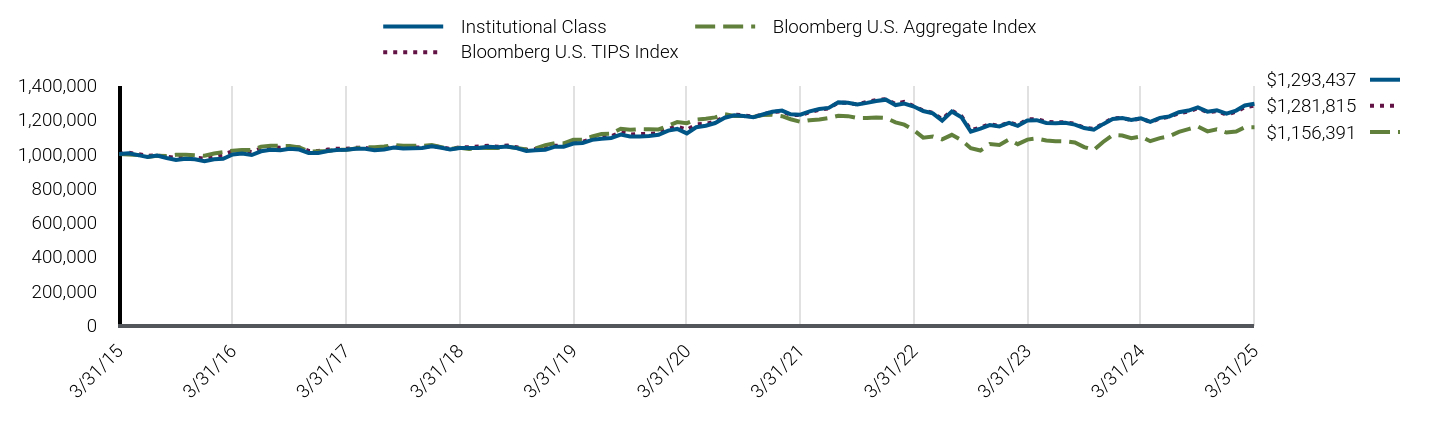
|
Institutional Class |
Bloomberg U.S. Aggregate Index |
Bloomberg U.S. TIPS Index |
3/31/15 |
$1,000,000 |
$1,000,000 |
$1,000,000 |
4/30/15 |
$1,004,359 |
$996,412 |
$1,007,358 |
5/31/15 |
$993,352 |
$994,012 |
$999,089 |
6/30/15 |
$983,210 |
$983,174 |
$989,363 |
7/31/15 |
$991,259 |
$990,008 |
$991,398 |
8/31/15 |
$976,541 |
$988,586 |
$983,840 |
9/30/15 |
$965,457 |
$995,273 |
$978,028 |
10/31/15 |
$972,581 |
$995,439 |
$980,501 |
11/30/15 |
$968,724 |
$992,809 |
$979,546 |
12/31/15 |
$957,549 |
$989,601 |
$971,787 |
1/31/16 |
$969,141 |
$1,003,219 |
$986,217 |
2/29/16 |
$971,651 |
$1,010,335 |
$997,187 |
3/31/16 |
$997,030 |
$1,019,605 |
$1,015,106 |
4/30/16 |
$1,002,355 |
$1,023,519 |
$1,018,620 |
5/31/16 |
$993,957 |
$1,023,781 |
$1,011,416 |
6/30/16 |
$1,015,731 |
$1,042,177 |
$1,032,440 |
7/31/16 |
$1,024,747 |
$1,048,765 |
$1,041,390 |
8/31/16 |
$1,021,865 |
$1,047,566 |
$1,036,719 |
9/30/16 |
$1,030,003 |
$1,046,952 |
$1,042,394 |
10/31/16 |
$1,026,150 |
$1,038,944 |
$1,038,223 |
11/30/16 |
$1,005,877 |
$1,014,369 |
$1,018,300 |
12/31/16 |
$1,005,809 |
$1,015,800 |
$1,017,300 |
1/31/17 |
$1,017,586 |
$1,017,793 |
$1,025,852 |
2/28/17 |
$1,022,898 |
$1,024,634 |
$1,030,684 |
3/31/17 |
$1,024,662 |
$1,024,097 |
$1,030,132 |
4/30/17 |
$1,030,665 |
$1,032,000 |
$1,036,226 |
5/31/17 |
$1,030,237 |
$1,039,943 |
$1,035,781 |
6/30/17 |
$1,021,661 |
$1,038,896 |
$1,025,961 |
7/31/17 |
$1,026,611 |
$1,043,367 |
$1,030,532 |
8/31/17 |
$1,037,280 |
$1,052,726 |
$1,041,497 |
9/30/17 |
$1,031,521 |
$1,047,712 |
$1,034,823 |
10/31/17 |
$1,033,907 |
$1,048,319 |
$1,037,037 |
11/30/17 |
$1,034,867 |
$1,046,973 |
$1,038,383 |
12/31/17 |
$1,045,232 |
$1,051,778 |
$1,047,889 |
1/31/18 |
$1,036,551 |
$1,039,665 |
$1,038,904 |
2/28/18 |
$1,025,911 |
$1,029,809 |
$1,028,807 |
3/31/18 |
$1,034,642 |
$1,036,414 |
$1,039,614 |
4/30/18 |
$1,034,561 |
$1,028,705 |
$1,039,018 |
5/31/18 |
$1,035,337 |
$1,036,047 |
$1,043,447 |
6/30/18 |
$1,042,588 |
$1,034,773 |
$1,047,633 |
7/31/18 |
$1,039,236 |
$1,035,019 |
$1,042,593 |
8/31/18 |
$1,043,167 |
$1,041,679 |
$1,050,102 |
9/30/18 |
$1,034,199 |
$1,034,971 |
$1,039,044 |
10/31/18 |
$1,017,585 |
$1,026,792 |
$1,024,151 |
11/30/18 |
$1,021,653 |
$1,032,921 |
$1,029,044 |
12/31/18 |
$1,024,626 |
$1,051,898 |
$1,034,667 |
1/31/19 |
$1,042,854 |
$1,063,068 |
$1,048,586 |
2/28/19 |
$1,041,631 |
$1,062,452 |
$1,048,450 |
3/31/19 |
$1,060,898 |
$1,082,853 |
$1,067,721 |
4/30/19 |
$1,064,596 |
$1,083,130 |
$1,071,271 |
5/31/19 |
$1,082,626 |
$1,102,358 |
$1,088,971 |
6/30/19 |
$1,089,476 |
$1,116,201 |
$1,098,308 |
7/31/19 |
$1,093,290 |
$1,118,657 |
$1,102,211 |
8/31/19 |
$1,112,925 |
$1,147,643 |
$1,128,442 |
9/30/19 |
$1,101,767 |
$1,141,531 |
$1,113,082 |
10/31/19 |
$1,102,549 |
$1,144,969 |
$1,115,928 |
11/30/19 |
$1,105,559 |
$1,144,386 |
$1,117,630 |
12/31/19 |
$1,111,888 |
$1,143,588 |
$1,121,867 |
1/31/20 |
$1,136,513 |
$1,165,596 |
$1,145,423 |
2/29/20 |
$1,146,207 |
$1,186,575 |
$1,161,276 |
3/31/20 |
$1,120,439 |
$1,179,592 |
$1,140,859 |
4/30/20 |
$1,156,121 |
$1,200,561 |
$1,172,593 |
5/31/20 |
$1,164,968 |
$1,206,151 |
$1,176,117 |
6/30/20 |
$1,180,770 |
$1,213,749 |
$1,189,245 |
7/31/20 |
$1,211,644 |
$1,231,878 |
$1,216,571 |
8/31/20 |
$1,225,476 |
$1,221,935 |
$1,229,861 |
9/30/20 |
$1,221,390 |
$1,221,265 |
$1,225,326 |
10/31/20 |
$1,214,014 |
$1,215,812 |
$1,217,412 |
11/30/20 |
$1,230,477 |
$1,227,742 |
$1,231,063 |
12/31/20 |
$1,246,285 |
$1,229,433 |
$1,245,186 |
1/31/21 |
$1,253,241 |
$1,220,618 |
$1,249,304 |
2/28/21 |
$1,231,750 |
$1,202,992 |
$1,229,179 |
3/31/21 |
$1,229,630 |
$1,187,971 |
$1,226,855 |
4/30/21 |
$1,248,901 |
$1,197,356 |
$1,244,024 |
5/31/21 |
$1,263,019 |
$1,201,268 |
$1,259,091 |
6/30/21 |
$1,269,190 |
$1,209,708 |
$1,266,717 |
7/31/21 |
$1,301,292 |
$1,223,233 |
$1,300,475 |
8/31/21 |
$1,299,030 |
$1,220,905 |
$1,298,188 |
9/30/21 |
$1,289,371 |
$1,210,334 |
$1,288,906 |
10/31/21 |
$1,298,242 |
$1,210,000 |
$1,303,532 |
11/30/21 |
$1,309,001 |
$1,213,580 |
$1,315,189 |
12/31/21 |
$1,316,990 |
$1,210,475 |
$1,319,351 |
1/31/22 |
$1,285,649 |
$1,184,396 |
$1,292,667 |
2/28/22 |
$1,294,533 |
$1,171,183 |
$1,303,707 |
3/31/22 |
$1,277,039 |
$1,138,645 |
$1,279,468 |
4/30/22 |
$1,250,599 |
$1,095,436 |
$1,253,318 |
5/31/22 |
$1,237,117 |
$1,102,499 |
$1,240,883 |
6/30/22 |
$1,195,006 |
$1,085,203 |
$1,201,616 |
7/31/22 |
$1,248,165 |
$1,111,719 |
$1,253,928 |
8/31/22 |
$1,214,349 |
$1,080,306 |
$1,220,580 |
9/30/22 |
$1,130,288 |
$1,033,630 |
$1,139,803 |
10/31/22 |
$1,148,212 |
$1,020,242 |
$1,153,964 |
11/30/22 |
$1,168,699 |
$1,057,762 |
$1,175,039 |
12/31/22 |
$1,160,707 |
$1,052,991 |
$1,163,065 |
1/31/23 |
$1,181,301 |
$1,085,385 |
$1,184,372 |
2/28/23 |
$1,164,671 |
$1,057,322 |
$1,168,130 |
3/31/23 |
$1,195,530 |
$1,084,180 |
$1,201,894 |
4/30/23 |
$1,197,482 |
$1,090,751 |
$1,203,212 |
5/31/23 |
$1,181,138 |
$1,078,874 |
$1,188,819 |
6/30/23 |
$1,178,891 |
$1,075,027 |
$1,184,814 |
7/31/23 |
$1,182,325 |
$1,074,277 |
$1,186,301 |
8/31/23 |
$1,171,715 |
$1,067,415 |
$1,175,707 |
9/30/23 |
$1,151,571 |
$1,040,290 |
$1,154,005 |
10/31/23 |
$1,142,223 |
$1,023,873 |
$1,145,656 |
11/30/23 |
$1,174,315 |
$1,070,241 |
$1,176,694 |
12/31/23 |
$1,204,106 |
$1,111,209 |
$1,208,370 |
1/31/24 |
$1,209,796 |
$1,108,157 |
$1,210,515 |
2/29/24 |
$1,198,637 |
$1,092,501 |
$1,197,508 |
3/31/24 |
$1,208,109 |
$1,102,589 |
$1,207,363 |
4/30/24 |
$1,187,959 |
$1,074,739 |
$1,187,004 |
5/31/24 |
$1,210,724 |
$1,092,959 |
$1,207,395 |
6/30/24 |
$1,219,134 |
$1,103,307 |
$1,216,871 |
7/31/24 |
$1,243,452 |
$1,129,077 |
$1,238,574 |
8/31/24 |
$1,253,488 |
$1,145,301 |
$1,248,291 |
9/30/24 |
$1,271,558 |
$1,160,636 |
$1,267,030 |
10/31/24 |
$1,247,004 |
$1,131,854 |
$1,244,299 |
11/30/24 |
$1,255,441 |
$1,143,821 |
$1,250,329 |
12/31/24 |
$1,235,240 |
$1,125,101 |
$1,230,558 |
1/31/25 |
$1,253,567 |
$1,131,070 |
$1,246,472 |
2/28/25 |
$1,282,958 |
$1,155,956 |
$1,273,649 |
3/31/25 |
$1,293,437 |
$1,156,391 |
$1,281,815 |
|
| Average Annual Return [Table Text Block] |
Class/Index Name |
1 Year |
5 Years |
10 Years |
Institutional Class |
7.06% |
2.91% |
2.61% |
Bloomberg U.S. Aggregate Index |
4.88% |
(0.40%) |
1.46% |
Bloomberg U.S. TIPS Index |
6.17% |
2.36% |
2.51% | |
| No Deduction of Taxes [Text Block] |
Returns shown do not reflect the deduction of taxes that a shareholder would pay on Fund distributions or the redemption of Fund shares.
|
| Performance Table Market Index Changed [Text Block] |
Differences in the Fund’s performance versus an index and related attribution information with respect to particular categories of securities or individual positions may be attributable, in part, to differences in the pricing methodologies used by the Fund and the index.
|
| Updated Performance Information Location [Text Block] |
For performance current to the most recent month-end, visit www.pimco.com/literature or via 888.87.PIMCO (888.877.4626).
|
| AssetsNet |
$ 7,684,588,000
|
| Holdings Count | Holding |
1,305
|
| Advisory Fees Paid, Amount |
$ 19,202,000
|
| InvestmentCompanyPortfolioTurnover |
227.00%
|
| Additional Fund Statistics [Text Block] |
Key Fund StatisticsFootnote Reference† (as of the end of the reporting period)
Total Net Assets |
$7,684,588 |
# of Portfolio Holdings |
1,305 |
Portfolio Turnover Rate |
227% |
Total Net Advisory Fees Paid During the Reporting Period |
$19,202 |
| Footnote |
Description |
Footnote† |
Dollar amounts displayed in 000's | |
| Holdings [Text Block] |
Security Type Breakdown (% of Net Asset Value)Footnote Reference*
U.S. Treasury Obligations |
89.4% |
U.S. Government Agencies |
14.9% |
Asset-Backed Securities |
8.4% |
Sovereign Issues |
8.1% |
Non-Agency Mortgage-Backed Securities |
1.3% |
Corporate Bonds & Notes |
0.3% |
Other Investments |
0.1% |
Short-Term Instruments |
0.2% |
Affiliated Investments |
0.2% |
Financial Derivative Instruments |
(0.1%) |
Other Assets and Liabilities, Net |
(22.8%) |
Total |
100.0% |
| Footnote |
Description |
Footnote* |
% of Net Asset Value includes derivatives instruments, if any, valued at the value used for determining the Fund's net asset value. The notional exposure of such derivatives investments therefore may be greater than what is depicted. | |
| Material Fund Change [Text Block] |
This is a summary of certain changes and planned changes of the Fund since the beginning of the reporting period. For more information, you may refer to the Fund's next prospectus, which we expect to be available by July 31, 2025 or upon request at 888.87.PIMCO (888.877.4626). Changes to Total Annual Fund Operating Expenses. Annual fund operating expenses increased during the year by 0.05% as a result of higher expenses related to interest. |
| Material Fund Change Expenses [Text Block] |
Changes to Total Annual Fund Operating Expenses. Annual fund operating expenses increased during the year by 0.05% as a result of higher expenses related to interest.
|
| Summary of Change Legend [Text Block] |
This is a summary of certain changes and planned changes of the Fund since the beginning of the reporting period. For more information, you may refer to the Fund's next prospectus, which we expect to be available by July 31, 2025 or upon request at 888.87.PIMCO (888.877.4626).
|
| C000064148 |
|
| Shareholder Report [Line Items] |
|
| Fund Name |
PIMCO Real Return Fund
|
| Class Name |
I-2
|
| Trading Symbol |
PRLPX
|
| Annual or Semi-Annual Statement [Text Block] |
This annual shareholder report contains important information about the PIMCO Real Return Fund (the "Fund") for the period of April 1, 2024 to March 31, 2025 (the "reporting period").
|
| Shareholder Report Annual or Semi-Annual |
Annual Shareholder Report
|
| Additional Information [Text Block] |
You can find additional information about the Fund at www.pimco.com/literature. You can also request this information by contacting us at 888.87.PIMCO (888.877.4626).
|
| Material Fund Change Notice [Text Block] |
This report describes changes to the Fund that occurred during the reporting period.
|
| Additional Information Phone Number |
888.87.PIMCO (888.877.4626)
|
| Expenses [Text Block] |
What were the Fund costs for the reporting period?(based on a hypothetical $10,000 investment)
Class Name |
Cost of a $10,000 investment |
Costs paid as a percentage of a $10,000 investment |
I-2 |
$67 |
0.65% | |
| Expenses Paid, Amount |
$ 67
|
| Expense Ratio, Percent |
0.65%
|
| Factors Affecting Performance [Text Block] |
How did the Fund perform during the reporting period and what affected its performance?The following affected performance (on a gross basis) during the reporting period: Eurozone interest rate strategies, including short exposure to duration and exposure to swap spreads, contributed to relative performance versus the Bloomberg U.S. TIPS Index ("Index"), as eurozone rates rose, while swaps spreads tightened. U.S. yield curve positioning, specifically overweight exposure to intermediate maturities relative to underweight exposure to long-term maturities, contributed to relative performance versus the Index, as the U.S. yield curve steepened. Overweight exposure to intermediate U.S. breakeven inflation contributed to relative performance versus the Index, as intermediate U.S. breakeven inflation rose. Exposure to securitized assets, including non-agency residential mortgage-backed securities and collateralized loan obligations, contributed to relative performance versus the Index, as spreads broadly tightened across these sectors. Long exposure to U.K. duration detracted from relative performance versus the Index, as U.K. interest rates broadly moved higher. There were no other material detractors for this Fund.
|
| Performance Past Does Not Indicate Future [Text] |
Performance quoted represents past performance. Past performance is not a guarantee or a reliable indicator of future results.
|
| Line Graph [Table Text Block] |
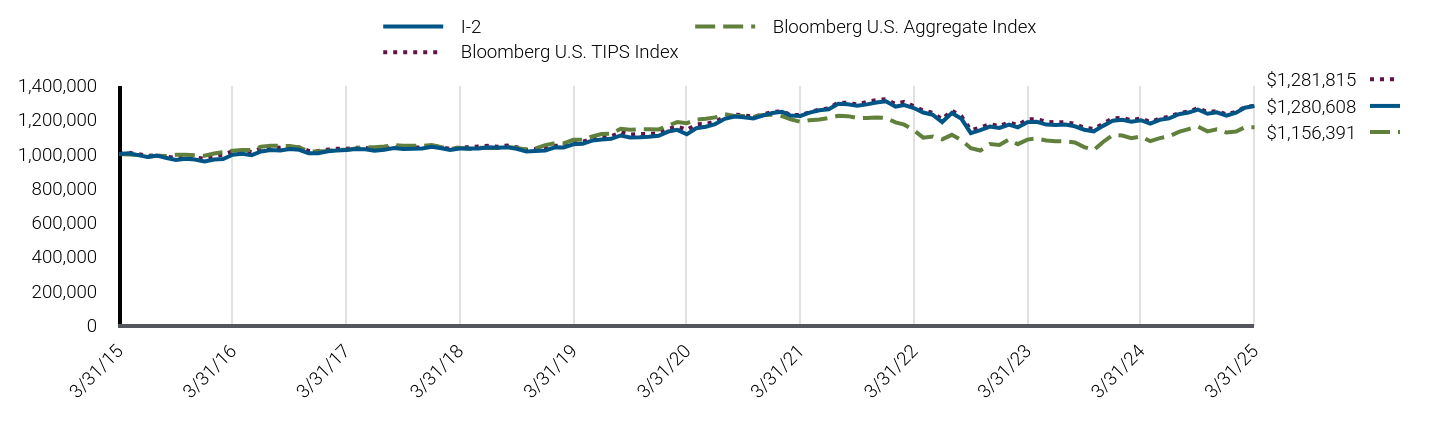
|
I-2 |
Bloomberg U.S. Aggregate Index |
Bloomberg U.S. TIPS Index |
3/31/15 |
$1,000,000 |
$1,000,000 |
$1,000,000 |
4/30/15 |
$1,004,277 |
$996,412 |
$1,007,358 |
5/31/15 |
$993,185 |
$994,012 |
$999,089 |
6/30/15 |
$982,964 |
$983,174 |
$989,363 |
7/31/15 |
$990,923 |
$990,008 |
$991,398 |
8/31/15 |
$976,131 |
$988,586 |
$983,840 |
9/30/15 |
$964,973 |
$995,273 |
$978,028 |
10/31/15 |
$972,008 |
$995,439 |
$980,501 |
11/30/15 |
$968,077 |
$992,809 |
$979,546 |
12/31/15 |
$956,821 |
$989,601 |
$971,787 |
1/31/16 |
$968,331 |
$1,003,219 |
$986,217 |
2/29/16 |
$970,763 |
$1,010,335 |
$997,187 |
3/31/16 |
$996,035 |
$1,019,605 |
$1,015,106 |
4/30/16 |
$1,001,271 |
$1,023,519 |
$1,018,620 |
5/31/16 |
$992,800 |
$1,023,781 |
$1,011,416 |
6/30/16 |
$1,014,466 |
$1,042,177 |
$1,032,440 |
7/31/16 |
$1,023,383 |
$1,048,765 |
$1,041,390 |
8/31/16 |
$1,020,418 |
$1,047,566 |
$1,036,719 |
9/30/16 |
$1,028,455 |
$1,046,952 |
$1,042,394 |
10/31/16 |
$1,024,526 |
$1,038,944 |
$1,038,223 |
11/30/16 |
$1,004,202 |
$1,014,369 |
$1,018,300 |
12/31/16 |
$1,004,044 |
$1,015,800 |
$1,017,300 |
1/31/17 |
$1,015,720 |
$1,017,793 |
$1,025,852 |
2/28/17 |
$1,020,945 |
$1,024,634 |
$1,030,684 |
3/31/17 |
$1,022,619 |
$1,024,097 |
$1,030,132 |
4/30/17 |
$1,028,531 |
$1,032,000 |
$1,036,226 |
5/31/17 |
$1,028,017 |
$1,039,943 |
$1,035,781 |
6/30/17 |
$1,019,370 |
$1,038,896 |
$1,025,961 |
7/31/17 |
$1,024,228 |
$1,043,367 |
$1,030,532 |
8/31/17 |
$1,034,785 |
$1,052,726 |
$1,041,497 |
9/30/17 |
$1,028,952 |
$1,047,712 |
$1,034,823 |
10/31/17 |
$1,031,247 |
$1,048,319 |
$1,037,037 |
11/30/17 |
$1,032,121 |
$1,046,973 |
$1,038,383 |
12/31/17 |
$1,042,368 |
$1,051,778 |
$1,047,889 |
1/31/18 |
$1,033,625 |
$1,039,665 |
$1,038,904 |
2/28/18 |
$1,022,937 |
$1,029,809 |
$1,028,807 |
3/31/18 |
$1,031,553 |
$1,036,414 |
$1,039,614 |
4/30/18 |
$1,031,391 |
$1,028,705 |
$1,039,018 |
5/31/18 |
$1,032,078 |
$1,036,047 |
$1,043,447 |
6/30/18 |
$1,039,218 |
$1,034,773 |
$1,047,633 |
7/31/18 |
$1,035,792 |
$1,035,019 |
$1,042,593 |
8/31/18 |
$1,039,613 |
$1,041,679 |
$1,050,102 |
9/30/18 |
$1,030,599 |
$1,034,971 |
$1,039,044 |
10/31/18 |
$1,013,956 |
$1,026,792 |
$1,024,151 |
11/30/18 |
$1,017,917 |
$1,032,921 |
$1,029,044 |
12/31/18 |
$1,020,795 |
$1,051,898 |
$1,034,667 |
1/31/19 |
$1,038,871 |
$1,063,068 |
$1,048,586 |
2/28/19 |
$1,037,573 |
$1,062,452 |
$1,048,450 |
3/31/19 |
$1,056,675 |
$1,082,853 |
$1,067,721 |
4/30/19 |
$1,060,273 |
$1,083,130 |
$1,071,271 |
5/31/19 |
$1,078,137 |
$1,102,358 |
$1,088,971 |
6/30/19 |
$1,084,876 |
$1,116,201 |
$1,098,308 |
7/31/19 |
$1,088,582 |
$1,118,657 |
$1,102,211 |
8/31/19 |
$1,108,033 |
$1,147,643 |
$1,128,442 |
9/30/19 |
$1,096,840 |
$1,141,531 |
$1,113,082 |
10/31/19 |
$1,097,525 |
$1,144,969 |
$1,115,928 |
11/30/19 |
$1,100,428 |
$1,144,386 |
$1,117,630 |
12/31/19 |
$1,106,635 |
$1,143,588 |
$1,121,867 |
1/31/20 |
$1,131,046 |
$1,165,596 |
$1,145,423 |
2/29/20 |
$1,140,606 |
$1,186,575 |
$1,161,276 |
3/31/20 |
$1,114,874 |
$1,179,592 |
$1,140,859 |
4/30/20 |
$1,150,285 |
$1,200,561 |
$1,172,593 |
5/31/20 |
$1,158,989 |
$1,206,151 |
$1,176,117 |
6/30/20 |
$1,174,614 |
$1,213,749 |
$1,189,245 |
7/31/20 |
$1,205,219 |
$1,231,878 |
$1,216,571 |
8/31/20 |
$1,218,883 |
$1,221,935 |
$1,229,861 |
9/30/20 |
$1,214,720 |
$1,221,265 |
$1,225,326 |
10/31/20 |
$1,207,278 |
$1,215,812 |
$1,217,412 |
11/30/20 |
$1,223,552 |
$1,227,742 |
$1,231,063 |
12/31/20 |
$1,239,157 |
$1,229,433 |
$1,245,186 |
1/31/21 |
$1,245,979 |
$1,220,618 |
$1,249,304 |
2/28/21 |
$1,224,517 |
$1,202,992 |
$1,229,179 |
3/31/21 |
$1,222,307 |
$1,187,971 |
$1,226,855 |
4/30/21 |
$1,241,356 |
$1,197,356 |
$1,244,024 |
5/31/21 |
$1,255,290 |
$1,201,268 |
$1,259,091 |
6/30/21 |
$1,261,320 |
$1,209,708 |
$1,266,717 |
7/31/21 |
$1,293,112 |
$1,223,233 |
$1,300,475 |
8/31/21 |
$1,290,759 |
$1,220,905 |
$1,298,188 |
9/30/21 |
$1,281,056 |
$1,210,334 |
$1,288,906 |
10/31/21 |
$1,289,762 |
$1,210,000 |
$1,303,532 |
11/30/21 |
$1,300,345 |
$1,213,580 |
$1,315,189 |
12/31/21 |
$1,308,164 |
$1,210,475 |
$1,319,351 |
1/31/22 |
$1,276,932 |
$1,184,396 |
$1,292,667 |
2/28/22 |
$1,285,659 |
$1,171,183 |
$1,303,707 |
3/31/22 |
$1,268,176 |
$1,138,645 |
$1,279,468 |
4/30/22 |
$1,241,814 |
$1,095,436 |
$1,253,318 |
5/31/22 |
$1,228,324 |
$1,102,499 |
$1,240,883 |
6/30/22 |
$1,186,412 |
$1,085,203 |
$1,201,616 |
7/31/22 |
$1,239,088 |
$1,111,719 |
$1,253,928 |
8/31/22 |
$1,205,414 |
$1,080,306 |
$1,220,580 |
9/30/22 |
$1,121,868 |
$1,033,630 |
$1,139,803 |
10/31/22 |
$1,139,568 |
$1,020,242 |
$1,153,964 |
11/30/22 |
$1,159,806 |
$1,057,762 |
$1,175,039 |
12/31/22 |
$1,151,769 |
$1,052,991 |
$1,163,065 |
1/31/23 |
$1,172,111 |
$1,085,385 |
$1,184,372 |
2/28/23 |
$1,155,521 |
$1,057,322 |
$1,168,130 |
3/31/23 |
$1,186,032 |
$1,084,180 |
$1,201,894 |
4/30/23 |
$1,187,878 |
$1,090,751 |
$1,203,212 |
5/31/23 |
$1,171,564 |
$1,078,874 |
$1,188,819 |
6/30/23 |
$1,169,233 |
$1,075,027 |
$1,184,814 |
7/31/23 |
$1,172,546 |
$1,074,277 |
$1,186,301 |
8/31/23 |
$1,161,925 |
$1,067,415 |
$1,175,707 |
9/30/23 |
$1,141,852 |
$1,040,290 |
$1,154,005 |
10/31/23 |
$1,132,490 |
$1,023,873 |
$1,145,656 |
11/30/23 |
$1,164,213 |
$1,070,241 |
$1,176,694 |
12/31/23 |
$1,193,644 |
$1,111,209 |
$1,208,370 |
1/31/24 |
$1,199,187 |
$1,108,157 |
$1,210,515 |
2/29/24 |
$1,188,031 |
$1,092,501 |
$1,197,508 |
3/31/24 |
$1,197,318 |
$1,102,589 |
$1,207,363 |
4/30/24 |
$1,177,251 |
$1,074,739 |
$1,187,004 |
5/31/24 |
$1,199,703 |
$1,092,959 |
$1,207,395 |
6/30/24 |
$1,207,943 |
$1,103,307 |
$1,216,871 |
7/31/24 |
$1,231,934 |
$1,129,077 |
$1,238,574 |
8/31/24 |
$1,241,766 |
$1,145,301 |
$1,248,291 |
9/30/24 |
$1,259,571 |
$1,160,636 |
$1,267,030 |
10/31/24 |
$1,235,142 |
$1,131,854 |
$1,244,299 |
11/30/24 |
$1,243,394 |
$1,143,821 |
$1,250,329 |
12/31/24 |
$1,223,282 |
$1,125,101 |
$1,230,558 |
1/31/25 |
$1,241,324 |
$1,131,070 |
$1,246,472 |
2/28/25 |
$1,270,332 |
$1,155,956 |
$1,273,649 |
3/31/25 |
$1,280,608 |
$1,156,391 |
$1,281,815 |
|
| Average Annual Return [Table Text Block] |
Class/Index Name |
1 Year |
5 Years |
10 Years |
I-2 |
6.96% |
2.81% |
2.50% |
Bloomberg U.S. Aggregate Index |
4.88% |
(0.40%) |
1.46% |
Bloomberg U.S. TIPS Index |
6.17% |
2.36% |
2.51% | |
| No Deduction of Taxes [Text Block] |
Returns shown do not reflect the deduction of taxes that a shareholder would pay on Fund distributions or the redemption of Fund shares.
|
| Performance Table Market Index Changed [Text Block] |
Differences in the Fund’s performance versus an index and related attribution information with respect to particular categories of securities or individual positions may be attributable, in part, to differences in the pricing methodologies used by the Fund and the index.
|
| Updated Performance Information Location [Text Block] |
For performance current to the most recent month-end, visit www.pimco.com/literature or via 888.87.PIMCO (888.877.4626).
|
| AssetsNet |
$ 7,684,588,000
|
| Holdings Count | Holding |
1,305
|
| Advisory Fees Paid, Amount |
$ 19,202,000
|
| InvestmentCompanyPortfolioTurnover |
227.00%
|
| Additional Fund Statistics [Text Block] |
Key Fund StatisticsFootnote Reference† (as of the end of the reporting period)
Total Net Assets |
$7,684,588 |
# of Portfolio Holdings |
1,305 |
Portfolio Turnover Rate |
227% |
Total Net Advisory Fees Paid During the Reporting Period |
$19,202 |
| Footnote |
Description |
Footnote† |
Dollar amounts displayed in 000's | |
| Holdings [Text Block] |
Security Type Breakdown (% of Net Asset Value)Footnote Reference*
U.S. Treasury Obligations |
89.4% |
U.S. Government Agencies |
14.9% |
Asset-Backed Securities |
8.4% |
Sovereign Issues |
8.1% |
Non-Agency Mortgage-Backed Securities |
1.3% |
Corporate Bonds & Notes |
0.3% |
Other Investments |
0.1% |
Short-Term Instruments |
0.2% |
Affiliated Investments |
0.2% |
Financial Derivative Instruments |
(0.1%) |
Other Assets and Liabilities, Net |
(22.8%) |
Total |
100.0% |
| Footnote |
Description |
Footnote* |
% of Net Asset Value includes derivatives instruments, if any, valued at the value used for determining the Fund's net asset value. The notional exposure of such derivatives investments therefore may be greater than what is depicted. | |
| Material Fund Change [Text Block] |
This is a summary of certain changes and planned changes of the Fund since the beginning of the reporting period. For more information, you may refer to the Fund's next prospectus, which we expect to be available by July 31, 2025 or upon request at 888.87.PIMCO (888.877.4626). Changes to Total Annual Fund Operating Expenses. Annual fund operating expenses increased during the year by 0.05% as a result of higher expenses related to interest. |
| Material Fund Change Expenses [Text Block] |
Changes to Total Annual Fund Operating Expenses. Annual fund operating expenses increased during the year by 0.05% as a result of higher expenses related to interest.
|
| Summary of Change Legend [Text Block] |
This is a summary of certain changes and planned changes of the Fund since the beginning of the reporting period. For more information, you may refer to the Fund's next prospectus, which we expect to be available by July 31, 2025 or upon request at 888.87.PIMCO (888.877.4626).
|
| C000026612 |
|
| Shareholder Report [Line Items] |
|
| Fund Name |
PIMCO Real Return Fund
|
| Class Name |
Class R
|
| Trading Symbol |
PRRRX
|
| Annual or Semi-Annual Statement [Text Block] |
This annual shareholder report contains important information about the PIMCO Real Return Fund (the "Fund") for the period of April 1, 2024 to March 31, 2025 (the "reporting period").
|
| Shareholder Report Annual or Semi-Annual |
Annual Shareholder Report
|
| Additional Information [Text Block] |
You can find additional information about the Fund at www.pimco.com/literature. You can also request this information by contacting us at 888.87.PIMCO (888.877.4626).
|
| Material Fund Change Notice [Text Block] |
This report describes changes to the Fund that occurred during the reporting period.
|
| Additional Information Phone Number |
888.87.PIMCO (888.877.4626)
|
| Expenses [Text Block] |
What were the Fund costs for the reporting period?(based on a hypothetical $10,000 investment)
Class Name |
Cost of a $10,000 investment |
Costs paid as a percentage of a $10,000 investment |
Class R |
$124 |
1.20% | |
| Expenses Paid, Amount |
$ 124
|
| Expense Ratio, Percent |
1.20%
|
| Factors Affecting Performance [Text Block] |
How did the Fund perform during the reporting period and what affected its performance?The following affected performance (on a gross basis) during the reporting period: Eurozone interest rate strategies, including short exposure to duration and exposure to swap spreads, contributed to relative performance versus the Bloomberg U.S. TIPS Index ("Index"), as eurozone rates rose, while swaps spreads tightened. U.S. yield curve positioning, specifically overweight exposure to intermediate maturities relative to underweight exposure to long-term maturities, contributed to relative performance versus the Index, as the U.S. yield curve steepened. Overweight exposure to intermediate U.S. breakeven inflation contributed to relative performance versus the Index, as intermediate U.S. breakeven inflation rose. Exposure to securitized assets, including non-agency residential mortgage-backed securities and collateralized loan obligations, contributed to relative performance versus the Index, as spreads broadly tightened across these sectors. Long exposure to U.K. duration detracted from relative performance versus the Index, as U.K. interest rates broadly moved higher. There were no other material detractors for this Fund.
|
| Performance Past Does Not Indicate Future [Text] |
Performance quoted represents past performance. Past performance is not a guarantee or a reliable indicator of future results.
|
| Line Graph [Table Text Block] |
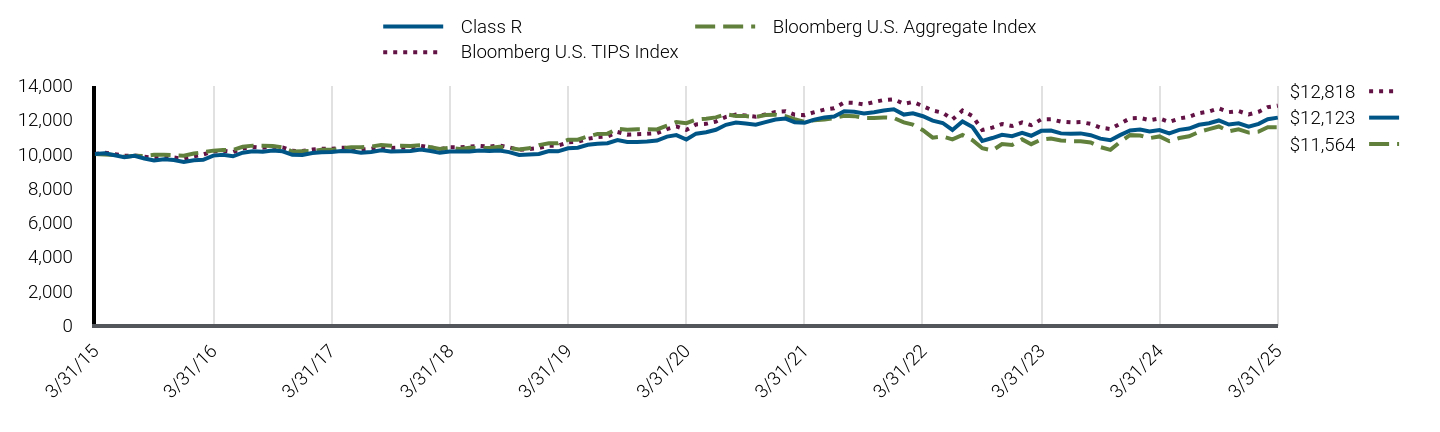
|
Class R |
Bloomberg U.S. Aggregate Index |
Bloomberg U.S. TIPS Index |
3/31/15 |
$10,000 |
$10,000 |
$10,000 |
4/30/15 |
$10,038 |
$9,964 |
$10,074 |
5/31/15 |
$9,923 |
$9,940 |
$9,991 |
6/30/15 |
$9,816 |
$9,832 |
$9,894 |
7/31/15 |
$9,891 |
$9,900 |
$9,914 |
8/31/15 |
$9,739 |
$9,886 |
$9,838 |
9/30/15 |
$9,623 |
$9,953 |
$9,780 |
10/31/15 |
$9,689 |
$9,954 |
$9,805 |
11/30/15 |
$9,645 |
$9,928 |
$9,795 |
12/31/15 |
$9,528 |
$9,896 |
$9,718 |
1/31/16 |
$9,639 |
$10,032 |
$9,862 |
2/29/16 |
$9,659 |
$10,103 |
$9,972 |
3/31/16 |
$9,906 |
$10,196 |
$10,151 |
4/30/16 |
$9,953 |
$10,235 |
$10,186 |
5/31/16 |
$9,865 |
$10,238 |
$10,114 |
6/30/16 |
$10,075 |
$10,422 |
$10,324 |
7/31/16 |
$10,159 |
$10,488 |
$10,414 |
8/31/16 |
$10,125 |
$10,476 |
$10,367 |
9/30/16 |
$10,200 |
$10,470 |
$10,424 |
10/31/16 |
$10,156 |
$10,389 |
$10,382 |
11/30/16 |
$9,950 |
$10,144 |
$10,183 |
12/31/16 |
$9,944 |
$10,158 |
$10,173 |
1/31/17 |
$10,055 |
$10,178 |
$10,259 |
2/28/17 |
$10,103 |
$10,246 |
$10,307 |
3/31/17 |
$10,114 |
$10,241 |
$10,301 |
4/30/17 |
$10,168 |
$10,320 |
$10,362 |
5/31/17 |
$10,159 |
$10,399 |
$10,358 |
6/30/17 |
$10,068 |
$10,389 |
$10,260 |
7/31/17 |
$10,112 |
$10,434 |
$10,305 |
8/31/17 |
$10,211 |
$10,527 |
$10,415 |
9/30/17 |
$10,149 |
$10,477 |
$10,348 |
10/31/17 |
$10,167 |
$10,483 |
$10,370 |
11/30/17 |
$10,171 |
$10,470 |
$10,384 |
12/31/17 |
$10,267 |
$10,518 |
$10,479 |
1/31/18 |
$10,176 |
$10,397 |
$10,389 |
2/28/18 |
$10,067 |
$10,298 |
$10,288 |
3/31/18 |
$10,147 |
$10,364 |
$10,396 |
4/30/18 |
$10,141 |
$10,287 |
$10,390 |
5/31/18 |
$10,143 |
$10,360 |
$10,434 |
6/30/18 |
$10,208 |
$10,348 |
$10,476 |
7/31/18 |
$10,170 |
$10,350 |
$10,426 |
8/31/18 |
$10,202 |
$10,417 |
$10,501 |
9/30/18 |
$10,110 |
$10,350 |
$10,390 |
10/31/18 |
$9,942 |
$10,268 |
$10,242 |
11/30/18 |
$9,976 |
$10,329 |
$10,290 |
12/31/18 |
$10,000 |
$10,519 |
$10,347 |
1/31/19 |
$10,172 |
$10,631 |
$10,486 |
2/28/19 |
$10,155 |
$10,625 |
$10,484 |
3/31/19 |
$10,337 |
$10,829 |
$10,677 |
4/30/19 |
$10,368 |
$10,831 |
$10,713 |
5/31/19 |
$10,538 |
$11,024 |
$10,890 |
6/30/19 |
$10,599 |
$11,162 |
$10,983 |
7/31/19 |
$10,630 |
$11,187 |
$11,022 |
8/31/19 |
$10,815 |
$11,476 |
$11,284 |
9/30/19 |
$10,701 |
$11,415 |
$11,131 |
10/31/19 |
$10,703 |
$11,450 |
$11,159 |
11/30/19 |
$10,726 |
$11,444 |
$11,176 |
12/31/19 |
$10,782 |
$11,436 |
$11,219 |
1/31/20 |
$11,014 |
$11,656 |
$11,454 |
2/29/20 |
$11,103 |
$11,866 |
$11,613 |
3/31/20 |
$10,847 |
$11,796 |
$11,409 |
4/30/20 |
$11,187 |
$12,006 |
$11,726 |
5/31/20 |
$11,266 |
$12,062 |
$11,761 |
6/30/20 |
$11,413 |
$12,137 |
$11,892 |
7/31/20 |
$11,705 |
$12,319 |
$12,166 |
8/31/20 |
$11,832 |
$12,219 |
$12,299 |
9/30/20 |
$11,786 |
$12,213 |
$12,253 |
10/31/20 |
$11,709 |
$12,158 |
$12,174 |
11/30/20 |
$11,861 |
$12,277 |
$12,311 |
12/31/20 |
$12,008 |
$12,294 |
$12,452 |
1/31/21 |
$12,067 |
$12,206 |
$12,493 |
2/28/21 |
$11,855 |
$12,030 |
$12,292 |
3/31/21 |
$11,828 |
$11,880 |
$12,269 |
4/30/21 |
$12,006 |
$11,974 |
$12,440 |
5/31/21 |
$12,136 |
$12,013 |
$12,591 |
6/30/21 |
$12,188 |
$12,097 |
$12,667 |
7/31/21 |
$12,490 |
$12,232 |
$13,005 |
8/31/21 |
$12,461 |
$12,209 |
$12,982 |
9/30/21 |
$12,362 |
$12,103 |
$12,889 |
10/31/21 |
$12,440 |
$12,100 |
$13,035 |
11/30/21 |
$12,537 |
$12,136 |
$13,152 |
12/31/21 |
$12,606 |
$12,105 |
$13,194 |
1/31/22 |
$12,300 |
$11,844 |
$12,927 |
2/28/22 |
$12,379 |
$11,712 |
$13,037 |
3/31/22 |
$12,204 |
$11,386 |
$12,795 |
4/30/22 |
$11,945 |
$10,954 |
$12,533 |
5/31/22 |
$11,810 |
$11,025 |
$12,409 |
6/30/22 |
$11,402 |
$10,852 |
$12,016 |
7/31/22 |
$11,903 |
$11,117 |
$12,539 |
8/31/22 |
$11,574 |
$10,803 |
$12,206 |
9/30/22 |
$10,766 |
$10,336 |
$11,398 |
10/31/22 |
$10,931 |
$10,202 |
$11,540 |
11/30/22 |
$11,121 |
$10,578 |
$11,750 |
12/31/22 |
$11,038 |
$10,530 |
$11,631 |
1/31/23 |
$11,228 |
$10,854 |
$11,844 |
2/28/23 |
$11,064 |
$10,573 |
$11,681 |
3/31/23 |
$11,351 |
$10,842 |
$12,019 |
4/30/23 |
$11,364 |
$10,908 |
$12,032 |
5/31/23 |
$11,203 |
$10,789 |
$11,888 |
6/30/23 |
$11,175 |
$10,750 |
$11,848 |
7/31/23 |
$11,202 |
$10,743 |
$11,863 |
8/31/23 |
$11,095 |
$10,674 |
$11,757 |
9/30/23 |
$10,898 |
$10,403 |
$11,540 |
10/31/23 |
$10,804 |
$10,239 |
$11,457 |
11/30/23 |
$11,102 |
$10,702 |
$11,767 |
12/31/23 |
$11,377 |
$11,112 |
$12,084 |
1/31/24 |
$11,425 |
$11,082 |
$12,105 |
2/29/24 |
$11,313 |
$10,925 |
$11,975 |
3/31/24 |
$11,397 |
$11,026 |
$12,074 |
4/30/24 |
$11,201 |
$10,747 |
$11,870 |
5/31/24 |
$11,409 |
$10,930 |
$12,074 |
6/30/24 |
$11,482 |
$11,033 |
$12,169 |
7/31/24 |
$11,705 |
$11,291 |
$12,386 |
8/31/24 |
$11,792 |
$11,453 |
$12,483 |
9/30/24 |
$11,956 |
$11,606 |
$12,670 |
10/31/24 |
$11,719 |
$11,319 |
$12,443 |
11/30/24 |
$11,792 |
$11,438 |
$12,503 |
12/31/24 |
$11,596 |
$11,251 |
$12,306 |
1/31/25 |
$11,761 |
$11,311 |
$12,465 |
2/28/25 |
$12,031 |
$11,560 |
$12,736 |
3/31/25 |
$12,123 |
$11,564 |
$12,818 |
|
| Average Annual Return [Table Text Block] |
Class/Index Name |
1 Year |
5 Years |
10 Years |
Class R |
6.37% |
2.25% |
1.94% |
Bloomberg U.S. Aggregate Index |
4.88% |
(0.40%) |
1.46% |
Bloomberg U.S. TIPS Index |
6.17% |
2.36% |
2.51% | |
| No Deduction of Taxes [Text Block] |
Returns shown do not reflect the deduction of taxes that a shareholder would pay on Fund distributions or the redemption of Fund shares.
|
| Performance Table Market Index Changed [Text Block] |
Differences in the Fund’s performance versus an index and related attribution information with respect to particular categories of securities or individual positions may be attributable, in part, to differences in the pricing methodologies used by the Fund and the index.
|
| Updated Performance Information Location [Text Block] |
For performance current to the most recent month-end, visit www.pimco.com/literature or via 888.87.PIMCO (888.877.4626).
|
| AssetsNet |
$ 7,684,588,000
|
| Holdings Count | Holding |
1,305
|
| Advisory Fees Paid, Amount |
$ 19,202,000
|
| InvestmentCompanyPortfolioTurnover |
227.00%
|
| Additional Fund Statistics [Text Block] |
Key Fund StatisticsFootnote Reference† (as of the end of the reporting period)
Total Net Assets |
$7,684,588 |
# of Portfolio Holdings |
1,305 |
Portfolio Turnover Rate |
227% |
Total Net Advisory Fees Paid During the Reporting Period |
$19,202 |
| Footnote |
Description |
Footnote† |
Dollar amounts displayed in 000's | |
| Holdings [Text Block] |
Security Type Breakdown (% of Net Asset Value)Footnote Reference*
U.S. Treasury Obligations |
89.4% |
U.S. Government Agencies |
14.9% |
Asset-Backed Securities |
8.4% |
Sovereign Issues |
8.1% |
Non-Agency Mortgage-Backed Securities |
1.3% |
Corporate Bonds & Notes |
0.3% |
Other Investments |
0.1% |
Short-Term Instruments |
0.2% |
Affiliated Investments |
0.2% |
Financial Derivative Instruments |
(0.1%) |
Other Assets and Liabilities, Net |
(22.8%) |
Total |
100.0% |
| Footnote |
Description |
Footnote* |
% of Net Asset Value includes derivatives instruments, if any, valued at the value used for determining the Fund's net asset value. The notional exposure of such derivatives investments therefore may be greater than what is depicted. | |
| Material Fund Change [Text Block] |
This is a summary of certain changes and planned changes of the Fund since the beginning of the reporting period. For more information, you may refer to the Fund's next prospectus, which we expect to be available by July 31, 2025 or upon request at 888.87.PIMCO (888.877.4626). Changes to Total Annual Fund Operating Expenses. Annual fund operating expenses increased during the year by 0.05% as a result of higher expenses related to interest. |
| Material Fund Change Expenses [Text Block] |
Changes to Total Annual Fund Operating Expenses. Annual fund operating expenses increased during the year by 0.05% as a result of higher expenses related to interest.
|
| Summary of Change Legend [Text Block] |
This is a summary of certain changes and planned changes of the Fund since the beginning of the reporting period. For more information, you may refer to the Fund's next prospectus, which we expect to be available by July 31, 2025 or upon request at 888.87.PIMCO (888.877.4626).
|
| C000026614 |
|
| Shareholder Report [Line Items] |
|
| Fund Name |
PIMCO RealEstateRealReturn Strategy Fund
|
| Class Name |
Class A
|
| Trading Symbol |
PETAX
|
| Annual or Semi-Annual Statement [Text Block] |
This annual shareholder report contains important information about the PIMCO RealEstateRealReturn Strategy Fund (the "Fund") for the period of April 1, 2024 to March 31, 2025 (the "reporting period").
|
| Shareholder Report Annual or Semi-Annual |
Annual Shareholder Report
|
| Additional Information [Text Block] |
You can find additional information about the Fund at www.pimco.com/literature. You can also request this information by contacting us at 888.87.PIMCO (888.877.4626).
|
| Material Fund Change Notice [Text Block] |
This report describes changes to the Fund that occurred during the reporting period.
|
| Additional Information Phone Number |
888.87.PIMCO (888.877.4626)
|
| Expenses [Text Block] |
What were the Fund costs for the reporting period?(based on a hypothetical $10,000 investment)
Class Name |
Cost of a $10,000 investment |
Costs paid as a percentage of a $10,000 investment |
Class A |
$616 |
5.89% | |
| Expenses Paid, Amount |
$ 616
|
| Expense Ratio, Percent |
5.89%
|
| Factors Affecting Performance [Text Block] |
How did the Fund perform during the reporting period and what affected its performance?The following affected performance (on a gross basis) during the reporting period: Eurozone interest rate strategies, including short exposure to duration and exposure to swap spreads, contributed to relative performance versus the Dow Jones U.S. Select REIT Total Return Index ("Index"), as eurozone rates rose, while swaps spreads tightened. Overweight exposure to intermediate U.S. breakeven inflation contributed to relative performance versus the Index, as intermediate U.S. breakeven inflation rose. Exposure to securitized assets, including U.S. non-agency residential mortgage-backed securities and collateralized loan obligations, contributed to relative performance versus the Index, as spreads broadly tightened across these sectors. Underweight exposure to healthcare real estate investment trusts ("REITs") detracted from relative performance versus the Index, as healthcare REITs posted positive returns. Underweight exposure to data center REITs detracted from relative performance versus the Index, as data center REITs delivered positive returns. Underweight exposure to office REITs detracted from relative performance versus the Index, as office REITs delivered positive returns.
|
| Performance Past Does Not Indicate Future [Text] |
Performance quoted represents past performance. Past performance is not a guarantee or a reliable indicator of future results.
|
| Line Graph [Table Text Block] |
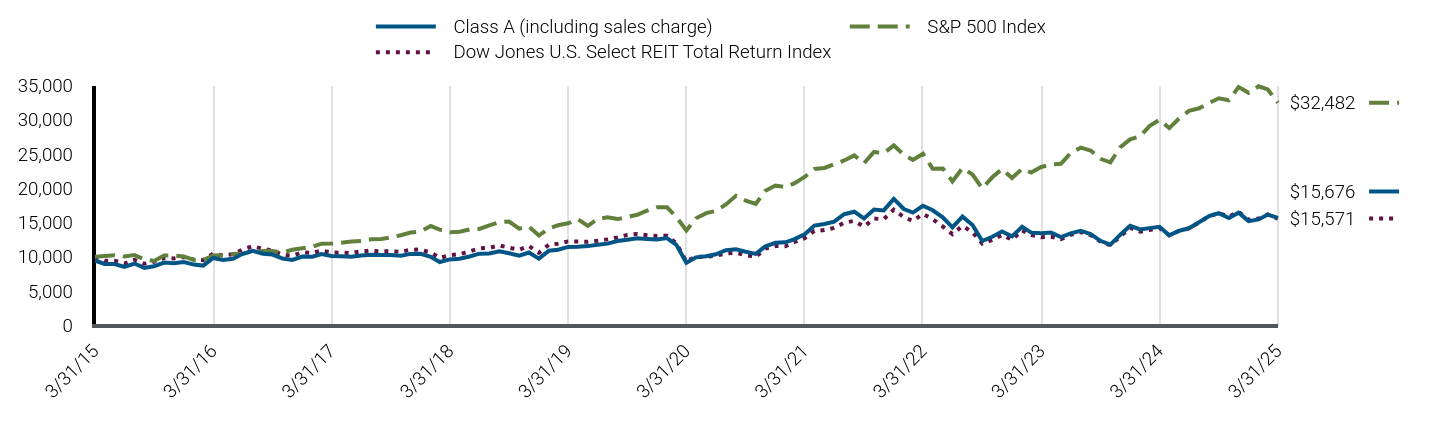
|
Class A (including sales charge) |
S&P 500 Index |
Dow Jones U.S. Select REIT Total Return Index |
3/31/15 |
$9,455 |
$10,000 |
$10,000 |
4/30/15 |
$8,960 |
$10,096 |
$9,421 |
5/31/15 |
$8,936 |
$10,226 |
$9,417 |
6/30/15 |
$8,532 |
$10,028 |
$9,000 |
7/31/15 |
$9,013 |
$10,238 |
$9,534 |
8/31/15 |
$8,380 |
$9,620 |
$8,976 |
9/30/15 |
$8,611 |
$9,382 |
$9,278 |
10/31/15 |
$9,156 |
$10,174 |
$9,819 |
11/30/15 |
$9,065 |
$10,204 |
$9,765 |
12/31/15 |
$9,222 |
$10,043 |
$9,978 |
1/31/16 |
$8,859 |
$9,545 |
$9,584 |
2/29/16 |
$8,711 |
$9,532 |
$9,498 |
3/31/16 |
$9,827 |
$10,178 |
$10,488 |
4/30/16 |
$9,544 |
$10,218 |
$10,181 |
5/31/16 |
$9,706 |
$10,401 |
$10,386 |
6/30/16 |
$10,438 |
$10,428 |
$11,057 |
7/31/16 |
$10,869 |
$10,813 |
$11,541 |
8/31/16 |
$10,451 |
$10,828 |
$11,151 |
9/30/16 |
$10,328 |
$10,830 |
$10,921 |
10/31/16 |
$9,747 |
$10,632 |
$10,306 |
11/30/16 |
$9,544 |
$11,026 |
$10,167 |
12/31/16 |
$10,031 |
$11,244 |
$10,644 |
1/31/17 |
$10,017 |
$11,457 |
$10,553 |
2/28/17 |
$10,382 |
$11,912 |
$10,922 |
3/31/17 |
$10,105 |
$11,926 |
$10,615 |
4/30/17 |
$10,078 |
$12,049 |
$10,590 |
5/31/17 |
$10,010 |
$12,218 |
$10,531 |
6/30/17 |
$10,189 |
$12,294 |
$10,789 |
7/31/17 |
$10,312 |
$12,547 |
$10,888 |
8/31/17 |
$10,257 |
$12,586 |
$10,801 |
9/30/17 |
$10,244 |
$12,845 |
$10,830 |
10/31/17 |
$10,149 |
$13,145 |
$10,712 |
11/30/17 |
$10,421 |
$13,548 |
$11,041 |
12/31/17 |
$10,426 |
$13,699 |
$11,045 |
1/31/18 |
$9,988 |
$14,483 |
$10,607 |
2/28/18 |
$9,234 |
$13,949 |
$9,843 |
3/31/18 |
$9,618 |
$13,595 |
$10,224 |
4/30/18 |
$9,727 |
$13,647 |
$10,376 |
5/31/18 |
$10,043 |
$13,976 |
$10,788 |
6/30/18 |
$10,454 |
$14,062 |
$11,246 |
7/31/18 |
$10,495 |
$14,585 |
$11,307 |
8/31/18 |
$10,810 |
$15,060 |
$11,644 |
9/30/18 |
$10,509 |
$15,146 |
$11,327 |
10/31/18 |
$10,150 |
$14,111 |
$11,038 |
11/30/18 |
$10,619 |
$14,398 |
$11,573 |
12/31/18 |
$9,724 |
$13,098 |
$10,579 |
1/31/19 |
$10,885 |
$14,148 |
$11,786 |
2/28/19 |
$11,023 |
$14,602 |
$11,899 |
3/31/19 |
$11,442 |
$14,886 |
$12,242 |
4/30/19 |
$11,470 |
$15,489 |
$12,218 |
5/31/19 |
$11,556 |
$14,504 |
$12,177 |
6/30/19 |
$11,747 |
$15,526 |
$12,342 |
7/31/19 |
$11,920 |
$15,750 |
$12,539 |
8/31/19 |
$12,295 |
$15,500 |
$12,837 |
9/30/19 |
$12,486 |
$15,790 |
$13,185 |
10/31/19 |
$12,695 |
$16,132 |
$13,326 |
11/30/19 |
$12,576 |
$16,718 |
$13,146 |
12/31/19 |
$12,536 |
$17,222 |
$13,023 |
1/31/20 |
$12,732 |
$17,216 |
$13,077 |
2/29/20 |
$11,752 |
$15,798 |
$11,978 |
3/31/20 |
$9,116 |
$13,847 |
$9,309 |
4/30/20 |
$9,914 |
$15,622 |
$10,037 |
5/31/20 |
$10,065 |
$16,366 |
$9,974 |
6/30/20 |
$10,368 |
$16,692 |
$10,157 |
7/31/20 |
$10,958 |
$17,633 |
$10,495 |
8/31/20 |
$11,082 |
$18,900 |
$10,569 |
9/30/20 |
$10,733 |
$18,182 |
$10,241 |
10/31/20 |
$10,418 |
$17,699 |
$9,976 |
11/30/20 |
$11,518 |
$19,636 |
$11,201 |
12/31/20 |
$12,041 |
$20,391 |
$11,564 |
1/31/21 |
$12,106 |
$20,185 |
$11,541 |
2/28/21 |
$12,581 |
$20,742 |
$12,157 |
3/31/21 |
$13,288 |
$21,650 |
$12,721 |
4/30/21 |
$14,554 |
$22,806 |
$13,774 |
5/31/21 |
$14,776 |
$22,965 |
$13,898 |
6/30/21 |
$15,126 |
$23,501 |
$14,217 |
7/31/21 |
$16,214 |
$24,059 |
$14,974 |
8/31/21 |
$16,577 |
$24,791 |
$15,236 |
9/30/21 |
$15,585 |
$23,638 |
$14,395 |
10/31/21 |
$16,887 |
$25,294 |
$15,572 |
11/30/21 |
$16,763 |
$25,119 |
$15,479 |
12/31/21 |
$18,450 |
$26,244 |
$16,874 |
1/31/22 |
$16,972 |
$24,886 |
$15,784 |
2/28/22 |
$16,448 |
$24,141 |
$15,227 |
3/31/22 |
$17,447 |
$25,038 |
$16,248 |
4/30/22 |
$16,782 |
$22,854 |
$15,493 |
5/31/22 |
$15,749 |
$22,896 |
$14,425 |
6/30/22 |
$14,280 |
$21,006 |
$13,306 |
7/31/22 |
$15,863 |
$22,943 |
$14,491 |
8/31/22 |
$14,631 |
$22,007 |
$13,591 |
9/30/22 |
$12,301 |
$19,981 |
$11,926 |
10/31/22 |
$12,917 |
$21,598 |
$12,462 |
11/30/22 |
$13,687 |
$22,805 |
$13,184 |
12/31/22 |
$12,978 |
$21,491 |
$12,493 |
1/31/23 |
$14,385 |
$22,842 |
$13,865 |
2/28/23 |
$13,523 |
$22,284 |
$13,182 |
3/31/23 |
$13,444 |
$23,103 |
$12,840 |
4/30/23 |
$13,538 |
$23,463 |
$12,928 |
5/31/23 |
$12,884 |
$23,565 |
$12,572 |
6/30/23 |
$13,415 |
$25,122 |
$13,214 |
7/31/23 |
$13,803 |
$25,929 |
$13,593 |
8/31/23 |
$13,308 |
$25,516 |
$13,160 |
9/30/23 |
$12,332 |
$24,300 |
$12,237 |
10/31/23 |
$11,765 |
$23,789 |
$11,683 |
11/30/23 |
$13,193 |
$25,961 |
$12,941 |
12/31/23 |
$14,521 |
$27,141 |
$14,237 |
1/31/24 |
$13,983 |
$27,597 |
$13,663 |
2/29/24 |
$14,184 |
$29,070 |
$13,917 |
3/31/24 |
$14,370 |
$30,006 |
$14,182 |
4/30/24 |
$13,128 |
$28,780 |
$13,144 |
5/31/24 |
$13,803 |
$30,207 |
$13,781 |
6/30/24 |
$14,155 |
$31,291 |
$14,159 |
7/31/24 |
$15,038 |
$31,672 |
$14,987 |
8/31/24 |
$15,942 |
$32,440 |
$15,941 |
9/30/24 |
$16,374 |
$33,133 |
$16,362 |
10/31/24 |
$15,669 |
$32,833 |
$15,849 |
11/30/24 |
$16,439 |
$34,760 |
$16,574 |
12/31/24 |
$15,203 |
$33,931 |
$15,391 |
1/31/25 |
$15,448 |
$34,876 |
$15,577 |
2/28/25 |
$16,162 |
$34,421 |
$16,178 |
3/31/25 |
$15,676 |
$32,482 |
$15,571 |
|
| Average Annual Return [Table Text Block] |
Class/Index Name |
1 Year |
5 Years |
10 Years |
Class A (excluding sales charge) |
9.08% |
11.45% |
5.19% |
Class A (including sales charge) |
3.06% |
10.21% |
4.60% |
S&P 500 Index |
8.25% |
18.59% |
12.50% |
Dow Jones U.S. Select REIT Total Return Index |
9.79% |
10.84% |
4.53% | |
| No Deduction of Taxes [Text Block] |
Returns shown do not reflect the deduction of taxes that a shareholder would pay on Fund distributions or the redemption of Fund shares.
|
| Performance Table Market Index Changed [Text Block] |
Differences in the Fund’s performance versus an index and related attribution information with respect to particular categories of securities or individual positions may be attributable, in part, to differences in the pricing methodologies used by the Fund and the index.
|
| Updated Performance Information Location [Text Block] |
For performance current to the most recent month-end, visit www.pimco.com/literature or via 888.87.PIMCO (888.877.4626).
|
| AssetsNet |
$ 500,282,000
|
| Holdings Count | Holding |
783
|
| Advisory Fees Paid, Amount |
$ 2,475,000
|
| InvestmentCompanyPortfolioTurnover |
165.00%
|
| Additional Fund Statistics [Text Block] |
Key Fund StatisticsFootnote Reference† (as of the end of the reporting period)
Total Net Assets |
$500,282 |
# of Portfolio Holdings |
783 |
Portfolio Turnover Rate |
165% |
Total Net Advisory Fees Paid During the Reporting Period |
$2,475 |
| Footnote |
Description |
Footnote† |
Dollar amounts displayed in 000's | |
| Holdings [Text Block] |
Security Type Breakdown (% of Net Asset Value)Footnote Reference*
U.S. Treasury Obligations |
108.7% |
Real Estate Investment Trusts |
41.2% |
Asset-Backed Securities |
14.1% |
U.S. Government Agencies |
13.0% |
Sovereign Issues |
10.8% |
Corporate Bonds & Notes |
1.3% |
Non-Agency Mortgage-Backed Securities |
0.7% |
Common Stocks |
0.2% |
Preferred Securities |
0.2% |
Short-Term Instruments |
0.1% |
Affiliated Investments |
0.4% |
Financial Derivative Instruments |
(0.7%) |
Other Assets and Liabilities, Net |
(90.0%) |
Total |
100.0% |
| Footnote |
Description |
Footnote* |
% of Net Asset Value includes derivatives instruments, if any, valued at the value used for determining the Fund's net asset value. The notional exposure of such derivatives investments therefore may be greater than what is depicted. | |
| Material Fund Change [Text Block] |
This is a summary of certain changes and planned changes of the Fund since the beginning of the reporting period. For more information, you may refer to the Fund's next prospectus, which we expect to be available by July 31, 2025 or upon request at 888.87.PIMCO (888.877.4626). Changes to Total Annual Fund Operating Expenses. Annual fund operating expenses decreased during the year by 0.60% as a result of lower expenses related to interest. |
| Material Fund Change Expenses [Text Block] |
Changes to Total Annual Fund Operating Expenses. Annual fund operating expenses decreased during the year by 0.60% as a result of lower expenses related to interest.
|
| Summary of Change Legend [Text Block] |
This is a summary of certain changes and planned changes of the Fund since the beginning of the reporting period. For more information, you may refer to the Fund's next prospectus, which we expect to be available by July 31, 2025 or upon request at 888.87.PIMCO (888.877.4626).
|
| C000026616 |
|
| Shareholder Report [Line Items] |
|
| Fund Name |
PIMCO RealEstateRealReturn Strategy Fund
|
| Class Name |
Class C
|
| Trading Symbol |
PETCX
|
| Annual or Semi-Annual Statement [Text Block] |
This annual shareholder report contains important information about the PIMCO RealEstateRealReturn Strategy Fund (the "Fund") for the period of April 1, 2024 to March 31, 2025 (the "reporting period").
|
| Shareholder Report Annual or Semi-Annual |
Annual Shareholder Report
|
| Additional Information [Text Block] |
You can find additional information about the Fund at www.pimco.com/literature. You can also request this information by contacting us at 888.87.PIMCO (888.877.4626).
|
| Material Fund Change Notice [Text Block] |
This report describes changes to the Fund that occurred during the reporting period.
|
| Additional Information Phone Number |
888.87.PIMCO (888.877.4626)
|
| Expenses [Text Block] |
What were the Fund costs for the reporting period?(based on a hypothetical $10,000 investment)
Class Name |
Cost of a $10,000 investment |
Costs paid as a percentage of a $10,000 investment |
Class C |
$691 |
6.64% | |
| Expenses Paid, Amount |
$ 691
|
| Expense Ratio, Percent |
6.64%
|
| Factors Affecting Performance [Text Block] |
How did the Fund perform during the reporting period and what affected its performance?The following affected performance (on a gross basis) during the reporting period: Eurozone interest rate strategies, including short exposure to duration and exposure to swap spreads, contributed to relative performance versus the Dow Jones U.S. Select REIT Total Return Index ("Index"), as eurozone rates rose, while swaps spreads tightened. Overweight exposure to intermediate U.S. breakeven inflation contributed to relative performance versus the Index, as intermediate U.S. breakeven inflation rose. Exposure to securitized assets, including U.S. non-agency residential mortgage-backed securities and collateralized loan obligations, contributed to relative performance versus the Index, as spreads broadly tightened across these sectors. Underweight exposure to healthcare real estate investment trusts ("REITs") detracted from relative performance versus the Index, as healthcare REITs posted positive returns. Underweight exposure to data center REITs detracted from relative performance versus the Index, as data center REITs delivered positive returns. Underweight exposure to office REITs detracted from relative performance versus the Index, as office REITs delivered positive returns.
|
| Performance Past Does Not Indicate Future [Text] |
Performance quoted represents past performance. Past performance is not a guarantee or a reliable indicator of future results.
|
| Line Graph [Table Text Block] |
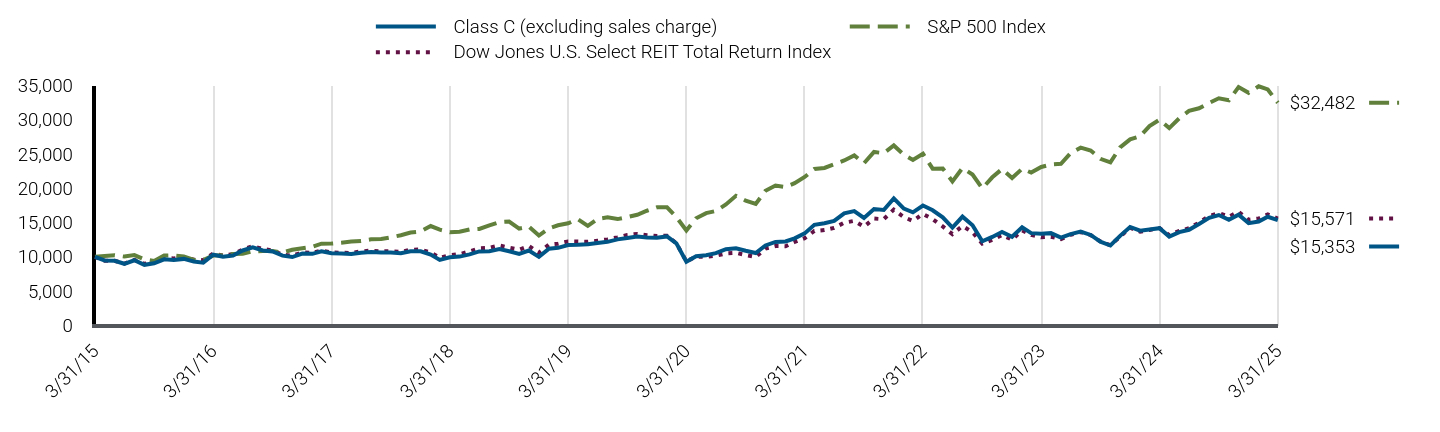
|
Class C (excluding sales charge) |
S&P 500 Index |
Dow Jones U.S. Select REIT Total Return Index |
3/31/15 |
$10,000 |
$10,000 |
$10,000 |
4/30/15 |
$9,471 |
$10,096 |
$9,421 |
5/31/15 |
$9,412 |
$10,226 |
$9,417 |
6/30/15 |
$8,978 |
$10,028 |
$9,000 |
7/31/15 |
$9,491 |
$10,238 |
$9,534 |
8/31/15 |
$8,828 |
$9,620 |
$8,976 |
9/30/15 |
$9,056 |
$9,382 |
$9,278 |
10/31/15 |
$9,629 |
$10,174 |
$9,819 |
11/30/15 |
$9,536 |
$10,204 |
$9,765 |
12/31/15 |
$9,690 |
$10,043 |
$9,978 |
1/31/16 |
$9,305 |
$9,545 |
$9,584 |
2/29/16 |
$9,144 |
$9,532 |
$9,498 |
3/31/16 |
$10,301 |
$10,178 |
$10,488 |
4/30/16 |
$9,996 |
$10,218 |
$10,181 |
5/31/16 |
$10,172 |
$10,401 |
$10,386 |
6/30/16 |
$10,919 |
$10,428 |
$11,057 |
7/31/16 |
$11,369 |
$10,813 |
$11,541 |
8/31/16 |
$10,919 |
$10,828 |
$11,151 |
9/30/16 |
$10,783 |
$10,830 |
$10,921 |
10/31/16 |
$10,170 |
$10,632 |
$10,306 |
11/30/16 |
$9,961 |
$11,026 |
$10,167 |
12/31/16 |
$10,460 |
$11,244 |
$10,644 |
1/31/17 |
$10,428 |
$11,457 |
$10,553 |
2/28/17 |
$10,799 |
$11,912 |
$10,922 |
3/31/17 |
$10,509 |
$11,926 |
$10,615 |
4/30/17 |
$10,477 |
$12,049 |
$10,590 |
5/31/17 |
$10,396 |
$12,218 |
$10,531 |
6/30/17 |
$10,579 |
$12,294 |
$10,789 |
7/31/17 |
$10,692 |
$12,547 |
$10,888 |
8/31/17 |
$10,628 |
$12,586 |
$10,801 |
9/30/17 |
$10,612 |
$12,845 |
$10,830 |
10/31/17 |
$10,515 |
$13,145 |
$10,712 |
11/30/17 |
$10,789 |
$13,548 |
$11,041 |
12/31/17 |
$10,792 |
$13,699 |
$11,045 |
1/31/18 |
$10,321 |
$14,483 |
$10,607 |
2/28/18 |
$9,541 |
$13,949 |
$9,843 |
3/31/18 |
$9,931 |
$13,595 |
$10,224 |
4/30/18 |
$10,028 |
$13,647 |
$10,376 |
5/31/18 |
$10,353 |
$13,976 |
$10,788 |
6/30/18 |
$10,776 |
$14,062 |
$11,246 |
7/31/18 |
$10,808 |
$14,585 |
$11,307 |
8/31/18 |
$11,117 |
$15,060 |
$11,644 |
9/30/18 |
$10,807 |
$15,146 |
$11,327 |
10/31/18 |
$10,427 |
$14,111 |
$11,038 |
11/30/18 |
$10,906 |
$14,398 |
$11,573 |
12/31/18 |
$9,981 |
$13,098 |
$10,579 |
1/31/19 |
$11,171 |
$14,148 |
$11,786 |
2/28/19 |
$11,303 |
$14,602 |
$11,899 |
3/31/19 |
$11,722 |
$14,886 |
$12,242 |
4/30/19 |
$11,756 |
$15,489 |
$12,218 |
5/31/19 |
$11,825 |
$14,504 |
$12,177 |
6/30/19 |
$12,024 |
$15,526 |
$12,342 |
7/31/19 |
$12,180 |
$15,750 |
$12,539 |
8/31/19 |
$12,544 |
$15,500 |
$12,837 |
9/30/19 |
$12,754 |
$15,790 |
$13,185 |
10/31/19 |
$12,952 |
$16,132 |
$13,326 |
11/30/19 |
$12,808 |
$16,718 |
$13,146 |
12/31/19 |
$12,771 |
$17,222 |
$13,023 |
1/31/20 |
$12,971 |
$17,216 |
$13,077 |
2/29/20 |
$11,971 |
$15,798 |
$11,978 |
3/31/20 |
$9,278 |
$13,847 |
$9,309 |
4/30/20 |
$10,079 |
$15,622 |
$10,037 |
5/31/20 |
$10,224 |
$16,366 |
$9,974 |
6/30/20 |
$10,524 |
$16,692 |
$10,157 |
7/31/20 |
$11,108 |
$17,633 |
$10,495 |
8/31/20 |
$11,240 |
$18,900 |
$10,569 |
9/30/20 |
$10,872 |
$18,182 |
$10,241 |
10/31/20 |
$10,548 |
$17,699 |
$9,976 |
11/30/20 |
$11,654 |
$19,636 |
$11,201 |
12/31/20 |
$12,174 |
$20,391 |
$11,564 |
1/31/21 |
$12,234 |
$20,185 |
$11,541 |
2/28/21 |
$12,695 |
$20,742 |
$12,157 |
3/31/21 |
$13,410 |
$21,650 |
$12,721 |
4/30/21 |
$14,670 |
$22,806 |
$13,774 |
5/31/21 |
$14,901 |
$22,965 |
$13,898 |
6/30/21 |
$15,229 |
$23,501 |
$14,217 |
7/31/21 |
$16,332 |
$24,059 |
$14,974 |
8/31/21 |
$16,670 |
$24,791 |
$15,236 |
9/30/21 |
$15,663 |
$23,638 |
$14,395 |
10/31/21 |
$16,962 |
$25,294 |
$15,572 |
11/30/21 |
$16,830 |
$25,119 |
$15,479 |
12/31/21 |
$18,526 |
$26,244 |
$16,874 |
1/31/22 |
$17,027 |
$24,886 |
$15,784 |
2/28/22 |
$16,485 |
$24,141 |
$15,227 |
3/31/22 |
$17,482 |
$25,038 |
$16,248 |
4/30/22 |
$16,784 |
$22,854 |
$15,493 |
5/31/22 |
$15,754 |
$22,896 |
$14,425 |
6/30/22 |
$14,252 |
$21,006 |
$13,306 |
7/31/22 |
$15,858 |
$22,943 |
$14,491 |
8/31/22 |
$14,594 |
$22,007 |
$13,591 |
9/30/22 |
$12,261 |
$19,981 |
$11,926 |
10/31/22 |
$12,893 |
$21,598 |
$12,462 |
11/30/22 |
$13,631 |
$22,805 |
$13,184 |
12/31/22 |
$12,917 |
$21,491 |
$12,493 |
1/31/23 |
$14,311 |
$22,842 |
$13,865 |
2/28/23 |
$13,450 |
$22,284 |
$13,182 |
3/31/23 |
$13,368 |
$23,103 |
$12,840 |
4/30/23 |
$13,450 |
$23,463 |
$12,928 |
5/31/23 |
$12,794 |
$23,565 |
$12,572 |
6/30/23 |
$13,307 |
$25,122 |
$13,214 |
7/31/23 |
$13,686 |
$25,929 |
$13,593 |
8/31/23 |
$13,184 |
$25,516 |
$13,160 |
9/30/23 |
$12,210 |
$24,300 |
$12,237 |
10/31/23 |
$11,646 |
$23,789 |
$11,683 |
11/30/23 |
$13,050 |
$25,961 |
$12,941 |
12/31/23 |
$14,352 |
$27,141 |
$14,237 |
1/31/24 |
$13,809 |
$27,597 |
$13,663 |
2/29/24 |
$13,994 |
$29,070 |
$13,917 |
3/31/24 |
$14,178 |
$30,006 |
$14,182 |
4/30/24 |
$12,948 |
$28,780 |
$13,144 |
5/31/24 |
$13,604 |
$30,207 |
$13,781 |
6/30/24 |
$13,942 |
$31,291 |
$14,159 |
7/31/24 |
$14,793 |
$31,672 |
$14,987 |
8/31/24 |
$15,675 |
$32,440 |
$15,941 |
9/30/24 |
$16,094 |
$33,133 |
$16,362 |
10/31/24 |
$15,385 |
$32,833 |
$15,849 |
11/30/24 |
$16,135 |
$34,760 |
$16,574 |
12/31/24 |
$14,913 |
$33,931 |
$15,391 |
1/31/25 |
$15,140 |
$34,876 |
$15,577 |
2/28/25 |
$15,839 |
$34,421 |
$16,178 |
3/31/25 |
$15,353 |
$32,482 |
$15,571 |
|
| Average Annual Return [Table Text Block] |
Class/Index Name |
1 Year |
5 Years |
10 Years |
Class C (excluding sales charge) |
8.28% |
10.60% |
4.38% |
Class C (including sales charge) |
7.28% |
10.60% |
4.38% |
S&P 500 Index |
8.25% |
18.59% |
12.50% |
Dow Jones U.S. Select REIT Total Return Index |
9.79% |
10.84% |
4.53% | |
| No Deduction of Taxes [Text Block] |
Returns shown do not reflect the deduction of taxes that a shareholder would pay on Fund distributions or the redemption of Fund shares.
|
| Performance Table Market Index Changed [Text Block] |
Differences in the Fund’s performance versus an index and related attribution information with respect to particular categories of securities or individual positions may be attributable, in part, to differences in the pricing methodologies used by the Fund and the index.
|
| Updated Performance Information Location [Text Block] |
For performance current to the most recent month-end, visit www.pimco.com/literature or via 888.87.PIMCO (888.877.4626).
|
| AssetsNet |
$ 500,282,000
|
| Holdings Count | Holding |
783
|
| Advisory Fees Paid, Amount |
$ 2,475,000
|
| InvestmentCompanyPortfolioTurnover |
165.00%
|
| Additional Fund Statistics [Text Block] |
Key Fund StatisticsFootnote Reference† (as of the end of the reporting period)
Total Net Assets |
$500,282 |
# of Portfolio Holdings |
783 |
Portfolio Turnover Rate |
165% |
Total Net Advisory Fees Paid During the Reporting Period |
$2,475 |
| Footnote |
Description |
Footnote† |
Dollar amounts displayed in 000's | |
| Holdings [Text Block] |
Security Type Breakdown (% of Net Asset Value)Footnote Reference*
U.S. Treasury Obligations |
108.7% |
Real Estate Investment Trusts |
41.2% |
Asset-Backed Securities |
14.1% |
U.S. Government Agencies |
13.0% |
Sovereign Issues |
10.8% |
Corporate Bonds & Notes |
1.3% |
Non-Agency Mortgage-Backed Securities |
0.7% |
Common Stocks |
0.2% |
Preferred Securities |
0.2% |
Short-Term Instruments |
0.1% |
Affiliated Investments |
0.4% |
Financial Derivative Instruments |
(0.7%) |
Other Assets and Liabilities, Net |
(90.0%) |
Total |
100.0% |
| Footnote |
Description |
Footnote* |
% of Net Asset Value includes derivatives instruments, if any, valued at the value used for determining the Fund's net asset value. The notional exposure of such derivatives investments therefore may be greater than what is depicted. | |
| Material Fund Change [Text Block] |
This is a summary of certain changes and planned changes of the Fund since the beginning of the reporting period. For more information, you may refer to the Fund's next prospectus, which we expect to be available by July 31, 2025 or upon request at 888.87.PIMCO (888.877.4626). Changes to Total Annual Fund Operating Expenses. Annual fund operating expenses decreased during the year by 0.60% as a result of lower expenses related to interest. |
| Material Fund Change Expenses [Text Block] |
Changes to Total Annual Fund Operating Expenses. Annual fund operating expenses decreased during the year by 0.60% as a result of lower expenses related to interest.
|
| Summary of Change Legend [Text Block] |
This is a summary of certain changes and planned changes of the Fund since the beginning of the reporting period. For more information, you may refer to the Fund's next prospectus, which we expect to be available by July 31, 2025 or upon request at 888.87.PIMCO (888.877.4626).
|
| C000200447 |
|
| Shareholder Report [Line Items] |
|
| Fund Name |
PIMCO RealEstateRealReturn Strategy Fund
|
| Class Name |
I-3
|
| Trading Symbol |
PNRNX
|
| Annual or Semi-Annual Statement [Text Block] |
This annual shareholder report contains important information about the PIMCO RealEstateRealReturn Strategy Fund (the "Fund") for the period of April 1, 2024 to March 31, 2025 (the "reporting period").
|
| Shareholder Report Annual or Semi-Annual |
Annual Shareholder Report
|
| Additional Information [Text Block] |
You can find additional information about the Fund at www.pimco.com/literature. You can also request this information by contacting us at 888.87.PIMCO (888.877.4626).
|
| Material Fund Change Notice [Text Block] |
This report describes changes to the Fund that occurred during the reporting period.
|
| Additional Information Phone Number |
888.87.PIMCO (888.877.4626)
|
| Expenses [Text Block] |
What were the Fund costs for the reporting period?(based on a hypothetical $10,000 investment)
Class Name |
Cost of a $10,000 investment |
Costs paid as a percentage of a $10,000 investment |
I-3 |
$590 |
5.64% | |
| Expenses Paid, Amount |
$ 590
|
| Expense Ratio, Percent |
5.64%
|
| Factors Affecting Performance [Text Block] |
How did the Fund perform during the reporting period and what affected its performance?The following affected performance (on a gross basis) during the reporting period: Eurozone interest rate strategies, including short exposure to duration and exposure to swap spreads, contributed to relative performance versus the Dow Jones U.S. Select REIT Total Return Index ("Index"), as eurozone rates rose, while swaps spreads tightened. Overweight exposure to intermediate U.S. breakeven inflation contributed to relative performance versus the Index, as intermediate U.S. breakeven inflation rose. Exposure to securitized assets, including U.S. non-agency residential mortgage-backed securities and collateralized loan obligations, contributed to relative performance versus the Index, as spreads broadly tightened across these sectors. Underweight exposure to healthcare real estate investment trusts ("REITs") detracted from relative performance versus the Index, as healthcare REITs posted positive returns. Underweight exposure to data center REITs detracted from relative performance versus the Index, as data center REITs delivered positive returns. Underweight exposure to office REITs detracted from relative performance versus the Index, as office REITs delivered positive returns.
|
| Performance Past Does Not Indicate Future [Text] |
Performance quoted represents past performance. Past performance is not a guarantee or a reliable indicator of future results.
|
| Line Graph [Table Text Block] |
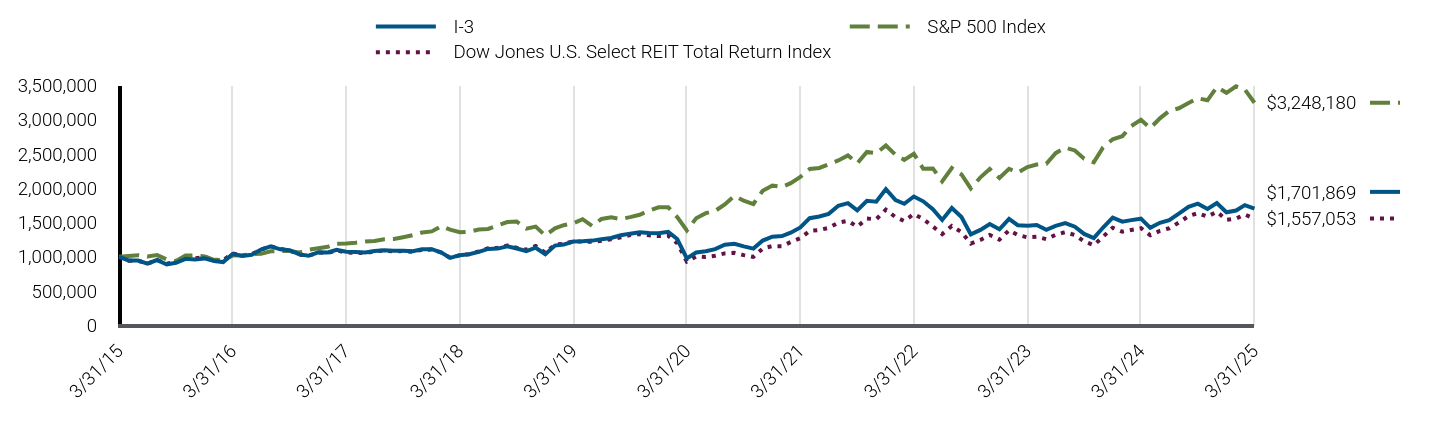
|
I-3 |
S&P 500 Index |
Dow Jones U.S. Select REIT Total Return Index |
3/31/15 |
$1,000,000 |
$1,000,000 |
$1,000,000 |
4/30/15 |
$947,121 |
$1,009,593 |
$942,063 |
5/31/15 |
$944,601 |
$1,022,576 |
$941,704 |
6/30/15 |
$901,237 |
$1,002,781 |
$900,036 |
7/31/15 |
$952,546 |
$1,023,790 |
$953,426 |
8/31/15 |
$887,536 |
$962,021 |
$897,558 |
9/30/15 |
$911,783 |
$938,217 |
$927,842 |
10/31/15 |
$969,352 |
$1,017,360 |
$981,897 |
11/30/15 |
$960,457 |
$1,020,385 |
$976,506 |
12/31/15 |
$976,302 |
$1,004,292 |
$997,776 |
1/31/16 |
$938,633 |
$954,455 |
$958,402 |
2/29/16 |
$922,990 |
$953,167 |
$949,817 |
3/31/16 |
$1,041,959 |
$1,017,828 |
$1,048,847 |
4/30/16 |
$1,012,063 |
$1,021,774 |
$1,018,124 |
5/31/16 |
$1,030,050 |
$1,040,123 |
$1,038,562 |
6/30/16 |
$1,106,259 |
$1,042,818 |
$1,105,733 |
7/31/16 |
$1,152,804 |
$1,081,265 |
$1,154,092 |
8/31/16 |
$1,108,572 |
$1,082,784 |
$1,115,050 |
9/30/16 |
$1,096,266 |
$1,082,988 |
$1,092,069 |
10/31/16 |
$1,034,940 |
$1,063,233 |
$1,030,585 |
11/30/16 |
$1,013,987 |
$1,102,610 |
$1,016,668 |
12/31/16 |
$1,065,921 |
$1,124,405 |
$1,064,394 |
1/31/17 |
$1,063,182 |
$1,145,730 |
$1,055,256 |
2/28/17 |
$1,102,097 |
$1,191,223 |
$1,092,235 |
3/31/17 |
$1,073,579 |
$1,192,612 |
$1,061,514 |
4/30/17 |
$1,070,829 |
$1,204,860 |
$1,058,973 |
5/31/17 |
$1,064,156 |
$1,221,816 |
$1,053,103 |
6/30/17 |
$1,083,392 |
$1,229,442 |
$1,078,886 |
7/31/17 |
$1,096,371 |
$1,254,723 |
$1,088,780 |
8/31/17 |
$1,089,675 |
$1,258,564 |
$1,080,129 |
9/30/17 |
$1,089,213 |
$1,284,525 |
$1,083,011 |
10/31/17 |
$1,079,887 |
$1,314,500 |
$1,071,212 |
11/30/17 |
$1,108,618 |
$1,354,816 |
$1,104,149 |
12/31/17 |
$1,110,221 |
$1,369,880 |
$1,104,452 |
1/31/18 |
$1,062,504 |
$1,448,311 |
$1,060,682 |
2/28/18 |
$983,098 |
$1,394,930 |
$984,269 |
3/31/18 |
$1,023,932 |
$1,359,480 |
$1,022,445 |
4/30/18 |
$1,036,980 |
$1,364,697 |
$1,037,561 |
5/31/18 |
$1,070,648 |
$1,397,561 |
$1,078,816 |
6/30/18 |
$1,115,090 |
$1,406,163 |
$1,124,562 |
7/31/18 |
$1,119,130 |
$1,458,492 |
$1,130,749 |
8/31/18 |
$1,152,798 |
$1,506,017 |
$1,164,406 |
9/30/18 |
$1,120,018 |
$1,514,589 |
$1,132,674 |
10/31/18 |
$1,083,496 |
$1,411,067 |
$1,103,803 |
11/30/18 |
$1,132,193 |
$1,439,822 |
$1,157,327 |
12/31/18 |
$1,038,175 |
$1,309,819 |
$1,057,855 |
1/31/19 |
$1,162,865 |
$1,414,783 |
$1,178,563 |
2/28/19 |
$1,177,773 |
$1,460,209 |
$1,189,935 |
3/31/19 |
$1,221,896 |
$1,488,583 |
$1,224,200 |
4/30/19 |
$1,226,071 |
$1,548,856 |
$1,221,841 |
5/31/19 |
$1,235,813 |
$1,450,428 |
$1,217,677 |
6/30/19 |
$1,256,436 |
$1,552,649 |
$1,234,212 |
7/31/19 |
$1,274,788 |
$1,574,964 |
$1,253,941 |
8/31/19 |
$1,314,317 |
$1,550,016 |
$1,283,720 |
9/30/19 |
$1,337,444 |
$1,579,018 |
$1,318,500 |
10/31/19 |
$1,357,840 |
$1,613,219 |
$1,332,555 |
11/30/19 |
$1,346,185 |
$1,671,777 |
$1,314,602 |
12/31/19 |
$1,343,065 |
$1,722,235 |
$1,302,257 |
1/31/20 |
$1,363,638 |
$1,721,559 |
$1,307,674 |
2/29/20 |
$1,259,308 |
$1,579,842 |
$1,197,762 |
3/31/20 |
$975,706 |
$1,384,711 |
$930,871 |
4/30/20 |
$1,062,403 |
$1,562,223 |
$1,003,716 |
5/31/20 |
$1,080,036 |
$1,636,628 |
$997,373 |
6/30/20 |
$1,112,160 |
$1,669,176 |
$1,015,681 |
7/31/20 |
$1,175,540 |
$1,763,293 |
$1,049,535 |
8/31/20 |
$1,189,121 |
$1,890,039 |
$1,056,858 |
9/30/20 |
$1,151,205 |
$1,818,224 |
$1,024,093 |
10/31/20 |
$1,119,142 |
$1,769,870 |
$997,587 |
11/30/20 |
$1,236,705 |
$1,963,607 |
$1,120,094 |
12/31/20 |
$1,293,606 |
$2,039,105 |
$1,156,432 |
1/31/21 |
$1,301,533 |
$2,018,518 |
$1,154,140 |
2/28/21 |
$1,352,262 |
$2,074,179 |
$1,215,693 |
3/31/21 |
$1,428,154 |
$2,165,019 |
$1,272,107 |
4/30/21 |
$1,563,383 |
$2,280,563 |
$1,377,411 |
5/31/21 |
$1,588,120 |
$2,296,491 |
$1,389,805 |
6/30/21 |
$1,625,968 |
$2,350,103 |
$1,421,714 |
7/31/21 |
$1,744,220 |
$2,405,929 |
$1,497,385 |
8/31/21 |
$1,782,478 |
$2,479,083 |
$1,523,635 |
9/30/21 |
$1,676,895 |
$2,363,781 |
$1,439,489 |
10/31/21 |
$1,817,613 |
$2,529,392 |
$1,557,206 |
11/30/21 |
$1,803,932 |
$2,511,866 |
$1,547,891 |
12/31/21 |
$1,987,827 |
$2,624,438 |
$1,687,386 |
1/31/22 |
$1,828,447 |
$2,488,631 |
$1,578,391 |
2/28/22 |
$1,773,106 |
$2,414,118 |
$1,522,678 |
3/31/22 |
$1,879,887 |
$2,503,753 |
$1,624,789 |
4/30/22 |
$1,809,334 |
$2,285,421 |
$1,549,302 |
5/31/22 |
$1,695,540 |
$2,289,614 |
$1,442,502 |
6/30/22 |
$1,537,296 |
$2,100,621 |
$1,330,649 |
7/31/22 |
$1,711,199 |
$2,294,307 |
$1,449,086 |
8/31/22 |
$1,579,033 |
$2,200,741 |
$1,359,062 |
9/30/22 |
$1,326,587 |
$1,998,056 |
$1,192,602 |
10/31/22 |
$1,392,680 |
$2,159,821 |
$1,246,193 |
11/30/22 |
$1,477,657 |
$2,280,521 |
$1,318,390 |
12/31/22 |
$1,401,413 |
$2,149,130 |
$1,249,319 |
1/31/23 |
$1,551,936 |
$2,284,168 |
$1,386,497 |
2/28/23 |
$1,461,103 |
$2,228,437 |
$1,318,200 |
3/31/23 |
$1,452,669 |
$2,310,252 |
$1,283,980 |
4/30/23 |
$1,463,050 |
$2,346,311 |
$1,292,848 |
5/31/23 |
$1,392,330 |
$2,356,510 |
$1,257,175 |
6/30/23 |
$1,450,074 |
$2,512,217 |
$1,321,436 |
7/31/23 |
$1,492,246 |
$2,592,922 |
$1,359,322 |
8/31/23 |
$1,439,044 |
$2,551,639 |
$1,315,976 |
9/30/23 |
$1,333,289 |
$2,429,982 |
$1,223,689 |
10/31/23 |
$1,272,302 |
$2,378,888 |
$1,168,288 |
11/30/23 |
$1,427,366 |
$2,596,140 |
$1,294,082 |
12/31/23 |
$1,570,751 |
$2,714,085 |
$1,423,720 |
1/31/24 |
$1,513,007 |
$2,759,693 |
$1,366,260 |
2/29/24 |
$1,535,067 |
$2,907,048 |
$1,391,736 |
3/31/24 |
$1,555,828 |
$3,000,582 |
$1,418,163 |
4/30/24 |
$1,422,175 |
$2,878,024 |
$1,314,378 |
5/31/24 |
$1,495,490 |
$3,020,730 |
$1,378,068 |
6/30/24 |
$1,533,769 |
$3,129,120 |
$1,415,871 |
7/31/24 |
$1,629,143 |
$3,167,209 |
$1,498,737 |
8/31/24 |
$1,727,761 |
$3,244,035 |
$1,594,084 |
9/30/24 |
$1,775,008 |
$3,313,318 |
$1,636,181 |
10/31/24 |
$1,698,853 |
$3,283,271 |
$1,584,870 |
11/30/24 |
$1,782,819 |
$3,476,003 |
$1,657,418 |
12/31/24 |
$1,648,855 |
$3,393,141 |
$1,539,081 |
1/31/25 |
$1,675,586 |
$3,487,632 |
$1,557,728 |
2/28/25 |
$1,753,824 |
$3,442,124 |
$1,617,809 |
3/31/25 |
$1,701,869 |
$3,248,180 |
$1,557,053 |
|
| Average Annual Return [Table Text Block] |
Class/Index Name |
1 Year |
5 Years |
10 Years |
I-3 |
9.39% |
11.77% |
5.46% |
S&P 500 Index |
8.25% |
18.59% |
12.50% |
Dow Jones U.S. Select REIT Total Return Index |
9.79% |
10.84% |
4.53% | |
| No Deduction of Taxes [Text Block] |
Returns shown do not reflect the deduction of taxes that a shareholder would pay on Fund distributions or the redemption of Fund shares.
|
| Performance Table Market Index Changed [Text Block] |
Differences in the Fund’s performance versus an index and related attribution information with respect to particular categories of securities or individual positions may be attributable, in part, to differences in the pricing methodologies used by the Fund and the index.
|
| Updated Performance Information Location [Text Block] |
For performance current to the most recent month-end, visit www.pimco.com/literature or via 888.87.PIMCO (888.877.4626).
|
| AssetsNet |
$ 500,282,000
|
| Holdings Count | Holding |
783
|
| Advisory Fees Paid, Amount |
$ 2,475,000
|
| InvestmentCompanyPortfolioTurnover |
165.00%
|
| Additional Fund Statistics [Text Block] |
Key Fund StatisticsFootnote Reference† (as of the end of the reporting period)
Total Net Assets |
$500,282 |
# of Portfolio Holdings |
783 |
Portfolio Turnover Rate |
165% |
Total Net Advisory Fees Paid During the Reporting Period |
$2,475 |
| Footnote |
Description |
Footnote† |
Dollar amounts displayed in 000's | |
| Holdings [Text Block] |
Security Type Breakdown (% of Net Asset Value)Footnote Reference*
U.S. Treasury Obligations |
108.7% |
Real Estate Investment Trusts |
41.2% |
Asset-Backed Securities |
14.1% |
U.S. Government Agencies |
13.0% |
Sovereign Issues |
10.8% |
Corporate Bonds & Notes |
1.3% |
Non-Agency Mortgage-Backed Securities |
0.7% |
Common Stocks |
0.2% |
Preferred Securities |
0.2% |
Short-Term Instruments |
0.1% |
Affiliated Investments |
0.4% |
Financial Derivative Instruments |
(0.7%) |
Other Assets and Liabilities, Net |
(90.0%) |
Total |
100.0% |
| Footnote |
Description |
Footnote* |
% of Net Asset Value includes derivatives instruments, if any, valued at the value used for determining the Fund's net asset value. The notional exposure of such derivatives investments therefore may be greater than what is depicted. | |
| Material Fund Change [Text Block] |
This is a summary of certain changes and planned changes of the Fund since the beginning of the reporting period. For more information, you may refer to the Fund's next prospectus, which we expect to be available by July 31, 2025 or upon request at 888.87.PIMCO (888.877.4626). Changes to Total Annual Fund Operating Expenses. Annual fund operating expenses decreased during the year by 0.60% as a result of lower expenses related to interest. |
| Material Fund Change Expenses [Text Block] |
Changes to Total Annual Fund Operating Expenses. Annual fund operating expenses decreased during the year by 0.60% as a result of lower expenses related to interest.
|
| Summary of Change Legend [Text Block] |
This is a summary of certain changes and planned changes of the Fund since the beginning of the reporting period. For more information, you may refer to the Fund's next prospectus, which we expect to be available by July 31, 2025 or upon request at 888.87.PIMCO (888.877.4626).
|
| C000026613 |
|
| Shareholder Report [Line Items] |
|
| Fund Name |
PIMCO RealEstateRealReturn Strategy Fund
|
| Class Name |
Institutional Class
|
| Trading Symbol |
PRRSX
|
| Annual or Semi-Annual Statement [Text Block] |
This annual shareholder report contains important information about the PIMCO RealEstateRealReturn Strategy Fund (the "Fund") for the period of April 1, 2024 to March 31, 2025 (the "reporting period").
|
| Shareholder Report Annual or Semi-Annual |
Annual Shareholder Report
|
| Additional Information [Text Block] |
You can find additional information about the Fund at www.pimco.com/literature. You can also request this information by contacting us at 888.87.PIMCO (888.877.4626).
|
| Material Fund Change Notice [Text Block] |
This report describes changes to the Fund that occurred during the reporting period.
|
| Additional Information Phone Number |
888.87.PIMCO (888.877.4626)
|
| Expenses [Text Block] |
What were the Fund costs for the reporting period?(based on a hypothetical $10,000 investment)
Class Name |
Cost of a $10,000 investment |
Costs paid as a percentage of a $10,000 investment |
Institutional Class |
$575 |
5.49% | |
| Expenses Paid, Amount |
$ 575
|
| Expense Ratio, Percent |
5.49%
|
| Factors Affecting Performance [Text Block] |
How did the Fund perform during the reporting period and what affected its performance?The following affected performance (on a gross basis) during the reporting period: Eurozone interest rate strategies, including short exposure to duration and exposure to swap spreads, contributed to relative performance versus the Dow Jones U.S. Select REIT Total Return Index ("Index"), as eurozone rates rose, while swaps spreads tightened. Overweight exposure to intermediate U.S. breakeven inflation contributed to relative performance versus the Index, as intermediate U.S. breakeven inflation rose. Exposure to securitized assets, including U.S. non-agency residential mortgage-backed securities and collateralized loan obligations, contributed to relative performance versus the Index, as spreads broadly tightened across these sectors. Underweight exposure to healthcare real estate investment trusts ("REITs") detracted from relative performance versus the Index, as healthcare REITs posted positive returns. Underweight exposure to data center REITs detracted from relative performance versus the Index, as data center REITs delivered positive returns. Underweight exposure to office REITs detracted from relative performance versus the Index, as office REITs delivered positive returns.
|
| Performance Past Does Not Indicate Future [Text] |
Performance quoted represents past performance. Past performance is not a guarantee or a reliable indicator of future results.
|
| Line Graph [Table Text Block] |
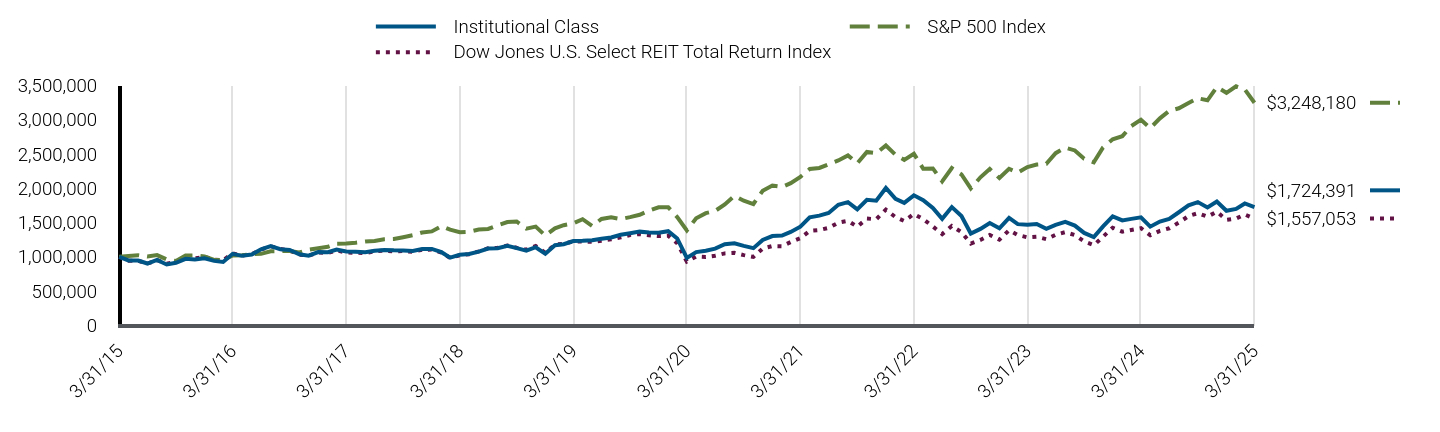
|
Institutional Class |
S&P 500 Index |
Dow Jones U.S. Select REIT Total Return Index |
3/31/15 |
$1,000,000 |
$1,000,000 |
$1,000,000 |
4/30/15 |
$947,242 |
$1,009,593 |
$942,063 |
5/31/15 |
$944,844 |
$1,022,576 |
$941,704 |
6/30/15 |
$901,581 |
$1,002,781 |
$900,036 |
7/31/15 |
$953,029 |
$1,023,790 |
$953,426 |
8/31/15 |
$888,106 |
$962,021 |
$897,558 |
9/30/15 |
$912,478 |
$938,217 |
$927,842 |
10/31/15 |
$970,214 |
$1,017,360 |
$981,897 |
11/30/15 |
$961,428 |
$1,020,385 |
$976,506 |
12/31/15 |
$977,412 |
$1,004,292 |
$997,776 |
1/31/16 |
$939,819 |
$954,455 |
$958,402 |
2/29/16 |
$924,264 |
$953,167 |
$949,817 |
3/31/16 |
$1,043,523 |
$1,017,828 |
$1,048,847 |
4/30/16 |
$1,013,709 |
$1,021,774 |
$1,018,124 |
5/31/16 |
$1,031,857 |
$1,040,123 |
$1,038,562 |
6/30/16 |
$1,108,329 |
$1,042,818 |
$1,105,733 |
7/31/16 |
$1,155,105 |
$1,081,265 |
$1,154,092 |
8/31/16 |
$1,110,927 |
$1,082,784 |
$1,115,050 |
9/30/16 |
$1,098,730 |
$1,082,988 |
$1,092,069 |
10/31/16 |
$1,037,399 |
$1,063,233 |
$1,030,585 |
11/30/16 |
$1,016,521 |
$1,102,610 |
$1,016,668 |
12/31/16 |
$1,068,717 |
$1,124,405 |
$1,064,394 |
1/31/17 |
$1,066,107 |
$1,145,730 |
$1,055,256 |
2/28/17 |
$1,105,254 |
$1,191,223 |
$1,092,235 |
3/31/17 |
$1,076,790 |
$1,192,612 |
$1,061,514 |
4/30/17 |
$1,074,166 |
$1,204,860 |
$1,058,973 |
5/31/17 |
$1,067,609 |
$1,221,816 |
$1,053,103 |
6/30/17 |
$1,087,042 |
$1,229,442 |
$1,078,886 |
7/31/17 |
$1,100,202 |
$1,254,723 |
$1,088,780 |
8/31/17 |
$1,093,622 |
$1,258,564 |
$1,080,129 |
9/30/17 |
$1,093,294 |
$1,284,525 |
$1,083,011 |
10/31/17 |
$1,084,073 |
$1,314,500 |
$1,071,212 |
11/30/17 |
$1,113,052 |
$1,354,816 |
$1,104,149 |
12/31/17 |
$1,114,804 |
$1,369,880 |
$1,104,452 |
1/31/18 |
$1,067,026 |
$1,448,311 |
$1,060,682 |
2/28/18 |
$987,398 |
$1,394,930 |
$984,269 |
3/31/18 |
$1,028,539 |
$1,359,480 |
$1,022,445 |
4/30/18 |
$1,040,483 |
$1,364,697 |
$1,037,561 |
5/31/18 |
$1,074,989 |
$1,397,561 |
$1,078,816 |
6/30/18 |
$1,120,112 |
$1,406,163 |
$1,124,562 |
7/31/18 |
$1,124,094 |
$1,458,492 |
$1,130,749 |
8/31/18 |
$1,158,600 |
$1,506,017 |
$1,164,406 |
9/30/18 |
$1,125,796 |
$1,514,589 |
$1,132,674 |
10/31/18 |
$1,088,447 |
$1,411,067 |
$1,103,803 |
11/30/18 |
$1,139,135 |
$1,439,822 |
$1,157,327 |
12/31/18 |
$1,043,074 |
$1,309,819 |
$1,057,855 |
1/31/19 |
$1,168,778 |
$1,414,783 |
$1,178,563 |
2/28/19 |
$1,183,488 |
$1,460,209 |
$1,189,935 |
3/31/19 |
$1,228,830 |
$1,488,583 |
$1,224,200 |
4/30/19 |
$1,232,949 |
$1,548,856 |
$1,221,841 |
5/31/19 |
$1,241,187 |
$1,450,428 |
$1,217,677 |
6/30/19 |
$1,263,087 |
$1,552,649 |
$1,234,212 |
7/31/19 |
$1,281,191 |
$1,574,964 |
$1,253,941 |
8/31/19 |
$1,321,576 |
$1,550,016 |
$1,283,720 |
9/30/19 |
$1,343,879 |
$1,579,018 |
$1,318,500 |
10/31/19 |
$1,366,876 |
$1,613,219 |
$1,332,555 |
11/30/19 |
$1,353,940 |
$1,671,777 |
$1,314,602 |
12/31/19 |
$1,351,408 |
$1,722,235 |
$1,302,257 |
1/31/20 |
$1,373,158 |
$1,721,559 |
$1,307,674 |
2/29/20 |
$1,267,307 |
$1,579,842 |
$1,197,762 |
3/31/20 |
$983,106 |
$1,384,711 |
$930,871 |
4/30/20 |
$1,068,656 |
$1,562,223 |
$1,003,716 |
5/31/20 |
$1,087,506 |
$1,636,628 |
$997,373 |
6/30/20 |
$1,118,627 |
$1,669,176 |
$1,015,681 |
7/31/20 |
$1,184,166 |
$1,763,293 |
$1,049,535 |
8/31/20 |
$1,197,571 |
$1,890,039 |
$1,056,858 |
9/30/20 |
$1,159,225 |
$1,818,224 |
$1,024,093 |
10/31/20 |
$1,126,061 |
$1,769,870 |
$997,587 |
11/30/20 |
$1,245,149 |
$1,963,607 |
$1,120,094 |
12/31/20 |
$1,302,809 |
$2,039,105 |
$1,156,432 |
1/31/21 |
$1,310,629 |
$2,018,518 |
$1,154,140 |
2/28/21 |
$1,362,241 |
$2,074,179 |
$1,215,693 |
3/31/21 |
$1,439,418 |
$2,165,019 |
$1,272,107 |
4/30/21 |
$1,576,040 |
$2,280,563 |
$1,377,411 |
5/31/21 |
$1,600,437 |
$2,296,491 |
$1,389,805 |
6/30/21 |
$1,639,315 |
$2,350,103 |
$1,421,714 |
7/31/21 |
$1,759,223 |
$2,405,929 |
$1,497,385 |
8/31/21 |
$1,796,908 |
$2,479,083 |
$1,523,635 |
9/30/21 |
$1,690,655 |
$2,363,781 |
$1,439,489 |
10/31/21 |
$1,832,663 |
$2,529,392 |
$1,557,206 |
11/30/21 |
$1,819,229 |
$2,511,866 |
$1,547,891 |
12/31/21 |
$2,004,177 |
$2,624,438 |
$1,687,386 |
1/31/22 |
$1,846,009 |
$2,488,631 |
$1,578,391 |
2/28/22 |
$1,787,509 |
$2,414,118 |
$1,522,678 |
3/31/22 |
$1,896,834 |
$2,503,753 |
$1,624,789 |
4/30/22 |
$1,825,591 |
$2,285,421 |
$1,549,302 |
5/31/22 |
$1,712,048 |
$2,289,614 |
$1,442,502 |
6/30/22 |
$1,553,280 |
$2,100,621 |
$1,330,649 |
7/31/22 |
$1,725,615 |
$2,294,307 |
$1,449,086 |
8/31/22 |
$1,594,096 |
$2,200,741 |
$1,359,062 |
9/30/22 |
$1,339,535 |
$1,998,056 |
$1,192,602 |
10/31/22 |
$1,406,512 |
$2,159,821 |
$1,246,193 |
11/30/22 |
$1,491,965 |
$2,280,521 |
$1,318,390 |
12/31/22 |
$1,415,417 |
$2,149,130 |
$1,249,319 |
1/31/23 |
$1,567,340 |
$2,284,168 |
$1,386,497 |
2/28/23 |
$1,476,186 |
$2,228,437 |
$1,318,200 |
3/31/23 |
$1,467,324 |
$2,310,252 |
$1,283,980 |
4/30/23 |
$1,478,085 |
$2,346,311 |
$1,292,848 |
5/31/23 |
$1,407,187 |
$2,356,510 |
$1,257,175 |
6/30/23 |
$1,466,058 |
$2,512,217 |
$1,321,436 |
7/31/23 |
$1,508,469 |
$2,592,922 |
$1,359,322 |
8/31/23 |
$1,454,663 |
$2,551,639 |
$1,315,976 |
9/30/23 |
$1,348,317 |
$2,429,982 |
$1,223,689 |
10/31/23 |
$1,286,915 |
$2,378,888 |
$1,168,288 |
11/30/23 |
$1,443,902 |
$2,596,140 |
$1,294,082 |
12/31/23 |
$1,589,495 |
$2,714,085 |
$1,423,720 |
1/31/24 |
$1,531,258 |
$2,759,693 |
$1,366,260 |
2/29/24 |
$1,553,413 |
$2,907,048 |
$1,391,736 |
3/31/24 |
$1,574,936 |
$3,000,582 |
$1,418,163 |
4/30/24 |
$1,439,471 |
$2,878,024 |
$1,314,378 |
5/31/24 |
$1,513,534 |
$3,020,730 |
$1,378,068 |
6/30/24 |
$1,552,780 |
$3,129,120 |
$1,415,871 |
7/31/24 |
$1,649,631 |
$3,167,209 |
$1,498,737 |
8/31/24 |
$1,749,647 |
$3,244,035 |
$1,594,084 |
9/30/24 |
$1,798,044 |
$3,313,318 |
$1,636,181 |
10/31/24 |
$1,720,531 |
$3,283,271 |
$1,584,870 |
11/30/24 |
$1,805,668 |
$3,476,003 |
$1,657,418 |
12/31/24 |
$1,670,725 |
$3,393,141 |
$1,539,081 |
1/31/25 |
$1,698,104 |
$3,487,632 |
$1,557,728 |
2/28/25 |
$1,777,692 |
$3,442,124 |
$1,617,809 |
3/31/25 |
$1,724,391 |
$3,248,180 |
$1,557,053 |
|
| Average Annual Return [Table Text Block] |
Class/Index Name |
1 Year |
5 Years |
10 Years |
Institutional Class |
9.49% |
11.89% |
5.60% |
S&P 500 Index |
8.25% |
18.59% |
12.50% |
Dow Jones U.S. Select REIT Total Return Index |
9.79% |
10.84% |
4.53% | |
| No Deduction of Taxes [Text Block] |
Returns shown do not reflect the deduction of taxes that a shareholder would pay on Fund distributions or the redemption of Fund shares.
|
| Performance Table Market Index Changed [Text Block] |
Differences in the Fund’s performance versus an index and related attribution information with respect to particular categories of securities or individual positions may be attributable, in part, to differences in the pricing methodologies used by the Fund and the index.
|
| Updated Performance Information Location [Text Block] |
For performance current to the most recent month-end, visit www.pimco.com/literature or via 888.87.PIMCO (888.877.4626).
|
| AssetsNet |
$ 500,282,000
|
| Holdings Count | Holding |
783
|
| Advisory Fees Paid, Amount |
$ 2,475,000
|
| InvestmentCompanyPortfolioTurnover |
165.00%
|
| Additional Fund Statistics [Text Block] |
Key Fund StatisticsFootnote Reference† (as of the end of the reporting period)
Total Net Assets |
$500,282 |
# of Portfolio Holdings |
783 |
Portfolio Turnover Rate |
165% |
Total Net Advisory Fees Paid During the Reporting Period |
$2,475 |
| Footnote |
Description |
Footnote† |
Dollar amounts displayed in 000's | |
| Holdings [Text Block] |
Security Type Breakdown (% of Net Asset Value)Footnote Reference*
U.S. Treasury Obligations |
108.7% |
Real Estate Investment Trusts |
41.2% |
Asset-Backed Securities |
14.1% |
U.S. Government Agencies |
13.0% |
Sovereign Issues |
10.8% |
Corporate Bonds & Notes |
1.3% |
Non-Agency Mortgage-Backed Securities |
0.7% |
Common Stocks |
0.2% |
Preferred Securities |
0.2% |
Short-Term Instruments |
0.1% |
Affiliated Investments |
0.4% |
Financial Derivative Instruments |
(0.7%) |
Other Assets and Liabilities, Net |
(90.0%) |
Total |
100.0% |
| Footnote |
Description |
Footnote* |
% of Net Asset Value includes derivatives instruments, if any, valued at the value used for determining the Fund's net asset value. The notional exposure of such derivatives investments therefore may be greater than what is depicted. | |
| Material Fund Change [Text Block] |
This is a summary of certain changes and planned changes of the Fund since the beginning of the reporting period. For more information, you may refer to the Fund's next prospectus, which we expect to be available by July 31, 2025 or upon request at 888.87.PIMCO (888.877.4626). Changes to Total Annual Fund Operating Expenses. Annual fund operating expenses decreased during the year by 0.60% as a result of lower expenses related to interest. |
| Material Fund Change Expenses [Text Block] |
Changes to Total Annual Fund Operating Expenses. Annual fund operating expenses decreased during the year by 0.60% as a result of lower expenses related to interest.
|
| Summary of Change Legend [Text Block] |
This is a summary of certain changes and planned changes of the Fund since the beginning of the reporting period. For more information, you may refer to the Fund's next prospectus, which we expect to be available by July 31, 2025 or upon request at 888.87.PIMCO (888.877.4626).
|
| C000064149 |
|
| Shareholder Report [Line Items] |
|
| Fund Name |
PIMCO RealEstateRealReturn Strategy Fund
|
| Class Name |
I-2
|
| Trading Symbol |
PETPX
|
| Annual or Semi-Annual Statement [Text Block] |
This annual shareholder report contains important information about the PIMCO RealEstateRealReturn Strategy Fund (the "Fund") for the period of April 1, 2024 to March 31, 2025 (the "reporting period").
|
| Shareholder Report Annual or Semi-Annual |
Annual Shareholder Report
|
| Additional Information [Text Block] |
You can find additional information about the Fund at www.pimco.com/literature. You can also request this information by contacting us at 888.87.PIMCO (888.877.4626).
|
| Material Fund Change Notice [Text Block] |
This report describes changes to the Fund that occurred during the reporting period.
|
| Additional Information Phone Number |
888.87.PIMCO (888.877.4626)
|
| Expenses [Text Block] |
What were the Fund costs for the reporting period?(based on a hypothetical $10,000 investment)
Class Name |
Cost of a $10,000 investment |
Costs paid as a percentage of a $10,000 investment |
I-2 |
$585 |
5.59% | |
| Expenses Paid, Amount |
$ 585
|
| Expense Ratio, Percent |
5.59%
|
| Factors Affecting Performance [Text Block] |
How did the Fund perform during the reporting period and what affected its performance?The following affected performance (on a gross basis) during the reporting period: Eurozone interest rate strategies, including short exposure to duration and exposure to swap spreads, contributed to relative performance versus the Dow Jones U.S. Select REIT Total Return Index ("Index"), as eurozone rates rose, while swaps spreads tightened. Overweight exposure to intermediate U.S. breakeven inflation contributed to relative performance versus the Index, as intermediate U.S. breakeven inflation rose. Exposure to securitized assets, including U.S. non-agency residential mortgage-backed securities and collateralized loan obligations, contributed to relative performance versus the Index, as spreads broadly tightened across these sectors. Underweight exposure to healthcare real estate investment trusts ("REITs") detracted from relative performance versus the Index, as healthcare REITs posted positive returns. Underweight exposure to data center REITs detracted from relative performance versus the Index, as data center REITs delivered positive returns. Underweight exposure to office REITs detracted from relative performance versus the Index, as office REITs delivered positive returns.
|
| Performance Past Does Not Indicate Future [Text] |
Performance quoted represents past performance. Past performance is not a guarantee or a reliable indicator of future results.
|
| Line Graph [Table Text Block] |
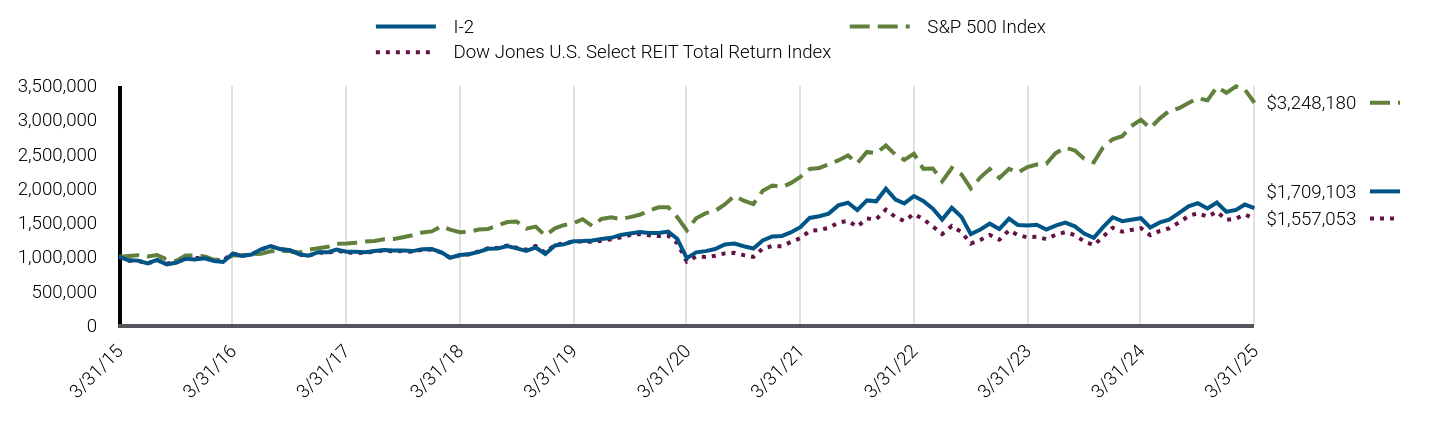
|
I-2 |
S&P 500 Index |
Dow Jones U.S. Select REIT Total Return Index |
3/31/15 |
$1,000,000 |
$1,000,000 |
$1,000,000 |
4/30/15 |
$948,780 |
$1,009,593 |
$942,063 |
5/31/15 |
$943,902 |
$1,022,576 |
$941,704 |
6/30/15 |
$902,117 |
$1,002,781 |
$900,036 |
7/31/15 |
$954,450 |
$1,023,790 |
$953,426 |
8/31/15 |
$888,411 |
$962,021 |
$897,558 |
9/30/15 |
$912,958 |
$938,217 |
$927,842 |
10/31/15 |
$970,417 |
$1,017,360 |
$981,897 |
11/30/15 |
$961,479 |
$1,020,385 |
$976,506 |
12/31/15 |
$977,558 |
$1,004,292 |
$997,776 |
1/31/16 |
$939,300 |
$954,455 |
$958,402 |
2/29/16 |
$924,788 |
$953,167 |
$949,817 |
3/31/16 |
$1,043,520 |
$1,017,828 |
$1,048,847 |
4/30/16 |
$1,013,177 |
$1,021,774 |
$1,018,124 |
5/31/16 |
$1,031,647 |
$1,040,123 |
$1,038,562 |
6/30/16 |
$1,107,948 |
$1,042,818 |
$1,105,733 |
7/31/16 |
$1,154,223 |
$1,081,265 |
$1,154,092 |
8/31/16 |
$1,110,593 |
$1,082,784 |
$1,115,050 |
9/30/16 |
$1,097,981 |
$1,082,988 |
$1,092,069 |
10/31/16 |
$1,036,908 |
$1,063,233 |
$1,030,585 |
11/30/16 |
$1,015,665 |
$1,102,610 |
$1,016,668 |
12/31/16 |
$1,067,444 |
$1,124,405 |
$1,064,394 |
1/31/17 |
$1,066,117 |
$1,145,730 |
$1,055,256 |
2/28/17 |
$1,104,619 |
$1,191,223 |
$1,092,235 |
3/31/17 |
$1,074,863 |
$1,192,612 |
$1,061,514 |
4/30/17 |
$1,073,529 |
$1,204,860 |
$1,058,973 |
5/31/17 |
$1,066,861 |
$1,221,816 |
$1,053,103 |
6/30/17 |
$1,085,017 |
$1,229,442 |
$1,078,886 |
7/31/17 |
$1,098,396 |
$1,254,723 |
$1,088,780 |
8/31/17 |
$1,093,044 |
$1,258,564 |
$1,080,129 |
9/30/17 |
$1,091,004 |
$1,284,525 |
$1,083,011 |
10/31/17 |
$1,082,972 |
$1,314,500 |
$1,071,212 |
11/30/17 |
$1,111,083 |
$1,354,816 |
$1,104,149 |
12/31/17 |
$1,112,499 |
$1,369,880 |
$1,104,452 |
1/31/18 |
$1,065,302 |
$1,448,311 |
$1,060,682 |
2/28/18 |
$985,742 |
$1,394,930 |
$984,269 |
3/31/18 |
$1,026,196 |
$1,359,480 |
$1,022,445 |
4/30/18 |
$1,038,333 |
$1,364,697 |
$1,037,561 |
5/31/18 |
$1,072,045 |
$1,397,561 |
$1,078,816 |
6/30/18 |
$1,116,545 |
$1,406,163 |
$1,124,562 |
7/31/18 |
$1,121,939 |
$1,458,492 |
$1,130,749 |
8/31/18 |
$1,155,651 |
$1,506,017 |
$1,164,406 |
9/30/18 |
$1,123,390 |
$1,514,589 |
$1,132,674 |
10/31/18 |
$1,085,355 |
$1,411,067 |
$1,103,803 |
11/30/18 |
$1,135,616 |
$1,439,822 |
$1,157,327 |
12/31/18 |
$1,040,226 |
$1,309,819 |
$1,057,855 |
1/31/19 |
$1,165,489 |
$1,414,783 |
$1,178,563 |
2/28/19 |
$1,180,466 |
$1,460,209 |
$1,189,935 |
3/31/19 |
$1,225,120 |
$1,488,583 |
$1,224,200 |
4/30/19 |
$1,229,316 |
$1,548,856 |
$1,221,841 |
5/31/19 |
$1,237,707 |
$1,450,428 |
$1,217,677 |
6/30/19 |
$1,259,932 |
$1,552,649 |
$1,234,212 |
7/31/19 |
$1,276,958 |
$1,574,964 |
$1,253,941 |
8/31/19 |
$1,318,104 |
$1,550,016 |
$1,283,720 |
9/30/19 |
$1,339,277 |
$1,579,018 |
$1,318,500 |
10/31/19 |
$1,361,256 |
$1,613,219 |
$1,332,555 |
11/30/19 |
$1,348,069 |
$1,671,777 |
$1,314,602 |
12/31/19 |
$1,346,675 |
$1,722,235 |
$1,302,257 |
1/31/20 |
$1,367,370 |
$1,721,559 |
$1,307,674 |
2/29/20 |
$1,262,415 |
$1,579,842 |
$1,197,762 |
3/31/20 |
$978,594 |
$1,384,711 |
$930,871 |
4/30/20 |
$1,064,331 |
$1,562,223 |
$1,003,716 |
5/31/20 |
$1,082,070 |
$1,636,628 |
$997,373 |
6/30/20 |
$1,113,772 |
$1,669,176 |
$1,015,681 |
7/31/20 |
$1,179,110 |
$1,763,293 |
$1,049,535 |
8/31/20 |
$1,192,785 |
$1,890,039 |
$1,056,858 |
9/30/20 |
$1,153,167 |
$1,818,224 |
$1,024,093 |
10/31/20 |
$1,120,878 |
$1,769,870 |
$997,587 |
11/30/20 |
$1,239,270 |
$1,963,607 |
$1,120,094 |
12/31/20 |
$1,296,578 |
$2,039,105 |
$1,156,432 |
1/31/21 |
$1,304,562 |
$2,018,518 |
$1,154,140 |
2/28/21 |
$1,355,659 |
$2,074,179 |
$1,215,693 |
3/31/21 |
$1,430,873 |
$2,165,019 |
$1,272,107 |
4/30/21 |
$1,567,146 |
$2,280,563 |
$1,377,411 |
5/31/21 |
$1,592,074 |
$2,296,491 |
$1,389,805 |
6/30/21 |
$1,630,252 |
$2,350,103 |
$1,421,714 |
7/31/21 |
$1,749,454 |
$2,405,929 |
$1,497,385 |
8/31/21 |
$1,788,019 |
$2,479,083 |
$1,523,635 |
9/30/21 |
$1,680,960 |
$2,363,781 |
$1,439,489 |
10/31/21 |
$1,822,847 |
$2,529,392 |
$1,557,206 |
11/30/21 |
$1,809,052 |
$2,511,866 |
$1,547,891 |
12/31/21 |
$1,992,638 |
$2,624,438 |
$1,687,386 |
1/31/22 |
$1,834,031 |
$2,488,631 |
$1,578,391 |
2/28/22 |
$1,778,184 |
$2,414,118 |
$1,522,678 |
3/31/22 |
$1,885,919 |
$2,503,753 |
$1,624,789 |
4/30/22 |
$1,814,709 |
$2,285,421 |
$1,549,302 |
5/31/22 |
$1,702,151 |
$2,289,614 |
$1,442,502 |
6/30/22 |
$1,542,627 |
$2,100,621 |
$1,330,649 |
7/31/22 |
$1,715,851 |
$2,294,307 |
$1,449,086 |
8/31/22 |
$1,582,422 |
$2,200,741 |
$1,359,062 |
9/30/22 |
$1,331,107 |
$1,998,056 |
$1,192,602 |
10/31/22 |
$1,397,901 |
$2,159,821 |
$1,246,193 |
11/30/22 |
$1,483,779 |
$2,280,521 |
$1,318,390 |
12/31/22 |
$1,406,408 |
$2,149,130 |
$1,249,319 |
1/31/23 |
$1,555,970 |
$2,284,168 |
$1,386,497 |
2/28/23 |
$1,464,134 |
$2,228,437 |
$1,318,200 |
3/31/23 |
$1,457,574 |
$2,310,252 |
$1,283,980 |
4/30/23 |
$1,468,069 |
$2,346,311 |
$1,292,848 |
5/31/23 |
$1,397,224 |
$2,356,510 |
$1,257,175 |
6/30/23 |
$1,455,606 |
$2,512,217 |
$1,321,436 |
7/31/23 |
$1,497,588 |
$2,592,922 |
$1,359,322 |
8/31/23 |
$1,444,454 |
$2,551,639 |
$1,315,976 |
9/30/23 |
$1,338,187 |
$2,429,982 |
$1,223,689 |
10/31/23 |
$1,277,181 |
$2,378,888 |
$1,168,288 |
11/30/23 |
$1,432,647 |
$2,596,140 |
$1,294,082 |
12/31/23 |
$1,576,961 |
$2,714,085 |
$1,423,720 |
1/31/24 |
$1,519,235 |
$2,759,693 |
$1,366,260 |
2/29/24 |
$1,540,882 |
$2,907,048 |
$1,391,736 |
3/31/24 |
$1,562,530 |
$3,000,582 |
$1,418,163 |
4/30/24 |
$1,428,055 |
$2,878,024 |
$1,314,378 |
5/31/24 |
$1,501,524 |
$3,020,730 |
$1,378,068 |
6/30/24 |
$1,540,226 |
$3,129,120 |
$1,415,871 |
7/31/24 |
$1,635,999 |
$3,167,209 |
$1,498,737 |
8/31/24 |
$1,735,051 |
$3,244,035 |
$1,594,084 |
9/30/24 |
$1,782,485 |
$3,313,318 |
$1,636,181 |
10/31/24 |
$1,706,102 |
$3,283,271 |
$1,584,870 |
11/30/24 |
$1,790,387 |
$3,476,003 |
$1,657,418 |
12/31/24 |
$1,655,888 |
$3,393,141 |
$1,539,081 |
1/31/25 |
$1,682,936 |
$3,487,632 |
$1,557,728 |
2/28/25 |
$1,762,102 |
$3,442,124 |
$1,617,809 |
3/31/25 |
$1,709,103 |
$3,248,180 |
$1,557,053 |
|
| Average Annual Return [Table Text Block] |
Class/Index Name |
1 Year |
5 Years |
10 Years |
I-2 |
9.38% |
11.80% |
5.51% |
S&P 500 Index |
8.25% |
18.59% |
12.50% |
Dow Jones U.S. Select REIT Total Return Index |
9.79% |
10.84% |
4.53% | |
| No Deduction of Taxes [Text Block] |
Returns shown do not reflect the deduction of taxes that a shareholder would pay on Fund distributions or the redemption of Fund shares.
|
| Performance Table Market Index Changed [Text Block] |
Differences in the Fund’s performance versus an index and related attribution information with respect to particular categories of securities or individual positions may be attributable, in part, to differences in the pricing methodologies used by the Fund and the index.
|
| Updated Performance Information Location [Text Block] |
For performance current to the most recent month-end, visit www.pimco.com/literature or via 888.87.PIMCO (888.877.4626).
|
| AssetsNet |
$ 500,282,000
|
| Holdings Count | Holding |
783
|
| Advisory Fees Paid, Amount |
$ 2,475,000
|
| InvestmentCompanyPortfolioTurnover |
165.00%
|
| Additional Fund Statistics [Text Block] |
Key Fund StatisticsFootnote Reference† (as of the end of the reporting period)
Total Net Assets |
$500,282 |
# of Portfolio Holdings |
783 |
Portfolio Turnover Rate |
165% |
Total Net Advisory Fees Paid During the Reporting Period |
$2,475 |
| Footnote |
Description |
Footnote† |
Dollar amounts displayed in 000's | |
| Holdings [Text Block] |
Security Type Breakdown (% of Net Asset Value)Footnote Reference*
U.S. Treasury Obligations |
108.7% |
Real Estate Investment Trusts |
41.2% |
Asset-Backed Securities |
14.1% |
U.S. Government Agencies |
13.0% |
Sovereign Issues |
10.8% |
Corporate Bonds & Notes |
1.3% |
Non-Agency Mortgage-Backed Securities |
0.7% |
Common Stocks |
0.2% |
Preferred Securities |
0.2% |
Short-Term Instruments |
0.1% |
Affiliated Investments |
0.4% |
Financial Derivative Instruments |
(0.7%) |
Other Assets and Liabilities, Net |
(90.0%) |
Total |
100.0% |
| Footnote |
Description |
Footnote* |
% of Net Asset Value includes derivatives instruments, if any, valued at the value used for determining the Fund's net asset value. The notional exposure of such derivatives investments therefore may be greater than what is depicted. | |
| Material Fund Change [Text Block] |
This is a summary of certain changes and planned changes of the Fund since the beginning of the reporting period. For more information, you may refer to the Fund's next prospectus, which we expect to be available by July 31, 2025 or upon request at 888.87.PIMCO (888.877.4626). Changes to Total Annual Fund Operating Expenses. Annual fund operating expenses decreased during the year by 0.60% as a result of lower expenses related to interest. |
| Material Fund Change Expenses [Text Block] |
Changes to Total Annual Fund Operating Expenses. Annual fund operating expenses decreased during the year by 0.60% as a result of lower expenses related to interest.
|
| Summary of Change Legend [Text Block] |
This is a summary of certain changes and planned changes of the Fund since the beginning of the reporting period. For more information, you may refer to the Fund's next prospectus, which we expect to be available by July 31, 2025 or upon request at 888.87.PIMCO (888.877.4626).
|
| C000114212 |
|
| Shareholder Report [Line Items] |
|
| Fund Name |
PIMCO Short Asset Investment Fund
|
| Class Name |
Class A
|
| Trading Symbol |
PAIAX
|
| Annual or Semi-Annual Statement [Text Block] |
This annual shareholder report contains important information about the PIMCO Short Asset Investment Fund (the "Fund") for the period of April 1, 2024 to March 31, 2025 (the "reporting period").
|
| Shareholder Report Annual or Semi-Annual |
Annual Shareholder Report
|
| Additional Information [Text Block] |
You can find additional information about the Fund at www.pimco.com/literature. You can also request this information by contacting us at 888.87.PIMCO (888.877.4626).
|
| Additional Information Phone Number |
888.87.PIMCO (888.877.4626)
|
| Expenses [Text Block] |
What were the Fund costs for the reporting period?(based on a hypothetical $10,000 investment)
Class Name |
Cost of a $10,000 investment |
Costs paid as a percentage of a $10,000 investment |
Class A |
$76 |
0.74% | |
| Expenses Paid, Amount |
$ 76
|
| Expense Ratio, Percent |
0.74%
|
| Factors Affecting Performance [Text Block] |
How did the Fund perform during the reporting period and what affected its performance?The following affected performance (on a gross basis) during the reporting period: Holdings of investment grade corporate credit, particularly financials, contributed to relative performance versus the FTSE 3-Month Treasury Bill Index ("Index"), as investment grade corporate bonds had positive total returns. Select holdings of securitized credit, particularly asset-backed securities (“ABS”) and collateralized loan obligations (“CLO”) contributed to relative performance versus the Index, as carry contributions from ABS offset detractions from spreads widening and CLO spreads tightened. Overweight exposure to U.S. duration in the 1-year part of the curve contributed to relative performance versus the Index, as interest rates fell. There were no material detractors for this Fund.
|
| Performance Past Does Not Indicate Future [Text] |
Performance quoted represents past performance. Past performance is not a guarantee or a reliable indicator of future results.
|
| Line Graph [Table Text Block] |
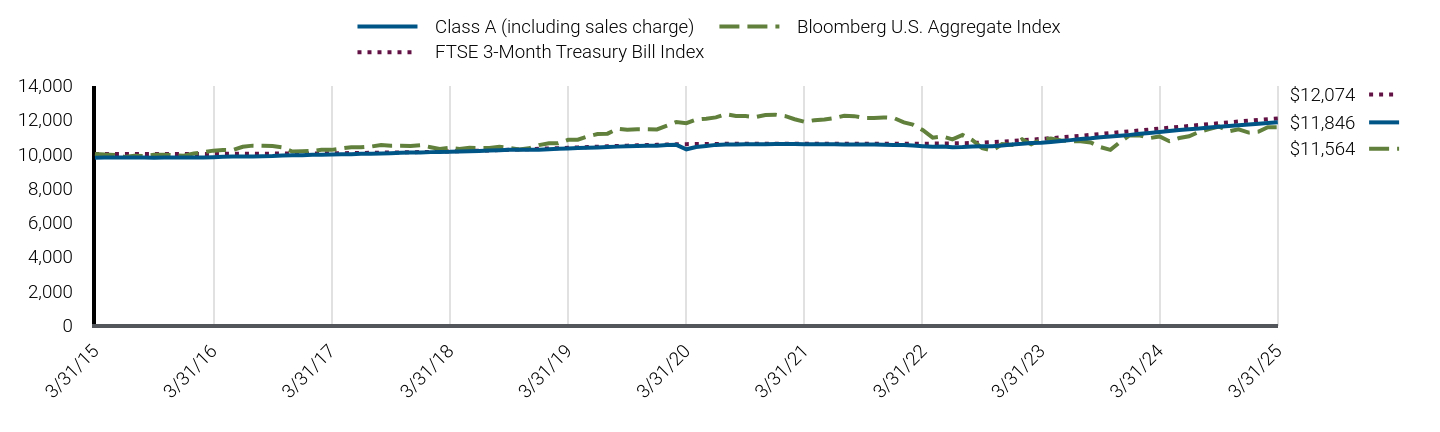
|
Class A (including sales charge) |
Bloomberg U.S. Aggregate Index |
FTSE 3-Month Treasury Bill Index |
3/31/15 |
$9,775 |
$10,000 |
$10,000 |
4/30/15 |
$9,789 |
$9,964 |
$10,000 |
5/31/15 |
$9,792 |
$9,940 |
$10,000 |
6/30/15 |
$9,797 |
$9,832 |
$10,000 |
7/31/15 |
$9,801 |
$9,900 |
$10,001 |
8/31/15 |
$9,795 |
$9,886 |
$10,001 |
9/30/15 |
$9,780 |
$9,953 |
$10,001 |
10/31/15 |
$9,794 |
$9,954 |
$10,001 |
11/30/15 |
$9,800 |
$9,928 |
$10,002 |
12/31/15 |
$9,798 |
$9,896 |
$10,002 |
1/31/16 |
$9,794 |
$10,032 |
$10,004 |
2/29/16 |
$9,801 |
$10,103 |
$10,005 |
3/31/16 |
$9,817 |
$10,196 |
$10,008 |
4/30/16 |
$9,835 |
$10,235 |
$10,010 |
5/31/16 |
$9,852 |
$10,238 |
$10,012 |
6/30/16 |
$9,850 |
$10,422 |
$10,014 |
7/31/16 |
$9,858 |
$10,488 |
$10,016 |
8/31/16 |
$9,875 |
$10,476 |
$10,019 |
9/30/16 |
$9,885 |
$10,470 |
$10,021 |
10/31/16 |
$9,912 |
$10,389 |
$10,024 |
11/30/16 |
$9,921 |
$10,144 |
$10,026 |
12/31/16 |
$9,932 |
$10,158 |
$10,029 |
1/31/17 |
$9,951 |
$10,178 |
$10,033 |
2/28/17 |
$9,960 |
$10,246 |
$10,037 |
3/31/17 |
$9,970 |
$10,241 |
$10,042 |
4/30/17 |
$9,979 |
$10,320 |
$10,047 |
5/31/17 |
$9,989 |
$10,399 |
$10,053 |
6/30/17 |
$10,009 |
$10,389 |
$10,060 |
7/31/17 |
$10,019 |
$10,434 |
$10,068 |
8/31/17 |
$10,029 |
$10,527 |
$10,077 |
9/30/17 |
$10,050 |
$10,477 |
$10,086 |
10/31/17 |
$10,070 |
$10,483 |
$10,095 |
11/30/17 |
$10,081 |
$10,470 |
$10,104 |
12/31/17 |
$10,088 |
$10,518 |
$10,114 |
1/31/18 |
$10,109 |
$10,397 |
$10,125 |
2/28/18 |
$10,121 |
$10,298 |
$10,136 |
3/31/18 |
$10,125 |
$10,364 |
$10,149 |
4/30/18 |
$10,150 |
$10,287 |
$10,163 |
5/31/18 |
$10,156 |
$10,360 |
$10,178 |
6/30/18 |
$10,173 |
$10,348 |
$10,193 |
7/31/18 |
$10,200 |
$10,350 |
$10,210 |
8/31/18 |
$10,219 |
$10,417 |
$10,227 |
9/30/18 |
$10,245 |
$10,350 |
$10,244 |
10/31/18 |
$10,253 |
$10,268 |
$10,263 |
11/30/18 |
$10,252 |
$10,329 |
$10,282 |
12/31/18 |
$10,251 |
$10,519 |
$10,302 |
1/31/19 |
$10,282 |
$10,631 |
$10,323 |
2/28/19 |
$10,313 |
$10,625 |
$10,342 |
3/31/19 |
$10,324 |
$10,829 |
$10,364 |
4/30/19 |
$10,346 |
$10,831 |
$10,385 |
5/31/19 |
$10,359 |
$11,024 |
$10,406 |
6/30/19 |
$10,378 |
$11,162 |
$10,427 |
7/31/19 |
$10,409 |
$11,187 |
$10,448 |
8/31/19 |
$10,430 |
$11,476 |
$10,468 |
9/30/19 |
$10,447 |
$11,415 |
$10,486 |
10/31/19 |
$10,465 |
$11,450 |
$10,504 |
11/30/19 |
$10,481 |
$11,444 |
$10,519 |
12/31/19 |
$10,487 |
$11,436 |
$10,534 |
1/31/20 |
$10,523 |
$11,656 |
$10,548 |
2/29/20 |
$10,536 |
$11,866 |
$10,562 |
3/31/20 |
$10,274 |
$11,796 |
$10,575 |
4/30/20 |
$10,411 |
$12,006 |
$10,584 |
5/31/20 |
$10,473 |
$12,062 |
$10,588 |
6/30/20 |
$10,532 |
$12,137 |
$10,589 |
7/31/20 |
$10,547 |
$12,319 |
$10,591 |
8/31/20 |
$10,560 |
$12,219 |
$10,592 |
9/30/20 |
$10,563 |
$12,213 |
$10,593 |
10/31/20 |
$10,564 |
$12,158 |
$10,594 |
11/30/20 |
$10,565 |
$12,277 |
$10,595 |
12/31/20 |
$10,576 |
$12,294 |
$10,595 |
1/31/21 |
$10,576 |
$12,206 |
$10,596 |
2/28/21 |
$10,576 |
$12,030 |
$10,597 |
3/31/21 |
$10,566 |
$11,880 |
$10,597 |
4/30/21 |
$10,566 |
$11,974 |
$10,598 |
5/31/21 |
$10,567 |
$12,013 |
$10,598 |
6/30/21 |
$10,567 |
$12,097 |
$10,598 |
7/31/21 |
$10,556 |
$12,232 |
$10,598 |
8/31/21 |
$10,556 |
$12,209 |
$10,599 |
9/30/21 |
$10,556 |
$12,103 |
$10,599 |
10/31/21 |
$10,547 |
$12,100 |
$10,599 |
11/30/21 |
$10,538 |
$12,136 |
$10,600 |
12/31/21 |
$10,529 |
$12,105 |
$10,600 |
1/31/22 |
$10,520 |
$11,844 |
$10,601 |
2/28/22 |
$10,491 |
$11,712 |
$10,602 |
3/31/22 |
$10,452 |
$11,386 |
$10,603 |
4/30/22 |
$10,426 |
$10,954 |
$10,606 |
5/31/22 |
$10,433 |
$11,025 |
$10,611 |
6/30/22 |
$10,390 |
$10,852 |
$10,619 |
7/31/22 |
$10,403 |
$11,117 |
$10,630 |
8/31/22 |
$10,439 |
$10,803 |
$10,645 |
9/30/22 |
$10,457 |
$10,336 |
$10,666 |
10/31/22 |
$10,455 |
$10,202 |
$10,693 |
11/30/22 |
$10,490 |
$10,578 |
$10,723 |
12/31/22 |
$10,554 |
$10,530 |
$10,759 |
1/31/23 |
$10,594 |
$10,854 |
$10,799 |
2/28/23 |
$10,648 |
$10,573 |
$10,837 |
3/31/23 |
$10,655 |
$10,842 |
$10,880 |
4/30/23 |
$10,701 |
$10,908 |
$10,923 |
5/31/23 |
$10,753 |
$10,789 |
$10,970 |
6/30/23 |
$10,809 |
$10,750 |
$11,016 |
7/31/23 |
$10,871 |
$10,743 |
$11,067 |
8/31/23 |
$10,916 |
$10,674 |
$11,118 |
9/30/23 |
$10,973 |
$10,403 |
$11,168 |
10/31/23 |
$11,018 |
$10,239 |
$11,221 |
11/30/23 |
$11,064 |
$10,702 |
$11,272 |
12/31/23 |
$11,116 |
$11,112 |
$11,325 |
1/31/24 |
$11,184 |
$11,082 |
$11,378 |
2/29/24 |
$11,229 |
$10,925 |
$11,428 |
3/31/24 |
$11,287 |
$11,026 |
$11,480 |
4/30/24 |
$11,345 |
$10,747 |
$11,532 |
5/31/24 |
$11,395 |
$10,930 |
$11,586 |
6/30/24 |
$11,439 |
$11,033 |
$11,638 |
7/31/24 |
$11,486 |
$11,291 |
$11,692 |
8/31/24 |
$11,547 |
$11,453 |
$11,746 |
9/30/24 |
$11,589 |
$11,606 |
$11,797 |
10/31/24 |
$11,634 |
$11,319 |
$11,848 |
11/30/24 |
$11,678 |
$11,438 |
$11,895 |
12/31/24 |
$11,723 |
$11,251 |
$11,942 |
1/31/25 |
$11,767 |
$11,311 |
$11,988 |
2/28/25 |
$11,806 |
$11,560 |
$12,029 |
3/31/25 |
$11,846 |
$11,564 |
$12,074 |
|
| Average Annual Return [Table Text Block] |
Class/Index Name |
1 Year |
5 Years |
10 Years |
Class A (excluding sales charge) |
4.95% |
2.89% |
1.94% |
Class A (including sales charge) |
4.95% |
2.89% |
1.71% |
Bloomberg U.S. Aggregate Index |
4.88% |
(0.40%) |
1.46% |
FTSE 3-Month Treasury Bill Index |
5.17% |
2.69% |
1.90% | |
| No Deduction of Taxes [Text Block] |
Returns shown do not reflect the deduction of taxes that a shareholder would pay on Fund distributions or the redemption of Fund shares.
|
| Performance Table Market Index Changed [Text Block] |
Differences in the Fund’s performance versus an index and related attribution information with respect to particular categories of securities or individual positions may be attributable, in part, to differences in the pricing methodologies used by the Fund and the index.
|
| Updated Performance Information Location [Text Block] |
For performance current to the most recent month-end, visit www.pimco.com/literature or via 888.87.PIMCO (888.877.4626).
|
| AssetsNet |
$ 2,035,965,000
|
| Holdings Count | Holding |
389
|
| Advisory Fees Paid, Amount |
$ 5,035,000
|
| InvestmentCompanyPortfolioTurnover |
86.00%
|
| Additional Fund Statistics [Text Block] |
Key Fund StatisticsFootnote Reference† (as of the end of the reporting period)
Total Net Assets |
$2,035,965 |
# of Portfolio Holdings |
389 |
Portfolio Turnover Rate |
86% |
Total Net Advisory Fees Paid During the Reporting Period |
$5,035 |
| Footnote |
Description |
Footnote† |
Dollar amounts displayed in 000's | |
| Holdings [Text Block] |
Security Type Breakdown (% of Net Asset Value)Footnote Reference*
Corporate Bonds & Notes |
56.0% |
Asset-Backed Securities |
20.5% |
U.S. Government Agencies |
9.1% |
Non-Agency Mortgage-Backed Securities |
5.3% |
Sovereign Issues |
4.8% |
Municipal Bonds & Notes |
1.1% |
Short-Term Instruments |
2.4% |
Affiliated Investments |
4.3% |
Financial Derivative Instruments |
0.1% |
Other Assets and Liabilities, Net |
(3.6%) |
Total |
100.0% |
| Footnote |
Description |
Footnote* |
% of Net Asset Value includes derivatives instruments, if any, valued at the value used for determining the Fund's net asset value. The notional exposure of such derivatives investments therefore may be greater than what is depicted. | |
| Material Fund Change [Text Block] |
|
| C000114210 |
|
| Shareholder Report [Line Items] |
|
| Fund Name |
PIMCO Short Asset Investment Fund
|
| Class Name |
Administrative Class
|
| Trading Symbol |
PAIQX
|
| Annual or Semi-Annual Statement [Text Block] |
This annual shareholder report contains important information about the PIMCO Short Asset Investment Fund (the "Fund") for the period of April 1, 2024 to March 31, 2025 (the "reporting period").
|
| Shareholder Report Annual or Semi-Annual |
Annual Shareholder Report
|
| Additional Information [Text Block] |
You can find additional information about the Fund at www.pimco.com/literature. You can also request this information by contacting us at 888.87.PIMCO (888.877.4626).
|
| Additional Information Phone Number |
888.87.PIMCO (888.877.4626)
|
| Expenses [Text Block] |
What were the Fund costs for the reporting period?(based on a hypothetical $10,000 investment)
Class Name |
Cost of a $10,000 investment |
Costs paid as a percentage of a $10,000 investment |
Administrative Class |
$66 |
0.64% | |
| Expenses Paid, Amount |
$ 66
|
| Expense Ratio, Percent |
0.64%
|
| Factors Affecting Performance [Text Block] |
How did the Fund perform during the reporting period and what affected its performance?The following affected performance (on a gross basis) during the reporting period: Holdings of investment grade corporate credit, particularly financials, contributed to relative performance versus the FTSE 3-Month Treasury Bill Index ("Index"), as investment grade corporate bonds had positive total returns. Select holdings of securitized credit, particularly asset-backed securities (“ABS”) and collateralized loan obligations (“CLO”) contributed to relative performance versus the Index, as carry contributions from ABS offset detractions from spreads widening and CLO spreads tightened. Overweight exposure to U.S. duration in the 1-year part of the curve contributed to relative performance versus the Index, as interest rates fell. There were no material detractors for this Fund.
|
| Performance Past Does Not Indicate Future [Text] |
Performance quoted represents past performance. Past performance is not a guarantee or a reliable indicator of future results.
|
| Line Graph [Table Text Block] |
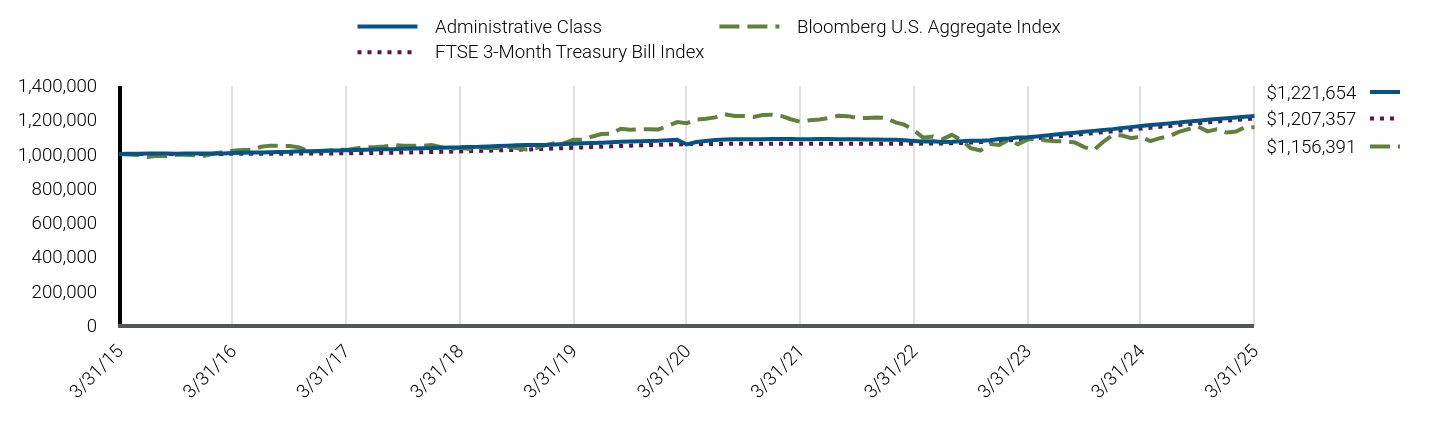
|
Administrative Class |
Bloomberg U.S. Aggregate Index |
FTSE 3-Month Treasury Bill Index |
3/31/15 |
$1,000,000 |
$1,000,000 |
$1,000,000 |
4/30/15 |
$1,001,453 |
$996,412 |
$1,000,016 |
5/31/15 |
$1,001,903 |
$994,012 |
$1,000,030 |
6/30/15 |
$1,002,482 |
$983,174 |
$1,000,041 |
7/31/15 |
$1,003,008 |
$990,008 |
$1,000,050 |
8/31/15 |
$1,002,459 |
$988,586 |
$1,000,075 |
9/30/15 |
$1,001,016 |
$995,273 |
$1,000,101 |
10/31/15 |
$1,002,590 |
$995,439 |
$1,000,125 |
11/30/15 |
$1,003,226 |
$992,809 |
$1,000,152 |
12/31/15 |
$1,003,150 |
$989,601 |
$1,000,229 |
1/31/16 |
$1,002,789 |
$1,003,219 |
$1,000,354 |
2/29/16 |
$1,003,563 |
$1,010,335 |
$1,000,534 |
3/31/16 |
$1,005,359 |
$1,019,605 |
$1,000,767 |
4/30/16 |
$1,007,255 |
$1,023,519 |
$1,001,004 |
5/31/16 |
$1,009,091 |
$1,023,781 |
$1,001,216 |
6/30/16 |
$1,008,969 |
$1,042,177 |
$1,001,416 |
7/31/16 |
$1,009,843 |
$1,048,765 |
$1,001,638 |
8/31/16 |
$1,011,755 |
$1,047,566 |
$1,001,877 |
9/30/16 |
$1,012,840 |
$1,046,952 |
$1,002,116 |
10/31/16 |
$1,015,703 |
$1,038,944 |
$1,002,369 |
11/30/16 |
$1,016,643 |
$1,014,369 |
$1,002,627 |
12/31/16 |
$1,017,937 |
$1,015,800 |
$1,002,938 |
1/31/17 |
$1,020,024 |
$1,017,793 |
$1,003,311 |
2/28/17 |
$1,021,030 |
$1,024,634 |
$1,003,703 |
3/31/17 |
$1,022,077 |
$1,024,097 |
$1,004,153 |
4/30/17 |
$1,023,089 |
$1,032,000 |
$1,004,663 |
5/31/17 |
$1,024,149 |
$1,039,943 |
$1,005,272 |
6/30/17 |
$1,026,300 |
$1,038,896 |
$1,005,984 |
7/31/17 |
$1,027,316 |
$1,043,367 |
$1,006,794 |
8/31/17 |
$1,028,402 |
$1,052,726 |
$1,007,683 |
9/30/17 |
$1,030,591 |
$1,047,712 |
$1,008,552 |
10/31/17 |
$1,032,747 |
$1,048,319 |
$1,009,463 |
11/30/17 |
$1,033,926 |
$1,046,973 |
$1,010,364 |
12/31/17 |
$1,034,719 |
$1,051,778 |
$1,011,376 |
1/31/18 |
$1,036,972 |
$1,039,665 |
$1,012,488 |
2/28/18 |
$1,038,294 |
$1,029,809 |
$1,013,578 |
3/31/18 |
$1,038,664 |
$1,036,414 |
$1,014,900 |
4/30/18 |
$1,041,313 |
$1,028,705 |
$1,016,269 |
5/31/18 |
$1,041,930 |
$1,036,047 |
$1,017,787 |
6/30/18 |
$1,043,763 |
$1,034,773 |
$1,019,327 |
7/31/18 |
$1,046,498 |
$1,035,019 |
$1,020,980 |
8/31/18 |
$1,048,579 |
$1,041,679 |
$1,022,701 |
9/30/18 |
$1,051,334 |
$1,034,971 |
$1,024,424 |
10/31/18 |
$1,052,171 |
$1,026,792 |
$1,026,288 |
11/30/18 |
$1,052,197 |
$1,032,921 |
$1,028,181 |
12/31/18 |
$1,052,204 |
$1,051,898 |
$1,030,216 |
1/31/19 |
$1,055,322 |
$1,063,068 |
$1,032,309 |
2/28/19 |
$1,058,557 |
$1,062,452 |
$1,034,221 |
3/31/19 |
$1,059,856 |
$1,082,853 |
$1,036,364 |
4/30/19 |
$1,062,135 |
$1,083,130 |
$1,038,451 |
5/31/19 |
$1,063,465 |
$1,102,358 |
$1,040,621 |
6/30/19 |
$1,065,509 |
$1,116,201 |
$1,042,721 |
7/31/19 |
$1,068,749 |
$1,118,657 |
$1,044,805 |
8/31/19 |
$1,070,984 |
$1,147,643 |
$1,046,791 |
9/30/19 |
$1,072,816 |
$1,141,531 |
$1,048,587 |
10/31/19 |
$1,074,723 |
$1,144,969 |
$1,050,362 |
11/30/19 |
$1,076,518 |
$1,144,386 |
$1,051,926 |
12/31/19 |
$1,077,172 |
$1,143,588 |
$1,053,424 |
1/31/20 |
$1,080,940 |
$1,165,596 |
$1,054,843 |
2/29/20 |
$1,082,416 |
$1,186,575 |
$1,056,175 |
3/31/20 |
$1,055,594 |
$1,179,592 |
$1,057,509 |
4/30/20 |
$1,069,693 |
$1,200,561 |
$1,058,376 |
5/31/20 |
$1,076,155 |
$1,206,151 |
$1,058,833 |
6/30/20 |
$1,082,350 |
$1,213,749 |
$1,058,937 |
7/31/20 |
$1,084,017 |
$1,231,878 |
$1,059,058 |
8/31/20 |
$1,085,440 |
$1,221,935 |
$1,059,176 |
9/30/20 |
$1,085,762 |
$1,221,265 |
$1,059,278 |
10/31/20 |
$1,086,011 |
$1,215,812 |
$1,059,369 |
11/30/20 |
$1,086,165 |
$1,227,742 |
$1,059,456 |
12/31/20 |
$1,087,399 |
$1,229,433 |
$1,059,538 |
1/31/21 |
$1,087,494 |
$1,220,618 |
$1,059,615 |
2/28/21 |
$1,087,595 |
$1,202,992 |
$1,059,676 |
3/31/21 |
$1,086,590 |
$1,187,971 |
$1,059,730 |
4/30/21 |
$1,086,739 |
$1,197,356 |
$1,059,766 |
5/31/21 |
$1,086,860 |
$1,201,268 |
$1,059,790 |
6/30/21 |
$1,086,972 |
$1,209,708 |
$1,059,806 |
7/31/21 |
$1,085,963 |
$1,223,233 |
$1,059,829 |
8/31/21 |
$1,086,039 |
$1,220,905 |
$1,059,862 |
9/30/21 |
$1,086,189 |
$1,210,334 |
$1,059,903 |
10/31/21 |
$1,085,289 |
$1,210,000 |
$1,059,941 |
11/30/21 |
$1,084,428 |
$1,213,580 |
$1,059,981 |
12/31/21 |
$1,083,651 |
$1,210,475 |
$1,060,025 |
1/31/22 |
$1,082,810 |
$1,184,396 |
$1,060,075 |
2/28/22 |
$1,079,899 |
$1,171,183 |
$1,060,155 |
3/31/22 |
$1,075,966 |
$1,138,645 |
$1,060,323 |
4/30/22 |
$1,073,335 |
$1,095,436 |
$1,060,623 |
5/31/22 |
$1,074,136 |
$1,102,499 |
$1,061,136 |
6/30/22 |
$1,069,807 |
$1,085,203 |
$1,061,852 |
7/31/22 |
$1,071,269 |
$1,111,719 |
$1,062,953 |
8/31/22 |
$1,074,989 |
$1,080,306 |
$1,064,534 |
9/30/22 |
$1,076,914 |
$1,033,630 |
$1,066,619 |
10/31/22 |
$1,076,773 |
$1,020,242 |
$1,069,261 |
11/30/22 |
$1,080,384 |
$1,057,762 |
$1,072,326 |
12/31/22 |
$1,086,945 |
$1,052,991 |
$1,075,945 |
1/31/23 |
$1,091,054 |
$1,085,385 |
$1,079,916 |
2/28/23 |
$1,096,621 |
$1,057,322 |
$1,083,683 |
3/31/23 |
$1,097,334 |
$1,084,180 |
$1,088,015 |
4/30/23 |
$1,102,144 |
$1,090,751 |
$1,092,346 |
5/31/23 |
$1,107,480 |
$1,078,874 |
$1,096,968 |
6/30/23 |
$1,113,220 |
$1,075,027 |
$1,101,639 |
7/31/23 |
$1,119,688 |
$1,074,277 |
$1,106,658 |
8/31/23 |
$1,124,332 |
$1,067,415 |
$1,111,804 |
9/30/23 |
$1,130,256 |
$1,040,290 |
$1,116,824 |
10/31/23 |
$1,134,941 |
$1,023,873 |
$1,122,085 |
11/30/23 |
$1,139,714 |
$1,070,241 |
$1,127,216 |
12/31/23 |
$1,145,120 |
$1,111,209 |
$1,132,519 |
1/31/24 |
$1,152,139 |
$1,108,157 |
$1,137,809 |
2/29/24 |
$1,156,806 |
$1,092,501 |
$1,142,751 |
3/31/24 |
$1,162,835 |
$1,102,589 |
$1,148,046 |
4/30/24 |
$1,168,864 |
$1,074,739 |
$1,153,200 |
5/31/24 |
$1,174,175 |
$1,092,959 |
$1,158,559 |
6/30/24 |
$1,178,763 |
$1,103,307 |
$1,163,774 |
7/31/24 |
$1,183,771 |
$1,129,077 |
$1,169,185 |
8/31/24 |
$1,190,178 |
$1,145,301 |
$1,174,577 |
9/30/24 |
$1,194,601 |
$1,160,636 |
$1,179,725 |
10/31/24 |
$1,199,310 |
$1,131,854 |
$1,184,817 |
11/30/24 |
$1,203,970 |
$1,143,821 |
$1,189,527 |
12/31/24 |
$1,208,682 |
$1,125,101 |
$1,194,204 |
1/31/25 |
$1,213,276 |
$1,131,070 |
$1,198,799 |
2/28/25 |
$1,217,421 |
$1,155,956 |
$1,202,884 |
3/31/25 |
$1,221,654 |
$1,156,391 |
$1,207,357 |
|
| Average Annual Return [Table Text Block] |
Class/Index Name |
1 Year |
5 Years |
10 Years |
Administrative Class |
5.06% |
2.97% |
2.02% |
Bloomberg U.S. Aggregate Index |
4.88% |
(0.40%) |
1.46% |
FTSE 3-Month Treasury Bill Index |
5.17% |
2.69% |
1.90% | |
| No Deduction of Taxes [Text Block] |
Returns shown do not reflect the deduction of taxes that a shareholder would pay on Fund distributions or the redemption of Fund shares.
|
| Performance Table Market Index Changed [Text Block] |
Differences in the Fund’s performance versus an index and related attribution information with respect to particular categories of securities or individual positions may be attributable, in part, to differences in the pricing methodologies used by the Fund and the index.
|
| Updated Performance Information Location [Text Block] |
For performance current to the most recent month-end, visit www.pimco.com/literature or via 888.87.PIMCO (888.877.4626).
|
| AssetsNet |
$ 2,035,965,000
|
| Holdings Count | Holding |
389
|
| Advisory Fees Paid, Amount |
$ 5,035,000
|
| InvestmentCompanyPortfolioTurnover |
86.00%
|
| Additional Fund Statistics [Text Block] |
Key Fund StatisticsFootnote Reference† (as of the end of the reporting period)
Total Net Assets |
$2,035,965 |
# of Portfolio Holdings |
389 |
Portfolio Turnover Rate |
86% |
Total Net Advisory Fees Paid During the Reporting Period |
$5,035 |
| Footnote |
Description |
Footnote† |
Dollar amounts displayed in 000's | |
| Holdings [Text Block] |
Security Type Breakdown (% of Net Asset Value)Footnote Reference*
Corporate Bonds & Notes |
56.0% |
Asset-Backed Securities |
20.5% |
U.S. Government Agencies |
9.1% |
Non-Agency Mortgage-Backed Securities |
5.3% |
Sovereign Issues |
4.8% |
Municipal Bonds & Notes |
1.1% |
Short-Term Instruments |
2.4% |
Affiliated Investments |
4.3% |
Financial Derivative Instruments |
0.1% |
Other Assets and Liabilities, Net |
(3.6%) |
Total |
100.0% |
| Footnote |
Description |
Footnote* |
% of Net Asset Value includes derivatives instruments, if any, valued at the value used for determining the Fund's net asset value. The notional exposure of such derivatives investments therefore may be greater than what is depicted. | |
| Material Fund Change [Text Block] |
|
| C000200464 |
|
| Shareholder Report [Line Items] |
|
| Fund Name |
PIMCO Short Asset Investment Fund
|
| Class Name |
I-3
|
| Trading Symbol |
PANDX
|
| Annual or Semi-Annual Statement [Text Block] |
This annual shareholder report contains important information about the PIMCO Short Asset Investment Fund (the "Fund") for the period of April 1, 2024 to March 31, 2025 (the "reporting period").
|
| Shareholder Report Annual or Semi-Annual |
Annual Shareholder Report
|
| Additional Information [Text Block] |
You can find additional information about the Fund at www.pimco.com/literature. You can also request this information by contacting us at 888.87.PIMCO (888.877.4626).
|
| Additional Information Phone Number |
888.87.PIMCO (888.877.4626)
|
| Expenses [Text Block] |
What were the Fund costs for the reporting period?(based on a hypothetical $10,000 investment)
Class Name |
Cost of a $10,000 investment |
Costs paid as a percentage of a $10,000 investment |
I-3 |
$55 |
0.54% | |
| Expenses Paid, Amount |
$ 55
|
| Expense Ratio, Percent |
0.54%
|
| Factors Affecting Performance [Text Block] |
How did the Fund perform during the reporting period and what affected its performance?The following affected performance (on a gross basis) during the reporting period: Holdings of investment grade corporate credit, particularly financials, contributed to relative performance versus the FTSE 3-Month Treasury Bill Index ("Index"), as investment grade corporate bonds had positive total returns. Select holdings of securitized credit, particularly asset-backed securities (“ABS”) and collateralized loan obligations (“CLO”) contributed to relative performance versus the Index, as carry contributions from ABS offset detractions from spreads widening and CLO spreads tightened. Overweight exposure to U.S. duration in the 1-year part of the curve contributed to relative performance versus the Index, as interest rates fell. There were no material detractors for this Fund.
|
| Performance Past Does Not Indicate Future [Text] |
Performance quoted represents past performance. Past performance is not a guarantee or a reliable indicator of future results.
|
| Line Graph [Table Text Block] |
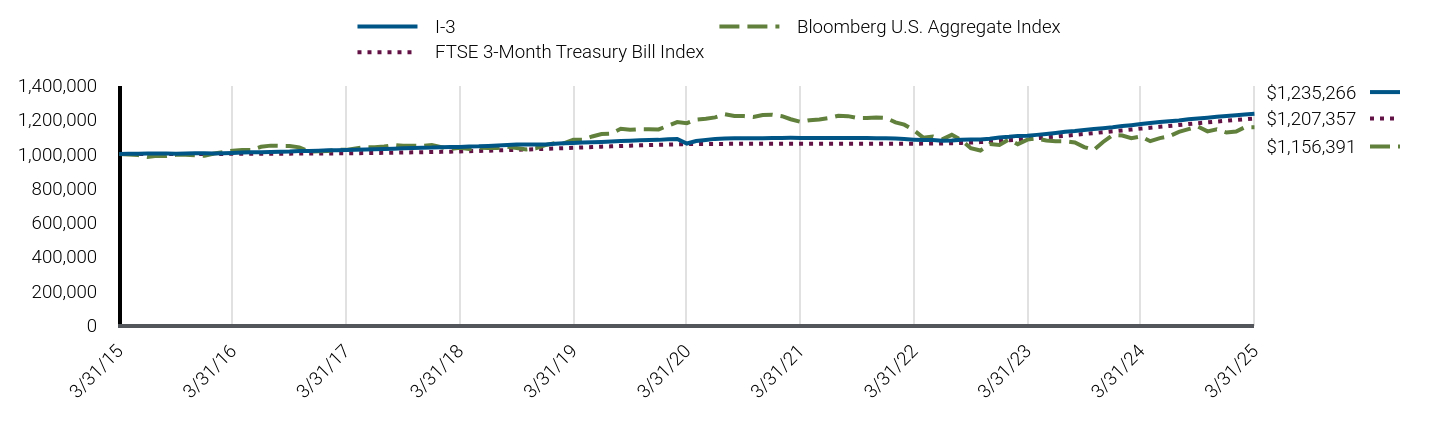
|
I-3 |
Bloomberg U.S. Aggregate Index |
FTSE 3-Month Treasury Bill Index |
3/31/15 |
$1,000,000 |
$1,000,000 |
$1,000,000 |
4/30/15 |
$1,001,528 |
$996,412 |
$1,000,016 |
5/31/15 |
$1,002,047 |
$994,012 |
$1,000,030 |
6/30/15 |
$1,002,692 |
$983,174 |
$1,000,041 |
7/31/15 |
$1,003,299 |
$990,008 |
$1,000,050 |
8/31/15 |
$1,002,804 |
$988,586 |
$1,000,075 |
9/30/15 |
$1,001,426 |
$995,273 |
$1,000,101 |
10/31/15 |
$1,003,073 |
$995,439 |
$1,000,125 |
11/30/15 |
$1,003,769 |
$992,809 |
$1,000,152 |
12/31/15 |
$1,003,781 |
$989,601 |
$1,000,229 |
1/31/16 |
$1,003,467 |
$1,003,219 |
$1,000,354 |
2/29/16 |
$1,004,306 |
$1,010,335 |
$1,000,534 |
3/31/16 |
$1,006,172 |
$1,019,605 |
$1,000,767 |
4/30/16 |
$1,008,144 |
$1,023,519 |
$1,001,004 |
5/31/16 |
$1,010,044 |
$1,023,781 |
$1,001,216 |
6/30/16 |
$1,009,991 |
$1,042,177 |
$1,001,416 |
7/31/16 |
$1,010,935 |
$1,048,765 |
$1,001,638 |
8/31/16 |
$1,012,919 |
$1,047,566 |
$1,001,877 |
9/30/16 |
$1,014,087 |
$1,046,952 |
$1,002,116 |
10/31/16 |
$1,017,011 |
$1,038,944 |
$1,002,369 |
11/30/16 |
$1,018,019 |
$1,014,369 |
$1,002,627 |
12/31/16 |
$1,019,398 |
$1,015,800 |
$1,002,938 |
1/31/17 |
$1,021,496 |
$1,017,793 |
$1,003,311 |
2/28/17 |
$1,022,548 |
$1,024,634 |
$1,003,703 |
3/31/17 |
$1,023,691 |
$1,024,097 |
$1,004,153 |
4/30/17 |
$1,024,785 |
$1,032,000 |
$1,004,663 |
5/31/17 |
$1,025,944 |
$1,039,943 |
$1,005,272 |
6/30/17 |
$1,028,205 |
$1,038,896 |
$1,005,984 |
7/31/17 |
$1,029,323 |
$1,043,367 |
$1,006,794 |
8/31/17 |
$1,030,557 |
$1,052,726 |
$1,007,683 |
9/30/17 |
$1,032,851 |
$1,047,712 |
$1,008,552 |
10/31/17 |
$1,035,076 |
$1,048,319 |
$1,009,463 |
11/30/17 |
$1,036,341 |
$1,046,973 |
$1,010,364 |
12/31/17 |
$1,037,209 |
$1,051,778 |
$1,011,376 |
1/31/18 |
$1,039,537 |
$1,039,665 |
$1,012,488 |
2/28/18 |
$1,040,933 |
$1,029,809 |
$1,013,578 |
3/31/18 |
$1,041,529 |
$1,036,414 |
$1,014,900 |
4/30/18 |
$1,044,227 |
$1,028,705 |
$1,016,269 |
5/31/18 |
$1,045,016 |
$1,036,047 |
$1,017,787 |
6/30/18 |
$1,047,002 |
$1,034,773 |
$1,019,327 |
7/31/18 |
$1,049,908 |
$1,035,019 |
$1,020,980 |
8/31/18 |
$1,052,069 |
$1,041,679 |
$1,022,701 |
9/30/18 |
$1,054,919 |
$1,034,971 |
$1,024,424 |
10/31/18 |
$1,055,911 |
$1,026,792 |
$1,026,288 |
11/30/18 |
$1,056,027 |
$1,032,921 |
$1,028,181 |
12/31/18 |
$1,056,126 |
$1,051,898 |
$1,030,216 |
1/31/19 |
$1,059,420 |
$1,063,068 |
$1,032,309 |
2/28/19 |
$1,062,783 |
$1,062,452 |
$1,034,221 |
3/31/19 |
$1,064,181 |
$1,082,853 |
$1,036,364 |
4/30/19 |
$1,066,555 |
$1,083,130 |
$1,038,451 |
5/31/19 |
$1,067,962 |
$1,102,358 |
$1,040,621 |
6/30/19 |
$1,070,101 |
$1,116,201 |
$1,042,721 |
7/31/19 |
$1,073,464 |
$1,118,657 |
$1,044,805 |
8/31/19 |
$1,075,806 |
$1,147,643 |
$1,046,791 |
9/30/19 |
$1,077,754 |
$1,141,531 |
$1,048,587 |
10/31/19 |
$1,079,766 |
$1,144,969 |
$1,050,362 |
11/30/19 |
$1,081,671 |
$1,144,386 |
$1,051,926 |
12/31/19 |
$1,082,422 |
$1,143,588 |
$1,053,424 |
1/31/20 |
$1,086,354 |
$1,165,596 |
$1,054,843 |
2/29/20 |
$1,087,899 |
$1,186,575 |
$1,056,175 |
3/31/20 |
$1,061,021 |
$1,179,592 |
$1,057,509 |
4/30/20 |
$1,075,289 |
$1,200,561 |
$1,058,376 |
5/31/20 |
$1,081,883 |
$1,206,151 |
$1,058,833 |
6/30/20 |
$1,088,203 |
$1,213,749 |
$1,058,937 |
7/31/20 |
$1,089,985 |
$1,231,878 |
$1,059,058 |
8/31/20 |
$1,091,504 |
$1,221,935 |
$1,059,176 |
9/30/20 |
$1,091,908 |
$1,221,265 |
$1,059,278 |
10/31/20 |
$1,092,244 |
$1,215,812 |
$1,059,369 |
11/30/20 |
$1,092,488 |
$1,227,742 |
$1,059,456 |
12/31/20 |
$1,093,837 |
$1,229,433 |
$1,059,538 |
1/31/21 |
$1,094,022 |
$1,220,618 |
$1,059,615 |
2/28/21 |
$1,094,211 |
$1,202,992 |
$1,059,676 |
3/31/21 |
$1,093,300 |
$1,187,971 |
$1,059,730 |
4/30/21 |
$1,093,547 |
$1,197,356 |
$1,059,766 |
5/31/21 |
$1,093,754 |
$1,201,268 |
$1,059,790 |
6/30/21 |
$1,093,960 |
$1,209,708 |
$1,059,806 |
7/31/21 |
$1,093,041 |
$1,223,233 |
$1,059,829 |
8/31/21 |
$1,093,206 |
$1,220,905 |
$1,059,862 |
9/30/21 |
$1,093,448 |
$1,210,334 |
$1,059,903 |
10/31/21 |
$1,092,638 |
$1,210,000 |
$1,059,941 |
11/30/21 |
$1,091,874 |
$1,213,580 |
$1,059,981 |
12/31/21 |
$1,091,192 |
$1,210,475 |
$1,060,025 |
1/31/22 |
$1,090,435 |
$1,184,396 |
$1,060,075 |
2/28/22 |
$1,087,591 |
$1,171,183 |
$1,060,155 |
3/31/22 |
$1,083,725 |
$1,138,645 |
$1,060,323 |
4/30/22 |
$1,081,170 |
$1,095,436 |
$1,060,623 |
5/31/22 |
$1,082,075 |
$1,102,499 |
$1,061,136 |
6/30/22 |
$1,077,794 |
$1,085,203 |
$1,061,852 |
7/31/22 |
$1,079,358 |
$1,111,719 |
$1,062,953 |
8/31/22 |
$1,083,225 |
$1,080,306 |
$1,064,534 |
9/30/22 |
$1,085,281 |
$1,033,630 |
$1,066,619 |
10/31/22 |
$1,085,238 |
$1,020,242 |
$1,069,261 |
11/30/22 |
$1,088,972 |
$1,057,762 |
$1,072,326 |
12/31/22 |
$1,095,758 |
$1,052,991 |
$1,075,945 |
1/31/23 |
$1,099,996 |
$1,085,385 |
$1,079,916 |
2/28/23 |
$1,105,738 |
$1,057,322 |
$1,083,683 |
3/31/23 |
$1,106,621 |
$1,084,180 |
$1,088,015 |
4/30/23 |
$1,111,583 |
$1,090,751 |
$1,092,346 |
5/31/23 |
$1,117,114 |
$1,078,874 |
$1,096,968 |
6/30/23 |
$1,123,052 |
$1,075,027 |
$1,101,639 |
7/31/23 |
$1,129,718 |
$1,074,277 |
$1,106,658 |
8/31/23 |
$1,134,557 |
$1,067,415 |
$1,111,804 |
9/30/23 |
$1,140,684 |
$1,040,290 |
$1,116,824 |
10/31/23 |
$1,145,571 |
$1,023,873 |
$1,122,085 |
11/30/23 |
$1,150,541 |
$1,070,241 |
$1,127,216 |
12/31/23 |
$1,156,159 |
$1,111,209 |
$1,132,519 |
1/31/24 |
$1,163,399 |
$1,108,157 |
$1,137,809 |
2/29/24 |
$1,168,257 |
$1,092,501 |
$1,142,751 |
3/31/24 |
$1,174,498 |
$1,102,589 |
$1,148,046 |
4/30/24 |
$1,180,713 |
$1,074,739 |
$1,153,200 |
5/31/24 |
$1,186,196 |
$1,092,959 |
$1,158,559 |
6/30/24 |
$1,190,931 |
$1,103,307 |
$1,163,774 |
7/31/24 |
$1,196,101 |
$1,129,077 |
$1,169,185 |
8/31/24 |
$1,202,696 |
$1,145,301 |
$1,174,577 |
9/30/24 |
$1,207,270 |
$1,160,636 |
$1,179,725 |
10/31/24 |
$1,212,140 |
$1,131,854 |
$1,184,817 |
11/30/24 |
$1,216,951 |
$1,143,821 |
$1,189,527 |
12/31/24 |
$1,221,824 |
$1,125,101 |
$1,194,204 |
1/31/25 |
$1,226,588 |
$1,131,070 |
$1,198,799 |
2/28/25 |
$1,230,881 |
$1,155,956 |
$1,202,884 |
3/31/25 |
$1,235,266 |
$1,156,391 |
$1,207,357 |
|
| Average Annual Return [Table Text Block] |
Class/Index Name |
1 Year |
5 Years |
10 Years |
I-3 |
5.17% |
3.09% |
2.14% |
Bloomberg U.S. Aggregate Index |
4.88% |
(0.40%) |
1.46% |
FTSE 3-Month Treasury Bill Index |
5.17% |
2.69% |
1.90% | |
| No Deduction of Taxes [Text Block] |
Returns shown do not reflect the deduction of taxes that a shareholder would pay on Fund distributions or the redemption of Fund shares.
|
| Performance Table Market Index Changed [Text Block] |
Differences in the Fund’s performance versus an index and related attribution information with respect to particular categories of securities or individual positions may be attributable, in part, to differences in the pricing methodologies used by the Fund and the index.
|
| Updated Performance Information Location [Text Block] |
For performance current to the most recent month-end, visit www.pimco.com/literature or via 888.87.PIMCO (888.877.4626).
|
| AssetsNet |
$ 2,035,965,000
|
| Holdings Count | Holding |
389
|
| Advisory Fees Paid, Amount |
$ 5,035,000
|
| InvestmentCompanyPortfolioTurnover |
86.00%
|
| Additional Fund Statistics [Text Block] |
Key Fund StatisticsFootnote Reference† (as of the end of the reporting period)
Total Net Assets |
$2,035,965 |
# of Portfolio Holdings |
389 |
Portfolio Turnover Rate |
86% |
Total Net Advisory Fees Paid During the Reporting Period |
$5,035 |
| Footnote |
Description |
Footnote† |
Dollar amounts displayed in 000's | |
| Holdings [Text Block] |
Security Type Breakdown (% of Net Asset Value)Footnote Reference*
Corporate Bonds & Notes |
56.0% |
Asset-Backed Securities |
20.5% |
U.S. Government Agencies |
9.1% |
Non-Agency Mortgage-Backed Securities |
5.3% |
Sovereign Issues |
4.8% |
Municipal Bonds & Notes |
1.1% |
Short-Term Instruments |
2.4% |
Affiliated Investments |
4.3% |
Financial Derivative Instruments |
0.1% |
Other Assets and Liabilities, Net |
(3.6%) |
Total |
100.0% |
| Footnote |
Description |
Footnote* |
% of Net Asset Value includes derivatives instruments, if any, valued at the value used for determining the Fund's net asset value. The notional exposure of such derivatives investments therefore may be greater than what is depicted. | |
| Material Fund Change [Text Block] |
|
| C000114208 |
|
| Shareholder Report [Line Items] |
|
| Fund Name |
PIMCO Short Asset Investment Fund
|
| Class Name |
Institutional Class
|
| Trading Symbol |
PAIDX
|
| Annual or Semi-Annual Statement [Text Block] |
This annual shareholder report contains important information about the PIMCO Short Asset Investment Fund (the "Fund") for the period of April 1, 2024 to March 31, 2025 (the "reporting period").
|
| Shareholder Report Annual or Semi-Annual |
Annual Shareholder Report
|
| Additional Information [Text Block] |
You can find additional information about the Fund at www.pimco.com/literature. You can also request this information by contacting us at 888.87.PIMCO (888.877.4626).
|
| Additional Information Phone Number |
888.87.PIMCO (888.877.4626)
|
| Expenses [Text Block] |
What were the Fund costs for the reporting period?(based on a hypothetical $10,000 investment)
Class Name |
Cost of a $10,000 investment |
Costs paid as a percentage of a $10,000 investment |
Institutional Class |
$40 |
0.39% | |
| Expenses Paid, Amount |
$ 40
|
| Expense Ratio, Percent |
0.39%
|
| Factors Affecting Performance [Text Block] |
How did the Fund perform during the reporting period and what affected its performance?The following affected performance (on a gross basis) during the reporting period: Holdings of investment grade corporate credit, particularly financials, contributed to relative performance versus the FTSE 3-Month Treasury Bill Index ("Index"), as investment grade corporate bonds had positive total returns. Select holdings of securitized credit, particularly asset-backed securities (“ABS”) and collateralized loan obligations (“CLO”) contributed to relative performance versus the Index, as carry contributions from ABS offset detractions from spreads widening and CLO spreads tightened. Overweight exposure to U.S. duration in the 1-year part of the curve contributed to relative performance versus the Index, as interest rates fell. There were no material detractors for this Fund.
|
| Performance Past Does Not Indicate Future [Text] |
Performance quoted represents past performance. Past performance is not a guarantee or a reliable indicator of future results.
|
| Line Graph [Table Text Block] |

|
Institutional Class |
Bloomberg U.S. Aggregate Index |
FTSE 3-Month Treasury Bill Index |
3/31/15 |
$1,000,000 |
$1,000,000 |
$1,000,000 |
4/30/15 |
$1,001,668 |
$996,412 |
$1,000,016 |
5/31/15 |
$1,002,331 |
$994,012 |
$1,000,030 |
6/30/15 |
$1,003,116 |
$983,174 |
$1,000,041 |
7/31/15 |
$1,003,869 |
$990,008 |
$1,000,050 |
8/31/15 |
$1,003,519 |
$988,586 |
$1,000,075 |
9/30/15 |
$1,002,280 |
$995,273 |
$1,000,101 |
10/31/15 |
$1,004,073 |
$995,439 |
$1,000,125 |
11/30/15 |
$1,004,910 |
$992,809 |
$1,000,152 |
12/31/15 |
$1,005,067 |
$989,601 |
$1,000,229 |
1/31/16 |
$1,004,897 |
$1,003,219 |
$1,000,354 |
2/29/16 |
$1,005,873 |
$1,010,335 |
$1,000,534 |
3/31/16 |
$1,007,886 |
$1,019,605 |
$1,000,767 |
4/30/16 |
$1,010,002 |
$1,023,519 |
$1,001,004 |
5/31/16 |
$1,012,051 |
$1,023,781 |
$1,001,216 |
6/30/16 |
$1,012,139 |
$1,042,177 |
$1,001,416 |
7/31/16 |
$1,013,231 |
$1,048,765 |
$1,001,638 |
8/31/16 |
$1,015,365 |
$1,047,566 |
$1,001,877 |
9/30/16 |
$1,016,678 |
$1,046,952 |
$1,002,116 |
10/31/16 |
$1,019,756 |
$1,038,944 |
$1,002,369 |
11/30/16 |
$1,020,909 |
$1,014,369 |
$1,002,627 |
12/31/16 |
$1,022,439 |
$1,015,800 |
$1,002,938 |
1/31/17 |
$1,024,690 |
$1,017,793 |
$1,003,311 |
2/28/17 |
$1,025,880 |
$1,024,634 |
$1,003,703 |
3/31/17 |
$1,027,174 |
$1,024,097 |
$1,004,153 |
4/30/17 |
$1,028,415 |
$1,032,000 |
$1,004,663 |
5/31/17 |
$1,029,727 |
$1,039,943 |
$1,005,272 |
6/30/17 |
$1,032,140 |
$1,038,896 |
$1,005,984 |
7/31/17 |
$1,033,412 |
$1,043,367 |
$1,006,794 |
8/31/17 |
$1,034,800 |
$1,052,726 |
$1,007,683 |
9/30/17 |
$1,037,248 |
$1,047,712 |
$1,008,552 |
10/31/17 |
$1,039,632 |
$1,048,319 |
$1,009,463 |
11/30/17 |
$1,041,048 |
$1,046,973 |
$1,010,364 |
12/31/17 |
$1,042,070 |
$1,051,778 |
$1,011,376 |
1/31/18 |
$1,044,560 |
$1,039,665 |
$1,012,488 |
2/28/18 |
$1,046,099 |
$1,029,809 |
$1,013,578 |
3/31/18 |
$1,046,849 |
$1,036,414 |
$1,014,900 |
4/30/18 |
$1,049,694 |
$1,028,705 |
$1,016,269 |
5/31/18 |
$1,050,611 |
$1,036,047 |
$1,017,787 |
6/30/18 |
$1,052,736 |
$1,034,773 |
$1,019,327 |
7/31/18 |
$1,055,778 |
$1,035,019 |
$1,020,980 |
8/31/18 |
$1,058,098 |
$1,041,679 |
$1,022,701 |
9/30/18 |
$1,061,078 |
$1,034,971 |
$1,024,424 |
10/31/18 |
$1,062,208 |
$1,026,792 |
$1,026,288 |
11/30/18 |
$1,062,467 |
$1,032,921 |
$1,028,181 |
12/31/18 |
$1,062,696 |
$1,051,898 |
$1,030,216 |
1/31/19 |
$1,066,141 |
$1,063,068 |
$1,032,309 |
2/28/19 |
$1,069,636 |
$1,062,452 |
$1,034,221 |
3/31/19 |
$1,071,176 |
$1,082,853 |
$1,036,364 |
4/30/19 |
$1,073,697 |
$1,083,130 |
$1,038,451 |
5/31/19 |
$1,075,301 |
$1,102,358 |
$1,040,621 |
6/30/19 |
$1,077,575 |
$1,116,201 |
$1,042,721 |
7/31/19 |
$1,081,092 |
$1,118,657 |
$1,044,805 |
8/31/19 |
$1,083,593 |
$1,147,643 |
$1,046,791 |
9/30/19 |
$1,085,676 |
$1,141,531 |
$1,048,587 |
10/31/19 |
$1,087,839 |
$1,144,969 |
$1,050,362 |
11/30/19 |
$1,089,891 |
$1,144,386 |
$1,051,926 |
12/31/19 |
$1,090,785 |
$1,143,588 |
$1,053,424 |
1/31/20 |
$1,094,888 |
$1,165,596 |
$1,054,843 |
2/29/20 |
$1,096,561 |
$1,186,575 |
$1,056,175 |
3/31/20 |
$1,069,617 |
$1,179,592 |
$1,057,509 |
4/30/20 |
$1,084,125 |
$1,200,561 |
$1,058,376 |
5/31/20 |
$1,090,906 |
$1,206,151 |
$1,058,833 |
6/30/20 |
$1,097,411 |
$1,213,749 |
$1,058,937 |
7/31/20 |
$1,099,349 |
$1,231,878 |
$1,059,058 |
8/31/20 |
$1,101,012 |
$1,221,935 |
$1,059,176 |
9/30/20 |
$1,101,549 |
$1,221,265 |
$1,059,278 |
10/31/20 |
$1,102,047 |
$1,215,812 |
$1,059,369 |
11/30/20 |
$1,102,427 |
$1,227,742 |
$1,059,456 |
12/31/20 |
$1,103,944 |
$1,229,433 |
$1,059,538 |
1/31/21 |
$1,104,257 |
$1,220,618 |
$1,059,615 |
2/28/21 |
$1,104,578 |
$1,202,992 |
$1,059,676 |
3/31/21 |
$1,103,799 |
$1,187,971 |
$1,059,730 |
4/30/21 |
$1,104,194 |
$1,197,356 |
$1,059,766 |
5/31/21 |
$1,104,538 |
$1,201,268 |
$1,059,790 |
6/30/21 |
$1,104,883 |
$1,209,708 |
$1,059,806 |
7/31/21 |
$1,104,100 |
$1,223,233 |
$1,059,829 |
8/31/21 |
$1,104,405 |
$1,220,905 |
$1,059,862 |
9/30/21 |
$1,104,785 |
$1,210,334 |
$1,059,903 |
10/31/21 |
$1,104,106 |
$1,210,000 |
$1,059,941 |
11/30/21 |
$1,103,461 |
$1,213,580 |
$1,059,981 |
12/31/21 |
$1,102,920 |
$1,210,475 |
$1,060,025 |
1/31/22 |
$1,102,286 |
$1,184,396 |
$1,060,075 |
2/28/22 |
$1,099,535 |
$1,171,183 |
$1,060,155 |
3/31/22 |
$1,095,765 |
$1,138,645 |
$1,060,323 |
4/30/22 |
$1,093,321 |
$1,095,436 |
$1,060,623 |
5/31/22 |
$1,094,369 |
$1,102,499 |
$1,061,136 |
6/30/22 |
$1,090,185 |
$1,085,203 |
$1,061,852 |
7/31/22 |
$1,091,921 |
$1,111,719 |
$1,062,953 |
8/31/22 |
$1,095,964 |
$1,080,306 |
$1,064,534 |
9/30/22 |
$1,098,184 |
$1,033,630 |
$1,066,619 |
10/31/22 |
$1,098,273 |
$1,020,242 |
$1,069,261 |
11/30/22 |
$1,102,201 |
$1,057,762 |
$1,072,326 |
12/31/22 |
$1,109,203 |
$1,052,991 |
$1,075,945 |
1/31/23 |
$1,113,646 |
$1,085,385 |
$1,079,916 |
2/28/23 |
$1,119,573 |
$1,057,322 |
$1,083,683 |
3/31/23 |
$1,120,609 |
$1,084,180 |
$1,088,015 |
4/30/23 |
$1,125,773 |
$1,090,751 |
$1,092,346 |
5/31/23 |
$1,131,506 |
$1,078,874 |
$1,096,968 |
6/30/23 |
$1,137,656 |
$1,075,027 |
$1,101,639 |
7/31/23 |
$1,144,531 |
$1,074,277 |
$1,106,658 |
8/31/23 |
$1,149,567 |
$1,067,415 |
$1,111,804 |
9/30/23 |
$1,155,906 |
$1,040,290 |
$1,116,824 |
10/31/23 |
$1,160,989 |
$1,023,873 |
$1,122,085 |
11/30/23 |
$1,166,159 |
$1,070,241 |
$1,127,216 |
12/31/23 |
$1,171,995 |
$1,111,209 |
$1,132,519 |
1/31/24 |
$1,179,468 |
$1,108,157 |
$1,137,809 |
2/29/24 |
$1,184,526 |
$1,092,501 |
$1,142,751 |
3/31/24 |
$1,190,993 |
$1,102,589 |
$1,148,046 |
4/30/24 |
$1,197,431 |
$1,074,739 |
$1,153,200 |
5/31/24 |
$1,203,143 |
$1,092,959 |
$1,158,559 |
6/30/24 |
$1,208,075 |
$1,103,307 |
$1,163,774 |
7/31/24 |
$1,213,463 |
$1,129,077 |
$1,169,185 |
8/31/24 |
$1,220,302 |
$1,145,301 |
$1,174,577 |
9/30/24 |
$1,225,071 |
$1,160,636 |
$1,179,725 |
10/31/24 |
$1,230,151 |
$1,131,854 |
$1,184,817 |
11/30/24 |
$1,235,192 |
$1,143,821 |
$1,189,527 |
12/31/24 |
$1,240,288 |
$1,125,101 |
$1,194,204 |
1/31/25 |
$1,245,274 |
$1,131,070 |
$1,198,799 |
2/28/25 |
$1,249,767 |
$1,155,956 |
$1,202,884 |
3/31/25 |
$1,254,359 |
$1,156,391 |
$1,207,357 |
|
| Average Annual Return [Table Text Block] |
Class/Index Name |
1 Year |
5 Years |
10 Years |
Institutional Class |
5.32% |
3.24% |
2.29% |
Bloomberg U.S. Aggregate Index |
4.88% |
(0.40%) |
1.46% |
FTSE 3-Month Treasury Bill Index |
5.17% |
2.69% |
1.90% | |
| No Deduction of Taxes [Text Block] |
Returns shown do not reflect the deduction of taxes that a shareholder would pay on Fund distributions or the redemption of Fund shares.
|
| Performance Table Market Index Changed [Text Block] |
Differences in the Fund’s performance versus an index and related attribution information with respect to particular categories of securities or individual positions may be attributable, in part, to differences in the pricing methodologies used by the Fund and the index.
|
| Updated Performance Information Location [Text Block] |
For performance current to the most recent month-end, visit www.pimco.com/literature or via 888.87.PIMCO (888.877.4626).
|
| AssetsNet |
$ 2,035,965,000
|
| Holdings Count | Holding |
389
|
| Advisory Fees Paid, Amount |
$ 5,035,000
|
| InvestmentCompanyPortfolioTurnover |
86.00%
|
| Additional Fund Statistics [Text Block] |
Key Fund StatisticsFootnote Reference† (as of the end of the reporting period)
Total Net Assets |
$2,035,965 |
# of Portfolio Holdings |
389 |
Portfolio Turnover Rate |
86% |
Total Net Advisory Fees Paid During the Reporting Period |
$5,035 |
| Footnote |
Description |
Footnote† |
Dollar amounts displayed in 000's | |
| Holdings [Text Block] |
Security Type Breakdown (% of Net Asset Value)Footnote Reference*
Corporate Bonds & Notes |
56.0% |
Asset-Backed Securities |
20.5% |
U.S. Government Agencies |
9.1% |
Non-Agency Mortgage-Backed Securities |
5.3% |
Sovereign Issues |
4.8% |
Municipal Bonds & Notes |
1.1% |
Short-Term Instruments |
2.4% |
Affiliated Investments |
4.3% |
Financial Derivative Instruments |
0.1% |
Other Assets and Liabilities, Net |
(3.6%) |
Total |
100.0% |
| Footnote |
Description |
Footnote* |
% of Net Asset Value includes derivatives instruments, if any, valued at the value used for determining the Fund's net asset value. The notional exposure of such derivatives investments therefore may be greater than what is depicted. | |
| Material Fund Change [Text Block] |
|
| C000166287 |
|
| Shareholder Report [Line Items] |
|
| Fund Name |
PIMCO Short Asset Investment Fund
|
| Class Name |
Class M
|
| Trading Symbol |
PAMSX
|
| Annual or Semi-Annual Statement [Text Block] |
This annual shareholder report contains important information about the PIMCO Short Asset Investment Fund (the "Fund") for the period of April 1, 2024 to March 31, 2025 (the "reporting period").
|
| Shareholder Report Annual or Semi-Annual |
Annual Shareholder Report
|
| Additional Information [Text Block] |
You can find additional information about the Fund at www.pimco.com/literature. You can also request this information by contacting us at 888.87.PIMCO (888.877.4626).
|
| Additional Information Phone Number |
888.87.PIMCO (888.877.4626)
|
| Expenses [Text Block] |
What were the Fund costs for the reporting period?(based on a hypothetical $10,000 investment)
Class Name |
Cost of a $10,000 investment |
Costs paid as a percentage of a $10,000 investment |
Class M |
$40 |
0.39% | |
| Expenses Paid, Amount |
$ 40
|
| Expense Ratio, Percent |
0.39%
|
| Factors Affecting Performance [Text Block] |
How did the Fund perform during the reporting period and what affected its performance?The following affected performance (on a gross basis) during the reporting period: Holdings of investment grade corporate credit, particularly financials, contributed to relative performance versus the FTSE 3-Month Treasury Bill Index ("Index"), as investment grade corporate bonds had positive total returns. Select holdings of securitized credit, particularly asset-backed securities (“ABS”) and collateralized loan obligations (“CLO”) contributed to relative performance versus the Index, as carry contributions from ABS offset detractions from spreads widening and CLO spreads tightened. Overweight exposure to U.S. duration in the 1-year part of the curve contributed to relative performance versus the Index, as interest rates fell. There were no material detractors for this Fund.
|
| Performance Past Does Not Indicate Future [Text] |
Performance quoted represents past performance. Past performance is not a guarantee or a reliable indicator of future results.
|
| Line Graph [Table Text Block] |
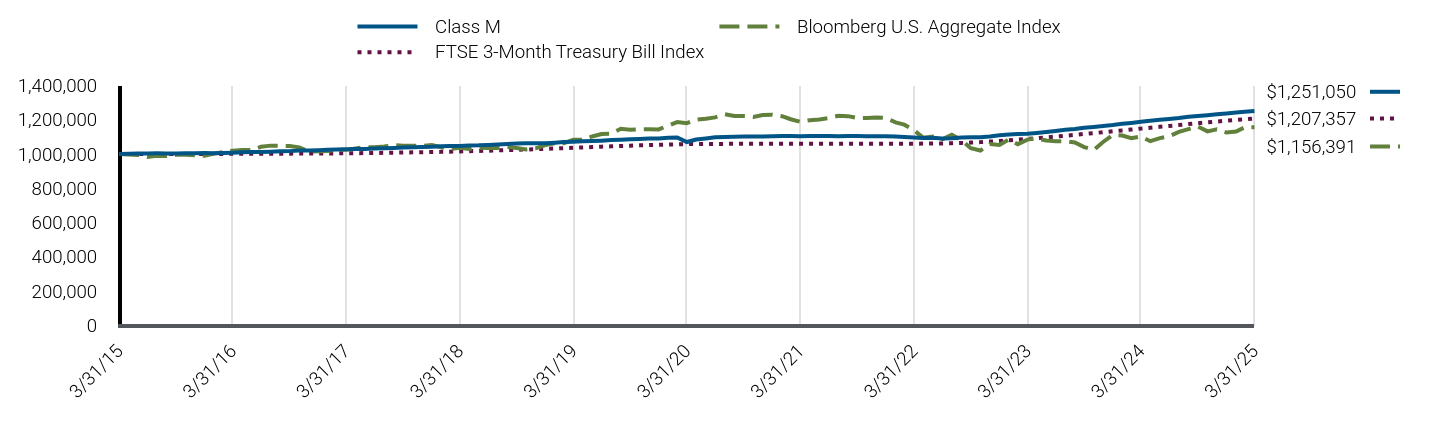
|
Class M |
Bloomberg U.S. Aggregate Index |
FTSE 3-Month Treasury Bill Index |
3/31/15 |
$1,000,000 |
$1,000,000 |
$1,000,000 |
4/30/15 |
$1,001,668 |
$996,412 |
$1,000,016 |
5/31/15 |
$1,002,331 |
$994,012 |
$1,000,030 |
6/30/15 |
$1,003,116 |
$983,174 |
$1,000,041 |
7/31/15 |
$1,003,869 |
$990,008 |
$1,000,050 |
8/31/15 |
$1,003,519 |
$988,586 |
$1,000,075 |
9/30/15 |
$1,002,280 |
$995,273 |
$1,000,101 |
10/31/15 |
$1,004,073 |
$995,439 |
$1,000,125 |
11/30/15 |
$1,004,910 |
$992,809 |
$1,000,152 |
12/31/15 |
$1,005,070 |
$989,601 |
$1,000,229 |
1/31/16 |
$1,004,917 |
$1,003,219 |
$1,000,354 |
2/29/16 |
$1,005,891 |
$1,010,335 |
$1,000,534 |
3/31/16 |
$1,007,899 |
$1,019,605 |
$1,000,767 |
4/30/16 |
$1,009,987 |
$1,023,519 |
$1,001,004 |
5/31/16 |
$1,012,057 |
$1,023,781 |
$1,001,216 |
6/30/16 |
$1,012,161 |
$1,042,177 |
$1,001,416 |
7/31/16 |
$1,013,250 |
$1,048,765 |
$1,001,638 |
8/31/16 |
$1,015,389 |
$1,047,566 |
$1,001,877 |
9/30/16 |
$1,016,732 |
$1,046,952 |
$1,002,116 |
10/31/16 |
$1,019,801 |
$1,038,944 |
$1,002,369 |
11/30/16 |
$1,020,941 |
$1,014,369 |
$1,002,627 |
12/31/16 |
$1,022,469 |
$1,015,800 |
$1,002,938 |
1/31/17 |
$1,024,719 |
$1,017,793 |
$1,003,311 |
2/28/17 |
$1,025,891 |
$1,024,634 |
$1,003,703 |
3/31/17 |
$1,027,189 |
$1,024,097 |
$1,004,153 |
4/30/17 |
$1,028,415 |
$1,032,000 |
$1,004,663 |
5/31/17 |
$1,029,743 |
$1,039,943 |
$1,005,272 |
6/30/17 |
$1,032,165 |
$1,038,896 |
$1,005,984 |
7/31/17 |
$1,033,447 |
$1,043,367 |
$1,006,794 |
8/31/17 |
$1,034,853 |
$1,052,726 |
$1,007,683 |
9/30/17 |
$1,037,298 |
$1,047,712 |
$1,008,552 |
10/31/17 |
$1,039,677 |
$1,048,319 |
$1,009,463 |
11/30/17 |
$1,041,094 |
$1,046,973 |
$1,010,364 |
12/31/17 |
$1,042,123 |
$1,051,778 |
$1,011,376 |
1/31/18 |
$1,044,621 |
$1,039,665 |
$1,012,488 |
2/28/18 |
$1,046,165 |
$1,029,809 |
$1,013,578 |
3/31/18 |
$1,047,012 |
$1,036,414 |
$1,014,900 |
4/30/18 |
$1,049,859 |
$1,028,705 |
$1,016,269 |
5/31/18 |
$1,050,770 |
$1,036,047 |
$1,017,787 |
6/30/18 |
$1,052,895 |
$1,034,773 |
$1,019,327 |
7/31/18 |
$1,055,937 |
$1,035,019 |
$1,020,980 |
8/31/18 |
$1,058,257 |
$1,041,679 |
$1,022,701 |
9/30/18 |
$1,061,237 |
$1,034,971 |
$1,024,424 |
10/31/18 |
$1,062,367 |
$1,026,792 |
$1,026,288 |
11/30/18 |
$1,062,626 |
$1,032,921 |
$1,028,181 |
12/31/18 |
$1,062,855 |
$1,051,898 |
$1,030,216 |
1/31/19 |
$1,066,300 |
$1,063,068 |
$1,032,309 |
2/28/19 |
$1,069,796 |
$1,062,452 |
$1,034,221 |
3/31/19 |
$1,071,337 |
$1,082,853 |
$1,036,364 |
4/30/19 |
$1,073,858 |
$1,083,130 |
$1,038,451 |
5/31/19 |
$1,075,463 |
$1,102,358 |
$1,040,621 |
6/30/19 |
$1,077,738 |
$1,116,201 |
$1,042,721 |
7/31/19 |
$1,081,255 |
$1,118,657 |
$1,044,805 |
8/31/19 |
$1,083,756 |
$1,147,643 |
$1,046,791 |
9/30/19 |
$1,085,840 |
$1,141,531 |
$1,048,587 |
10/31/19 |
$1,088,003 |
$1,144,969 |
$1,050,362 |
11/30/19 |
$1,090,055 |
$1,144,386 |
$1,051,926 |
12/31/19 |
$1,090,950 |
$1,143,588 |
$1,053,424 |
1/31/20 |
$1,095,054 |
$1,165,596 |
$1,054,843 |
2/29/20 |
$1,096,727 |
$1,186,575 |
$1,056,175 |
3/31/20 |
$1,069,783 |
$1,179,592 |
$1,057,509 |
4/30/20 |
$1,084,293 |
$1,200,561 |
$1,058,376 |
5/31/20 |
$1,091,075 |
$1,206,151 |
$1,058,833 |
6/30/20 |
$1,097,581 |
$1,213,749 |
$1,058,937 |
7/31/20 |
$1,099,519 |
$1,231,878 |
$1,059,058 |
8/31/20 |
$1,101,182 |
$1,221,935 |
$1,059,176 |
9/30/20 |
$1,101,719 |
$1,221,265 |
$1,059,278 |
10/31/20 |
$1,102,217 |
$1,215,812 |
$1,059,369 |
11/30/20 |
$1,102,597 |
$1,227,742 |
$1,059,456 |
12/31/20 |
$1,104,115 |
$1,229,433 |
$1,059,538 |
1/31/21 |
$1,104,428 |
$1,220,618 |
$1,059,615 |
2/28/21 |
$1,104,747 |
$1,202,992 |
$1,059,676 |
3/31/21 |
$1,103,969 |
$1,187,971 |
$1,059,730 |
4/30/21 |
$1,104,364 |
$1,197,356 |
$1,059,766 |
5/31/21 |
$1,104,708 |
$1,201,268 |
$1,059,790 |
6/30/21 |
$1,105,053 |
$1,209,708 |
$1,059,806 |
7/31/21 |
$1,104,271 |
$1,223,233 |
$1,059,829 |
8/31/21 |
$1,104,575 |
$1,220,905 |
$1,059,862 |
9/30/21 |
$1,104,956 |
$1,210,334 |
$1,059,903 |
10/31/21 |
$1,104,279 |
$1,210,000 |
$1,059,941 |
11/30/21 |
$1,103,632 |
$1,213,580 |
$1,059,981 |
12/31/21 |
$1,103,093 |
$1,210,475 |
$1,060,025 |
1/31/22 |
$1,102,458 |
$1,184,396 |
$1,060,075 |
2/28/22 |
$1,099,706 |
$1,171,183 |
$1,060,155 |
3/31/22 |
$1,095,937 |
$1,138,645 |
$1,060,323 |
4/30/22 |
$1,093,492 |
$1,095,436 |
$1,060,623 |
5/31/22 |
$1,094,540 |
$1,102,499 |
$1,061,136 |
6/30/22 |
$1,090,355 |
$1,085,203 |
$1,061,852 |
7/31/22 |
$1,092,092 |
$1,111,719 |
$1,062,953 |
8/31/22 |
$1,096,137 |
$1,080,306 |
$1,064,534 |
9/30/22 |
$1,098,358 |
$1,033,630 |
$1,066,619 |
10/31/22 |
$1,098,446 |
$1,020,242 |
$1,069,261 |
11/30/22 |
$1,102,376 |
$1,057,762 |
$1,072,326 |
12/31/22 |
$1,109,379 |
$1,052,991 |
$1,075,945 |
1/31/23 |
$1,113,700 |
$1,085,385 |
$1,079,916 |
2/28/23 |
$1,116,621 |
$1,057,322 |
$1,083,683 |
3/31/23 |
$1,117,669 |
$1,084,180 |
$1,088,015 |
4/30/23 |
$1,122,815 |
$1,090,751 |
$1,092,346 |
5/31/23 |
$1,128,522 |
$1,078,874 |
$1,096,968 |
6/30/23 |
$1,134,635 |
$1,075,027 |
$1,101,639 |
7/31/23 |
$1,141,482 |
$1,074,277 |
$1,106,658 |
8/31/23 |
$1,146,497 |
$1,067,415 |
$1,111,804 |
9/30/23 |
$1,152,819 |
$1,040,290 |
$1,116,824 |
10/31/23 |
$1,157,881 |
$1,023,873 |
$1,122,085 |
11/30/23 |
$1,163,030 |
$1,070,241 |
$1,127,216 |
12/31/23 |
$1,168,839 |
$1,111,209 |
$1,132,519 |
1/31/24 |
$1,176,277 |
$1,108,157 |
$1,137,809 |
2/29/24 |
$1,181,319 |
$1,092,501 |
$1,142,751 |
3/31/24 |
$1,187,765 |
$1,102,589 |
$1,148,046 |
4/30/24 |
$1,194,184 |
$1,074,739 |
$1,153,200 |
5/31/24 |
$1,199,885 |
$1,092,959 |
$1,158,559 |
6/30/24 |
$1,204,803 |
$1,103,307 |
$1,163,774 |
7/31/24 |
$1,210,167 |
$1,129,077 |
$1,169,185 |
8/31/24 |
$1,216,993 |
$1,145,301 |
$1,174,577 |
9/30/24 |
$1,221,752 |
$1,160,636 |
$1,179,725 |
10/31/24 |
$1,226,837 |
$1,131,854 |
$1,184,817 |
11/30/24 |
$1,231,875 |
$1,143,821 |
$1,189,527 |
12/31/24 |
$1,236,968 |
$1,125,101 |
$1,194,204 |
1/31/25 |
$1,241,953 |
$1,131,070 |
$1,198,799 |
2/28/25 |
$1,246,451 |
$1,155,956 |
$1,202,884 |
3/31/25 |
$1,251,050 |
$1,156,391 |
$1,207,357 |
|
| Average Annual Return [Table Text Block] |
Class/Index Name |
1 Year |
5 Years |
10 Years |
Class M |
5.33% |
3.18% |
2.27% |
Bloomberg U.S. Aggregate Index |
4.88% |
(0.40%) |
1.46% |
FTSE 3-Month Treasury Bill Index |
5.17% |
2.69% |
1.90% | |
| No Deduction of Taxes [Text Block] |
Returns shown do not reflect the deduction of taxes that a shareholder would pay on Fund distributions or the redemption of Fund shares.
|
| Performance Table Market Index Changed [Text Block] |
Differences in the Fund’s performance versus an index and related attribution information with respect to particular categories of securities or individual positions may be attributable, in part, to differences in the pricing methodologies used by the Fund and the index.
|
| Updated Performance Information Location [Text Block] |
For performance current to the most recent month-end, visit www.pimco.com/literature or via 888.87.PIMCO (888.877.4626).
|
| AssetsNet |
$ 2,035,965,000
|
| Holdings Count | Holding |
389
|
| Advisory Fees Paid, Amount |
$ 5,035,000
|
| InvestmentCompanyPortfolioTurnover |
86.00%
|
| Additional Fund Statistics [Text Block] |
Key Fund StatisticsFootnote Reference† (as of the end of the reporting period)
Total Net Assets |
$2,035,965 |
# of Portfolio Holdings |
389 |
Portfolio Turnover Rate |
86% |
Total Net Advisory Fees Paid During the Reporting Period |
$5,035 |
| Footnote |
Description |
Footnote† |
Dollar amounts displayed in 000's | |
| Holdings [Text Block] |
Security Type Breakdown (% of Net Asset Value)Footnote Reference*
Corporate Bonds & Notes |
56.0% |
Asset-Backed Securities |
20.5% |
U.S. Government Agencies |
9.1% |
Non-Agency Mortgage-Backed Securities |
5.3% |
Sovereign Issues |
4.8% |
Municipal Bonds & Notes |
1.1% |
Short-Term Instruments |
2.4% |
Affiliated Investments |
4.3% |
Financial Derivative Instruments |
0.1% |
Other Assets and Liabilities, Net |
(3.6%) |
Total |
100.0% |
| Footnote |
Description |
Footnote* |
% of Net Asset Value includes derivatives instruments, if any, valued at the value used for determining the Fund's net asset value. The notional exposure of such derivatives investments therefore may be greater than what is depicted. | |
| Material Fund Change [Text Block] |
|
| C000114209 |
|
| Shareholder Report [Line Items] |
|
| Fund Name |
PIMCO Short Asset Investment Fund
|
| Class Name |
I-2
|
| Trading Symbol |
PAIPX
|
| Annual or Semi-Annual Statement [Text Block] |
This annual shareholder report contains important information about the PIMCO Short Asset Investment Fund (the "Fund") for the period of April 1, 2024 to March 31, 2025 (the "reporting period").
|
| Shareholder Report Annual or Semi-Annual |
Annual Shareholder Report
|
| Additional Information [Text Block] |
You can find additional information about the Fund at www.pimco.com/literature. You can also request this information by contacting us at 888.87.PIMCO (888.877.4626).
|
| Additional Information Phone Number |
888.87.PIMCO (888.877.4626)
|
| Expenses [Text Block] |
What were the Fund costs for the reporting period?(based on a hypothetical $10,000 investment)
Class Name |
Cost of a $10,000 investment |
Costs paid as a percentage of a $10,000 investment |
I-2 |
$50 |
0.49% | |
| Expenses Paid, Amount |
$ 50
|
| Expense Ratio, Percent |
0.49%
|
| Factors Affecting Performance [Text Block] |
How did the Fund perform during the reporting period and what affected its performance?The following affected performance (on a gross basis) during the reporting period: Holdings of investment grade corporate credit, particularly financials, contributed to relative performance versus the FTSE 3-Month Treasury Bill Index ("Index"), as investment grade corporate bonds had positive total returns. Select holdings of securitized credit, particularly asset-backed securities (“ABS”) and collateralized loan obligations (“CLO”) contributed to relative performance versus the Index, as carry contributions from ABS offset detractions from spreads widening and CLO spreads tightened. Overweight exposure to U.S. duration in the 1-year part of the curve contributed to relative performance versus the Index, as interest rates fell. There were no material detractors for this Fund.
|
| Performance Past Does Not Indicate Future [Text] |
Performance quoted represents past performance. Past performance is not a guarantee or a reliable indicator of future results.
|
| Line Graph [Table Text Block] |
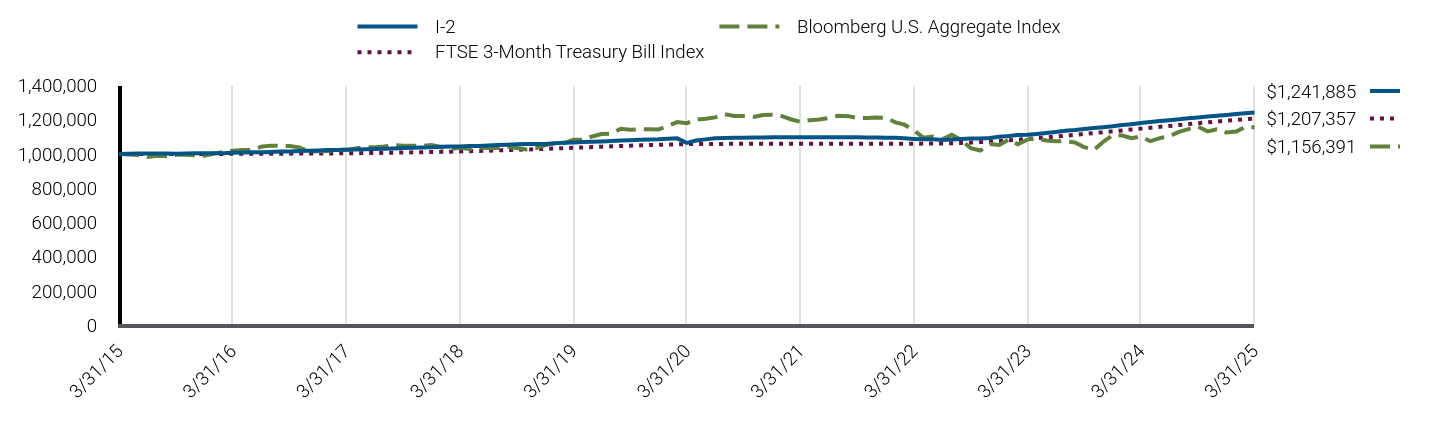
|
I-2 |
Bloomberg U.S. Aggregate Index |
FTSE 3-Month Treasury Bill Index |
3/31/15 |
$1,000,000 |
$1,000,000 |
$1,000,000 |
4/30/15 |
$1,001,584 |
$996,412 |
$1,000,016 |
5/31/15 |
$1,002,163 |
$994,012 |
$1,000,030 |
6/30/15 |
$1,002,867 |
$983,174 |
$1,000,041 |
7/31/15 |
$1,003,528 |
$990,008 |
$1,000,050 |
8/31/15 |
$1,003,095 |
$988,586 |
$1,000,075 |
9/30/15 |
$1,001,774 |
$995,273 |
$1,000,101 |
10/31/15 |
$1,003,465 |
$995,439 |
$1,000,125 |
11/30/15 |
$1,004,223 |
$992,809 |
$1,000,152 |
12/31/15 |
$1,004,286 |
$989,601 |
$1,000,229 |
1/31/16 |
$1,004,034 |
$1,003,219 |
$1,000,354 |
2/29/16 |
$1,004,927 |
$1,010,335 |
$1,000,534 |
3/31/16 |
$1,006,858 |
$1,019,605 |
$1,000,767 |
4/30/16 |
$1,008,885 |
$1,023,519 |
$1,001,004 |
5/31/16 |
$1,010,849 |
$1,023,781 |
$1,001,216 |
6/30/16 |
$1,010,854 |
$1,042,177 |
$1,001,416 |
7/31/16 |
$1,011,859 |
$1,048,765 |
$1,001,638 |
8/31/16 |
$1,013,904 |
$1,047,566 |
$1,001,877 |
9/30/16 |
$1,015,124 |
$1,046,952 |
$1,002,116 |
10/31/16 |
$1,018,115 |
$1,038,944 |
$1,002,369 |
11/30/16 |
$1,019,180 |
$1,014,369 |
$1,002,627 |
12/31/16 |
$1,020,616 |
$1,015,800 |
$1,002,938 |
1/31/17 |
$1,022,783 |
$1,017,793 |
$1,003,311 |
2/28/17 |
$1,023,890 |
$1,024,634 |
$1,003,703 |
3/31/17 |
$1,025,090 |
$1,024,097 |
$1,004,153 |
4/30/17 |
$1,026,251 |
$1,032,000 |
$1,004,663 |
5/31/17 |
$1,027,474 |
$1,039,943 |
$1,005,272 |
6/30/17 |
$1,029,791 |
$1,038,896 |
$1,005,984 |
7/31/17 |
$1,030,978 |
$1,043,367 |
$1,006,794 |
8/31/17 |
$1,032,275 |
$1,052,726 |
$1,007,683 |
9/30/17 |
$1,034,629 |
$1,047,712 |
$1,008,552 |
10/31/17 |
$1,036,921 |
$1,048,319 |
$1,009,463 |
11/30/17 |
$1,038,249 |
$1,046,973 |
$1,010,364 |
12/31/17 |
$1,039,177 |
$1,051,778 |
$1,011,376 |
1/31/18 |
$1,041,574 |
$1,039,665 |
$1,012,488 |
2/28/18 |
$1,043,027 |
$1,029,809 |
$1,013,578 |
3/31/18 |
$1,043,684 |
$1,036,414 |
$1,014,900 |
4/30/18 |
$1,046,438 |
$1,028,705 |
$1,016,269 |
5/31/18 |
$1,047,264 |
$1,036,047 |
$1,017,787 |
6/30/18 |
$1,049,293 |
$1,034,773 |
$1,019,327 |
7/31/18 |
$1,052,239 |
$1,035,019 |
$1,020,980 |
8/31/18 |
$1,054,452 |
$1,041,679 |
$1,022,701 |
9/30/18 |
$1,057,344 |
$1,034,971 |
$1,024,424 |
10/31/18 |
$1,058,381 |
$1,026,792 |
$1,026,288 |
11/30/18 |
$1,058,547 |
$1,032,921 |
$1,028,181 |
12/31/18 |
$1,058,688 |
$1,051,898 |
$1,030,216 |
1/31/19 |
$1,062,032 |
$1,063,068 |
$1,032,309 |
2/28/19 |
$1,065,432 |
$1,062,452 |
$1,034,221 |
3/31/19 |
$1,066,877 |
$1,082,853 |
$1,036,364 |
4/30/19 |
$1,069,299 |
$1,083,130 |
$1,038,451 |
5/31/19 |
$1,070,808 |
$1,102,358 |
$1,040,621 |
6/30/19 |
$1,072,991 |
$1,116,201 |
$1,042,721 |
7/31/19 |
$1,076,400 |
$1,118,657 |
$1,044,805 |
8/31/19 |
$1,078,792 |
$1,147,643 |
$1,046,791 |
9/30/19 |
$1,080,784 |
$1,141,531 |
$1,048,587 |
10/31/19 |
$1,082,845 |
$1,144,969 |
$1,050,362 |
11/30/19 |
$1,084,795 |
$1,144,386 |
$1,051,926 |
12/31/19 |
$1,085,593 |
$1,143,588 |
$1,053,424 |
1/31/20 |
$1,089,583 |
$1,165,596 |
$1,054,843 |
2/29/20 |
$1,091,164 |
$1,186,575 |
$1,056,175 |
3/31/20 |
$1,064,269 |
$1,179,592 |
$1,057,509 |
4/30/20 |
$1,078,617 |
$1,200,561 |
$1,058,376 |
5/31/20 |
$1,085,271 |
$1,206,151 |
$1,058,833 |
6/30/20 |
$1,091,653 |
$1,213,749 |
$1,058,937 |
7/31/20 |
$1,093,481 |
$1,231,878 |
$1,059,058 |
8/31/20 |
$1,095,048 |
$1,221,935 |
$1,059,176 |
9/30/20 |
$1,095,492 |
$1,221,265 |
$1,059,278 |
10/31/20 |
$1,095,891 |
$1,215,812 |
$1,059,369 |
11/30/20 |
$1,096,182 |
$1,227,742 |
$1,059,456 |
12/31/20 |
$1,097,588 |
$1,229,433 |
$1,059,538 |
1/31/21 |
$1,097,815 |
$1,220,618 |
$1,059,615 |
2/28/21 |
$1,098,049 |
$1,202,992 |
$1,059,676 |
3/31/21 |
$1,097,181 |
$1,187,971 |
$1,059,730 |
4/30/21 |
$1,097,478 |
$1,197,356 |
$1,059,766 |
5/31/21 |
$1,097,732 |
$1,201,268 |
$1,059,790 |
6/30/21 |
$1,097,985 |
$1,209,708 |
$1,059,806 |
7/31/21 |
$1,097,110 |
$1,223,233 |
$1,059,829 |
8/31/21 |
$1,097,323 |
$1,220,905 |
$1,059,862 |
9/30/21 |
$1,097,610 |
$1,210,334 |
$1,059,903 |
10/31/21 |
$1,096,843 |
$1,210,000 |
$1,059,941 |
11/30/21 |
$1,096,111 |
$1,213,580 |
$1,059,981 |
12/31/21 |
$1,095,476 |
$1,210,475 |
$1,060,025 |
1/31/22 |
$1,094,756 |
$1,184,396 |
$1,060,075 |
2/28/22 |
$1,091,942 |
$1,171,183 |
$1,060,155 |
3/31/22 |
$1,088,106 |
$1,138,645 |
$1,060,323 |
4/30/22 |
$1,085,587 |
$1,095,436 |
$1,060,623 |
5/31/22 |
$1,086,538 |
$1,102,499 |
$1,061,136 |
6/30/22 |
$1,082,294 |
$1,085,203 |
$1,061,852 |
7/31/22 |
$1,083,925 |
$1,111,719 |
$1,062,953 |
8/31/22 |
$1,087,849 |
$1,080,306 |
$1,064,534 |
9/30/22 |
$1,089,957 |
$1,033,630 |
$1,066,619 |
10/31/22 |
$1,089,958 |
$1,020,242 |
$1,069,261 |
11/30/22 |
$1,093,768 |
$1,057,762 |
$1,072,326 |
12/31/22 |
$1,100,616 |
$1,052,991 |
$1,075,945 |
1/31/23 |
$1,104,937 |
$1,085,385 |
$1,079,916 |
2/28/23 |
$1,110,730 |
$1,057,322 |
$1,083,683 |
3/31/23 |
$1,111,658 |
$1,084,180 |
$1,088,015 |
4/30/23 |
$1,116,695 |
$1,090,751 |
$1,092,346 |
5/31/23 |
$1,122,287 |
$1,078,874 |
$1,096,968 |
6/30/23 |
$1,128,288 |
$1,075,027 |
$1,101,639 |
7/31/23 |
$1,135,018 |
$1,074,277 |
$1,106,658 |
8/31/23 |
$1,139,915 |
$1,067,415 |
$1,111,804 |
9/30/23 |
$1,146,105 |
$1,040,290 |
$1,116,824 |
10/31/23 |
$1,151,053 |
$1,023,873 |
$1,122,085 |
11/30/23 |
$1,156,083 |
$1,070,241 |
$1,127,216 |
12/31/23 |
$1,161,768 |
$1,111,209 |
$1,132,519 |
1/31/24 |
$1,169,080 |
$1,108,157 |
$1,137,809 |
2/29/24 |
$1,174,000 |
$1,092,501 |
$1,142,751 |
3/31/24 |
$1,180,311 |
$1,102,589 |
$1,148,046 |
4/30/24 |
$1,186,593 |
$1,074,739 |
$1,153,200 |
5/31/24 |
$1,192,145 |
$1,092,959 |
$1,158,559 |
6/30/24 |
$1,196,940 |
$1,103,307 |
$1,163,774 |
7/31/24 |
$1,202,176 |
$1,129,077 |
$1,169,185 |
8/31/24 |
$1,208,844 |
$1,145,301 |
$1,174,577 |
9/30/24 |
$1,213,476 |
$1,160,636 |
$1,179,725 |
10/31/24 |
$1,218,413 |
$1,131,854 |
$1,184,817 |
11/30/24 |
$1,223,303 |
$1,143,821 |
$1,189,527 |
12/31/24 |
$1,228,248 |
$1,125,101 |
$1,194,204 |
1/31/25 |
$1,233,078 |
$1,131,070 |
$1,198,799 |
2/28/25 |
$1,237,432 |
$1,155,956 |
$1,202,884 |
3/31/25 |
$1,241,885 |
$1,156,391 |
$1,207,357 |
|
| Average Annual Return [Table Text Block] |
Class/Index Name |
1 Year |
5 Years |
10 Years |
I-2 |
5.22% |
3.13% |
2.19% |
Bloomberg U.S. Aggregate Index |
4.88% |
(0.40%) |
1.46% |
FTSE 3-Month Treasury Bill Index |
5.17% |
2.69% |
1.90% | |
| No Deduction of Taxes [Text Block] |
Returns shown do not reflect the deduction of taxes that a shareholder would pay on Fund distributions or the redemption of Fund shares.
|
| Performance Table Market Index Changed [Text Block] |
Differences in the Fund’s performance versus an index and related attribution information with respect to particular categories of securities or individual positions may be attributable, in part, to differences in the pricing methodologies used by the Fund and the index.
|
| Updated Performance Information Location [Text Block] |
For performance current to the most recent month-end, visit www.pimco.com/literature or via 888.87.PIMCO (888.877.4626).
|
| AssetsNet |
$ 2,035,965,000
|
| Holdings Count | Holding |
389
|
| Advisory Fees Paid, Amount |
$ 5,035,000
|
| InvestmentCompanyPortfolioTurnover |
86.00%
|
| Additional Fund Statistics [Text Block] |
Key Fund StatisticsFootnote Reference† (as of the end of the reporting period)
Total Net Assets |
$2,035,965 |
# of Portfolio Holdings |
389 |
Portfolio Turnover Rate |
86% |
Total Net Advisory Fees Paid During the Reporting Period |
$5,035 |
| Footnote |
Description |
Footnote† |
Dollar amounts displayed in 000's | |
| Holdings [Text Block] |
Security Type Breakdown (% of Net Asset Value)Footnote Reference*
Corporate Bonds & Notes |
56.0% |
Asset-Backed Securities |
20.5% |
U.S. Government Agencies |
9.1% |
Non-Agency Mortgage-Backed Securities |
5.3% |
Sovereign Issues |
4.8% |
Municipal Bonds & Notes |
1.1% |
Short-Term Instruments |
2.4% |
Affiliated Investments |
4.3% |
Financial Derivative Instruments |
0.1% |
Other Assets and Liabilities, Net |
(3.6%) |
Total |
100.0% |
| Footnote |
Description |
Footnote* |
% of Net Asset Value includes derivatives instruments, if any, valued at the value used for determining the Fund's net asset value. The notional exposure of such derivatives investments therefore may be greater than what is depicted. | |
| Material Fund Change [Text Block] |
|
| C000026625 |
|
| Shareholder Report [Line Items] |
|
| Fund Name |
PIMCO Short-Term Fund
|
| Class Name |
Class A
|
| Trading Symbol |
PSHAX
|
| Annual or Semi-Annual Statement [Text Block] |
This annual shareholder report contains important information about the PIMCO Short-Term Fund (the "Fund") for the period of April 1, 2024 to March 31, 2025 (the "reporting period").
|
| Shareholder Report Annual or Semi-Annual |
Annual Shareholder Report
|
| Additional Information [Text Block] |
You can find additional information about the Fund at www.pimco.com/literature. You can also request this information by contacting us at 888.87.PIMCO (888.877.4626).
|
| Additional Information Phone Number |
888.87.PIMCO (888.877.4626)
|
| Expenses [Text Block] |
What were the Fund costs for the reporting period?(based on a hypothetical $10,000 investment)
Class Name |
Cost of a $10,000 investment |
Costs paid as a percentage of a $10,000 investment |
Class A |
$76 |
0.74% | |
| Expenses Paid, Amount |
$ 76
|
| Expense Ratio, Percent |
0.74%
|
| Factors Affecting Performance [Text Block] |
How did the Fund perform during the reporting period and what affected its performance?The following affected performance (on a gross basis) during the reporting period: Select holdings of securitized credit, particularly asset-based securities (“ABS”) and collateralized loan obligations (“CLO”) contributed to relative performance versus the FTSE 3-Month Treasury Bill Index ("Index"), as coupon payments on ABS investments offset spread widening, and CLO spreads tightened. Holdings of investment grade corporate credit, particularly financials, contributed to relative performance versus the Index, as investment grade corporate bonds had positive total returns. Overweight exposure to U.S. duration in the 1-year part of the curve contributed to relative performance versus the Index, as interest rates fell. Overweight exposure to U.K. duration in the 5-year part of the curve detracted from relative performance versus the Index, as interest rates rose. There were no other material detractors for this Fund.
|
| Performance Past Does Not Indicate Future [Text] |
Performance quoted represents past performance. Past performance is not a guarantee or a reliable indicator of future results.
|
| Line Graph [Table Text Block] |
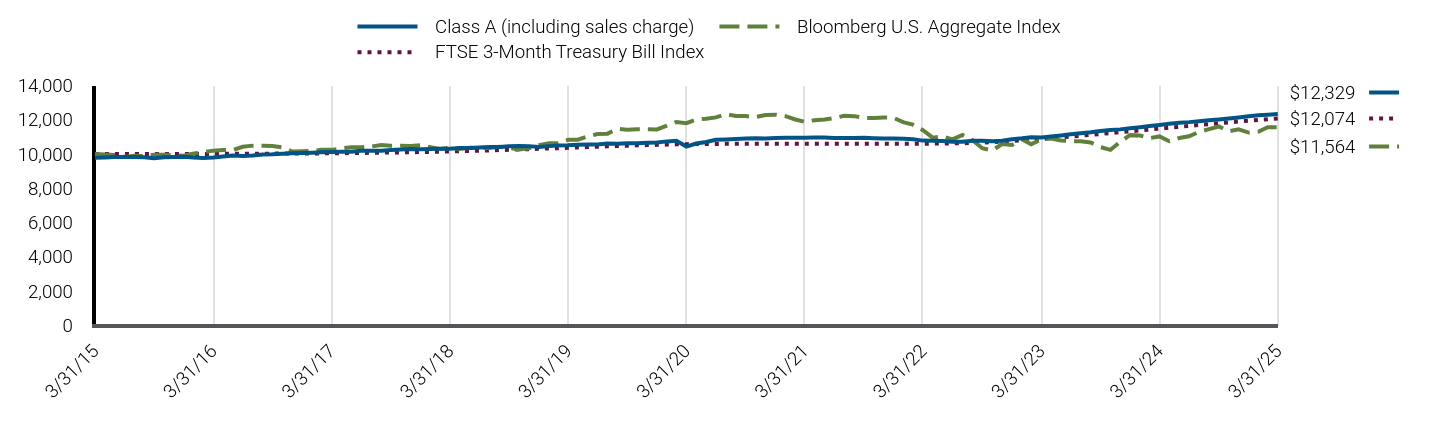
|
Class A (including sales charge) |
Bloomberg U.S. Aggregate Index |
FTSE 3-Month Treasury Bill Index |
3/31/15 |
$9,775 |
$10,000 |
$10,000 |
4/30/15 |
$9,791 |
$9,964 |
$10,000 |
5/31/15 |
$9,819 |
$9,940 |
$10,000 |
6/30/15 |
$9,827 |
$9,832 |
$10,000 |
7/31/15 |
$9,826 |
$9,900 |
$10,001 |
8/31/15 |
$9,805 |
$9,886 |
$10,001 |
9/30/15 |
$9,755 |
$9,953 |
$10,001 |
10/31/15 |
$9,815 |
$9,954 |
$10,001 |
11/30/15 |
$9,827 |
$9,928 |
$10,002 |
12/31/15 |
$9,833 |
$9,896 |
$10,002 |
1/31/16 |
$9,794 |
$10,032 |
$10,004 |
2/29/16 |
$9,764 |
$10,103 |
$10,005 |
3/31/16 |
$9,797 |
$10,196 |
$10,008 |
4/30/16 |
$9,851 |
$10,235 |
$10,010 |
5/31/16 |
$9,914 |
$10,238 |
$10,012 |
6/30/16 |
$9,877 |
$10,422 |
$10,014 |
7/31/16 |
$9,912 |
$10,488 |
$10,016 |
8/31/16 |
$9,969 |
$10,476 |
$10,019 |
9/30/16 |
$9,981 |
$10,470 |
$10,021 |
10/31/16 |
$10,014 |
$10,389 |
$10,024 |
11/30/16 |
$10,039 |
$10,144 |
$10,026 |
12/31/16 |
$10,061 |
$10,158 |
$10,029 |
1/31/17 |
$10,079 |
$10,178 |
$10,033 |
2/28/17 |
$10,100 |
$10,246 |
$10,037 |
3/31/17 |
$10,113 |
$10,241 |
$10,042 |
4/30/17 |
$10,135 |
$10,320 |
$10,047 |
5/31/17 |
$10,137 |
$10,399 |
$10,053 |
6/30/17 |
$10,182 |
$10,389 |
$10,060 |
7/31/17 |
$10,183 |
$10,434 |
$10,068 |
8/31/17 |
$10,185 |
$10,527 |
$10,077 |
9/30/17 |
$10,229 |
$10,477 |
$10,086 |
10/31/17 |
$10,263 |
$10,483 |
$10,095 |
11/30/17 |
$10,288 |
$10,470 |
$10,104 |
12/31/17 |
$10,280 |
$10,518 |
$10,114 |
1/31/18 |
$10,292 |
$10,397 |
$10,125 |
2/28/18 |
$10,305 |
$10,298 |
$10,136 |
3/31/18 |
$10,300 |
$10,364 |
$10,149 |
4/30/18 |
$10,347 |
$10,287 |
$10,163 |
5/31/18 |
$10,355 |
$10,360 |
$10,178 |
6/30/18 |
$10,374 |
$10,348 |
$10,193 |
7/31/18 |
$10,402 |
$10,350 |
$10,210 |
8/31/18 |
$10,413 |
$10,417 |
$10,227 |
9/30/18 |
$10,451 |
$10,350 |
$10,244 |
10/31/18 |
$10,470 |
$10,268 |
$10,263 |
11/30/18 |
$10,459 |
$10,329 |
$10,282 |
12/31/18 |
$10,408 |
$10,519 |
$10,302 |
1/31/19 |
$10,459 |
$10,631 |
$10,323 |
2/28/19 |
$10,500 |
$10,625 |
$10,342 |
3/31/19 |
$10,512 |
$10,829 |
$10,364 |
4/30/19 |
$10,546 |
$10,831 |
$10,385 |
5/31/19 |
$10,548 |
$11,024 |
$10,406 |
6/30/19 |
$10,557 |
$11,162 |
$10,427 |
7/31/19 |
$10,610 |
$11,187 |
$10,448 |
8/31/19 |
$10,599 |
$11,476 |
$10,468 |
9/30/19 |
$10,628 |
$11,415 |
$10,486 |
10/31/19 |
$10,634 |
$11,450 |
$10,504 |
11/30/19 |
$10,653 |
$11,444 |
$10,519 |
12/31/19 |
$10,665 |
$11,436 |
$10,534 |
1/31/20 |
$10,736 |
$11,656 |
$10,548 |
2/29/20 |
$10,773 |
$11,866 |
$10,562 |
3/31/20 |
$10,435 |
$11,796 |
$10,575 |
4/30/20 |
$10,613 |
$12,006 |
$10,584 |
5/31/20 |
$10,703 |
$12,062 |
$10,588 |
6/30/20 |
$10,833 |
$12,137 |
$10,589 |
7/31/20 |
$10,852 |
$12,319 |
$10,591 |
8/31/20 |
$10,870 |
$12,219 |
$10,592 |
9/30/20 |
$10,898 |
$12,213 |
$10,593 |
10/31/20 |
$10,926 |
$12,158 |
$10,594 |
11/30/20 |
$10,908 |
$12,277 |
$10,595 |
12/31/20 |
$10,930 |
$12,294 |
$10,595 |
1/31/21 |
$10,955 |
$12,206 |
$10,596 |
2/28/21 |
$10,947 |
$12,030 |
$10,597 |
3/31/21 |
$10,951 |
$11,880 |
$10,597 |
4/30/21 |
$10,956 |
$11,974 |
$10,598 |
5/31/21 |
$10,959 |
$12,013 |
$10,598 |
6/30/21 |
$10,940 |
$12,097 |
$10,598 |
7/31/21 |
$10,932 |
$12,232 |
$10,598 |
8/31/21 |
$10,935 |
$12,209 |
$10,599 |
9/30/21 |
$10,949 |
$12,103 |
$10,599 |
10/31/21 |
$10,919 |
$12,100 |
$10,599 |
11/30/21 |
$10,900 |
$12,136 |
$10,600 |
12/31/21 |
$10,903 |
$12,105 |
$10,600 |
1/31/22 |
$10,895 |
$11,844 |
$10,601 |
2/28/22 |
$10,855 |
$11,712 |
$10,602 |
3/31/22 |
$10,781 |
$11,386 |
$10,603 |
4/30/22 |
$10,778 |
$10,954 |
$10,606 |
5/31/22 |
$10,765 |
$11,025 |
$10,611 |
6/30/22 |
$10,720 |
$10,852 |
$10,619 |
7/31/22 |
$10,712 |
$11,117 |
$10,630 |
8/31/22 |
$10,771 |
$10,803 |
$10,645 |
9/30/22 |
$10,777 |
$10,336 |
$10,666 |
10/31/22 |
$10,751 |
$10,202 |
$10,693 |
11/30/22 |
$10,775 |
$10,578 |
$10,723 |
12/31/22 |
$10,865 |
$10,530 |
$10,759 |
1/31/23 |
$10,915 |
$10,854 |
$10,799 |
2/28/23 |
$10,979 |
$10,573 |
$10,837 |
3/31/23 |
$10,968 |
$10,842 |
$10,880 |
4/30/23 |
$11,024 |
$10,908 |
$10,923 |
5/31/23 |
$11,086 |
$10,789 |
$10,970 |
6/30/23 |
$11,153 |
$10,750 |
$11,016 |
7/31/23 |
$11,217 |
$10,743 |
$11,067 |
8/31/23 |
$11,274 |
$10,674 |
$11,118 |
9/30/23 |
$11,344 |
$10,403 |
$11,168 |
10/31/23 |
$11,402 |
$10,239 |
$11,221 |
11/30/23 |
$11,437 |
$10,702 |
$11,272 |
12/31/23 |
$11,497 |
$11,112 |
$11,325 |
1/31/24 |
$11,567 |
$11,082 |
$11,378 |
2/29/24 |
$11,638 |
$10,925 |
$11,428 |
3/31/24 |
$11,699 |
$11,026 |
$11,480 |
4/30/24 |
$11,760 |
$10,747 |
$11,532 |
5/31/24 |
$11,826 |
$10,930 |
$11,586 |
6/30/24 |
$11,860 |
$11,033 |
$11,638 |
7/31/24 |
$11,910 |
$11,291 |
$11,692 |
8/31/24 |
$11,964 |
$11,453 |
$11,746 |
9/30/24 |
$12,010 |
$11,606 |
$11,797 |
10/31/24 |
$12,070 |
$11,319 |
$11,848 |
11/30/24 |
$12,131 |
$11,438 |
$11,895 |
12/31/24 |
$12,204 |
$11,251 |
$11,942 |
1/31/25 |
$12,265 |
$11,311 |
$11,988 |
2/28/25 |
$12,297 |
$11,560 |
$12,029 |
3/31/25 |
$12,329 |
$11,564 |
$12,074 |
|
| Average Annual Return [Table Text Block] |
Class/Index Name |
1 Year |
5 Years |
10 Years |
Class A (excluding sales charge) |
5.39% |
3.39% |
2.35% |
Class A (including sales charge) |
3.02% |
2.92% |
2.12% |
Bloomberg U.S. Aggregate Index |
4.88% |
(0.40%) |
1.46% |
FTSE 3-Month Treasury Bill Index |
5.17% |
2.69% |
1.90% | |
| No Deduction of Taxes [Text Block] |
Returns shown do not reflect the deduction of taxes that a shareholder would pay on Fund distributions or the redemption of Fund shares.
|
| Performance Table Market Index Changed [Text Block] |
Differences in the Fund’s performance versus an index and related attribution information with respect to particular categories of securities or individual positions may be attributable, in part, to differences in the pricing methodologies used by the Fund and the index.
|
| Updated Performance Information Location [Text Block] |
For performance current to the most recent month-end, visit www.pimco.com/literature or via 888.87.PIMCO (888.877.4626).
|
| AssetsNet |
$ 9,789,626,000
|
| Holdings Count | Holding |
1,288
|
| Advisory Fees Paid, Amount |
$ 25,342,000
|
| InvestmentCompanyPortfolioTurnover |
108.00%
|
| Additional Fund Statistics [Text Block] |
Key Fund StatisticsFootnote Reference† (as of the end of the reporting period)
Total Net Assets |
$9,789,626 |
# of Portfolio Holdings |
1,288 |
Portfolio Turnover Rate |
108% |
Total Net Advisory Fees Paid During the Reporting Period |
$25,342 |
| Footnote |
Description |
Footnote† |
Dollar amounts displayed in 000's | |
| Holdings [Text Block] |
Security Type Breakdown (% of Net Asset Value)Footnote Reference*
Corporate Bonds & Notes |
52.8% |
Asset-Backed Securities |
21.5% |
U.S. Government Agencies |
16.7% |
Non-Agency Mortgage-Backed Securities |
9.0% |
Sovereign Issues |
2.2% |
U.S. Treasury Obligations |
0.7% |
Municipal Bonds & Notes |
0.3% |
Short-Term Instruments |
26.5% |
Affiliated Investments |
0.1% |
Financial Derivative Instruments |
0.0%Footnote Reference^ |
Other Assets and Liabilities, Net |
(29.8%) |
Total |
100.0% |
| Footnote |
Description |
Footnote^ |
Rounded value of investments is less than 0.1% of net assets. |
Footnote* |
% of Net Asset Value includes derivatives instruments, if any, valued at the value used for determining the Fund's net asset value. The notional exposure of such derivatives investments therefore may be greater than what is depicted. | |
| Material Fund Change [Text Block] |
|
| C000026624 |
|
| Shareholder Report [Line Items] |
|
| Fund Name |
PIMCO Short-Term Fund
|
| Class Name |
Administrative Class
|
| Trading Symbol |
PSFAX
|
| Annual or Semi-Annual Statement [Text Block] |
This annual shareholder report contains important information about the PIMCO Short-Term Fund (the "Fund") for the period of April 1, 2024 to March 31, 2025 (the "reporting period").
|
| Shareholder Report Annual or Semi-Annual |
Annual Shareholder Report
|
| Additional Information [Text Block] |
You can find additional information about the Fund at www.pimco.com/literature. You can also request this information by contacting us at 888.87.PIMCO (888.877.4626).
|
| Additional Information Phone Number |
888.87.PIMCO (888.877.4626)
|
| Expenses [Text Block] |
What were the Fund costs for the reporting period?(based on a hypothetical $10,000 investment)
Class Name |
Cost of a $10,000 investment |
Costs paid as a percentage of a $10,000 investment |
Administrative Class |
$76 |
0.74% | |
| Expenses Paid, Amount |
$ 76
|
| Expense Ratio, Percent |
0.74%
|
| Factors Affecting Performance [Text Block] |
How did the Fund perform during the reporting period and what affected its performance?The following affected performance (on a gross basis) during the reporting period: Select holdings of securitized credit, particularly asset-based securities (“ABS”) and collateralized loan obligations (“CLO”) contributed to relative performance versus the FTSE 3-Month Treasury Bill Index ("Index"), as coupon payments on ABS investments offset spread widening, and CLO spreads tightened. Holdings of investment grade corporate credit, particularly financials, contributed to relative performance versus the Index, as investment grade corporate bonds had positive total returns. Overweight exposure to U.S. duration in the 1-year part of the curve contributed to relative performance versus the Index, as interest rates fell. Overweight exposure to U.K. duration in the 5-year part of the curve detracted from relative performance versus the Index, as interest rates rose. There were no other material detractors for this Fund.
|
| Performance Past Does Not Indicate Future [Text] |
Performance quoted represents past performance. Past performance is not a guarantee or a reliable indicator of future results.
|
| Line Graph [Table Text Block] |
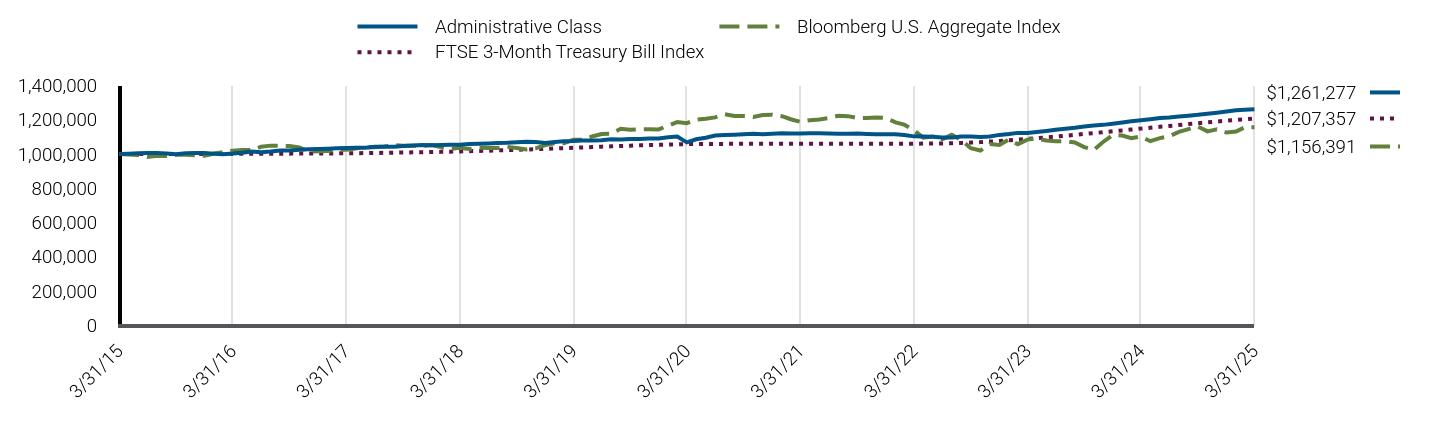
|
Administrative Class |
Bloomberg U.S. Aggregate Index |
FTSE 3-Month Treasury Bill Index |
3/31/15 |
$1,000,000 |
$1,000,000 |
$1,000,000 |
4/30/15 |
$1,001,629 |
$996,412 |
$1,000,016 |
5/31/15 |
$1,004,463 |
$994,012 |
$1,000,030 |
6/30/15 |
$1,005,310 |
$983,174 |
$1,000,041 |
7/31/15 |
$1,005,200 |
$990,008 |
$1,000,050 |
8/31/15 |
$1,003,113 |
$988,586 |
$1,000,075 |
9/30/15 |
$997,939 |
$995,273 |
$1,000,101 |
10/31/15 |
$1,004,107 |
$995,439 |
$1,000,125 |
11/30/15 |
$1,005,288 |
$992,809 |
$1,000,152 |
12/31/15 |
$1,005,926 |
$989,601 |
$1,000,229 |
1/31/16 |
$1,001,919 |
$1,003,219 |
$1,000,354 |
2/29/16 |
$998,870 |
$1,010,335 |
$1,000,534 |
3/31/16 |
$1,002,214 |
$1,019,605 |
$1,000,767 |
4/30/16 |
$1,007,789 |
$1,023,519 |
$1,001,004 |
5/31/16 |
$1,014,201 |
$1,023,781 |
$1,001,216 |
6/30/16 |
$1,010,408 |
$1,042,177 |
$1,001,416 |
7/31/16 |
$1,014,050 |
$1,048,765 |
$1,001,638 |
8/31/16 |
$1,019,792 |
$1,047,566 |
$1,001,877 |
9/30/16 |
$1,021,035 |
$1,046,952 |
$1,002,116 |
10/31/16 |
$1,024,416 |
$1,038,944 |
$1,002,369 |
11/30/16 |
$1,027,018 |
$1,014,369 |
$1,002,627 |
12/31/16 |
$1,029,212 |
$1,015,800 |
$1,002,938 |
1/31/17 |
$1,031,135 |
$1,017,793 |
$1,003,311 |
2/28/17 |
$1,033,298 |
$1,024,634 |
$1,003,703 |
3/31/17 |
$1,034,556 |
$1,024,097 |
$1,004,153 |
4/30/17 |
$1,036,811 |
$1,032,000 |
$1,004,663 |
5/31/17 |
$1,037,031 |
$1,039,943 |
$1,005,272 |
6/30/17 |
$1,041,615 |
$1,038,896 |
$1,005,984 |
7/31/17 |
$1,041,765 |
$1,043,367 |
$1,006,794 |
8/31/17 |
$1,041,990 |
$1,052,726 |
$1,007,683 |
9/30/17 |
$1,046,411 |
$1,047,712 |
$1,008,552 |
10/31/17 |
$1,049,896 |
$1,048,319 |
$1,009,463 |
11/30/17 |
$1,052,479 |
$1,046,973 |
$1,010,364 |
12/31/17 |
$1,051,621 |
$1,051,778 |
$1,011,376 |
1/31/18 |
$1,052,850 |
$1,039,665 |
$1,012,488 |
2/28/18 |
$1,054,231 |
$1,029,809 |
$1,013,578 |
3/31/18 |
$1,053,722 |
$1,036,414 |
$1,014,900 |
4/30/18 |
$1,058,541 |
$1,028,705 |
$1,016,269 |
5/31/18 |
$1,059,371 |
$1,036,047 |
$1,017,787 |
6/30/18 |
$1,061,272 |
$1,034,773 |
$1,019,327 |
7/31/18 |
$1,064,166 |
$1,035,019 |
$1,020,980 |
8/31/18 |
$1,065,298 |
$1,041,679 |
$1,022,701 |
9/30/18 |
$1,069,184 |
$1,034,971 |
$1,024,424 |
10/31/18 |
$1,071,100 |
$1,026,792 |
$1,026,288 |
11/30/18 |
$1,070,018 |
$1,032,921 |
$1,028,181 |
12/31/18 |
$1,064,790 |
$1,051,898 |
$1,030,216 |
1/31/19 |
$1,069,950 |
$1,063,068 |
$1,032,309 |
2/28/19 |
$1,074,122 |
$1,062,452 |
$1,034,221 |
3/31/19 |
$1,075,422 |
$1,082,853 |
$1,036,364 |
4/30/19 |
$1,078,848 |
$1,083,130 |
$1,038,451 |
5/31/19 |
$1,079,053 |
$1,102,358 |
$1,040,621 |
6/30/19 |
$1,080,024 |
$1,116,201 |
$1,042,721 |
7/31/19 |
$1,085,464 |
$1,118,657 |
$1,044,805 |
8/31/19 |
$1,084,293 |
$1,147,643 |
$1,046,791 |
9/30/19 |
$1,087,214 |
$1,141,531 |
$1,048,587 |
10/31/19 |
$1,087,916 |
$1,144,969 |
$1,050,362 |
11/30/19 |
$1,089,792 |
$1,144,386 |
$1,051,926 |
12/31/19 |
$1,091,050 |
$1,143,588 |
$1,053,424 |
1/31/20 |
$1,098,340 |
$1,165,596 |
$1,054,843 |
2/29/20 |
$1,102,060 |
$1,186,575 |
$1,056,175 |
3/31/20 |
$1,067,563 |
$1,179,592 |
$1,057,509 |
4/30/20 |
$1,085,764 |
$1,200,561 |
$1,058,376 |
5/31/20 |
$1,094,895 |
$1,206,151 |
$1,058,833 |
6/30/20 |
$1,108,270 |
$1,213,749 |
$1,058,937 |
7/31/20 |
$1,110,217 |
$1,231,878 |
$1,059,058 |
8/31/20 |
$1,112,000 |
$1,221,935 |
$1,059,176 |
9/30/20 |
$1,114,911 |
$1,221,265 |
$1,059,278 |
10/31/20 |
$1,117,724 |
$1,215,812 |
$1,059,369 |
11/30/20 |
$1,115,951 |
$1,227,742 |
$1,059,456 |
12/31/20 |
$1,118,120 |
$1,229,433 |
$1,059,538 |
1/31/21 |
$1,120,694 |
$1,220,618 |
$1,059,615 |
2/28/21 |
$1,119,936 |
$1,202,992 |
$1,059,676 |
3/31/21 |
$1,120,340 |
$1,187,971 |
$1,059,730 |
4/30/21 |
$1,120,785 |
$1,197,356 |
$1,059,766 |
5/31/21 |
$1,121,145 |
$1,201,268 |
$1,059,790 |
6/30/21 |
$1,119,202 |
$1,209,708 |
$1,059,806 |
7/31/21 |
$1,118,374 |
$1,223,233 |
$1,059,829 |
8/31/21 |
$1,118,656 |
$1,220,905 |
$1,059,862 |
9/30/21 |
$1,120,108 |
$1,210,334 |
$1,059,903 |
10/31/21 |
$1,117,005 |
$1,210,000 |
$1,059,941 |
11/30/21 |
$1,115,052 |
$1,213,580 |
$1,059,981 |
12/31/21 |
$1,115,416 |
$1,210,475 |
$1,060,025 |
1/31/22 |
$1,114,581 |
$1,184,396 |
$1,060,075 |
2/28/22 |
$1,110,436 |
$1,171,183 |
$1,060,155 |
3/31/22 |
$1,102,939 |
$1,138,645 |
$1,060,323 |
4/30/22 |
$1,102,608 |
$1,095,436 |
$1,060,623 |
5/31/22 |
$1,101,261 |
$1,102,499 |
$1,061,136 |
6/30/22 |
$1,096,695 |
$1,085,203 |
$1,061,852 |
7/31/22 |
$1,095,813 |
$1,111,719 |
$1,062,953 |
8/31/22 |
$1,101,875 |
$1,080,306 |
$1,064,534 |
9/30/22 |
$1,102,516 |
$1,033,630 |
$1,066,619 |
10/31/22 |
$1,099,870 |
$1,020,242 |
$1,069,261 |
11/30/22 |
$1,102,324 |
$1,057,762 |
$1,072,326 |
12/31/22 |
$1,111,528 |
$1,052,991 |
$1,075,945 |
1/31/23 |
$1,116,642 |
$1,085,385 |
$1,079,916 |
2/28/23 |
$1,123,186 |
$1,057,322 |
$1,083,683 |
3/31/23 |
$1,122,045 |
$1,084,180 |
$1,088,015 |
4/30/23 |
$1,127,756 |
$1,090,751 |
$1,092,346 |
5/31/23 |
$1,134,138 |
$1,078,874 |
$1,096,968 |
6/30/23 |
$1,140,971 |
$1,075,027 |
$1,101,639 |
7/31/23 |
$1,147,512 |
$1,074,277 |
$1,106,658 |
8/31/23 |
$1,153,303 |
$1,067,415 |
$1,111,804 |
9/30/23 |
$1,160,482 |
$1,040,290 |
$1,116,824 |
10/31/23 |
$1,166,410 |
$1,023,873 |
$1,122,085 |
11/30/23 |
$1,170,013 |
$1,070,241 |
$1,127,216 |
12/31/23 |
$1,176,208 |
$1,111,209 |
$1,132,519 |
1/31/24 |
$1,183,358 |
$1,108,157 |
$1,137,809 |
2/29/24 |
$1,190,550 |
$1,092,501 |
$1,142,751 |
3/31/24 |
$1,196,777 |
$1,102,589 |
$1,148,046 |
4/30/24 |
$1,203,035 |
$1,074,739 |
$1,153,200 |
5/31/24 |
$1,209,798 |
$1,092,959 |
$1,158,559 |
6/30/24 |
$1,213,320 |
$1,103,307 |
$1,163,774 |
7/31/24 |
$1,218,455 |
$1,129,077 |
$1,169,185 |
8/31/24 |
$1,223,911 |
$1,145,301 |
$1,174,577 |
9/30/24 |
$1,228,625 |
$1,160,636 |
$1,179,725 |
10/31/24 |
$1,234,826 |
$1,131,854 |
$1,184,817 |
11/30/24 |
$1,241,046 |
$1,143,821 |
$1,189,527 |
12/31/24 |
$1,248,518 |
$1,125,101 |
$1,194,204 |
1/31/25 |
$1,254,708 |
$1,131,070 |
$1,198,799 |
2/28/25 |
$1,257,953 |
$1,155,956 |
$1,202,884 |
3/31/25 |
$1,261,277 |
$1,156,391 |
$1,207,357 |
|
| Average Annual Return [Table Text Block] |
Class/Index Name |
1 Year |
5 Years |
10 Years |
Administrative Class |
5.39% |
3.39% |
2.35% |
Bloomberg U.S. Aggregate Index |
4.88% |
(0.40%) |
1.46% |
FTSE 3-Month Treasury Bill Index |
5.17% |
2.69% |
1.90% | |
| No Deduction of Taxes [Text Block] |
Returns shown do not reflect the deduction of taxes that a shareholder would pay on Fund distributions or the redemption of Fund shares.
|
| Performance Table Market Index Changed [Text Block] |
Differences in the Fund’s performance versus an index and related attribution information with respect to particular categories of securities or individual positions may be attributable, in part, to differences in the pricing methodologies used by the Fund and the index.
|
| Updated Performance Information Location [Text Block] |
For performance current to the most recent month-end, visit www.pimco.com/literature or via 888.87.PIMCO (888.877.4626).
|
| AssetsNet |
$ 9,789,626,000
|
| Holdings Count | Holding |
1,288
|
| Advisory Fees Paid, Amount |
$ 25,342,000
|
| InvestmentCompanyPortfolioTurnover |
108.00%
|
| Additional Fund Statistics [Text Block] |
Key Fund StatisticsFootnote Reference† (as of the end of the reporting period)
Total Net Assets |
$9,789,626 |
# of Portfolio Holdings |
1,288 |
Portfolio Turnover Rate |
108% |
Total Net Advisory Fees Paid During the Reporting Period |
$25,342 |
| Footnote |
Description |
Footnote† |
Dollar amounts displayed in 000's | |
| Holdings [Text Block] |
Security Type Breakdown (% of Net Asset Value)Footnote Reference*
Corporate Bonds & Notes |
52.8% |
Asset-Backed Securities |
21.5% |
U.S. Government Agencies |
16.7% |
Non-Agency Mortgage-Backed Securities |
9.0% |
Sovereign Issues |
2.2% |
U.S. Treasury Obligations |
0.7% |
Municipal Bonds & Notes |
0.3% |
Short-Term Instruments |
26.5% |
Affiliated Investments |
0.1% |
Financial Derivative Instruments |
0.0%Footnote Reference^ |
Other Assets and Liabilities, Net |
(29.8%) |
Total |
100.0% |
| Footnote |
Description |
Footnote^ |
Rounded value of investments is less than 0.1% of net assets. |
Footnote* |
% of Net Asset Value includes derivatives instruments, if any, valued at the value used for determining the Fund's net asset value. The notional exposure of such derivatives investments therefore may be greater than what is depicted. | |
| Material Fund Change [Text Block] |
|
| C000026627 |
|
| Shareholder Report [Line Items] |
|
| Fund Name |
PIMCO Short-Term Fund
|
| Class Name |
Class C
|
| Trading Symbol |
PFTCX
|
| Annual or Semi-Annual Statement [Text Block] |
This annual shareholder report contains important information about the PIMCO Short-Term Fund (the "Fund") for the period of April 1, 2024 to March 31, 2025 (the "reporting period").
|
| Shareholder Report Annual or Semi-Annual |
Annual Shareholder Report
|
| Additional Information [Text Block] |
You can find additional information about the Fund at www.pimco.com/literature. You can also request this information by contacting us at 888.87.PIMCO (888.877.4626).
|
| Additional Information Phone Number |
888.87.PIMCO (888.877.4626)
|
| Expenses [Text Block] |
What were the Fund costs for the reporting period?(based on a hypothetical $10,000 investment)
Class Name |
Cost of a $10,000 investment |
Costs paid as a percentage of a $10,000 investment |
Class C |
$107 |
1.04% | |
| Expenses Paid, Amount |
$ 107
|
| Expense Ratio, Percent |
1.04%
|
| Factors Affecting Performance [Text Block] |
How did the Fund perform during the reporting period and what affected its performance?The following affected performance (on a gross basis) during the reporting period: Select holdings of securitized credit, particularly asset-based securities (“ABS”) and collateralized loan obligations (“CLO”) contributed to relative performance versus the FTSE 3-Month Treasury Bill Index ("Index"), as coupon payments on ABS investments offset spread widening, and CLO spreads tightened. Holdings of investment grade corporate credit, particularly financials, contributed to relative performance versus the Index, as investment grade corporate bonds had positive total returns. Overweight exposure to U.S. duration in the 1-year part of the curve contributed to relative performance versus the Index, as interest rates fell. Overweight exposure to U.K. duration in the 5-year part of the curve detracted from relative performance versus the Index, as interest rates rose. There were no other material detractors for this Fund.
|
| Performance Past Does Not Indicate Future [Text] |
Performance quoted represents past performance. Past performance is not a guarantee or a reliable indicator of future results.
|
| Line Graph [Table Text Block] |
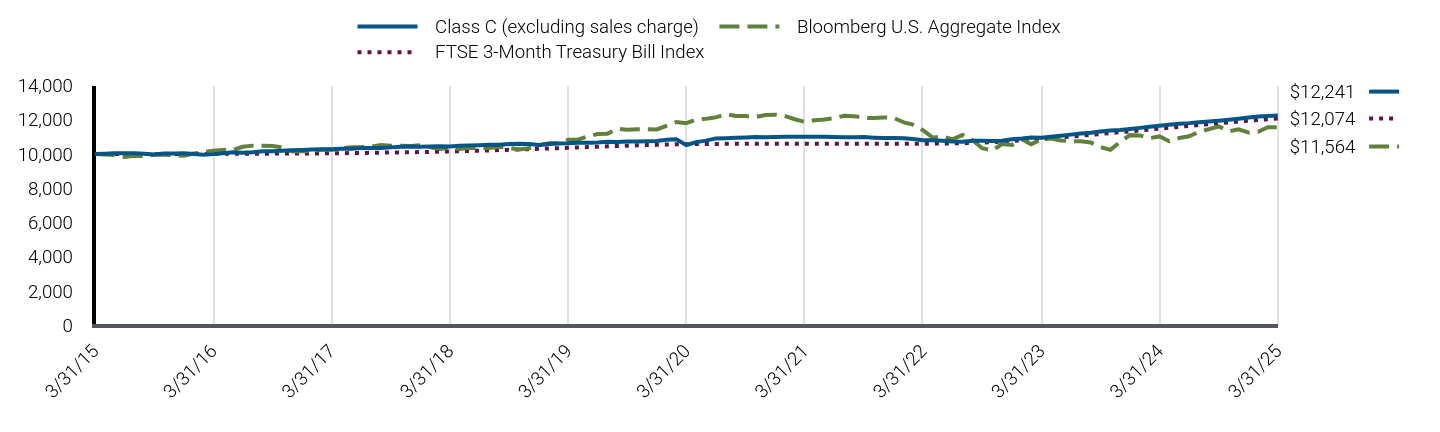
|
Class C (excluding sales charge) |
Bloomberg U.S. Aggregate Index |
FTSE 3-Month Treasury Bill Index |
3/31/15 |
$10,000 |
$10,000 |
$10,000 |
4/30/15 |
$10,014 |
$9,964 |
$10,000 |
5/31/15 |
$10,040 |
$9,940 |
$10,000 |
6/30/15 |
$10,046 |
$9,832 |
$10,000 |
7/31/15 |
$10,042 |
$9,900 |
$10,001 |
8/31/15 |
$10,019 |
$9,886 |
$10,001 |
9/30/15 |
$9,964 |
$9,953 |
$10,001 |
10/31/15 |
$10,023 |
$9,954 |
$10,001 |
11/30/15 |
$10,033 |
$9,928 |
$10,002 |
12/31/15 |
$10,036 |
$9,896 |
$10,002 |
1/31/16 |
$9,994 |
$10,032 |
$10,004 |
2/29/16 |
$9,961 |
$10,103 |
$10,005 |
3/31/16 |
$9,992 |
$10,196 |
$10,008 |
4/30/16 |
$10,045 |
$10,235 |
$10,010 |
5/31/16 |
$10,107 |
$10,238 |
$10,012 |
6/30/16 |
$10,066 |
$10,422 |
$10,014 |
7/31/16 |
$10,100 |
$10,488 |
$10,016 |
8/31/16 |
$10,155 |
$10,476 |
$10,019 |
9/30/16 |
$10,164 |
$10,470 |
$10,021 |
10/31/16 |
$10,196 |
$10,389 |
$10,024 |
11/30/16 |
$10,219 |
$10,144 |
$10,026 |
12/31/16 |
$10,238 |
$10,158 |
$10,029 |
1/31/17 |
$10,255 |
$10,178 |
$10,033 |
2/28/17 |
$10,274 |
$10,246 |
$10,037 |
3/31/17 |
$10,284 |
$10,241 |
$10,042 |
4/30/17 |
$10,304 |
$10,320 |
$10,047 |
5/31/17 |
$10,303 |
$10,399 |
$10,053 |
6/30/17 |
$10,346 |
$10,389 |
$10,060 |
7/31/17 |
$10,345 |
$10,434 |
$10,068 |
8/31/17 |
$10,345 |
$10,527 |
$10,077 |
9/30/17 |
$10,386 |
$10,477 |
$10,086 |
10/31/17 |
$10,418 |
$10,483 |
$10,095 |
11/30/17 |
$10,441 |
$10,470 |
$10,104 |
12/31/17 |
$10,430 |
$10,518 |
$10,114 |
1/31/18 |
$10,439 |
$10,397 |
$10,125 |
2/28/18 |
$10,451 |
$10,298 |
$10,136 |
3/31/18 |
$10,443 |
$10,364 |
$10,149 |
4/30/18 |
$10,488 |
$10,287 |
$10,163 |
5/31/18 |
$10,494 |
$10,360 |
$10,178 |
6/30/18 |
$10,510 |
$10,348 |
$10,193 |
7/31/18 |
$10,536 |
$10,350 |
$10,210 |
8/31/18 |
$10,544 |
$10,417 |
$10,227 |
9/30/18 |
$10,580 |
$10,350 |
$10,244 |
10/31/18 |
$10,597 |
$10,268 |
$10,263 |
11/30/18 |
$10,583 |
$10,329 |
$10,282 |
12/31/18 |
$10,529 |
$10,519 |
$10,302 |
1/31/19 |
$10,578 |
$10,631 |
$10,323 |
2/28/19 |
$10,616 |
$10,625 |
$10,342 |
3/31/19 |
$10,626 |
$10,829 |
$10,364 |
4/30/19 |
$10,658 |
$10,831 |
$10,385 |
5/31/19 |
$10,657 |
$11,024 |
$10,406 |
6/30/19 |
$10,664 |
$11,162 |
$10,427 |
7/31/19 |
$10,715 |
$11,187 |
$10,448 |
8/31/19 |
$10,701 |
$11,476 |
$10,468 |
9/30/19 |
$10,727 |
$11,415 |
$10,486 |
10/31/19 |
$10,731 |
$11,450 |
$10,504 |
11/30/19 |
$10,747 |
$11,444 |
$10,519 |
12/31/19 |
$10,757 |
$11,436 |
$10,534 |
1/31/20 |
$10,826 |
$11,656 |
$10,548 |
2/29/20 |
$10,860 |
$11,866 |
$10,562 |
3/31/20 |
$10,517 |
$11,796 |
$10,575 |
4/30/20 |
$10,694 |
$12,006 |
$10,584 |
5/31/20 |
$10,781 |
$12,062 |
$10,588 |
6/30/20 |
$10,910 |
$12,137 |
$10,589 |
7/31/20 |
$10,926 |
$12,319 |
$10,591 |
8/31/20 |
$10,941 |
$12,219 |
$10,592 |
9/30/20 |
$10,967 |
$12,213 |
$10,593 |
10/31/20 |
$10,992 |
$12,158 |
$10,594 |
11/30/20 |
$10,972 |
$12,277 |
$10,595 |
12/31/20 |
$10,990 |
$12,294 |
$10,595 |
1/31/21 |
$11,013 |
$12,206 |
$10,596 |
2/28/21 |
$11,003 |
$12,030 |
$10,597 |
3/31/21 |
$11,004 |
$11,880 |
$10,597 |
4/30/21 |
$11,006 |
$11,974 |
$10,598 |
5/31/21 |
$11,007 |
$12,013 |
$10,598 |
6/30/21 |
$10,985 |
$12,097 |
$10,598 |
7/31/21 |
$10,974 |
$12,232 |
$10,598 |
8/31/21 |
$10,974 |
$12,209 |
$10,599 |
9/30/21 |
$10,985 |
$12,103 |
$10,599 |
10/31/21 |
$10,952 |
$12,100 |
$10,599 |
11/30/21 |
$10,930 |
$12,136 |
$10,600 |
12/31/21 |
$10,931 |
$12,105 |
$10,600 |
1/31/22 |
$10,920 |
$11,844 |
$10,601 |
2/28/22 |
$10,877 |
$11,712 |
$10,602 |
3/31/22 |
$10,801 |
$11,386 |
$10,603 |
4/30/22 |
$10,795 |
$10,954 |
$10,606 |
5/31/22 |
$10,779 |
$11,025 |
$10,611 |
6/30/22 |
$10,732 |
$10,852 |
$10,619 |
7/31/22 |
$10,720 |
$11,117 |
$10,630 |
8/31/22 |
$10,777 |
$10,803 |
$10,645 |
9/30/22 |
$10,780 |
$10,336 |
$10,666 |
10/31/22 |
$10,752 |
$10,202 |
$10,693 |
11/30/22 |
$10,773 |
$10,578 |
$10,723 |
12/31/22 |
$10,860 |
$10,530 |
$10,759 |
1/31/23 |
$10,908 |
$10,854 |
$10,799 |
2/28/23 |
$10,969 |
$10,573 |
$10,837 |
3/31/23 |
$10,955 |
$10,842 |
$10,880 |
4/30/23 |
$11,008 |
$10,908 |
$10,923 |
5/31/23 |
$11,068 |
$10,789 |
$10,970 |
6/30/23 |
$11,131 |
$10,750 |
$11,016 |
7/31/23 |
$11,193 |
$10,743 |
$11,067 |
8/31/23 |
$11,246 |
$10,674 |
$11,118 |
9/30/23 |
$11,313 |
$10,403 |
$11,168 |
10/31/23 |
$11,368 |
$10,239 |
$11,221 |
11/30/23 |
$11,401 |
$10,702 |
$11,272 |
12/31/23 |
$11,458 |
$11,112 |
$11,325 |
1/31/24 |
$11,525 |
$11,082 |
$11,378 |
2/29/24 |
$11,592 |
$10,925 |
$11,428 |
3/31/24 |
$11,650 |
$11,026 |
$11,480 |
4/30/24 |
$11,708 |
$10,747 |
$11,532 |
5/31/24 |
$11,771 |
$10,930 |
$11,586 |
6/30/24 |
$11,802 |
$11,033 |
$11,638 |
7/31/24 |
$11,849 |
$11,291 |
$11,692 |
8/31/24 |
$11,899 |
$11,453 |
$11,746 |
9/30/24 |
$11,942 |
$11,606 |
$11,797 |
10/31/24 |
$11,999 |
$11,319 |
$11,848 |
11/30/24 |
$12,057 |
$11,438 |
$11,895 |
12/31/24 |
$12,126 |
$11,251 |
$11,942 |
1/31/25 |
$12,183 |
$11,311 |
$11,988 |
2/28/25 |
$12,212 |
$11,560 |
$12,029 |
3/31/25 |
$12,241 |
$11,564 |
$12,074 |
|
| Average Annual Return [Table Text Block] |
Class/Index Name |
1 Year |
5 Years |
10 Years |
Class C (excluding sales charge) |
5.08% |
3.08% |
2.04% |
Class C (including sales charge) |
4.08% |
3.08% |
2.04% |
Bloomberg U.S. Aggregate Index |
4.88% |
(0.40%) |
1.46% |
FTSE 3-Month Treasury Bill Index |
5.17% |
2.69% |
1.90% | |
| No Deduction of Taxes [Text Block] |
Returns shown do not reflect the deduction of taxes that a shareholder would pay on Fund distributions or the redemption of Fund shares.
|
| Performance Table Market Index Changed [Text Block] |
Differences in the Fund’s performance versus an index and related attribution information with respect to particular categories of securities or individual positions may be attributable, in part, to differences in the pricing methodologies used by the Fund and the index.
|
| Updated Performance Information Location [Text Block] |
For performance current to the most recent month-end, visit www.pimco.com/literature or via 888.87.PIMCO (888.877.4626).
|
| AssetsNet |
$ 9,789,626,000
|
| Holdings Count | Holding |
1,288
|
| Advisory Fees Paid, Amount |
$ 25,342,000
|
| InvestmentCompanyPortfolioTurnover |
108.00%
|
| Additional Fund Statistics [Text Block] |
Key Fund StatisticsFootnote Reference† (as of the end of the reporting period)
Total Net Assets |
$9,789,626 |
# of Portfolio Holdings |
1,288 |
Portfolio Turnover Rate |
108% |
Total Net Advisory Fees Paid During the Reporting Period |
$25,342 |
| Footnote |
Description |
Footnote† |
Dollar amounts displayed in 000's | |
| Holdings [Text Block] |
Security Type Breakdown (% of Net Asset Value)Footnote Reference*
Corporate Bonds & Notes |
52.8% |
Asset-Backed Securities |
21.5% |
U.S. Government Agencies |
16.7% |
Non-Agency Mortgage-Backed Securities |
9.0% |
Sovereign Issues |
2.2% |
U.S. Treasury Obligations |
0.7% |
Municipal Bonds & Notes |
0.3% |
Short-Term Instruments |
26.5% |
Affiliated Investments |
0.1% |
Financial Derivative Instruments |
0.0%Footnote Reference^ |
Other Assets and Liabilities, Net |
(29.8%) |
Total |
100.0% |
| Footnote |
Description |
Footnote^ |
Rounded value of investments is less than 0.1% of net assets. |
Footnote* |
% of Net Asset Value includes derivatives instruments, if any, valued at the value used for determining the Fund's net asset value. The notional exposure of such derivatives investments therefore may be greater than what is depicted. | |
| Material Fund Change [Text Block] |
|
| C000200448 |
|
| Shareholder Report [Line Items] |
|
| Fund Name |
PIMCO Short-Term Fund
|
| Class Name |
I-3
|
| Trading Symbol |
PTSNX
|
| Annual or Semi-Annual Statement [Text Block] |
This annual shareholder report contains important information about the PIMCO Short-Term Fund (the "Fund") for the period of April 1, 2024 to March 31, 2025 (the "reporting period").
|
| Shareholder Report Annual or Semi-Annual |
Annual Shareholder Report
|
| Additional Information [Text Block] |
You can find additional information about the Fund at www.pimco.com/literature. You can also request this information by contacting us at 888.87.PIMCO (888.877.4626).
|
| Additional Information Phone Number |
888.87.PIMCO (888.877.4626)
|
| Expenses [Text Block] |
What were the Fund costs for the reporting period?(based on a hypothetical $10,000 investment)
Class Name |
Cost of a $10,000 investment |
Costs paid as a percentage of a $10,000 investment |
I-3 |
$66 |
0.64% | |
| Expenses Paid, Amount |
$ 66
|
| Expense Ratio, Percent |
0.64%
|
| Factors Affecting Performance [Text Block] |
How did the Fund perform during the reporting period and what affected its performance?The following affected performance (on a gross basis) during the reporting period: Select holdings of securitized credit, particularly asset-based securities (“ABS”) and collateralized loan obligations (“CLO”) contributed to relative performance versus the FTSE 3-Month Treasury Bill Index ("Index"), as coupon payments on ABS investments offset spread widening, and CLO spreads tightened. Holdings of investment grade corporate credit, particularly financials, contributed to relative performance versus the Index, as investment grade corporate bonds had positive total returns. Overweight exposure to U.S. duration in the 1-year part of the curve contributed to relative performance versus the Index, as interest rates fell. Overweight exposure to U.K. duration in the 5-year part of the curve detracted from relative performance versus the Index, as interest rates rose. There were no other material detractors for this Fund.
|
| Performance Past Does Not Indicate Future [Text] |
Performance quoted represents past performance. Past performance is not a guarantee or a reliable indicator of future results.
|
| Line Graph [Table Text Block] |

|
I-3 |
Bloomberg U.S. Aggregate Index |
FTSE 3-Month Treasury Bill Index |
3/31/15 |
$1,000,000 |
$1,000,000 |
$1,000,000 |
4/30/15 |
$1,001,711 |
$996,412 |
$1,000,016 |
5/31/15 |
$1,004,629 |
$994,012 |
$1,000,030 |
6/30/15 |
$1,005,558 |
$983,174 |
$1,000,041 |
7/31/15 |
$1,005,547 |
$990,008 |
$1,000,050 |
8/31/15 |
$1,003,532 |
$988,586 |
$1,000,075 |
9/30/15 |
$998,437 |
$995,273 |
$1,000,101 |
10/31/15 |
$1,004,700 |
$995,439 |
$1,000,125 |
11/30/15 |
$1,005,956 |
$992,809 |
$1,000,152 |
12/31/15 |
$1,006,703 |
$989,601 |
$1,000,229 |
1/31/16 |
$1,002,756 |
$1,003,219 |
$1,000,354 |
2/29/16 |
$999,784 |
$1,010,335 |
$1,000,534 |
3/31/16 |
$1,003,216 |
$1,019,605 |
$1,000,767 |
4/30/16 |
$1,008,886 |
$1,023,519 |
$1,001,004 |
5/31/16 |
$1,015,385 |
$1,023,781 |
$1,001,216 |
6/30/16 |
$1,011,671 |
$1,042,177 |
$1,001,416 |
7/31/16 |
$1,015,404 |
$1,048,765 |
$1,001,638 |
8/31/16 |
$1,021,239 |
$1,047,566 |
$1,001,877 |
9/30/16 |
$1,022,582 |
$1,046,952 |
$1,002,116 |
10/31/16 |
$1,026,038 |
$1,038,944 |
$1,002,369 |
11/30/16 |
$1,028,732 |
$1,014,369 |
$1,002,627 |
12/31/16 |
$1,031,032 |
$1,015,800 |
$1,002,938 |
1/31/17 |
$1,033,032 |
$1,017,793 |
$1,003,311 |
2/28/17 |
$1,035,276 |
$1,024,634 |
$1,003,703 |
3/31/17 |
$1,036,639 |
$1,024,097 |
$1,004,153 |
4/30/17 |
$1,038,970 |
$1,032,000 |
$1,004,663 |
5/31/17 |
$1,039,279 |
$1,039,943 |
$1,005,272 |
6/30/17 |
$1,043,972 |
$1,038,896 |
$1,005,984 |
7/31/17 |
$1,044,197 |
$1,043,367 |
$1,006,794 |
8/31/17 |
$1,044,511 |
$1,052,726 |
$1,007,683 |
9/30/17 |
$1,049,036 |
$1,047,712 |
$1,008,552 |
10/31/17 |
$1,052,612 |
$1,048,319 |
$1,009,463 |
11/30/17 |
$1,055,289 |
$1,046,973 |
$1,010,364 |
12/31/17 |
$1,054,524 |
$1,051,778 |
$1,011,376 |
1/31/18 |
$1,055,840 |
$1,039,665 |
$1,012,488 |
2/28/18 |
$1,057,306 |
$1,029,809 |
$1,013,578 |
3/31/18 |
$1,056,893 |
$1,036,414 |
$1,014,900 |
4/30/18 |
$1,061,814 |
$1,028,705 |
$1,016,269 |
5/31/18 |
$1,062,742 |
$1,036,047 |
$1,017,787 |
6/30/18 |
$1,064,757 |
$1,034,773 |
$1,019,327 |
7/31/18 |
$1,067,756 |
$1,035,019 |
$1,020,980 |
8/31/18 |
$1,068,995 |
$1,041,679 |
$1,022,701 |
9/30/18 |
$1,072,980 |
$1,034,971 |
$1,024,424 |
10/31/18 |
$1,075,012 |
$1,026,792 |
$1,026,288 |
11/30/18 |
$1,074,021 |
$1,032,921 |
$1,028,181 |
12/31/18 |
$1,068,861 |
$1,051,898 |
$1,030,216 |
1/31/19 |
$1,074,133 |
$1,063,068 |
$1,032,309 |
2/28/19 |
$1,078,408 |
$1,062,452 |
$1,034,221 |
3/31/19 |
$1,079,808 |
$1,082,853 |
$1,036,364 |
4/30/19 |
$1,083,339 |
$1,083,130 |
$1,038,451 |
5/31/19 |
$1,083,640 |
$1,102,358 |
$1,040,621 |
6/30/19 |
$1,084,698 |
$1,116,201 |
$1,042,721 |
7/31/19 |
$1,090,258 |
$1,118,657 |
$1,044,805 |
8/31/19 |
$1,089,183 |
$1,147,643 |
$1,046,791 |
9/30/19 |
$1,092,203 |
$1,141,531 |
$1,048,587 |
10/31/19 |
$1,093,002 |
$1,144,969 |
$1,050,362 |
11/30/19 |
$1,094,982 |
$1,144,386 |
$1,051,926 |
12/31/19 |
$1,096,339 |
$1,143,588 |
$1,053,424 |
1/31/20 |
$1,103,765 |
$1,165,596 |
$1,054,843 |
2/29/20 |
$1,107,592 |
$1,186,575 |
$1,056,175 |
3/31/20 |
$1,072,993 |
$1,179,592 |
$1,057,509 |
4/30/20 |
$1,091,384 |
$1,200,561 |
$1,058,376 |
5/31/20 |
$1,100,653 |
$1,206,151 |
$1,058,833 |
6/30/20 |
$1,114,199 |
$1,213,749 |
$1,058,937 |
7/31/20 |
$1,116,261 |
$1,231,878 |
$1,059,058 |
8/31/20 |
$1,118,143 |
$1,221,935 |
$1,059,176 |
9/30/20 |
$1,121,165 |
$1,221,265 |
$1,059,278 |
10/31/20 |
$1,124,094 |
$1,215,812 |
$1,059,369 |
11/30/20 |
$1,122,400 |
$1,227,742 |
$1,059,456 |
12/31/20 |
$1,124,686 |
$1,229,433 |
$1,059,538 |
1/31/21 |
$1,127,364 |
$1,220,618 |
$1,059,615 |
2/28/21 |
$1,126,688 |
$1,202,992 |
$1,059,676 |
3/31/21 |
$1,127,191 |
$1,187,971 |
$1,059,730 |
4/30/21 |
$1,127,739 |
$1,197,356 |
$1,059,766 |
5/31/21 |
$1,128,191 |
$1,201,268 |
$1,059,790 |
6/30/21 |
$1,126,328 |
$1,209,708 |
$1,059,806 |
7/31/21 |
$1,125,595 |
$1,223,233 |
$1,059,829 |
8/31/21 |
$1,125,970 |
$1,220,905 |
$1,059,862 |
9/30/21 |
$1,127,525 |
$1,210,334 |
$1,059,903 |
10/31/21 |
$1,124,496 |
$1,210,000 |
$1,059,941 |
11/30/21 |
$1,122,622 |
$1,213,580 |
$1,059,981 |
12/31/21 |
$1,123,090 |
$1,210,475 |
$1,060,025 |
1/31/22 |
$1,122,338 |
$1,184,396 |
$1,060,075 |
2/28/22 |
$1,118,249 |
$1,171,183 |
$1,060,155 |
3/31/22 |
$1,110,794 |
$1,138,645 |
$1,060,323 |
4/30/22 |
$1,110,554 |
$1,095,436 |
$1,060,623 |
5/31/22 |
$1,109,289 |
$1,102,499 |
$1,061,136 |
6/30/22 |
$1,104,780 |
$1,085,203 |
$1,061,852 |
7/31/22 |
$1,103,986 |
$1,111,719 |
$1,062,953 |
8/31/22 |
$1,110,192 |
$1,080,306 |
$1,064,534 |
9/30/22 |
$1,110,937 |
$1,033,630 |
$1,066,619 |
10/31/22 |
$1,108,357 |
$1,020,242 |
$1,069,261 |
11/30/22 |
$1,110,922 |
$1,057,762 |
$1,072,326 |
12/31/22 |
$1,120,309 |
$1,052,991 |
$1,075,945 |
1/31/23 |
$1,125,561 |
$1,085,385 |
$1,079,916 |
2/28/23 |
$1,132,255 |
$1,057,322 |
$1,083,683 |
3/31/23 |
$1,131,211 |
$1,084,180 |
$1,088,015 |
4/30/23 |
$1,137,061 |
$1,090,751 |
$1,092,346 |
5/31/23 |
$1,143,601 |
$1,078,874 |
$1,096,968 |
6/30/23 |
$1,150,603 |
$1,075,027 |
$1,101,639 |
7/31/23 |
$1,157,305 |
$1,074,277 |
$1,106,658 |
8/31/23 |
$1,163,253 |
$1,067,415 |
$1,111,804 |
9/30/23 |
$1,170,606 |
$1,040,290 |
$1,116,824 |
10/31/23 |
$1,176,693 |
$1,023,873 |
$1,122,085 |
11/30/23 |
$1,180,436 |
$1,070,241 |
$1,127,216 |
12/31/23 |
$1,186,800 |
$1,111,209 |
$1,132,519 |
1/31/24 |
$1,194,124 |
$1,108,157 |
$1,137,809 |
2/29/24 |
$1,201,488 |
$1,092,501 |
$1,142,751 |
3/31/24 |
$1,207,888 |
$1,102,589 |
$1,148,046 |
4/30/24 |
$1,214,314 |
$1,074,739 |
$1,153,200 |
5/31/24 |
$1,221,267 |
$1,092,959 |
$1,158,559 |
6/30/24 |
$1,224,926 |
$1,103,307 |
$1,163,774 |
7/31/24 |
$1,230,225 |
$1,129,077 |
$1,169,185 |
8/31/24 |
$1,235,863 |
$1,145,301 |
$1,174,577 |
9/30/24 |
$1,240,731 |
$1,160,636 |
$1,179,725 |
10/31/24 |
$1,247,106 |
$1,131,854 |
$1,184,817 |
11/30/24 |
$1,253,506 |
$1,143,821 |
$1,189,527 |
12/31/24 |
$1,261,174 |
$1,125,101 |
$1,194,204 |
1/31/25 |
$1,267,551 |
$1,131,070 |
$1,198,799 |
2/28/25 |
$1,270,931 |
$1,155,956 |
$1,202,884 |
3/31/25 |
$1,274,394 |
$1,156,391 |
$1,207,357 |
|
| Average Annual Return [Table Text Block] |
Class/Index Name |
1 Year |
5 Years |
10 Years |
I-3 |
5.51% |
3.50% |
2.45% |
Bloomberg U.S. Aggregate Index |
4.88% |
(0.40%) |
1.46% |
FTSE 3-Month Treasury Bill Index |
5.17% |
2.69% |
1.90% | |
| No Deduction of Taxes [Text Block] |
Returns shown do not reflect the deduction of taxes that a shareholder would pay on Fund distributions or the redemption of Fund shares.
|
| Performance Table Market Index Changed [Text Block] |
Differences in the Fund’s performance versus an index and related attribution information with respect to particular categories of securities or individual positions may be attributable, in part, to differences in the pricing methodologies used by the Fund and the index.
|
| Updated Performance Information Location [Text Block] |
For performance current to the most recent month-end, visit www.pimco.com/literature or via 888.87.PIMCO (888.877.4626).
|
| AssetsNet |
$ 9,789,626,000
|
| Holdings Count | Holding |
1,288
|
| Advisory Fees Paid, Amount |
$ 25,342,000
|
| InvestmentCompanyPortfolioTurnover |
108.00%
|
| Additional Fund Statistics [Text Block] |
Key Fund StatisticsFootnote Reference† (as of the end of the reporting period)
Total Net Assets |
$9,789,626 |
# of Portfolio Holdings |
1,288 |
Portfolio Turnover Rate |
108% |
Total Net Advisory Fees Paid During the Reporting Period |
$25,342 |
| Footnote |
Description |
Footnote† |
Dollar amounts displayed in 000's | |
| Holdings [Text Block] |
Security Type Breakdown (% of Net Asset Value)Footnote Reference*
Corporate Bonds & Notes |
52.8% |
Asset-Backed Securities |
21.5% |
U.S. Government Agencies |
16.7% |
Non-Agency Mortgage-Backed Securities |
9.0% |
Sovereign Issues |
2.2% |
U.S. Treasury Obligations |
0.7% |
Municipal Bonds & Notes |
0.3% |
Short-Term Instruments |
26.5% |
Affiliated Investments |
0.1% |
Financial Derivative Instruments |
0.0%Footnote Reference^ |
Other Assets and Liabilities, Net |
(29.8%) |
Total |
100.0% |
| Footnote |
Description |
Footnote^ |
Rounded value of investments is less than 0.1% of net assets. |
Footnote* |
% of Net Asset Value includes derivatives instruments, if any, valued at the value used for determining the Fund's net asset value. The notional exposure of such derivatives investments therefore may be greater than what is depicted. | |
| Material Fund Change [Text Block] |
|
| C000026623 |
|
| Shareholder Report [Line Items] |
|
| Fund Name |
PIMCO Short-Term Fund
|
| Class Name |
Institutional Class
|
| Trading Symbol |
PTSHX
|
| Annual or Semi-Annual Statement [Text Block] |
This annual shareholder report contains important information about the PIMCO Short-Term Fund (the "Fund") for the period of April 1, 2024 to March 31, 2025 (the "reporting period").
|
| Shareholder Report Annual or Semi-Annual |
Annual Shareholder Report
|
| Additional Information [Text Block] |
You can find additional information about the Fund at www.pimco.com/literature. You can also request this information by contacting us at 888.87.PIMCO (888.877.4626).
|
| Additional Information Phone Number |
888.87.PIMCO (888.877.4626)
|
| Expenses [Text Block] |
What were the Fund costs for the reporting period?(based on a hypothetical $10,000 investment)
Class Name |
Cost of a $10,000 investment |
Costs paid as a percentage of a $10,000 investment |
Institutional Class |
$50 |
0.49% | |
| Expenses Paid, Amount |
$ 50
|
| Expense Ratio, Percent |
0.49%
|
| Factors Affecting Performance [Text Block] |
How did the Fund perform during the reporting period and what affected its performance?The following affected performance (on a gross basis) during the reporting period: Select holdings of securitized credit, particularly asset-based securities (“ABS”) and collateralized loan obligations (“CLO”) contributed to relative performance versus the FTSE 3-Month Treasury Bill Index ("Index"), as coupon payments on ABS investments offset spread widening, and CLO spreads tightened. Holdings of investment grade corporate credit, particularly financials, contributed to relative performance versus the Index, as investment grade corporate bonds had positive total returns. Overweight exposure to U.S. duration in the 1-year part of the curve contributed to relative performance versus the Index, as interest rates fell. Overweight exposure to U.K. duration in the 5-year part of the curve detracted from relative performance versus the Index, as interest rates rose. There were no other material detractors for this Fund.
|
| Performance Past Does Not Indicate Future [Text] |
Performance quoted represents past performance. Past performance is not a guarantee or a reliable indicator of future results.
|
| Line Graph [Table Text Block] |
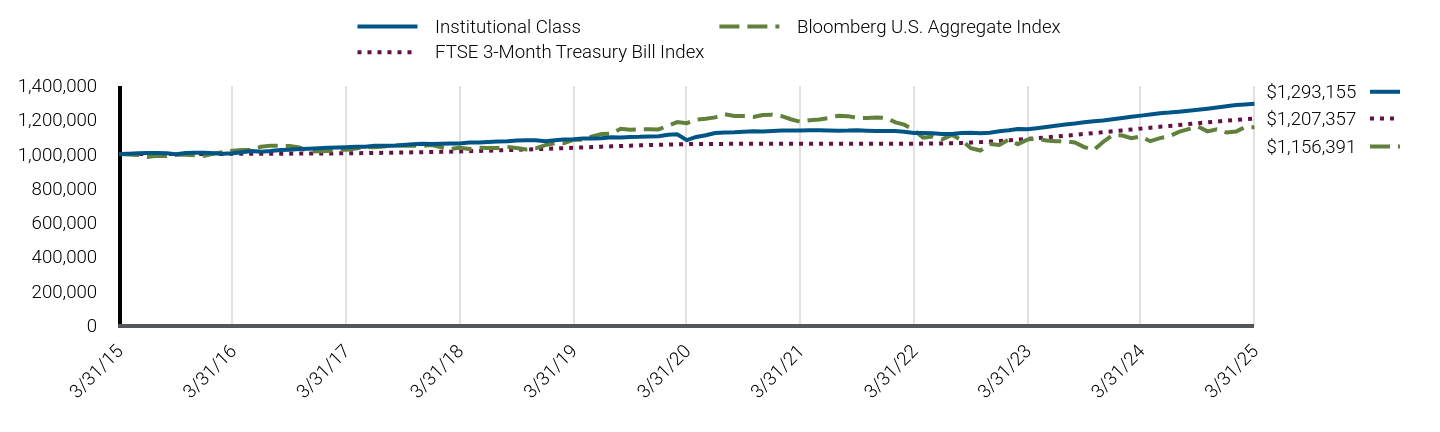
|
Institutional Class |
Bloomberg U.S. Aggregate Index |
FTSE 3-Month Treasury Bill Index |
3/31/15 |
$1,000,000 |
$1,000,000 |
$1,000,000 |
4/30/15 |
$1,001,834 |
$996,412 |
$1,000,016 |
5/31/15 |
$1,004,881 |
$994,012 |
$1,000,030 |
6/30/15 |
$1,005,934 |
$983,174 |
$1,000,041 |
7/31/15 |
$1,006,051 |
$990,008 |
$1,000,050 |
8/31/15 |
$1,004,163 |
$988,586 |
$1,000,075 |
9/30/15 |
$999,188 |
$995,273 |
$1,000,101 |
10/31/15 |
$1,005,584 |
$995,439 |
$1,000,125 |
11/30/15 |
$1,006,965 |
$992,809 |
$1,000,152 |
12/31/15 |
$1,007,840 |
$989,601 |
$1,000,229 |
1/31/16 |
$1,004,017 |
$1,003,219 |
$1,000,354 |
2/29/16 |
$1,001,159 |
$1,010,335 |
$1,000,534 |
3/31/16 |
$1,004,724 |
$1,019,605 |
$1,000,767 |
4/30/16 |
$1,010,526 |
$1,023,519 |
$1,001,004 |
5/31/16 |
$1,017,164 |
$1,023,781 |
$1,001,216 |
6/30/16 |
$1,013,568 |
$1,042,177 |
$1,001,416 |
7/31/16 |
$1,017,437 |
$1,048,765 |
$1,001,638 |
8/31/16 |
$1,023,413 |
$1,047,566 |
$1,001,877 |
9/30/16 |
$1,024,885 |
$1,046,952 |
$1,002,116 |
10/31/16 |
$1,028,480 |
$1,038,944 |
$1,002,369 |
11/30/16 |
$1,031,307 |
$1,014,369 |
$1,002,627 |
12/31/16 |
$1,033,743 |
$1,015,800 |
$1,002,938 |
1/31/17 |
$1,035,880 |
$1,017,793 |
$1,003,311 |
2/28/17 |
$1,038,250 |
$1,024,634 |
$1,003,703 |
3/31/17 |
$1,039,749 |
$1,024,097 |
$1,004,153 |
4/30/17 |
$1,042,216 |
$1,032,000 |
$1,004,663 |
5/31/17 |
$1,042,658 |
$1,039,943 |
$1,005,272 |
6/30/17 |
$1,047,494 |
$1,038,896 |
$1,005,984 |
7/31/17 |
$1,047,854 |
$1,043,367 |
$1,006,794 |
8/31/17 |
$1,048,302 |
$1,052,726 |
$1,007,683 |
9/30/17 |
$1,052,973 |
$1,047,712 |
$1,008,552 |
10/31/17 |
$1,056,697 |
$1,048,319 |
$1,009,463 |
11/30/17 |
$1,059,514 |
$1,046,973 |
$1,010,364 |
12/31/17 |
$1,058,882 |
$1,051,778 |
$1,011,376 |
1/31/18 |
$1,060,338 |
$1,039,665 |
$1,012,488 |
2/28/18 |
$1,061,932 |
$1,029,809 |
$1,013,578 |
3/31/18 |
$1,061,653 |
$1,036,414 |
$1,014,900 |
4/30/18 |
$1,066,719 |
$1,028,705 |
$1,016,269 |
5/31/18 |
$1,067,784 |
$1,036,047 |
$1,017,787 |
6/30/18 |
$1,069,927 |
$1,034,773 |
$1,019,327 |
7/31/18 |
$1,073,064 |
$1,035,019 |
$1,020,980 |
8/31/18 |
$1,074,455 |
$1,041,679 |
$1,022,701 |
9/30/18 |
$1,078,574 |
$1,034,971 |
$1,024,424 |
10/31/18 |
$1,080,734 |
$1,026,792 |
$1,026,288 |
11/30/18 |
$1,079,880 |
$1,032,921 |
$1,028,181 |
12/31/18 |
$1,074,825 |
$1,051,898 |
$1,030,216 |
1/31/19 |
$1,080,255 |
$1,063,068 |
$1,032,309 |
2/28/19 |
$1,084,674 |
$1,062,452 |
$1,034,221 |
3/31/19 |
$1,086,217 |
$1,082,853 |
$1,036,364 |
4/30/19 |
$1,089,900 |
$1,083,130 |
$1,038,451 |
5/31/19 |
$1,090,345 |
$1,102,358 |
$1,040,621 |
6/30/19 |
$1,091,535 |
$1,116,201 |
$1,042,721 |
7/31/19 |
$1,097,264 |
$1,118,657 |
$1,044,805 |
8/31/19 |
$1,096,330 |
$1,147,643 |
$1,046,791 |
9/30/19 |
$1,099,493 |
$1,141,531 |
$1,048,587 |
10/31/19 |
$1,100,435 |
$1,144,969 |
$1,050,362 |
11/30/19 |
$1,102,567 |
$1,144,386 |
$1,051,926 |
12/31/19 |
$1,104,073 |
$1,143,588 |
$1,053,424 |
1/31/20 |
$1,111,691 |
$1,165,596 |
$1,054,843 |
2/29/20 |
$1,115,670 |
$1,186,575 |
$1,056,175 |
3/31/20 |
$1,080,969 |
$1,179,592 |
$1,057,509 |
4/30/20 |
$1,099,623 |
$1,200,561 |
$1,058,376 |
5/31/20 |
$1,109,105 |
$1,206,151 |
$1,058,833 |
6/30/20 |
$1,122,884 |
$1,213,749 |
$1,058,937 |
7/31/20 |
$1,125,113 |
$1,231,878 |
$1,059,058 |
8/31/20 |
$1,127,144 |
$1,221,935 |
$1,059,176 |
9/30/20 |
$1,130,328 |
$1,221,265 |
$1,059,278 |
10/31/20 |
$1,133,429 |
$1,215,812 |
$1,059,369 |
11/30/20 |
$1,131,855 |
$1,227,742 |
$1,059,456 |
12/31/20 |
$1,134,319 |
$1,229,433 |
$1,059,538 |
1/31/21 |
$1,137,149 |
$1,220,618 |
$1,059,615 |
2/28/21 |
$1,136,598 |
$1,202,992 |
$1,059,676 |
3/31/21 |
$1,137,249 |
$1,187,971 |
$1,059,730 |
4/30/21 |
$1,137,951 |
$1,197,356 |
$1,059,766 |
5/31/21 |
$1,138,542 |
$1,201,268 |
$1,059,790 |
6/30/21 |
$1,136,803 |
$1,209,708 |
$1,059,806 |
7/31/21 |
$1,136,212 |
$1,223,233 |
$1,059,829 |
8/31/21 |
$1,136,732 |
$1,220,905 |
$1,059,862 |
9/30/21 |
$1,138,441 |
$1,210,334 |
$1,059,903 |
10/31/21 |
$1,135,529 |
$1,210,000 |
$1,059,941 |
11/30/21 |
$1,133,776 |
$1,213,580 |
$1,059,981 |
12/31/21 |
$1,134,402 |
$1,210,475 |
$1,060,025 |
1/31/22 |
$1,133,780 |
$1,184,396 |
$1,060,075 |
2/28/22 |
$1,129,779 |
$1,171,183 |
$1,060,155 |
3/31/22 |
$1,122,394 |
$1,138,645 |
$1,060,323 |
4/30/22 |
$1,122,293 |
$1,095,436 |
$1,060,623 |
5/31/22 |
$1,121,153 |
$1,102,499 |
$1,061,136 |
6/30/22 |
$1,116,734 |
$1,085,203 |
$1,061,852 |
7/31/22 |
$1,116,073 |
$1,111,719 |
$1,062,953 |
8/31/22 |
$1,122,484 |
$1,080,306 |
$1,064,534 |
9/30/22 |
$1,123,383 |
$1,033,630 |
$1,066,619 |
10/31/22 |
$1,120,910 |
$1,020,242 |
$1,069,261 |
11/30/22 |
$1,123,640 |
$1,057,762 |
$1,072,326 |
12/31/22 |
$1,133,277 |
$1,052,991 |
$1,075,945 |
1/31/23 |
$1,138,716 |
$1,085,385 |
$1,079,916 |
2/28/23 |
$1,145,608 |
$1,057,322 |
$1,083,683 |
3/31/23 |
$1,144,703 |
$1,084,180 |
$1,088,015 |
4/30/23 |
$1,150,748 |
$1,090,751 |
$1,092,346 |
5/31/23 |
$1,157,505 |
$1,078,874 |
$1,096,968 |
6/30/23 |
$1,164,732 |
$1,075,027 |
$1,101,639 |
7/31/23 |
$1,171,640 |
$1,074,277 |
$1,106,658 |
8/31/23 |
$1,177,802 |
$1,067,415 |
$1,111,804 |
9/30/23 |
$1,185,383 |
$1,040,290 |
$1,116,824 |
10/31/23 |
$1,191,681 |
$1,023,873 |
$1,122,085 |
11/30/23 |
$1,195,606 |
$1,070,241 |
$1,127,216 |
12/31/23 |
$1,202,199 |
$1,111,209 |
$1,132,519 |
1/31/24 |
$1,209,755 |
$1,108,157 |
$1,137,809 |
2/29/24 |
$1,217,347 |
$1,092,501 |
$1,142,751 |
3/31/24 |
$1,223,973 |
$1,102,589 |
$1,148,046 |
4/30/24 |
$1,230,625 |
$1,074,739 |
$1,153,200 |
5/31/24 |
$1,237,821 |
$1,092,959 |
$1,158,559 |
6/30/24 |
$1,241,661 |
$1,103,307 |
$1,163,774 |
7/31/24 |
$1,247,181 |
$1,129,077 |
$1,169,185 |
8/31/24 |
$1,253,048 |
$1,145,301 |
$1,174,577 |
9/30/24 |
$1,258,116 |
$1,160,636 |
$1,179,725 |
10/31/24 |
$1,264,733 |
$1,131,854 |
$1,184,817 |
11/30/24 |
$1,271,372 |
$1,143,821 |
$1,189,527 |
12/31/24 |
$1,279,297 |
$1,125,101 |
$1,194,204 |
1/31/25 |
$1,285,920 |
$1,131,070 |
$1,198,799 |
2/28/25 |
$1,289,492 |
$1,155,956 |
$1,202,884 |
3/31/25 |
$1,293,155 |
$1,156,391 |
$1,207,357 |
|
| Average Annual Return [Table Text Block] |
Class/Index Name |
1 Year |
5 Years |
10 Years |
Institutional Class |
5.65% |
3.65% |
2.60% |
Bloomberg U.S. Aggregate Index |
4.88% |
(0.40%) |
1.46% |
FTSE 3-Month Treasury Bill Index |
5.17% |
2.69% |
1.90% | |
| No Deduction of Taxes [Text Block] |
Returns shown do not reflect the deduction of taxes that a shareholder would pay on Fund distributions or the redemption of Fund shares.
|
| Performance Table Market Index Changed [Text Block] |
Differences in the Fund’s performance versus an index and related attribution information with respect to particular categories of securities or individual positions may be attributable, in part, to differences in the pricing methodologies used by the Fund and the index.
|
| Updated Performance Information Location [Text Block] |
For performance current to the most recent month-end, visit www.pimco.com/literature or via 888.87.PIMCO (888.877.4626).
|
| AssetsNet |
$ 9,789,626,000
|
| Holdings Count | Holding |
1,288
|
| Advisory Fees Paid, Amount |
$ 25,342,000
|
| InvestmentCompanyPortfolioTurnover |
108.00%
|
| Additional Fund Statistics [Text Block] |
Key Fund StatisticsFootnote Reference† (as of the end of the reporting period)
Total Net Assets |
$9,789,626 |
# of Portfolio Holdings |
1,288 |
Portfolio Turnover Rate |
108% |
Total Net Advisory Fees Paid During the Reporting Period |
$25,342 |
| Footnote |
Description |
Footnote† |
Dollar amounts displayed in 000's | |
| Holdings [Text Block] |
Security Type Breakdown (% of Net Asset Value)Footnote Reference*
Corporate Bonds & Notes |
52.8% |
Asset-Backed Securities |
21.5% |
U.S. Government Agencies |
16.7% |
Non-Agency Mortgage-Backed Securities |
9.0% |
Sovereign Issues |
2.2% |
U.S. Treasury Obligations |
0.7% |
Municipal Bonds & Notes |
0.3% |
Short-Term Instruments |
26.5% |
Affiliated Investments |
0.1% |
Financial Derivative Instruments |
0.0%Footnote Reference^ |
Other Assets and Liabilities, Net |
(29.8%) |
Total |
100.0% |
| Footnote |
Description |
Footnote^ |
Rounded value of investments is less than 0.1% of net assets. |
Footnote* |
% of Net Asset Value includes derivatives instruments, if any, valued at the value used for determining the Fund's net asset value. The notional exposure of such derivatives investments therefore may be greater than what is depicted. | |
| Material Fund Change [Text Block] |
|
| C000064151 |
|
| Shareholder Report [Line Items] |
|
| Fund Name |
PIMCO Short-Term Fund
|
| Class Name |
I-2
|
| Trading Symbol |
PTSPX
|
| Annual or Semi-Annual Statement [Text Block] |
This annual shareholder report contains important information about the PIMCO Short-Term Fund (the "Fund") for the period of April 1, 2024 to March 31, 2025 (the "reporting period").
|
| Shareholder Report Annual or Semi-Annual |
Annual Shareholder Report
|
| Additional Information [Text Block] |
You can find additional information about the Fund at www.pimco.com/literature. You can also request this information by contacting us at 888.87.PIMCO (888.877.4626).
|
| Additional Information Phone Number |
888.87.PIMCO (888.877.4626)
|
| Expenses [Text Block] |
What were the Fund costs for the reporting period?(based on a hypothetical $10,000 investment)
Class Name |
Cost of a $10,000 investment |
Costs paid as a percentage of a $10,000 investment |
I-2 |
$61 |
0.59% | |
| Expenses Paid, Amount |
$ 61
|
| Expense Ratio, Percent |
0.59%
|
| Factors Affecting Performance [Text Block] |
How did the Fund perform during the reporting period and what affected its performance?The following affected performance (on a gross basis) during the reporting period: Select holdings of securitized credit, particularly asset-based securities (“ABS”) and collateralized loan obligations (“CLO”) contributed to relative performance versus the FTSE 3-Month Treasury Bill Index ("Index"), as coupon payments on ABS investments offset spread widening, and CLO spreads tightened. Holdings of investment grade corporate credit, particularly financials, contributed to relative performance versus the Index, as investment grade corporate bonds had positive total returns. Overweight exposure to U.S. duration in the 1-year part of the curve contributed to relative performance versus the Index, as interest rates fell. Overweight exposure to U.K. duration in the 5-year part of the curve detracted from relative performance versus the Index, as interest rates rose. There were no other material detractors for this Fund.
|
| Performance Past Does Not Indicate Future [Text] |
Performance quoted represents past performance. Past performance is not a guarantee or a reliable indicator of future results.
|
| Line Graph [Table Text Block] |
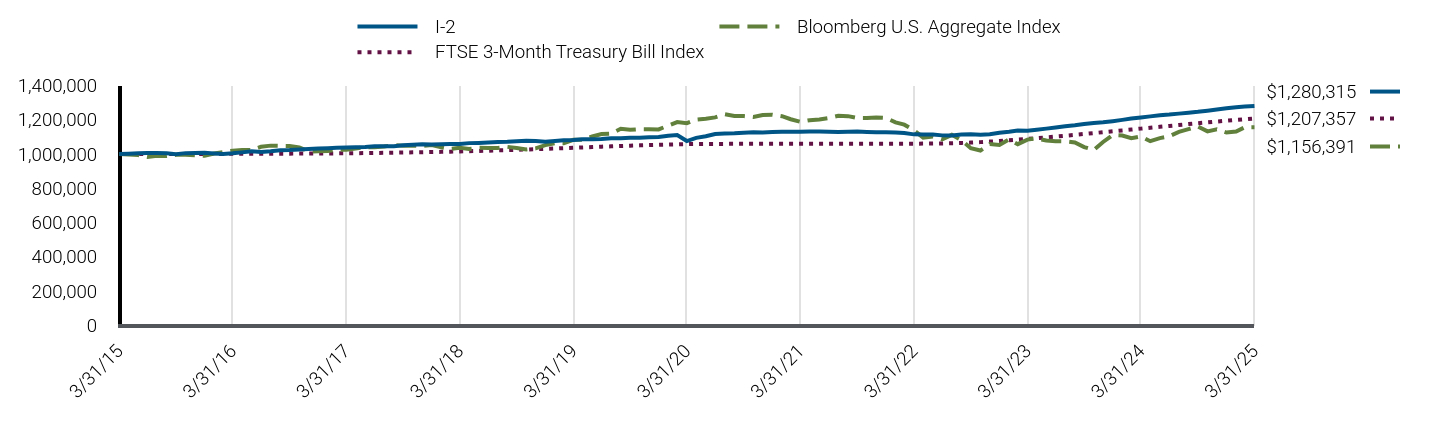
|
I-2 |
Bloomberg U.S. Aggregate Index |
FTSE 3-Month Treasury Bill Index |
3/31/15 |
$1,000,000 |
$1,000,000 |
$1,000,000 |
4/30/15 |
$1,001,752 |
$996,412 |
$1,000,016 |
5/31/15 |
$1,004,714 |
$994,012 |
$1,000,030 |
6/30/15 |
$1,005,685 |
$983,174 |
$1,000,041 |
7/31/15 |
$1,005,712 |
$990,008 |
$1,000,050 |
8/31/15 |
$1,003,740 |
$988,586 |
$1,000,075 |
9/30/15 |
$998,685 |
$995,273 |
$1,000,101 |
10/31/15 |
$1,004,989 |
$995,439 |
$1,000,125 |
11/30/15 |
$1,006,290 |
$992,809 |
$1,000,152 |
12/31/15 |
$1,007,071 |
$989,601 |
$1,000,229 |
1/31/16 |
$1,003,171 |
$1,003,219 |
$1,000,354 |
2/29/16 |
$1,000,236 |
$1,010,335 |
$1,000,534 |
3/31/16 |
$1,003,713 |
$1,019,605 |
$1,000,767 |
4/30/16 |
$1,009,424 |
$1,023,519 |
$1,001,004 |
5/31/16 |
$1,015,971 |
$1,023,781 |
$1,001,216 |
6/30/16 |
$1,012,296 |
$1,042,177 |
$1,001,416 |
7/31/16 |
$1,016,075 |
$1,048,765 |
$1,001,638 |
8/31/16 |
$1,021,958 |
$1,047,566 |
$1,001,877 |
9/30/16 |
$1,023,339 |
$1,046,952 |
$1,002,116 |
10/31/16 |
$1,026,846 |
$1,038,944 |
$1,002,369 |
11/30/16 |
$1,029,596 |
$1,014,369 |
$1,002,627 |
12/31/16 |
$1,031,935 |
$1,015,800 |
$1,002,938 |
1/31/17 |
$1,033,986 |
$1,017,793 |
$1,003,311 |
2/28/17 |
$1,036,273 |
$1,024,634 |
$1,003,703 |
3/31/17 |
$1,037,674 |
$1,024,097 |
$1,004,153 |
4/30/17 |
$1,040,056 |
$1,032,000 |
$1,004,663 |
5/31/17 |
$1,040,408 |
$1,039,943 |
$1,005,272 |
6/30/17 |
$1,045,143 |
$1,038,896 |
$1,005,984 |
7/31/17 |
$1,045,419 |
$1,043,367 |
$1,006,794 |
8/31/17 |
$1,045,777 |
$1,052,726 |
$1,007,683 |
9/30/17 |
$1,050,347 |
$1,047,712 |
$1,008,552 |
10/31/17 |
$1,053,976 |
$1,048,319 |
$1,009,463 |
11/30/17 |
$1,056,699 |
$1,046,973 |
$1,010,364 |
12/31/17 |
$1,055,971 |
$1,051,778 |
$1,011,376 |
1/31/18 |
$1,057,330 |
$1,039,665 |
$1,012,488 |
2/28/18 |
$1,058,839 |
$1,029,809 |
$1,013,578 |
3/31/18 |
$1,058,467 |
$1,036,414 |
$1,014,900 |
4/30/18 |
$1,063,434 |
$1,028,705 |
$1,016,269 |
5/31/18 |
$1,064,405 |
$1,036,047 |
$1,017,787 |
6/30/18 |
$1,066,450 |
$1,034,773 |
$1,019,327 |
7/31/18 |
$1,069,490 |
$1,035,019 |
$1,020,980 |
8/31/18 |
$1,070,777 |
$1,041,679 |
$1,022,701 |
9/30/18 |
$1,074,803 |
$1,034,971 |
$1,024,424 |
10/31/18 |
$1,076,866 |
$1,026,792 |
$1,026,288 |
11/30/18 |
$1,075,920 |
$1,032,921 |
$1,028,181 |
12/31/18 |
$1,070,796 |
$1,051,898 |
$1,030,216 |
1/31/19 |
$1,076,118 |
$1,063,068 |
$1,032,309 |
2/28/19 |
$1,080,438 |
$1,062,452 |
$1,034,221 |
3/31/19 |
$1,081,883 |
$1,082,853 |
$1,036,364 |
4/30/19 |
$1,085,463 |
$1,083,130 |
$1,038,451 |
5/31/19 |
$1,085,811 |
$1,102,358 |
$1,040,621 |
6/30/19 |
$1,086,913 |
$1,116,201 |
$1,042,721 |
7/31/19 |
$1,092,525 |
$1,118,657 |
$1,044,805 |
8/31/19 |
$1,091,498 |
$1,147,643 |
$1,046,791 |
9/30/19 |
$1,094,563 |
$1,141,531 |
$1,048,587 |
10/31/19 |
$1,095,408 |
$1,144,969 |
$1,050,362 |
11/30/19 |
$1,097,437 |
$1,144,386 |
$1,051,926 |
12/31/19 |
$1,098,844 |
$1,143,588 |
$1,053,424 |
1/31/20 |
$1,106,330 |
$1,165,596 |
$1,054,843 |
2/29/20 |
$1,110,204 |
$1,186,575 |
$1,056,175 |
3/31/20 |
$1,075,585 |
$1,179,592 |
$1,057,509 |
4/30/20 |
$1,094,058 |
$1,200,561 |
$1,058,376 |
5/31/20 |
$1,103,398 |
$1,206,151 |
$1,058,833 |
6/30/20 |
$1,117,015 |
$1,213,749 |
$1,058,937 |
7/31/20 |
$1,119,132 |
$1,231,878 |
$1,059,058 |
8/31/20 |
$1,121,062 |
$1,221,935 |
$1,059,176 |
9/30/20 |
$1,124,137 |
$1,221,265 |
$1,059,278 |
10/31/20 |
$1,127,121 |
$1,215,812 |
$1,059,369 |
11/30/20 |
$1,125,467 |
$1,227,742 |
$1,059,456 |
12/31/20 |
$1,127,812 |
$1,229,433 |
$1,059,538 |
1/31/21 |
$1,130,539 |
$1,220,618 |
$1,059,615 |
2/28/21 |
$1,129,904 |
$1,202,992 |
$1,059,676 |
3/31/21 |
$1,130,456 |
$1,187,971 |
$1,059,730 |
4/30/21 |
$1,131,054 |
$1,197,356 |
$1,059,766 |
5/31/21 |
$1,131,552 |
$1,201,268 |
$1,059,790 |
6/30/21 |
$1,129,731 |
$1,209,708 |
$1,059,806 |
7/31/21 |
$1,129,045 |
$1,223,233 |
$1,059,829 |
8/31/21 |
$1,129,469 |
$1,220,905 |
$1,059,862 |
9/30/21 |
$1,131,074 |
$1,210,334 |
$1,059,903 |
10/31/21 |
$1,128,084 |
$1,210,000 |
$1,059,941 |
11/30/21 |
$1,126,251 |
$1,213,580 |
$1,059,981 |
12/31/21 |
$1,126,771 |
$1,210,475 |
$1,060,025 |
1/31/22 |
$1,126,063 |
$1,184,396 |
$1,060,075 |
2/28/22 |
$1,122,004 |
$1,171,183 |
$1,060,155 |
3/31/22 |
$1,114,573 |
$1,138,645 |
$1,060,323 |
4/30/22 |
$1,114,380 |
$1,095,436 |
$1,060,623 |
5/31/22 |
$1,113,157 |
$1,102,499 |
$1,061,136 |
6/30/22 |
$1,108,677 |
$1,085,203 |
$1,061,852 |
7/31/22 |
$1,107,927 |
$1,111,719 |
$1,062,953 |
8/31/22 |
$1,114,197 |
$1,080,306 |
$1,064,534 |
9/30/22 |
$1,114,992 |
$1,033,630 |
$1,066,619 |
10/31/22 |
$1,112,450 |
$1,020,242 |
$1,069,261 |
11/30/22 |
$1,115,069 |
$1,057,762 |
$1,072,326 |
12/31/22 |
$1,124,531 |
$1,052,991 |
$1,075,945 |
1/31/23 |
$1,129,838 |
$1,085,385 |
$1,079,916 |
2/28/23 |
$1,136,589 |
$1,057,322 |
$1,083,683 |
3/31/23 |
$1,135,589 |
$1,084,180 |
$1,088,015 |
4/30/23 |
$1,141,499 |
$1,090,751 |
$1,092,346 |
5/31/23 |
$1,148,105 |
$1,078,874 |
$1,096,968 |
6/30/23 |
$1,155,173 |
$1,075,027 |
$1,101,639 |
7/31/23 |
$1,161,932 |
$1,074,277 |
$1,106,658 |
8/31/23 |
$1,167,945 |
$1,067,415 |
$1,111,804 |
9/30/23 |
$1,175,363 |
$1,040,290 |
$1,116,824 |
10/31/23 |
$1,181,511 |
$1,023,873 |
$1,122,085 |
11/30/23 |
$1,185,306 |
$1,070,241 |
$1,127,216 |
12/31/23 |
$1,191,738 |
$1,111,209 |
$1,132,519 |
1/31/24 |
$1,199,130 |
$1,108,157 |
$1,137,809 |
2/29/24 |
$1,206,561 |
$1,092,501 |
$1,142,751 |
3/31/24 |
$1,213,026 |
$1,102,589 |
$1,148,046 |
4/30/24 |
$1,219,518 |
$1,074,739 |
$1,153,200 |
5/31/24 |
$1,226,540 |
$1,092,959 |
$1,158,559 |
6/30/24 |
$1,230,251 |
$1,103,307 |
$1,163,774 |
7/31/24 |
$1,235,616 |
$1,129,077 |
$1,169,185 |
8/31/24 |
$1,241,316 |
$1,145,301 |
$1,174,577 |
9/30/24 |
$1,246,242 |
$1,160,636 |
$1,179,725 |
10/31/24 |
$1,252,690 |
$1,131,854 |
$1,184,817 |
11/30/24 |
$1,259,160 |
$1,143,821 |
$1,189,527 |
12/31/24 |
$1,266,902 |
$1,125,101 |
$1,194,204 |
1/31/25 |
$1,273,351 |
$1,131,070 |
$1,198,799 |
2/28/25 |
$1,276,789 |
$1,155,956 |
$1,202,884 |
3/31/25 |
$1,280,315 |
$1,156,391 |
$1,207,357 |
|
| Average Annual Return [Table Text Block] |
Class/Index Name |
1 Year |
5 Years |
10 Years |
I-2 |
5.55% |
3.55% |
2.50% |
Bloomberg U.S. Aggregate Index |
4.88% |
(0.40%) |
1.46% |
FTSE 3-Month Treasury Bill Index |
5.17% |
2.69% |
1.90% | |
| No Deduction of Taxes [Text Block] |
Returns shown do not reflect the deduction of taxes that a shareholder would pay on Fund distributions or the redemption of Fund shares.
|
| Performance Table Market Index Changed [Text Block] |
Differences in the Fund’s performance versus an index and related attribution information with respect to particular categories of securities or individual positions may be attributable, in part, to differences in the pricing methodologies used by the Fund and the index.
|
| Updated Performance Information Location [Text Block] |
For performance current to the most recent month-end, visit www.pimco.com/literature or via 888.87.PIMCO (888.877.4626).
|
| AssetsNet |
$ 9,789,626,000
|
| Holdings Count | Holding |
1,288
|
| Advisory Fees Paid, Amount |
$ 25,342,000
|
| InvestmentCompanyPortfolioTurnover |
108.00%
|
| Additional Fund Statistics [Text Block] |
Key Fund StatisticsFootnote Reference† (as of the end of the reporting period)
Total Net Assets |
$9,789,626 |
# of Portfolio Holdings |
1,288 |
Portfolio Turnover Rate |
108% |
Total Net Advisory Fees Paid During the Reporting Period |
$25,342 |
| Footnote |
Description |
Footnote† |
Dollar amounts displayed in 000's | |
| Holdings [Text Block] |
Security Type Breakdown (% of Net Asset Value)Footnote Reference*
Corporate Bonds & Notes |
52.8% |
Asset-Backed Securities |
21.5% |
U.S. Government Agencies |
16.7% |
Non-Agency Mortgage-Backed Securities |
9.0% |
Sovereign Issues |
2.2% |
U.S. Treasury Obligations |
0.7% |
Municipal Bonds & Notes |
0.3% |
Short-Term Instruments |
26.5% |
Affiliated Investments |
0.1% |
Financial Derivative Instruments |
0.0%Footnote Reference^ |
Other Assets and Liabilities, Net |
(29.8%) |
Total |
100.0% |
| Footnote |
Description |
Footnote^ |
Rounded value of investments is less than 0.1% of net assets. |
Footnote* |
% of Net Asset Value includes derivatives instruments, if any, valued at the value used for determining the Fund's net asset value. The notional exposure of such derivatives investments therefore may be greater than what is depicted. | |
| Material Fund Change [Text Block] |
|
| C000026629 |
|
| Shareholder Report [Line Items] |
|
| Fund Name |
PIMCO Short-Term Fund
|
| Class Name |
Class R
|
| Trading Symbol |
PTSRX
|
| Annual or Semi-Annual Statement [Text Block] |
This annual shareholder report contains important information about the PIMCO Short-Term Fund (the "Fund") for the period of April 1, 2024 to March 31, 2025 (the "reporting period").
|
| Shareholder Report Annual or Semi-Annual |
Annual Shareholder Report
|
| Additional Information [Text Block] |
You can find additional information about the Fund at www.pimco.com/literature. You can also request this information by contacting us at 888.87.PIMCO (888.877.4626).
|
| Additional Information Phone Number |
888.87.PIMCO (888.877.4626)
|
| Expenses [Text Block] |
What were the Fund costs for the reporting period?(based on a hypothetical $10,000 investment)
Class Name |
Cost of a $10,000 investment |
Costs paid as a percentage of a $10,000 investment |
Class R |
$102 |
0.99% | |
| Expenses Paid, Amount |
$ 102
|
| Expense Ratio, Percent |
0.99%
|
| Factors Affecting Performance [Text Block] |
How did the Fund perform during the reporting period and what affected its performance?The following affected performance (on a gross basis) during the reporting period: Select holdings of securitized credit, particularly asset-based securities (“ABS”) and collateralized loan obligations (“CLO”) contributed to relative performance versus the FTSE 3-Month Treasury Bill Index ("Index"), as coupon payments on ABS investments offset spread widening, and CLO spreads tightened. Holdings of investment grade corporate credit, particularly financials, contributed to relative performance versus the Index, as investment grade corporate bonds had positive total returns. Overweight exposure to U.S. duration in the 1-year part of the curve contributed to relative performance versus the Index, as interest rates fell. Overweight exposure to U.K. duration in the 5-year part of the curve detracted from relative performance versus the Index, as interest rates rose. There were no other material detractors for this Fund.
|
| Performance Past Does Not Indicate Future [Text] |
Performance quoted represents past performance. Past performance is not a guarantee or a reliable indicator of future results.
|
| Line Graph [Table Text Block] |
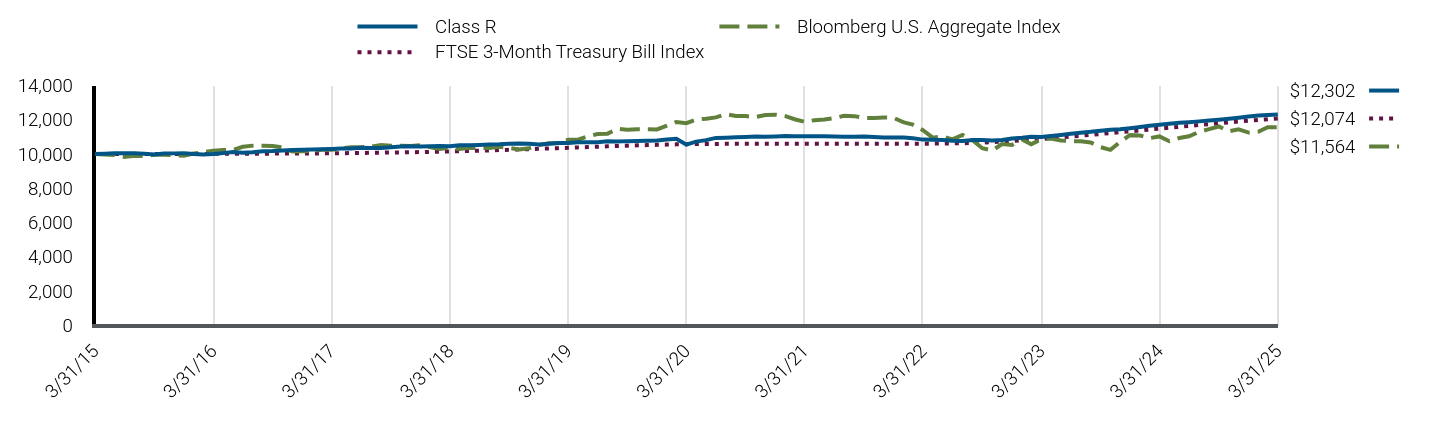
|
Class R |
Bloomberg U.S. Aggregate Index |
FTSE 3-Month Treasury Bill Index |
3/31/15 |
$10,000 |
$10,000 |
$10,000 |
4/30/15 |
$10,014 |
$9,964 |
$10,000 |
5/31/15 |
$10,040 |
$9,940 |
$10,000 |
6/30/15 |
$10,047 |
$9,832 |
$10,000 |
7/31/15 |
$10,044 |
$9,900 |
$10,001 |
8/31/15 |
$10,021 |
$9,886 |
$10,001 |
9/30/15 |
$9,967 |
$9,953 |
$10,001 |
10/31/15 |
$10,026 |
$9,954 |
$10,001 |
11/30/15 |
$10,036 |
$9,928 |
$10,002 |
12/31/15 |
$10,040 |
$9,896 |
$10,002 |
1/31/16 |
$9,998 |
$10,032 |
$10,004 |
2/29/16 |
$9,966 |
$10,103 |
$10,005 |
3/31/16 |
$9,997 |
$10,196 |
$10,008 |
4/30/16 |
$10,051 |
$10,235 |
$10,010 |
5/31/16 |
$10,113 |
$10,238 |
$10,012 |
6/30/16 |
$10,073 |
$10,422 |
$10,014 |
7/31/16 |
$10,107 |
$10,488 |
$10,016 |
8/31/16 |
$10,162 |
$10,476 |
$10,019 |
9/30/16 |
$10,172 |
$10,470 |
$10,021 |
10/31/16 |
$10,204 |
$10,389 |
$10,024 |
11/30/16 |
$10,228 |
$10,144 |
$10,026 |
12/31/16 |
$10,247 |
$10,158 |
$10,029 |
1/31/17 |
$10,264 |
$10,178 |
$10,033 |
2/28/17 |
$10,284 |
$10,246 |
$10,037 |
3/31/17 |
$10,294 |
$10,241 |
$10,042 |
4/30/17 |
$10,315 |
$10,320 |
$10,047 |
5/31/17 |
$10,315 |
$10,399 |
$10,053 |
6/30/17 |
$10,358 |
$10,389 |
$10,060 |
7/31/17 |
$10,357 |
$10,434 |
$10,068 |
8/31/17 |
$10,357 |
$10,527 |
$10,077 |
9/30/17 |
$10,399 |
$10,477 |
$10,086 |
10/31/17 |
$10,432 |
$10,483 |
$10,095 |
11/30/17 |
$10,455 |
$10,470 |
$10,104 |
12/31/17 |
$10,444 |
$10,518 |
$10,114 |
1/31/18 |
$10,454 |
$10,397 |
$10,125 |
2/28/18 |
$10,466 |
$10,298 |
$10,136 |
3/31/18 |
$10,459 |
$10,364 |
$10,149 |
4/30/18 |
$10,504 |
$10,287 |
$10,163 |
5/31/18 |
$10,510 |
$10,360 |
$10,178 |
6/30/18 |
$10,527 |
$10,348 |
$10,193 |
7/31/18 |
$10,554 |
$10,350 |
$10,210 |
8/31/18 |
$10,562 |
$10,417 |
$10,227 |
9/30/18 |
$10,599 |
$10,350 |
$10,244 |
10/31/18 |
$10,616 |
$10,268 |
$10,263 |
11/30/18 |
$10,603 |
$10,329 |
$10,282 |
12/31/18 |
$10,549 |
$10,519 |
$10,302 |
1/31/19 |
$10,598 |
$10,631 |
$10,323 |
2/28/19 |
$10,637 |
$10,625 |
$10,342 |
3/31/19 |
$10,647 |
$10,829 |
$10,364 |
4/30/19 |
$10,679 |
$10,831 |
$10,385 |
5/31/19 |
$10,679 |
$11,024 |
$10,406 |
6/30/19 |
$10,686 |
$11,162 |
$10,427 |
7/31/19 |
$10,738 |
$11,187 |
$10,448 |
8/31/19 |
$10,724 |
$11,476 |
$10,468 |
9/30/19 |
$10,751 |
$11,415 |
$10,486 |
10/31/19 |
$10,756 |
$11,450 |
$10,504 |
11/30/19 |
$10,772 |
$11,444 |
$10,519 |
12/31/19 |
$10,782 |
$11,436 |
$10,534 |
1/31/20 |
$10,852 |
$11,656 |
$10,548 |
2/29/20 |
$10,886 |
$11,866 |
$10,562 |
3/31/20 |
$10,543 |
$11,796 |
$10,575 |
4/30/20 |
$10,721 |
$12,006 |
$10,584 |
5/31/20 |
$10,809 |
$12,062 |
$10,588 |
6/30/20 |
$10,939 |
$12,137 |
$10,589 |
7/31/20 |
$10,955 |
$12,319 |
$10,591 |
8/31/20 |
$10,971 |
$12,219 |
$10,592 |
9/30/20 |
$10,997 |
$12,213 |
$10,593 |
10/31/20 |
$11,023 |
$12,158 |
$10,594 |
11/30/20 |
$11,003 |
$12,277 |
$10,595 |
12/31/20 |
$11,022 |
$12,294 |
$10,595 |
1/31/21 |
$11,045 |
$12,206 |
$10,596 |
2/28/21 |
$11,035 |
$12,030 |
$10,597 |
3/31/21 |
$11,037 |
$11,880 |
$10,597 |
4/30/21 |
$11,039 |
$11,974 |
$10,598 |
5/31/21 |
$11,040 |
$12,013 |
$10,598 |
6/30/21 |
$11,019 |
$12,097 |
$10,598 |
7/31/21 |
$11,008 |
$12,232 |
$10,598 |
8/31/21 |
$11,009 |
$12,209 |
$10,599 |
9/30/21 |
$11,021 |
$12,103 |
$10,599 |
10/31/21 |
$10,988 |
$12,100 |
$10,599 |
11/30/21 |
$10,967 |
$12,136 |
$10,600 |
12/31/21 |
$10,968 |
$12,105 |
$10,600 |
1/31/22 |
$10,957 |
$11,844 |
$10,601 |
2/28/22 |
$10,915 |
$11,712 |
$10,602 |
3/31/22 |
$10,839 |
$11,386 |
$10,603 |
4/30/22 |
$10,833 |
$10,954 |
$10,606 |
5/31/22 |
$10,818 |
$11,025 |
$10,611 |
6/30/22 |
$10,771 |
$10,852 |
$10,619 |
7/31/22 |
$10,760 |
$11,117 |
$10,630 |
8/31/22 |
$10,817 |
$10,803 |
$10,645 |
9/30/22 |
$10,821 |
$10,336 |
$10,666 |
10/31/22 |
$10,793 |
$10,202 |
$10,693 |
11/30/22 |
$10,815 |
$10,578 |
$10,723 |
12/31/22 |
$10,902 |
$10,530 |
$10,759 |
1/31/23 |
$10,950 |
$10,854 |
$10,799 |
2/28/23 |
$11,012 |
$10,573 |
$10,837 |
3/31/23 |
$10,999 |
$10,842 |
$10,880 |
4/30/23 |
$11,053 |
$10,908 |
$10,923 |
5/31/23 |
$11,113 |
$10,789 |
$10,970 |
6/30/23 |
$11,177 |
$10,750 |
$11,016 |
7/31/23 |
$11,239 |
$10,743 |
$11,067 |
8/31/23 |
$11,294 |
$10,674 |
$11,118 |
9/30/23 |
$11,361 |
$10,403 |
$11,168 |
10/31/23 |
$11,417 |
$10,239 |
$11,221 |
11/30/23 |
$11,450 |
$10,702 |
$11,272 |
12/31/23 |
$11,508 |
$11,112 |
$11,325 |
1/31/24 |
$11,576 |
$11,082 |
$11,378 |
2/29/24 |
$11,644 |
$10,925 |
$11,428 |
3/31/24 |
$11,702 |
$11,026 |
$11,480 |
4/30/24 |
$11,761 |
$10,747 |
$11,532 |
5/31/24 |
$11,824 |
$10,930 |
$11,586 |
6/30/24 |
$11,857 |
$11,033 |
$11,638 |
7/31/24 |
$11,904 |
$11,291 |
$11,692 |
8/31/24 |
$11,955 |
$11,453 |
$11,746 |
9/30/24 |
$11,999 |
$11,606 |
$11,797 |
10/31/24 |
$12,057 |
$11,319 |
$11,848 |
11/30/24 |
$12,115 |
$11,438 |
$11,895 |
12/31/24 |
$12,185 |
$11,251 |
$11,942 |
1/31/25 |
$12,243 |
$11,311 |
$11,988 |
2/28/25 |
$12,272 |
$11,560 |
$12,029 |
3/31/25 |
$12,302 |
$11,564 |
$12,074 |
|
| Average Annual Return [Table Text Block] |
Class/Index Name |
1 Year |
5 Years |
10 Years |
Class R |
5.13% |
3.13% |
2.09% |
Bloomberg U.S. Aggregate Index |
4.88% |
(0.40%) |
1.46% |
FTSE 3-Month Treasury Bill Index |
5.17% |
2.69% |
1.90% | |
| No Deduction of Taxes [Text Block] |
Returns shown do not reflect the deduction of taxes that a shareholder would pay on Fund distributions or the redemption of Fund shares.
|
| Performance Table Market Index Changed [Text Block] |
Differences in the Fund’s performance versus an index and related attribution information with respect to particular categories of securities or individual positions may be attributable, in part, to differences in the pricing methodologies used by the Fund and the index.
|
| Updated Performance Information Location [Text Block] |
For performance current to the most recent month-end, visit www.pimco.com/literature or via 888.87.PIMCO (888.877.4626).
|
| AssetsNet |
$ 9,789,626,000
|
| Holdings Count | Holding |
1,288
|
| Advisory Fees Paid, Amount |
$ 25,342,000
|
| InvestmentCompanyPortfolioTurnover |
108.00%
|
| Additional Fund Statistics [Text Block] |
Key Fund StatisticsFootnote Reference† (as of the end of the reporting period)
Total Net Assets |
$9,789,626 |
# of Portfolio Holdings |
1,288 |
Portfolio Turnover Rate |
108% |
Total Net Advisory Fees Paid During the Reporting Period |
$25,342 |
| Footnote |
Description |
Footnote† |
Dollar amounts displayed in 000's | |
| Holdings [Text Block] |
Security Type Breakdown (% of Net Asset Value)Footnote Reference*
Corporate Bonds & Notes |
52.8% |
Asset-Backed Securities |
21.5% |
U.S. Government Agencies |
16.7% |
Non-Agency Mortgage-Backed Securities |
9.0% |
Sovereign Issues |
2.2% |
U.S. Treasury Obligations |
0.7% |
Municipal Bonds & Notes |
0.3% |
Short-Term Instruments |
26.5% |
Affiliated Investments |
0.1% |
Financial Derivative Instruments |
0.0%Footnote Reference^ |
Other Assets and Liabilities, Net |
(29.8%) |
Total |
100.0% |
| Footnote |
Description |
Footnote^ |
Rounded value of investments is less than 0.1% of net assets. |
Footnote* |
% of Net Asset Value includes derivatives instruments, if any, valued at the value used for determining the Fund's net asset value. The notional exposure of such derivatives investments therefore may be greater than what is depicted. | |
| Material Fund Change [Text Block] |
|
| C000132360 |
|
| Shareholder Report [Line Items] |
|
| Fund Name |
PIMCO TRENDS Managed Futures Strategy Fund
|
| Class Name |
Class A
|
| Trading Symbol |
PQTAX
|
| Annual or Semi-Annual Statement [Text Block] |
This annual shareholder report contains important information about the PIMCO TRENDS Managed Futures Strategy Fund (the "Fund") for the period of April 1, 2024 to March 31, 2025 (the "reporting period").
|
| Shareholder Report Annual or Semi-Annual |
Annual Shareholder Report
|
| Additional Information [Text Block] |
You can find additional information about the Fund at www.pimco.com/literature. You can also request this information by contacting us at 888.87.PIMCO (888.877.4626).
|
| Material Fund Change Notice [Text Block] |
This report describes changes to the Fund that occurred during the reporting period.
|
| Additional Information Phone Number |
888.87.PIMCO (888.877.4626)
|
| Expenses [Text Block] |
What were the Fund costs for the reporting period?(based on a hypothetical $10,000 investment)
Class Name |
Cost of a $10,000 investment |
Costs paid as a percentage of a $10,000 investment |
Class A |
$183 |
1.94% | |
| Expenses Paid, Amount |
$ 183
|
| Expense Ratio, Percent |
1.94%
|
| Factors Affecting Performance [Text Block] |
How did the Fund perform during the reporting period and what affected its performance?The following affected performance (on a gross basis) during the reporting period: Positioning across global interest rates, notably in United Kingdom, Canadian, and Hungarian rates, detracted from performance, as rates reversed sharply. Positioning in energy commodities, notably German power and European Union Allowances, detracted from performance, as prices reversed sharply. Long positions across equity indices in Japan and the U.S. detracted from performance, as prices declined, and short positions in Chinese equities also detracted from performance, as prices increased. Short positions in Canadian dollar and developed market European currencies, notably Swiss franc and the euro, against the U.S. dollar contributed to performance, as prices declined. Long positions in coffee contributed to performance, as global coffee prices increased. Short positions in cotton contributed to performance, as cotton prices decreased.
|
| Performance Past Does Not Indicate Future [Text] |
Performance quoted represents past performance. Past performance is not a guarantee or a reliable indicator of future results.
|
| Line Graph [Table Text Block] |
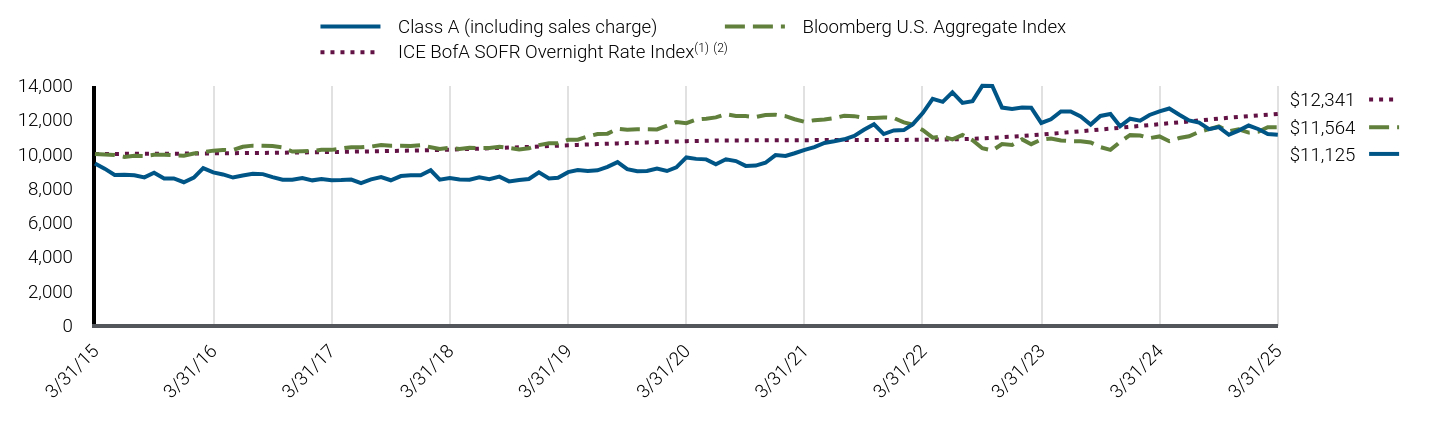
|
Class A (including sales charge) |
Bloomberg U.S. Aggregate Index |
ICE BofA SOFR Overnight Rate IndexFootnote Reference(1)Footnote Reference(2) |
3/31/15 |
$9,449 |
$10,000 |
$10,000 |
4/30/15 |
$9,144 |
$9,964 |
$10,002 |
5/31/15 |
$8,780 |
$9,940 |
$10,005 |
6/30/15 |
$8,791 |
$9,832 |
$10,007 |
7/31/15 |
$8,756 |
$9,900 |
$10,009 |
8/31/15 |
$8,635 |
$9,886 |
$10,012 |
9/30/15 |
$8,908 |
$9,953 |
$10,014 |
10/31/15 |
$8,565 |
$9,954 |
$10,017 |
11/30/15 |
$8,573 |
$9,928 |
$10,019 |
12/31/15 |
$8,352 |
$9,896 |
$10,022 |
1/31/16 |
$8,625 |
$10,032 |
$10,027 |
2/29/16 |
$9,171 |
$10,103 |
$10,032 |
3/31/16 |
$8,925 |
$10,196 |
$10,037 |
4/30/16 |
$8,807 |
$10,235 |
$10,043 |
5/31/16 |
$8,625 |
$10,238 |
$10,048 |
6/30/16 |
$8,743 |
$10,422 |
$10,053 |
7/31/16 |
$8,844 |
$10,488 |
$10,058 |
8/31/16 |
$8,825 |
$10,476 |
$10,064 |
9/30/16 |
$8,652 |
$10,470 |
$10,069 |
10/31/16 |
$8,497 |
$10,389 |
$10,076 |
11/30/16 |
$8,497 |
$10,144 |
$10,083 |
12/31/16 |
$8,598 |
$10,158 |
$10,090 |
1/31/17 |
$8,461 |
$10,178 |
$10,099 |
2/28/17 |
$8,534 |
$10,246 |
$10,107 |
3/31/17 |
$8,470 |
$10,241 |
$10,115 |
4/30/17 |
$8,479 |
$10,320 |
$10,125 |
5/31/17 |
$8,507 |
$10,399 |
$10,135 |
6/30/17 |
$8,306 |
$10,389 |
$10,144 |
7/31/17 |
$8,516 |
$10,434 |
$10,155 |
8/31/17 |
$8,652 |
$10,527 |
$10,166 |
9/30/17 |
$8,466 |
$10,477 |
$10,177 |
10/31/17 |
$8,712 |
$10,483 |
$10,189 |
11/30/17 |
$8,757 |
$10,470 |
$10,200 |
12/31/17 |
$8,757 |
$10,518 |
$10,211 |
1/31/18 |
$9,049 |
$10,397 |
$10,226 |
2/28/18 |
$8,502 |
$10,298 |
$10,240 |
3/31/18 |
$8,602 |
$10,364 |
$10,255 |
4/30/18 |
$8,511 |
$10,287 |
$10,274 |
5/31/18 |
$8,493 |
$10,360 |
$10,294 |
6/30/18 |
$8,635 |
$10,348 |
$10,314 |
7/31/18 |
$8,534 |
$10,350 |
$10,334 |
8/31/18 |
$8,680 |
$10,417 |
$10,354 |
9/30/18 |
$8,402 |
$10,350 |
$10,374 |
10/31/18 |
$8,484 |
$10,268 |
$10,395 |
11/30/18 |
$8,539 |
$10,329 |
$10,415 |
12/31/18 |
$8,931 |
$10,519 |
$10,436 |
1/31/19 |
$8,575 |
$10,631 |
$10,460 |
2/28/19 |
$8,612 |
$10,625 |
$10,485 |
3/31/19 |
$8,940 |
$10,829 |
$10,509 |
4/30/19 |
$9,059 |
$10,831 |
$10,532 |
5/31/19 |
$9,013 |
$11,024 |
$10,555 |
6/30/19 |
$9,046 |
$11,162 |
$10,578 |
7/31/19 |
$9,248 |
$11,187 |
$10,598 |
8/31/19 |
$9,523 |
$11,476 |
$10,619 |
9/30/19 |
$9,114 |
$11,415 |
$10,639 |
10/31/19 |
$8,994 |
$11,450 |
$10,658 |
11/30/19 |
$9,013 |
$11,444 |
$10,677 |
12/31/19 |
$9,156 |
$11,436 |
$10,696 |
1/31/20 |
$9,007 |
$11,656 |
$10,713 |
2/29/20 |
$9,221 |
$11,866 |
$10,730 |
3/31/20 |
$9,799 |
$11,796 |
$10,748 |
4/30/20 |
$9,715 |
$12,006 |
$10,761 |
5/31/20 |
$9,687 |
$12,062 |
$10,774 |
6/30/20 |
$9,397 |
$12,137 |
$10,787 |
7/31/20 |
$9,692 |
$12,319 |
$10,789 |
8/31/20 |
$9,587 |
$12,219 |
$10,792 |
9/30/20 |
$9,305 |
$12,213 |
$10,795 |
10/31/20 |
$9,324 |
$12,158 |
$10,797 |
11/30/20 |
$9,488 |
$12,277 |
$10,799 |
12/31/20 |
$9,934 |
$12,294 |
$10,801 |
1/31/21 |
$9,885 |
$12,206 |
$10,803 |
2/28/21 |
$10,042 |
$12,030 |
$10,805 |
3/31/21 |
$10,237 |
$11,880 |
$10,808 |
4/30/21 |
$10,403 |
$11,974 |
$10,810 |
5/31/21 |
$10,647 |
$12,013 |
$10,811 |
6/30/21 |
$10,741 |
$12,097 |
$10,813 |
7/31/21 |
$10,859 |
$12,232 |
$10,815 |
8/31/21 |
$11,055 |
$12,209 |
$10,816 |
9/30/21 |
$11,410 |
$12,103 |
$10,817 |
10/31/21 |
$11,735 |
$12,100 |
$10,818 |
11/30/21 |
$11,164 |
$12,136 |
$10,820 |
12/31/21 |
$11,376 |
$12,105 |
$10,821 |
1/31/22 |
$11,396 |
$11,844 |
$10,823 |
2/28/22 |
$11,745 |
$11,712 |
$10,825 |
3/31/22 |
$12,401 |
$11,386 |
$10,827 |
4/30/22 |
$13,215 |
$10,954 |
$10,836 |
5/31/22 |
$13,044 |
$11,025 |
$10,845 |
6/30/22 |
$13,594 |
$10,852 |
$10,854 |
7/31/22 |
$12,983 |
$11,117 |
$10,869 |
8/31/22 |
$13,085 |
$10,803 |
$10,890 |
9/30/22 |
$13,979 |
$10,336 |
$10,912 |
10/31/22 |
$13,969 |
$10,202 |
$10,941 |
11/30/22 |
$12,710 |
$10,578 |
$10,975 |
12/31/22 |
$12,633 |
$10,530 |
$11,013 |
1/31/23 |
$12,713 |
$10,854 |
$11,054 |
2/28/23 |
$12,702 |
$10,573 |
$11,093 |
3/31/23 |
$11,811 |
$10,842 |
$11,137 |
4/30/23 |
$12,028 |
$10,908 |
$11,182 |
5/31/23 |
$12,484 |
$10,789 |
$11,230 |
6/30/23 |
$12,484 |
$10,750 |
$11,278 |
7/31/23 |
$12,188 |
$10,743 |
$11,327 |
8/31/23 |
$11,719 |
$10,674 |
$11,379 |
9/30/23 |
$12,222 |
$10,403 |
$11,429 |
10/31/23 |
$12,336 |
$10,239 |
$11,482 |
11/30/23 |
$11,616 |
$10,702 |
$11,533 |
12/31/23 |
$12,062 |
$11,112 |
$11,586 |
1/31/24 |
$11,948 |
$11,082 |
$11,639 |
2/29/24 |
$12,279 |
$10,925 |
$11,689 |
3/31/24 |
$12,484 |
$11,026 |
$11,742 |
4/30/24 |
$12,656 |
$10,747 |
$11,795 |
5/31/24 |
$12,290 |
$10,930 |
$11,849 |
6/30/24 |
$11,959 |
$11,033 |
$11,898 |
7/31/24 |
$11,833 |
$11,291 |
$11,956 |
8/31/24 |
$11,445 |
$11,453 |
$12,011 |
9/30/24 |
$11,571 |
$11,606 |
$12,063 |
10/31/24 |
$11,125 |
$11,319 |
$12,114 |
11/30/24 |
$11,365 |
$11,438 |
$12,161 |
12/31/24 |
$11,662 |
$11,251 |
$12,208 |
1/31/25 |
$11,445 |
$11,311 |
$12,254 |
2/28/25 |
$11,171 |
$11,560 |
$12,295 |
3/31/25 |
$11,125 |
$11,564 |
$12,341 |
|
| Average Annual Return [Table Text Block] |
Class/Index Name |
1 Year |
5 Years |
10 Years |
Class A (excluding sales charge) |
(10.89%) |
2.57% |
1.65% |
Class A (including sales charge) |
(15.82%) |
1.42% |
1.07% |
Bloomberg U.S. Aggregate Index |
4.88% |
(0.40%) |
1.46% |
ICE BofA SOFR Overnight Rate IndexFootnote Reference(1)Footnote Reference(2) |
5.10% |
2.66% |
-% | |
| No Deduction of Taxes [Text Block] |
Returns shown do not reflect the deduction of taxes that a shareholder would pay on Fund distributions or the redemption of Fund shares.
|
| Performance Table Market Index Changed [Text Block] |
Differences in the Fund’s performance versus an index and related attribution information with respect to particular categories of securities or individual positions may be attributable, in part, to differences in the pricing methodologies used by the Fund and the index.
|
| Updated Performance Information Location [Text Block] |
For performance current to the most recent month-end, visit www.pimco.com/literature or via 888.87.PIMCO (888.877.4626).
|
| AssetsNet |
$ 2,009,333,000
|
| Holdings Count | Holding |
1,306
|
| Advisory Fees Paid, Amount |
$ 30,112,000
|
| InvestmentCompanyPortfolioTurnover |
919.00%
|
| Additional Fund Statistics [Text Block] |
Key Fund StatisticsFootnote Reference† (as of the end of the reporting period)
Total Net Assets |
$2,009,333 |
# of Portfolio Holdings |
1,306 |
Portfolio Turnover Rate |
919% |
Total Net Advisory Fees Paid During the Reporting Period |
$30,112 |
| Footnote |
Description |
Footnote† |
Dollar amounts displayed in 000's | |
| Holdings [Text Block] |
Security Type Breakdown (% of Net Asset Value)Footnote Reference*
U.S. Government Agencies |
41.4% |
Commodities |
27.0% |
Corporate Bonds & Notes |
5.4% |
Asset-Backed Securities |
3.5% |
Non-Agency Mortgage-Backed Securities |
0.3% |
Short-Term Instruments |
11.1% |
Affiliated Investments |
42.1% |
Financial Derivative Instruments |
(3.7%) |
Other Assets and Liabilities, Net |
(27.1%) |
Total |
100.0% |
| Footnote |
Description |
Footnote* |
% of Net Asset Value includes derivatives instruments, if any, valued at the value used for determining the Fund's net asset value. The notional exposure of such derivatives investments therefore may be greater than what is depicted. | |
| Material Fund Change [Text Block] |
This is a summary of certain changes and planned changes of the Fund since the beginning of the reporting period. For more information, you may refer to the Fund's next prospectus, which we expect to be available by July 31, 2025 or upon request at 888.87.PIMCO (888.877.4626). Changes to Total Annual Fund Operating Expenses. Annual fund operating expenses decreased during the year by 0.82% as a result of lower expenses related to interest. |
| Material Fund Change Expenses [Text Block] |
Changes to Total Annual Fund Operating Expenses. Annual fund operating expenses decreased during the year by 0.82% as a result of lower expenses related to interest.
|
| Summary of Change Legend [Text Block] |
This is a summary of certain changes and planned changes of the Fund since the beginning of the reporting period. For more information, you may refer to the Fund's next prospectus, which we expect to be available by July 31, 2025 or upon request at 888.87.PIMCO (888.877.4626).
|
| C000132361 |
|
| Shareholder Report [Line Items] |
|
| Fund Name |
PIMCO TRENDS Managed Futures Strategy Fund
|
| Class Name |
Class C
|
| Trading Symbol |
PQTCX
|
| Annual or Semi-Annual Statement [Text Block] |
This annual shareholder report contains important information about the PIMCO TRENDS Managed Futures Strategy Fund (the "Fund") for the period of April 1, 2024 to March 31, 2025 (the "reporting period").
|
| Shareholder Report Annual or Semi-Annual |
Annual Shareholder Report
|
| Additional Information [Text Block] |
You can find additional information about the Fund at www.pimco.com/literature. You can also request this information by contacting us at 888.87.PIMCO (888.877.4626).
|
| Material Fund Change Notice [Text Block] |
This report describes changes to the Fund that occurred during the reporting period.
|
| Additional Information Phone Number |
888.87.PIMCO (888.877.4626)
|
| Expenses [Text Block] |
What were the Fund costs for the reporting period?(based on a hypothetical $10,000 investment)
Class Name |
Cost of a $10,000 investment |
Costs paid as a percentage of a $10,000 investment |
Class C |
$249 |
2.64% | |
| Expenses Paid, Amount |
$ 249
|
| Expense Ratio, Percent |
2.64%
|
| Factors Affecting Performance [Text Block] |
How did the Fund perform during the reporting period and what affected its performance?The following affected performance (on a gross basis) during the reporting period: Positioning across global interest rates, notably in United Kingdom, Canadian, and Hungarian rates, detracted from performance, as rates reversed sharply. Positioning in energy commodities, notably German power and European Union Allowances, detracted from performance, as prices reversed sharply. Long positions across equity indices in Japan and the U.S. detracted from performance, as prices declined, and short positions in Chinese equities also detracted from performance, as prices increased. Short positions in Canadian dollar and developed market European currencies, notably Swiss franc and the euro, against the U.S. dollar contributed to performance, as prices declined. Long positions in coffee contributed to performance, as global coffee prices increased. Short positions in cotton contributed to performance, as cotton prices decreased.
|
| Performance Past Does Not Indicate Future [Text] |
Performance quoted represents past performance. Past performance is not a guarantee or a reliable indicator of future results.
|
| Line Graph [Table Text Block] |

|
Class C (excluding sales charge) |
Bloomberg U.S. Aggregate Index |
ICE BofA SOFR Overnight Rate IndexFootnote Reference(1)Footnote Reference(2) |
3/31/15 |
$10,000 |
$10,000 |
$10,000 |
4/30/15 |
$9,675 |
$9,964 |
$10,002 |
5/31/15 |
$9,271 |
$9,940 |
$10,005 |
6/30/15 |
$9,283 |
$9,832 |
$10,007 |
7/31/15 |
$9,236 |
$9,900 |
$10,009 |
8/31/15 |
$9,098 |
$9,886 |
$10,012 |
9/30/15 |
$9,383 |
$9,953 |
$10,014 |
10/31/15 |
$9,012 |
$9,954 |
$10,017 |
11/30/15 |
$9,011 |
$9,928 |
$10,019 |
12/31/15 |
$8,774 |
$9,896 |
$10,022 |
1/31/16 |
$9,050 |
$10,032 |
$10,027 |
2/29/16 |
$9,621 |
$10,103 |
$10,032 |
3/31/16 |
$9,352 |
$10,196 |
$10,037 |
4/30/16 |
$9,218 |
$10,235 |
$10,043 |
5/31/16 |
$9,017 |
$10,238 |
$10,048 |
6/30/16 |
$9,140 |
$10,422 |
$10,053 |
7/31/16 |
$9,243 |
$10,488 |
$10,058 |
8/31/16 |
$9,203 |
$10,476 |
$10,064 |
9/30/16 |
$9,023 |
$10,470 |
$10,069 |
10/31/16 |
$8,861 |
$10,389 |
$10,076 |
11/30/16 |
$8,851 |
$10,144 |
$10,083 |
12/31/16 |
$8,934 |
$10,158 |
$10,090 |
1/31/17 |
$8,792 |
$10,178 |
$10,099 |
2/28/17 |
$8,867 |
$10,246 |
$10,107 |
3/31/17 |
$8,781 |
$10,241 |
$10,115 |
4/30/17 |
$8,790 |
$10,320 |
$10,125 |
5/31/17 |
$8,817 |
$10,399 |
$10,135 |
6/30/17 |
$8,592 |
$10,389 |
$10,144 |
7/31/17 |
$8,796 |
$10,434 |
$10,155 |
8/31/17 |
$8,935 |
$10,527 |
$10,166 |
9/30/17 |
$8,742 |
$10,477 |
$10,177 |
10/31/17 |
$8,984 |
$10,483 |
$10,189 |
11/30/17 |
$9,020 |
$10,470 |
$10,200 |
12/31/17 |
$9,019 |
$10,518 |
$10,211 |
1/31/18 |
$9,306 |
$10,397 |
$10,226 |
2/28/18 |
$8,739 |
$10,298 |
$10,240 |
3/31/18 |
$8,839 |
$10,364 |
$10,255 |
4/30/18 |
$8,737 |
$10,287 |
$10,274 |
5/31/18 |
$8,708 |
$10,360 |
$10,294 |
6/30/18 |
$8,848 |
$10,348 |
$10,314 |
7/31/18 |
$8,736 |
$10,350 |
$10,334 |
8/31/18 |
$8,883 |
$10,417 |
$10,354 |
9/30/18 |
$8,592 |
$10,350 |
$10,374 |
10/31/18 |
$8,675 |
$10,268 |
$10,395 |
11/30/18 |
$8,712 |
$10,329 |
$10,415 |
12/31/18 |
$9,108 |
$10,519 |
$10,436 |
1/31/19 |
$8,739 |
$10,631 |
$10,460 |
2/28/19 |
$8,767 |
$10,625 |
$10,485 |
3/31/19 |
$9,095 |
$10,829 |
$10,509 |
4/30/19 |
$9,215 |
$10,831 |
$10,532 |
5/31/19 |
$9,159 |
$11,024 |
$10,555 |
6/30/19 |
$9,188 |
$11,162 |
$10,578 |
7/31/19 |
$9,381 |
$11,187 |
$10,598 |
8/31/19 |
$9,656 |
$11,476 |
$10,619 |
9/30/19 |
$9,237 |
$11,415 |
$10,639 |
10/31/19 |
$9,107 |
$11,450 |
$10,658 |
11/30/19 |
$9,116 |
$11,444 |
$10,677 |
12/31/19 |
$9,253 |
$11,436 |
$10,696 |
1/31/20 |
$9,103 |
$11,656 |
$10,713 |
2/29/20 |
$9,308 |
$11,866 |
$10,730 |
3/31/20 |
$9,885 |
$11,796 |
$10,748 |
4/30/20 |
$9,791 |
$12,006 |
$10,761 |
5/31/20 |
$9,753 |
$12,062 |
$10,774 |
6/30/20 |
$9,461 |
$12,137 |
$10,787 |
7/31/20 |
$9,744 |
$12,319 |
$10,789 |
8/31/20 |
$9,640 |
$12,219 |
$10,792 |
9/30/20 |
$9,351 |
$12,213 |
$10,795 |
10/31/20 |
$9,361 |
$12,158 |
$10,797 |
11/30/20 |
$9,515 |
$12,277 |
$10,799 |
12/31/20 |
$9,965 |
$12,294 |
$10,801 |
1/31/21 |
$9,906 |
$12,206 |
$10,803 |
2/28/21 |
$10,062 |
$12,030 |
$10,805 |
3/31/21 |
$10,248 |
$11,880 |
$10,808 |
4/30/21 |
$10,402 |
$11,974 |
$10,810 |
5/31/21 |
$10,652 |
$12,013 |
$10,811 |
6/30/21 |
$10,731 |
$12,097 |
$10,813 |
7/31/21 |
$10,847 |
$12,232 |
$10,815 |
8/31/21 |
$11,030 |
$12,209 |
$10,816 |
9/30/21 |
$11,371 |
$12,103 |
$10,817 |
10/31/21 |
$11,699 |
$12,100 |
$10,818 |
11/30/21 |
$11,126 |
$12,136 |
$10,820 |
12/31/21 |
$11,315 |
$12,105 |
$10,821 |
1/31/22 |
$11,344 |
$11,844 |
$10,823 |
2/28/22 |
$11,676 |
$11,712 |
$10,825 |
3/31/22 |
$12,326 |
$11,386 |
$10,827 |
4/30/22 |
$13,113 |
$10,954 |
$10,836 |
5/31/22 |
$12,942 |
$11,025 |
$10,845 |
6/30/22 |
$13,485 |
$10,852 |
$10,854 |
7/31/22 |
$12,863 |
$11,117 |
$10,869 |
8/31/22 |
$12,950 |
$10,803 |
$10,890 |
9/30/22 |
$13,836 |
$10,336 |
$10,912 |
10/31/22 |
$13,812 |
$10,202 |
$10,941 |
11/30/22 |
$12,561 |
$10,578 |
$10,975 |
12/31/22 |
$12,483 |
$10,530 |
$11,013 |
1/31/23 |
$12,560 |
$10,854 |
$11,054 |
2/28/23 |
$12,537 |
$10,573 |
$11,093 |
3/31/23 |
$11,648 |
$10,842 |
$11,137 |
4/30/23 |
$11,859 |
$10,908 |
$11,182 |
5/31/23 |
$12,293 |
$10,789 |
$11,230 |
6/30/23 |
$12,293 |
$10,750 |
$11,278 |
7/31/23 |
$11,994 |
$10,743 |
$11,327 |
8/31/23 |
$11,517 |
$10,674 |
$11,379 |
9/30/23 |
$12,005 |
$10,403 |
$11,429 |
10/31/23 |
$12,115 |
$10,239 |
$11,482 |
11/30/23 |
$11,407 |
$10,702 |
$11,533 |
12/31/23 |
$11,827 |
$11,112 |
$11,586 |
1/31/24 |
$11,706 |
$11,082 |
$11,639 |
2/29/24 |
$12,027 |
$10,925 |
$11,689 |
3/31/24 |
$12,215 |
$11,026 |
$11,742 |
4/30/24 |
$12,381 |
$10,747 |
$11,795 |
5/31/24 |
$12,016 |
$10,930 |
$11,849 |
6/30/24 |
$11,683 |
$11,033 |
$11,898 |
7/31/24 |
$11,562 |
$11,291 |
$11,956 |
8/31/24 |
$11,174 |
$11,453 |
$12,011 |
9/30/24 |
$11,285 |
$11,606 |
$12,063 |
10/31/24 |
$10,831 |
$11,319 |
$12,114 |
11/30/24 |
$11,063 |
$11,438 |
$12,161 |
12/31/24 |
$11,351 |
$11,251 |
$12,208 |
1/31/25 |
$11,119 |
$11,311 |
$12,254 |
2/28/25 |
$10,853 |
$11,560 |
$12,295 |
3/31/25 |
$10,809 |
$11,564 |
$12,341 |
|
| Average Annual Return [Table Text Block] |
Class/Index Name |
1 Year |
5 Years |
10 Years |
Class C (excluding sales charge) |
(11.51%) |
1.80% |
0.78% |
Class C (including sales charge) |
(12.40%) |
1.80% |
0.78% |
Bloomberg U.S. Aggregate Index |
4.88% |
(0.40%) |
1.46% |
ICE BofA SOFR Overnight Rate IndexFootnote Reference(1)Footnote Reference(2) |
5.10% |
2.66% |
-% | |
| No Deduction of Taxes [Text Block] |
Returns shown do not reflect the deduction of taxes that a shareholder would pay on Fund distributions or the redemption of Fund shares.
|
| Performance Table Market Index Changed [Text Block] |
Differences in the Fund’s performance versus an index and related attribution information with respect to particular categories of securities or individual positions may be attributable, in part, to differences in the pricing methodologies used by the Fund and the index.
|
| Updated Performance Information Location [Text Block] |
For performance current to the most recent month-end, visit www.pimco.com/literature or via 888.87.PIMCO (888.877.4626).
|
| AssetsNet |
$ 2,009,333,000
|
| Holdings Count | Holding |
1,306
|
| Advisory Fees Paid, Amount |
$ 30,112,000
|
| InvestmentCompanyPortfolioTurnover |
919.00%
|
| Additional Fund Statistics [Text Block] |
Key Fund StatisticsFootnote Reference† (as of the end of the reporting period)
Total Net Assets |
$2,009,333 |
# of Portfolio Holdings |
1,306 |
Portfolio Turnover Rate |
919% |
Total Net Advisory Fees Paid During the Reporting Period |
$30,112 |
| Footnote |
Description |
Footnote† |
Dollar amounts displayed in 000's | |
| Holdings [Text Block] |
Security Type Breakdown (% of Net Asset Value)Footnote Reference*
U.S. Government Agencies |
41.4% |
Commodities |
27.0% |
Corporate Bonds & Notes |
5.4% |
Asset-Backed Securities |
3.5% |
Non-Agency Mortgage-Backed Securities |
0.3% |
Short-Term Instruments |
11.1% |
Affiliated Investments |
42.1% |
Financial Derivative Instruments |
(3.7%) |
Other Assets and Liabilities, Net |
(27.1%) |
Total |
100.0% |
| Footnote |
Description |
Footnote* |
% of Net Asset Value includes derivatives instruments, if any, valued at the value used for determining the Fund's net asset value. The notional exposure of such derivatives investments therefore may be greater than what is depicted. | |
| Material Fund Change [Text Block] |
This is a summary of certain changes and planned changes of the Fund since the beginning of the reporting period. For more information, you may refer to the Fund's next prospectus, which we expect to be available by July 31, 2025 or upon request at 888.87.PIMCO (888.877.4626). Changes to Total Annual Fund Operating Expenses. Annual fund operating expenses decreased during the year by 0.87% as a result of lower expenses related to interest. |
| Material Fund Change Expenses [Text Block] |
Changes to Total Annual Fund Operating Expenses. Annual fund operating expenses decreased during the year by 0.87% as a result of lower expenses related to interest.
|
| Summary of Change Legend [Text Block] |
This is a summary of certain changes and planned changes of the Fund since the beginning of the reporting period. For more information, you may refer to the Fund's next prospectus, which we expect to be available by July 31, 2025 or upon request at 888.87.PIMCO (888.877.4626).
|
| C000200466 |
|
| Shareholder Report [Line Items] |
|
| Fund Name |
PIMCO TRENDS Managed Futures Strategy Fund
|
| Class Name |
I-3
|
| Trading Symbol |
PQTNX
|
| Annual or Semi-Annual Statement [Text Block] |
This annual shareholder report contains important information about the PIMCO TRENDS Managed Futures Strategy Fund (the "Fund") for the period of April 1, 2024 to March 31, 2025 (the "reporting period").
|
| Shareholder Report Annual or Semi-Annual |
Annual Shareholder Report
|
| Additional Information [Text Block] |
You can find additional information about the Fund at www.pimco.com/literature. You can also request this information by contacting us at 888.87.PIMCO (888.877.4626).
|
| Material Fund Change Notice [Text Block] |
This report describes changes to the Fund that occurred during the reporting period.
|
| Additional Information Phone Number |
888.87.PIMCO (888.877.4626)
|
| Expenses [Text Block] |
What were the Fund costs for the reporting period?(based on a hypothetical $10,000 investment)
Class Name |
Cost of a $10,000 investment |
Costs paid as a percentage of a $10,000 investment |
I-3 |
$160 |
1.69% | |
| Expenses Paid, Amount |
$ 160
|
| Expense Ratio, Percent |
1.69%
|
| Factors Affecting Performance [Text Block] |
How did the Fund perform during the reporting period and what affected its performance?The following affected performance (on a gross basis) during the reporting period: Positioning across global interest rates, notably in United Kingdom, Canadian, and Hungarian rates, detracted from performance, as rates reversed sharply. Positioning in energy commodities, notably German power and European Union Allowances, detracted from performance, as prices reversed sharply. Long positions across equity indices in Japan and the U.S. detracted from performance, as prices declined, and short positions in Chinese equities also detracted from performance, as prices increased. Short positions in Canadian dollar and developed market European currencies, notably Swiss franc and the euro, against the U.S. dollar contributed to performance, as prices declined. Long positions in coffee contributed to performance, as global coffee prices increased. Short positions in cotton contributed to performance, as cotton prices decreased.
|
| Performance Past Does Not Indicate Future [Text] |
Performance quoted represents past performance. Past performance is not a guarantee or a reliable indicator of future results.
|
| Line Graph [Table Text Block] |
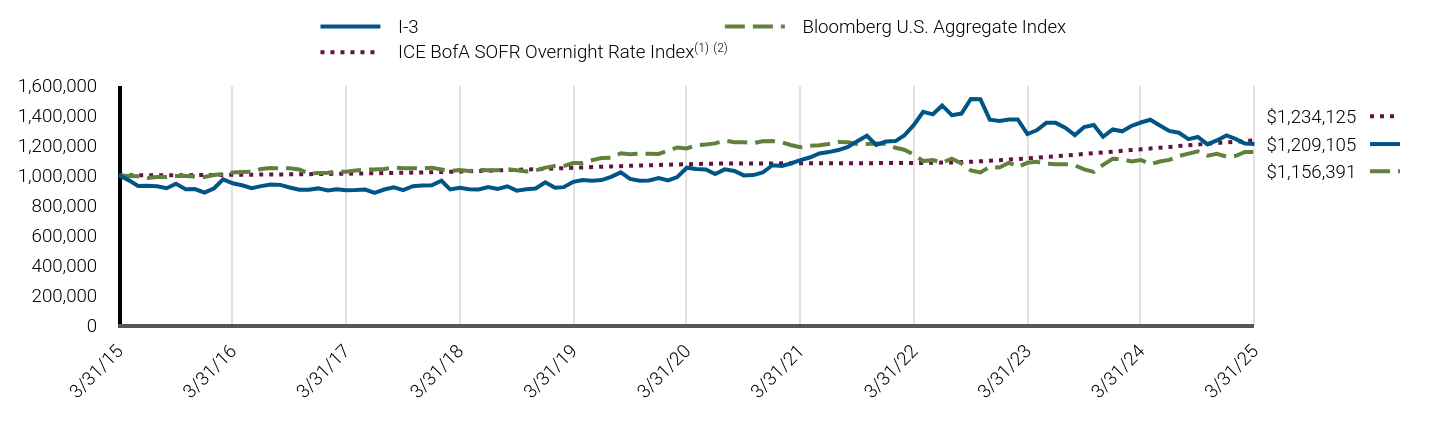
|
I-3 |
Bloomberg U.S. Aggregate Index |
ICE BofA SOFR Overnight Rate IndexFootnote Reference(1)Footnote Reference(2) |
3/31/15 |
$1,000,000 |
$1,000,000 |
$1,000,000 |
4/30/15 |
$968,570 |
$996,412 |
$1,000,229 |
5/31/15 |
$929,098 |
$994,012 |
$1,000,460 |
6/30/15 |
$931,294 |
$983,174 |
$1,000,689 |
7/31/15 |
$927,524 |
$990,008 |
$1,000,924 |
8/31/15 |
$914,624 |
$988,586 |
$1,001,159 |
9/30/15 |
$944,299 |
$995,273 |
$1,001,394 |
10/31/15 |
$907,863 |
$995,439 |
$1,001,666 |
11/30/15 |
$908,683 |
$992,809 |
$1,001,940 |
12/31/15 |
$885,770 |
$989,601 |
$1,002,212 |
1/31/16 |
$914,568 |
$1,003,219 |
$1,002,719 |
2/29/16 |
$973,240 |
$1,010,335 |
$1,003,226 |
3/31/16 |
$947,103 |
$1,019,605 |
$1,003,732 |
4/30/16 |
$934,461 |
$1,023,519 |
$1,004,260 |
5/31/16 |
$915,077 |
$1,023,781 |
$1,004,788 |
6/30/16 |
$928,450 |
$1,042,177 |
$1,005,317 |
7/31/16 |
$939,889 |
$1,048,765 |
$1,005,845 |
8/31/16 |
$936,881 |
$1,047,566 |
$1,006,374 |
9/30/16 |
$919,435 |
$1,046,952 |
$1,006,904 |
10/31/16 |
$903,915 |
$1,038,944 |
$1,007,607 |
11/30/16 |
$903,804 |
$1,014,369 |
$1,008,310 |
12/31/16 |
$913,313 |
$1,015,800 |
$1,009,013 |
1/31/17 |
$899,724 |
$1,017,793 |
$1,009,853 |
2/28/17 |
$908,280 |
$1,024,634 |
$1,010,693 |
3/31/17 |
$900,468 |
$1,024,097 |
$1,011,533 |
4/30/17 |
$902,281 |
$1,032,000 |
$1,012,501 |
5/31/17 |
$906,014 |
$1,039,943 |
$1,013,468 |
6/30/17 |
$883,781 |
$1,038,896 |
$1,014,436 |
7/31/17 |
$905,786 |
$1,043,367 |
$1,015,532 |
8/31/17 |
$921,055 |
$1,052,726 |
$1,016,629 |
9/30/17 |
$902,113 |
$1,047,712 |
$1,017,727 |
10/31/17 |
$928,020 |
$1,048,319 |
$1,018,858 |
11/30/17 |
$932,724 |
$1,046,973 |
$1,019,989 |
12/31/17 |
$933,568 |
$1,051,778 |
$1,021,122 |
1/31/18 |
$964,276 |
$1,039,665 |
$1,022,563 |
2/28/18 |
$906,371 |
$1,029,809 |
$1,024,006 |
3/31/18 |
$917,813 |
$1,036,414 |
$1,025,451 |
4/30/18 |
$908,083 |
$1,028,705 |
$1,027,418 |
5/31/18 |
$906,155 |
$1,036,047 |
$1,029,389 |
6/30/18 |
$921,852 |
$1,034,773 |
$1,031,364 |
7/31/18 |
$910,269 |
$1,035,019 |
$1,033,370 |
8/31/18 |
$927,644 |
$1,041,679 |
$1,035,380 |
9/30/18 |
$898,206 |
$1,034,971 |
$1,037,394 |
10/31/18 |
$906,898 |
$1,026,792 |
$1,039,457 |
11/30/18 |
$912,693 |
$1,032,921 |
$1,041,524 |
12/31/18 |
$954,499 |
$1,051,898 |
$1,043,595 |
1/31/19 |
$917,750 |
$1,063,068 |
$1,046,033 |
2/28/19 |
$921,619 |
$1,062,452 |
$1,048,476 |
3/31/19 |
$957,136 |
$1,082,853 |
$1,050,925 |
4/30/19 |
$969,743 |
$1,083,130 |
$1,053,203 |
5/31/19 |
$964,894 |
$1,102,358 |
$1,055,486 |
6/30/19 |
$968,760 |
$1,116,201 |
$1,057,774 |
7/31/19 |
$990,201 |
$1,118,657 |
$1,059,827 |
8/31/19 |
$1,020,414 |
$1,147,643 |
$1,061,885 |
9/30/19 |
$976,648 |
$1,141,531 |
$1,063,947 |
10/31/19 |
$963,875 |
$1,144,969 |
$1,065,813 |
11/30/19 |
$965,840 |
$1,144,386 |
$1,067,682 |
12/31/19 |
$981,950 |
$1,143,588 |
$1,069,554 |
1/31/20 |
$966,096 |
$1,165,596 |
$1,071,288 |
2/29/20 |
$988,886 |
$1,186,575 |
$1,073,023 |
3/31/20 |
$1,051,311 |
$1,179,592 |
$1,074,762 |
4/30/20 |
$1,042,393 |
$1,200,561 |
$1,076,061 |
5/31/20 |
$1,039,420 |
$1,206,151 |
$1,077,361 |
6/30/20 |
$1,009,017 |
$1,213,749 |
$1,078,663 |
7/31/20 |
$1,040,359 |
$1,231,878 |
$1,078,940 |
8/31/20 |
$1,029,238 |
$1,221,935 |
$1,079,217 |
9/30/20 |
$999,972 |
$1,221,265 |
$1,079,494 |
10/31/20 |
$1,002,021 |
$1,215,812 |
$1,079,692 |
11/30/20 |
$1,019,438 |
$1,227,742 |
$1,079,890 |
12/31/20 |
$1,068,211 |
$1,229,433 |
$1,080,089 |
1/31/21 |
$1,063,016 |
$1,220,618 |
$1,080,317 |
2/28/21 |
$1,079,641 |
$1,202,992 |
$1,080,546 |
3/31/21 |
$1,101,465 |
$1,187,971 |
$1,080,774 |
4/30/21 |
$1,119,130 |
$1,197,356 |
$1,080,957 |
5/31/21 |
$1,146,147 |
$1,201,268 |
$1,081,139 |
6/30/21 |
$1,155,557 |
$1,209,708 |
$1,081,321 |
7/31/21 |
$1,169,139 |
$1,223,233 |
$1,081,454 |
8/31/21 |
$1,190,036 |
$1,220,905 |
$1,081,587 |
9/30/21 |
$1,228,621 |
$1,210,334 |
$1,081,719 |
10/31/21 |
$1,264,294 |
$1,210,000 |
$1,081,838 |
11/30/21 |
$1,203,440 |
$1,213,580 |
$1,081,957 |
12/31/21 |
$1,225,558 |
$1,210,475 |
$1,082,075 |
1/31/22 |
$1,228,750 |
$1,184,396 |
$1,082,277 |
2/28/22 |
$1,265,985 |
$1,171,183 |
$1,082,479 |
3/31/22 |
$1,336,828 |
$1,138,645 |
$1,082,681 |
4/30/22 |
$1,424,735 |
$1,095,436 |
$1,083,588 |
5/31/22 |
$1,407,582 |
$1,102,499 |
$1,084,497 |
6/30/22 |
$1,466,737 |
$1,085,203 |
$1,085,406 |
7/31/22 |
$1,401,500 |
$1,111,719 |
$1,086,882 |
8/31/22 |
$1,412,373 |
$1,080,306 |
$1,089,024 |
9/30/22 |
$1,509,933 |
$1,033,630 |
$1,091,245 |
10/31/22 |
$1,507,729 |
$1,020,242 |
$1,094,093 |
11/30/22 |
$1,372,165 |
$1,057,762 |
$1,097,463 |
12/31/22 |
$1,363,900 |
$1,052,991 |
$1,101,293 |
1/31/23 |
$1,373,651 |
$1,085,385 |
$1,105,379 |
2/28/23 |
$1,373,651 |
$1,057,322 |
$1,109,281 |
3/31/23 |
$1,276,142 |
$1,084,180 |
$1,113,695 |
4/30/23 |
$1,300,519 |
$1,090,751 |
$1,118,173 |
5/31/23 |
$1,350,492 |
$1,078,874 |
$1,123,014 |
6/30/23 |
$1,350,492 |
$1,075,027 |
$1,127,753 |
7/31/23 |
$1,318,802 |
$1,074,277 |
$1,132,705 |
8/31/23 |
$1,268,829 |
$1,067,415 |
$1,137,880 |
9/30/23 |
$1,322,459 |
$1,040,290 |
$1,142,922 |
10/31/23 |
$1,335,866 |
$1,023,873 |
$1,148,156 |
11/30/23 |
$1,257,859 |
$1,070,241 |
$1,153,254 |
12/31/23 |
$1,306,613 |
$1,111,209 |
$1,158,559 |
1/31/24 |
$1,294,425 |
$1,108,157 |
$1,163,888 |
2/29/24 |
$1,329,772 |
$1,092,501 |
$1,168,881 |
3/31/24 |
$1,352,930 |
$1,102,589 |
$1,174,247 |
4/30/24 |
$1,371,213 |
$1,074,739 |
$1,179,460 |
5/31/24 |
$1,333,428 |
$1,092,959 |
$1,184,862 |
6/30/24 |
$1,296,863 |
$1,103,307 |
$1,189,779 |
7/31/24 |
$1,284,674 |
$1,129,077 |
$1,195,621 |
8/31/24 |
$1,242,014 |
$1,145,301 |
$1,201,121 |
9/30/24 |
$1,256,640 |
$1,160,636 |
$1,206,310 |
10/31/24 |
$1,206,667 |
$1,131,854 |
$1,211,352 |
11/30/24 |
$1,233,482 |
$1,143,821 |
$1,216,089 |
12/31/24 |
$1,266,391 |
$1,125,101 |
$1,220,844 |
1/31/25 |
$1,242,014 |
$1,131,070 |
$1,225,398 |
2/28/25 |
$1,212,762 |
$1,155,956 |
$1,229,539 |
3/31/25 |
$1,209,105 |
$1,156,391 |
$1,234,125 |
|
| Average Annual Return [Table Text Block] |
Class/Index Name |
1 Year |
5 Years |
10 Years |
I-3 |
(10.63%) |
2.84% |
1.92% |
Bloomberg U.S. Aggregate Index |
4.88% |
(0.40%) |
1.46% |
ICE BofA SOFR Overnight Rate IndexFootnote Reference(1)Footnote Reference(2) |
5.10% |
2.66% |
-% | |
| No Deduction of Taxes [Text Block] |
Returns shown do not reflect the deduction of taxes that a shareholder would pay on Fund distributions or the redemption of Fund shares.
|
| Performance Table Market Index Changed [Text Block] |
Differences in the Fund’s performance versus an index and related attribution information with respect to particular categories of securities or individual positions may be attributable, in part, to differences in the pricing methodologies used by the Fund and the index.
|
| Updated Performance Information Location [Text Block] |
For performance current to the most recent month-end, visit www.pimco.com/literature or via 888.87.PIMCO (888.877.4626).
|
| AssetsNet |
$ 2,009,333,000
|
| Holdings Count | Holding |
1,306
|
| Advisory Fees Paid, Amount |
$ 30,112,000
|
| InvestmentCompanyPortfolioTurnover |
919.00%
|
| Additional Fund Statistics [Text Block] |
Key Fund StatisticsFootnote Reference† (as of the end of the reporting period)
Total Net Assets |
$2,009,333 |
# of Portfolio Holdings |
1,306 |
Portfolio Turnover Rate |
919% |
Total Net Advisory Fees Paid During the Reporting Period |
$30,112 |
| Footnote |
Description |
Footnote† |
Dollar amounts displayed in 000's | |
| Holdings [Text Block] |
Security Type Breakdown (% of Net Asset Value)Footnote Reference*
U.S. Government Agencies |
41.4% |
Commodities |
27.0% |
Corporate Bonds & Notes |
5.4% |
Asset-Backed Securities |
3.5% |
Non-Agency Mortgage-Backed Securities |
0.3% |
Short-Term Instruments |
11.1% |
Affiliated Investments |
42.1% |
Financial Derivative Instruments |
(3.7%) |
Other Assets and Liabilities, Net |
(27.1%) |
Total |
100.0% |
| Footnote |
Description |
Footnote* |
% of Net Asset Value includes derivatives instruments, if any, valued at the value used for determining the Fund's net asset value. The notional exposure of such derivatives investments therefore may be greater than what is depicted. | |
| Material Fund Change [Text Block] |
This is a summary of certain changes and planned changes of the Fund since the beginning of the reporting period. For more information, you may refer to the Fund's next prospectus, which we expect to be available by July 31, 2025 or upon request at 888.87.PIMCO (888.877.4626). Changes to Total Annual Fund Operating Expenses. Annual fund operating expenses decreased during the year by 0.82% as a result of lower expenses related to interest. |
| Material Fund Change Expenses [Text Block] |
Changes to Total Annual Fund Operating Expenses. Annual fund operating expenses decreased during the year by 0.82% as a result of lower expenses related to interest.
|
| Summary of Change Legend [Text Block] |
This is a summary of certain changes and planned changes of the Fund since the beginning of the reporting period. For more information, you may refer to the Fund's next prospectus, which we expect to be available by July 31, 2025 or upon request at 888.87.PIMCO (888.877.4626).
|
| C000132356 |
|
| Shareholder Report [Line Items] |
|
| Fund Name |
PIMCO TRENDS Managed Futures Strategy Fund
|
| Class Name |
Institutional Class
|
| Trading Symbol |
PQTIX
|
| Annual or Semi-Annual Statement [Text Block] |
This annual shareholder report contains important information about the PIMCO TRENDS Managed Futures Strategy Fund (the "Fund") for the period of April 1, 2024 to March 31, 2025 (the "reporting period").
|
| Shareholder Report Annual or Semi-Annual |
Annual Shareholder Report
|
| Additional Information [Text Block] |
You can find additional information about the Fund at www.pimco.com/literature. You can also request this information by contacting us at 888.87.PIMCO (888.877.4626).
|
| Material Fund Change Notice [Text Block] |
This report describes changes to the Fund that occurred during the reporting period.
|
| Additional Information Phone Number |
888.87.PIMCO (888.877.4626)
|
| Expenses [Text Block] |
What were the Fund costs for the reporting period?(based on a hypothetical $10,000 investment)
Class Name |
Cost of a $10,000 investment |
Costs paid as a percentage of a $10,000 investment |
Institutional Class |
$146 |
1.54% | |
| Expenses Paid, Amount |
$ 146
|
| Expense Ratio, Percent |
1.54%
|
| Factors Affecting Performance [Text Block] |
How did the Fund perform during the reporting period and what affected its performance?The following affected performance (on a gross basis) during the reporting period: Positioning across global interest rates, notably in United Kingdom, Canadian, and Hungarian rates, detracted from performance, as rates reversed sharply. Positioning in energy commodities, notably German power and European Union Allowances, detracted from performance, as prices reversed sharply. Long positions across equity indices in Japan and the U.S. detracted from performance, as prices declined, and short positions in Chinese equities also detracted from performance, as prices increased. Short positions in Canadian dollar and developed market European currencies, notably Swiss franc and the euro, against the U.S. dollar contributed to performance, as prices declined. Long positions in coffee contributed to performance, as global coffee prices increased. Short positions in cotton contributed to performance, as cotton prices decreased.
|
| Performance Past Does Not Indicate Future [Text] |
Performance quoted represents past performance. Past performance is not a guarantee or a reliable indicator of future results.
|
| Line Graph [Table Text Block] |
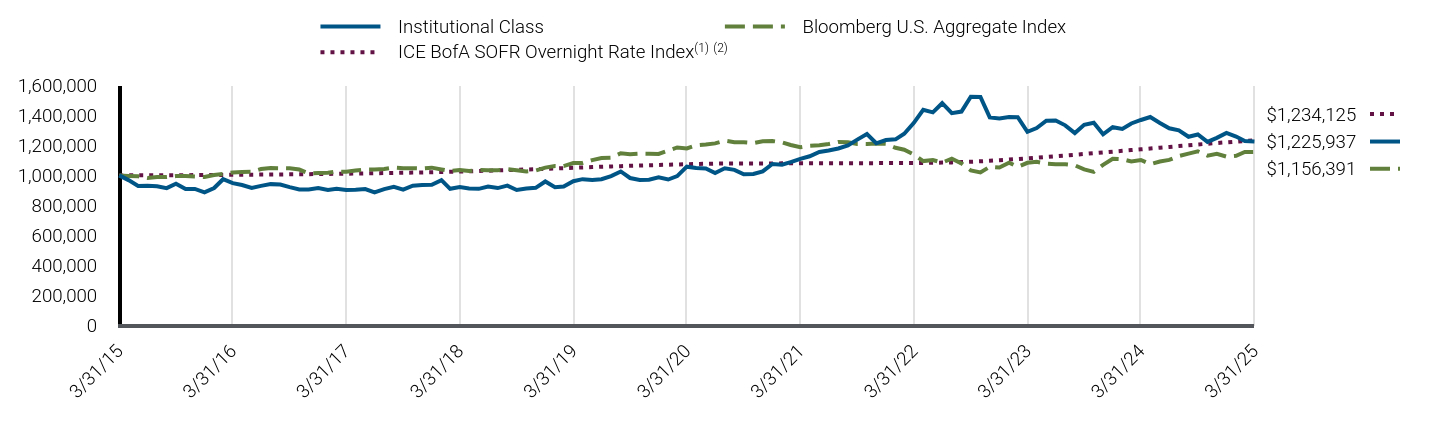
|
Institutional Class |
Bloomberg U.S. Aggregate Index |
ICE BofA SOFR Overnight Rate IndexFootnote Reference(1)Footnote Reference(2) |
3/31/15 |
$1,000,000 |
$1,000,000 |
$1,000,000 |
4/30/15 |
$968,694 |
$996,412 |
$1,000,229 |
5/31/15 |
$929,338 |
$994,012 |
$1,000,460 |
6/30/15 |
$931,650 |
$983,174 |
$1,000,689 |
7/31/15 |
$927,996 |
$990,008 |
$1,000,924 |
8/31/15 |
$915,209 |
$988,586 |
$1,001,159 |
9/30/15 |
$945,017 |
$995,273 |
$1,001,394 |
10/31/15 |
$908,670 |
$995,439 |
$1,001,666 |
11/30/15 |
$909,602 |
$992,809 |
$1,001,940 |
12/31/15 |
$886,779 |
$989,601 |
$1,002,212 |
1/31/16 |
$915,727 |
$1,003,219 |
$1,002,719 |
2/29/16 |
$974,588 |
$1,010,335 |
$1,003,226 |
3/31/16 |
$948,535 |
$1,019,605 |
$1,003,732 |
4/30/16 |
$935,991 |
$1,023,519 |
$1,004,260 |
5/31/16 |
$916,692 |
$1,023,781 |
$1,004,788 |
6/30/16 |
$930,201 |
$1,042,177 |
$1,005,317 |
7/31/16 |
$941,781 |
$1,048,765 |
$1,005,845 |
8/31/16 |
$938,886 |
$1,047,566 |
$1,006,374 |
9/30/16 |
$921,517 |
$1,046,952 |
$1,006,904 |
10/31/16 |
$906,078 |
$1,038,944 |
$1,007,607 |
11/30/16 |
$906,078 |
$1,014,369 |
$1,008,310 |
12/31/16 |
$915,727 |
$1,015,800 |
$1,009,013 |
1/31/17 |
$902,218 |
$1,017,793 |
$1,009,853 |
2/28/17 |
$910,903 |
$1,024,634 |
$1,010,693 |
3/31/17 |
$903,183 |
$1,024,097 |
$1,011,533 |
4/30/17 |
$905,113 |
$1,032,000 |
$1,012,501 |
5/31/17 |
$908,973 |
$1,039,943 |
$1,013,468 |
6/30/17 |
$886,779 |
$1,038,896 |
$1,014,436 |
7/31/17 |
$908,973 |
$1,043,367 |
$1,015,532 |
8/31/17 |
$924,412 |
$1,052,726 |
$1,016,629 |
9/30/17 |
$905,514 |
$1,047,712 |
$1,017,727 |
10/31/17 |
$931,635 |
$1,048,319 |
$1,018,858 |
11/30/17 |
$936,472 |
$1,046,973 |
$1,019,989 |
12/31/17 |
$937,439 |
$1,051,778 |
$1,021,122 |
1/31/18 |
$968,397 |
$1,039,665 |
$1,022,563 |
2/28/18 |
$910,351 |
$1,029,809 |
$1,024,006 |
3/31/18 |
$921,960 |
$1,036,414 |
$1,025,451 |
4/30/18 |
$912,286 |
$1,028,705 |
$1,027,418 |
5/31/18 |
$910,351 |
$1,036,047 |
$1,029,389 |
6/30/18 |
$926,078 |
$1,034,773 |
$1,031,364 |
7/31/18 |
$915,422 |
$1,035,019 |
$1,033,370 |
8/31/18 |
$931,890 |
$1,041,679 |
$1,035,380 |
9/30/18 |
$902,337 |
$1,034,971 |
$1,037,394 |
10/31/18 |
$912,040 |
$1,026,792 |
$1,039,457 |
11/30/18 |
$916,891 |
$1,032,921 |
$1,041,524 |
12/31/18 |
$959,604 |
$1,051,898 |
$1,043,595 |
1/31/19 |
$921,725 |
$1,063,068 |
$1,046,033 |
2/28/19 |
$925,610 |
$1,062,452 |
$1,048,476 |
3/31/19 |
$961,364 |
$1,082,853 |
$1,050,925 |
4/30/19 |
$975,001 |
$1,083,130 |
$1,053,203 |
5/31/19 |
$970,131 |
$1,102,358 |
$1,055,486 |
6/30/19 |
$974,258 |
$1,116,201 |
$1,057,774 |
7/31/19 |
$995,799 |
$1,118,657 |
$1,059,827 |
8/31/19 |
$1,026,153 |
$1,147,643 |
$1,061,885 |
9/30/19 |
$982,617 |
$1,141,531 |
$1,063,947 |
10/31/19 |
$969,779 |
$1,144,969 |
$1,065,813 |
11/30/19 |
$971,754 |
$1,144,386 |
$1,067,682 |
12/31/19 |
$987,386 |
$1,143,588 |
$1,069,554 |
1/31/20 |
$972,441 |
$1,165,596 |
$1,071,288 |
2/29/20 |
$995,357 |
$1,186,575 |
$1,073,023 |
3/31/20 |
$1,058,127 |
$1,179,592 |
$1,074,762 |
4/30/20 |
$1,049,160 |
$1,200,561 |
$1,076,061 |
5/31/20 |
$1,046,171 |
$1,206,151 |
$1,077,361 |
6/30/20 |
$1,015,869 |
$1,213,749 |
$1,078,663 |
7/31/20 |
$1,047,393 |
$1,231,878 |
$1,078,940 |
8/31/20 |
$1,037,224 |
$1,221,935 |
$1,079,217 |
9/30/20 |
$1,007,116 |
$1,221,265 |
$1,079,494 |
10/31/20 |
$1,009,178 |
$1,215,812 |
$1,079,692 |
11/30/20 |
$1,026,702 |
$1,227,742 |
$1,079,890 |
12/31/20 |
$1,076,254 |
$1,229,433 |
$1,080,089 |
1/31/21 |
$1,071,024 |
$1,220,618 |
$1,080,317 |
2/28/21 |
$1,088,805 |
$1,202,992 |
$1,080,546 |
3/31/21 |
$1,109,978 |
$1,187,971 |
$1,080,774 |
4/30/21 |
$1,127,763 |
$1,197,356 |
$1,080,957 |
5/31/21 |
$1,156,009 |
$1,201,268 |
$1,081,139 |
6/30/21 |
$1,165,696 |
$1,209,708 |
$1,081,321 |
7/31/21 |
$1,179,373 |
$1,223,233 |
$1,081,454 |
8/31/21 |
$1,200,415 |
$1,220,905 |
$1,081,587 |
9/30/21 |
$1,238,677 |
$1,210,334 |
$1,081,719 |
10/31/21 |
$1,275,668 |
$1,210,000 |
$1,081,838 |
11/30/21 |
$1,214,369 |
$1,213,580 |
$1,081,957 |
12/31/21 |
$1,236,264 |
$1,210,475 |
$1,082,075 |
1/31/22 |
$1,240,553 |
$1,184,396 |
$1,082,277 |
2/28/22 |
$1,278,081 |
$1,171,183 |
$1,082,479 |
3/31/22 |
$1,350,540 |
$1,138,645 |
$1,082,681 |
4/30/22 |
$1,438,055 |
$1,095,436 |
$1,083,588 |
5/31/22 |
$1,420,768 |
$1,102,499 |
$1,084,497 |
6/30/22 |
$1,481,732 |
$1,085,203 |
$1,085,406 |
7/31/22 |
$1,414,878 |
$1,111,719 |
$1,086,882 |
8/31/22 |
$1,425,838 |
$1,080,306 |
$1,089,024 |
9/30/22 |
$1,524,704 |
$1,033,630 |
$1,091,245 |
10/31/22 |
$1,523,593 |
$1,020,242 |
$1,094,093 |
11/30/22 |
$1,386,903 |
$1,057,762 |
$1,097,463 |
12/31/22 |
$1,379,641 |
$1,052,991 |
$1,101,293 |
1/31/23 |
$1,389,478 |
$1,085,385 |
$1,105,379 |
2/28/23 |
$1,388,248 |
$1,057,322 |
$1,109,281 |
3/31/23 |
$1,291,107 |
$1,084,180 |
$1,113,695 |
4/30/23 |
$1,315,700 |
$1,090,751 |
$1,118,173 |
5/31/23 |
$1,364,885 |
$1,078,874 |
$1,123,014 |
6/30/23 |
$1,366,115 |
$1,075,027 |
$1,127,753 |
7/31/23 |
$1,334,144 |
$1,074,277 |
$1,132,705 |
8/31/23 |
$1,282,500 |
$1,067,415 |
$1,137,880 |
9/30/23 |
$1,337,833 |
$1,040,290 |
$1,142,922 |
10/31/23 |
$1,351,359 |
$1,023,873 |
$1,148,156 |
11/30/23 |
$1,273,893 |
$1,070,241 |
$1,153,254 |
12/31/23 |
$1,321,848 |
$1,111,209 |
$1,158,559 |
1/31/24 |
$1,309,552 |
$1,108,157 |
$1,163,888 |
2/29/24 |
$1,346,441 |
$1,092,501 |
$1,168,881 |
3/31/24 |
$1,369,804 |
$1,102,589 |
$1,174,247 |
4/30/24 |
$1,389,478 |
$1,074,739 |
$1,179,460 |
5/31/24 |
$1,350,130 |
$1,092,959 |
$1,184,862 |
6/30/24 |
$1,314,470 |
$1,103,307 |
$1,189,779 |
7/31/24 |
$1,300,944 |
$1,129,077 |
$1,195,621 |
8/31/24 |
$1,257,908 |
$1,145,301 |
$1,201,121 |
9/30/24 |
$1,272,663 |
$1,160,636 |
$1,206,310 |
10/31/24 |
$1,223,478 |
$1,131,854 |
$1,211,352 |
11/30/24 |
$1,250,530 |
$1,143,821 |
$1,216,089 |
12/31/24 |
$1,283,730 |
$1,125,101 |
$1,220,844 |
1/31/25 |
$1,259,137 |
$1,131,070 |
$1,225,398 |
2/28/25 |
$1,229,626 |
$1,155,956 |
$1,229,539 |
3/31/25 |
$1,225,937 |
$1,156,391 |
$1,234,125 |
|
| Average Annual Return [Table Text Block] |
Class/Index Name |
1 Year |
5 Years |
10 Years |
Institutional Class |
(10.50%) |
2.99% |
2.06% |
Bloomberg U.S. Aggregate Index |
4.88% |
(0.40%) |
1.46% |
ICE BofA SOFR Overnight Rate IndexFootnote Reference(1)Footnote Reference(2) |
5.10% |
2.66% |
-% | |
| No Deduction of Taxes [Text Block] |
Returns shown do not reflect the deduction of taxes that a shareholder would pay on Fund distributions or the redemption of Fund shares.
|
| Performance Table Market Index Changed [Text Block] |
Differences in the Fund’s performance versus an index and related attribution information with respect to particular categories of securities or individual positions may be attributable, in part, to differences in the pricing methodologies used by the Fund and the index.
|
| Updated Performance Information Location [Text Block] |
For performance current to the most recent month-end, visit www.pimco.com/literature or via 888.87.PIMCO (888.877.4626).
|
| AssetsNet |
$ 2,009,333,000
|
| Holdings Count | Holding |
1,306
|
| Advisory Fees Paid, Amount |
$ 30,112,000
|
| InvestmentCompanyPortfolioTurnover |
919.00%
|
| Additional Fund Statistics [Text Block] |
Key Fund StatisticsFootnote Reference† (as of the end of the reporting period)
Total Net Assets |
$2,009,333 |
# of Portfolio Holdings |
1,306 |
Portfolio Turnover Rate |
919% |
Total Net Advisory Fees Paid During the Reporting Period |
$30,112 |
| Footnote |
Description |
Footnote† |
Dollar amounts displayed in 000's | |
| Holdings [Text Block] |
Security Type Breakdown (% of Net Asset Value)Footnote Reference*
U.S. Government Agencies |
41.4% |
Commodities |
27.0% |
Corporate Bonds & Notes |
5.4% |
Asset-Backed Securities |
3.5% |
Non-Agency Mortgage-Backed Securities |
0.3% |
Short-Term Instruments |
11.1% |
Affiliated Investments |
42.1% |
Financial Derivative Instruments |
(3.7%) |
Other Assets and Liabilities, Net |
(27.1%) |
Total |
100.0% |
| Footnote |
Description |
Footnote* |
% of Net Asset Value includes derivatives instruments, if any, valued at the value used for determining the Fund's net asset value. The notional exposure of such derivatives investments therefore may be greater than what is depicted. | |
| Material Fund Change [Text Block] |
This is a summary of certain changes and planned changes of the Fund since the beginning of the reporting period. For more information, you may refer to the Fund's next prospectus, which we expect to be available by July 31, 2025 or upon request at 888.87.PIMCO (888.877.4626). Changes to Total Annual Fund Operating Expenses. Annual fund operating expenses decreased during the year by 0.82% as a result of lower expenses related to interest. |
| Material Fund Change Expenses [Text Block] |
Changes to Total Annual Fund Operating Expenses. Annual fund operating expenses decreased during the year by 0.82% as a result of lower expenses related to interest.
|
| Summary of Change Legend [Text Block] |
This is a summary of certain changes and planned changes of the Fund since the beginning of the reporting period. For more information, you may refer to the Fund's next prospectus, which we expect to be available by July 31, 2025 or upon request at 888.87.PIMCO (888.877.4626).
|
| C000132357 |
|
| Shareholder Report [Line Items] |
|
| Fund Name |
PIMCO TRENDS Managed Futures Strategy Fund
|
| Class Name |
I-2
|
| Trading Symbol |
PQTPX
|
| Annual or Semi-Annual Statement [Text Block] |
This annual shareholder report contains important information about the PIMCO TRENDS Managed Futures Strategy Fund (the "Fund") for the period of April 1, 2024 to March 31, 2025 (the "reporting period").
|
| Shareholder Report Annual or Semi-Annual |
Annual Shareholder Report
|
| Additional Information [Text Block] |
You can find additional information about the Fund at www.pimco.com/literature. You can also request this information by contacting us at 888.87.PIMCO (888.877.4626).
|
| Material Fund Change Notice [Text Block] |
This report describes changes to the Fund that occurred during the reporting period.
|
| Additional Information Phone Number |
888.87.PIMCO (888.877.4626)
|
| Expenses [Text Block] |
What were the Fund costs for the reporting period?(based on a hypothetical $10,000 investment)
Class Name |
Cost of a $10,000 investment |
Costs paid as a percentage of a $10,000 investment |
I-2 |
$155 |
1.64% | |
| Expenses Paid, Amount |
$ 155
|
| Expense Ratio, Percent |
1.64%
|
| Factors Affecting Performance [Text Block] |
How did the Fund perform during the reporting period and what affected its performance?The following affected performance (on a gross basis) during the reporting period: Positioning across global interest rates, notably in United Kingdom, Canadian, and Hungarian rates, detracted from performance, as rates reversed sharply. Positioning in energy commodities, notably German power and European Union Allowances, detracted from performance, as prices reversed sharply. Long positions across equity indices in Japan and the U.S. detracted from performance, as prices declined, and short positions in Chinese equities also detracted from performance, as prices increased. Short positions in Canadian dollar and developed market European currencies, notably Swiss franc and the euro, against the U.S. dollar contributed to performance, as prices declined. Long positions in coffee contributed to performance, as global coffee prices increased. Short positions in cotton contributed to performance, as cotton prices decreased.
|
| Performance Past Does Not Indicate Future [Text] |
Performance quoted represents past performance. Past performance is not a guarantee or a reliable indicator of future results.
|
| Line Graph [Table Text Block] |

|
I-2 |
Bloomberg U.S. Aggregate Index |
ICE BofA SOFR Overnight Rate IndexFootnote Reference(1)Footnote Reference(2) |
3/31/15 |
$1,000,000 |
$1,000,000 |
$1,000,000 |
4/30/15 |
$967,742 |
$996,412 |
$1,000,229 |
5/31/15 |
$929,211 |
$994,012 |
$1,000,460 |
6/30/15 |
$931,175 |
$983,174 |
$1,000,689 |
7/31/15 |
$926,601 |
$990,008 |
$1,000,924 |
8/31/15 |
$914,710 |
$988,586 |
$1,001,159 |
9/30/15 |
$944,461 |
$995,273 |
$1,001,394 |
10/31/15 |
$908,064 |
$995,439 |
$1,001,666 |
11/30/15 |
$908,997 |
$992,809 |
$1,001,940 |
12/31/15 |
$885,204 |
$989,601 |
$1,002,212 |
1/31/16 |
$915,031 |
$1,003,219 |
$1,002,719 |
2/29/16 |
$973,724 |
$1,010,335 |
$1,003,226 |
3/31/16 |
$946,783 |
$1,019,605 |
$1,003,732 |
4/30/16 |
$934,275 |
$1,023,519 |
$1,004,260 |
5/31/16 |
$914,069 |
$1,023,781 |
$1,004,788 |
6/30/16 |
$927,540 |
$1,042,177 |
$1,005,317 |
7/31/16 |
$939,086 |
$1,048,765 |
$1,005,845 |
8/31/16 |
$936,199 |
$1,047,566 |
$1,006,374 |
9/30/16 |
$918,880 |
$1,046,952 |
$1,006,904 |
10/31/16 |
$902,523 |
$1,038,944 |
$1,007,607 |
11/30/16 |
$902,523 |
$1,014,369 |
$1,008,310 |
12/31/16 |
$913,107 |
$1,015,800 |
$1,009,013 |
1/31/17 |
$898,674 |
$1,017,793 |
$1,009,853 |
2/28/17 |
$907,334 |
$1,024,634 |
$1,010,693 |
3/31/17 |
$900,599 |
$1,024,097 |
$1,011,533 |
4/30/17 |
$901,561 |
$1,032,000 |
$1,012,501 |
5/31/17 |
$905,409 |
$1,039,943 |
$1,013,468 |
6/30/17 |
$883,279 |
$1,038,896 |
$1,014,436 |
7/31/17 |
$905,409 |
$1,043,367 |
$1,015,532 |
8/31/17 |
$920,804 |
$1,052,726 |
$1,016,629 |
9/30/17 |
$901,500 |
$1,047,712 |
$1,017,727 |
10/31/17 |
$928,497 |
$1,048,319 |
$1,018,858 |
11/30/17 |
$933,318 |
$1,046,973 |
$1,019,989 |
12/31/17 |
$933,318 |
$1,051,778 |
$1,021,122 |
1/31/18 |
$964,171 |
$1,039,665 |
$1,022,563 |
2/28/18 |
$906,321 |
$1,029,809 |
$1,024,006 |
3/31/18 |
$916,927 |
$1,036,414 |
$1,025,451 |
4/30/18 |
$908,249 |
$1,028,705 |
$1,027,418 |
5/31/18 |
$906,321 |
$1,036,047 |
$1,029,389 |
6/30/18 |
$921,961 |
$1,034,773 |
$1,031,364 |
7/31/18 |
$911,342 |
$1,035,019 |
$1,033,370 |
8/31/18 |
$926,789 |
$1,041,679 |
$1,035,380 |
9/30/18 |
$898,034 |
$1,034,971 |
$1,037,394 |
10/31/18 |
$906,734 |
$1,026,792 |
$1,039,457 |
11/30/18 |
$912,534 |
$1,032,921 |
$1,041,524 |
12/31/18 |
$954,767 |
$1,051,898 |
$1,043,595 |
1/31/19 |
$917,041 |
$1,063,068 |
$1,046,033 |
2/28/19 |
$920,910 |
$1,062,452 |
$1,048,476 |
3/31/19 |
$956,274 |
$1,082,853 |
$1,050,925 |
4/30/19 |
$969,852 |
$1,083,130 |
$1,053,203 |
5/31/19 |
$964,033 |
$1,102,358 |
$1,055,486 |
6/30/19 |
$968,125 |
$1,116,201 |
$1,057,774 |
7/31/19 |
$990,548 |
$1,118,657 |
$1,059,827 |
8/31/19 |
$1,019,797 |
$1,147,643 |
$1,061,885 |
9/30/19 |
$976,239 |
$1,141,531 |
$1,063,947 |
10/31/19 |
$963,459 |
$1,144,969 |
$1,065,813 |
11/30/19 |
$965,425 |
$1,144,386 |
$1,067,682 |
12/31/19 |
$981,818 |
$1,143,588 |
$1,069,554 |
1/31/20 |
$965,950 |
$1,165,596 |
$1,071,288 |
2/29/20 |
$988,760 |
$1,186,575 |
$1,073,023 |
3/31/20 |
$1,050,248 |
$1,179,592 |
$1,074,762 |
4/30/20 |
$1,042,314 |
$1,200,561 |
$1,076,061 |
5/31/20 |
$1,039,338 |
$1,206,151 |
$1,077,361 |
6/30/20 |
$1,008,024 |
$1,213,749 |
$1,078,663 |
7/31/20 |
$1,040,411 |
$1,231,878 |
$1,078,940 |
8/31/20 |
$1,029,278 |
$1,221,935 |
$1,079,217 |
9/30/20 |
$1,000,099 |
$1,221,265 |
$1,079,494 |
10/31/20 |
$1,001,125 |
$1,215,812 |
$1,079,692 |
11/30/20 |
$1,018,563 |
$1,227,742 |
$1,079,890 |
12/31/20 |
$1,067,846 |
$1,229,433 |
$1,080,089 |
1/31/21 |
$1,062,642 |
$1,220,618 |
$1,080,317 |
2/28/21 |
$1,079,295 |
$1,202,992 |
$1,080,546 |
3/31/21 |
$1,101,159 |
$1,187,971 |
$1,080,774 |
4/30/21 |
$1,118,852 |
$1,197,356 |
$1,080,957 |
5/31/21 |
$1,145,913 |
$1,201,268 |
$1,081,139 |
6/30/21 |
$1,155,358 |
$1,209,708 |
$1,081,321 |
7/31/21 |
$1,168,963 |
$1,223,233 |
$1,081,454 |
8/31/21 |
$1,189,894 |
$1,220,905 |
$1,081,587 |
9/30/21 |
$1,228,749 |
$1,210,334 |
$1,081,719 |
10/31/21 |
$1,264,486 |
$1,210,000 |
$1,081,838 |
11/30/21 |
$1,203,522 |
$1,213,580 |
$1,081,957 |
12/31/21 |
$1,226,218 |
$1,210,475 |
$1,082,075 |
1/31/22 |
$1,228,350 |
$1,184,396 |
$1,082,277 |
2/28/22 |
$1,266,736 |
$1,171,183 |
$1,082,479 |
3/31/22 |
$1,337,553 |
$1,138,645 |
$1,082,681 |
4/30/22 |
$1,425,649 |
$1,095,436 |
$1,083,588 |
5/31/22 |
$1,407,385 |
$1,102,499 |
$1,084,497 |
6/30/22 |
$1,467,892 |
$1,085,203 |
$1,085,406 |
7/31/22 |
$1,401,417 |
$1,111,719 |
$1,086,882 |
8/31/22 |
$1,412,314 |
$1,080,306 |
$1,089,024 |
9/30/22 |
$1,510,269 |
$1,033,630 |
$1,091,245 |
10/31/22 |
$1,509,164 |
$1,020,242 |
$1,094,093 |
11/30/22 |
$1,373,273 |
$1,057,762 |
$1,097,463 |
12/31/22 |
$1,365,475 |
$1,052,991 |
$1,101,293 |
1/31/23 |
$1,375,255 |
$1,085,385 |
$1,105,379 |
2/28/23 |
$1,374,032 |
$1,057,322 |
$1,109,281 |
3/31/23 |
$1,277,459 |
$1,084,180 |
$1,113,695 |
4/30/23 |
$1,301,908 |
$1,090,751 |
$1,118,173 |
5/31/23 |
$1,350,806 |
$1,078,874 |
$1,123,014 |
6/30/23 |
$1,350,806 |
$1,075,027 |
$1,127,753 |
7/31/23 |
$1,320,244 |
$1,074,277 |
$1,132,705 |
8/31/23 |
$1,268,902 |
$1,067,415 |
$1,137,880 |
9/30/23 |
$1,323,912 |
$1,040,290 |
$1,142,922 |
10/31/23 |
$1,337,359 |
$1,023,873 |
$1,148,156 |
11/30/23 |
$1,259,122 |
$1,070,241 |
$1,153,254 |
12/31/23 |
$1,308,020 |
$1,111,209 |
$1,158,559 |
1/31/24 |
$1,295,795 |
$1,108,157 |
$1,163,888 |
2/29/24 |
$1,331,247 |
$1,092,501 |
$1,168,881 |
3/31/24 |
$1,354,473 |
$1,102,589 |
$1,174,247 |
4/30/24 |
$1,372,810 |
$1,074,739 |
$1,179,460 |
5/31/24 |
$1,334,914 |
$1,092,959 |
$1,184,862 |
6/30/24 |
$1,298,240 |
$1,103,307 |
$1,189,779 |
7/31/24 |
$1,286,016 |
$1,129,077 |
$1,195,621 |
8/31/24 |
$1,243,230 |
$1,145,301 |
$1,201,121 |
9/30/24 |
$1,257,900 |
$1,160,636 |
$1,206,310 |
10/31/24 |
$1,209,002 |
$1,131,854 |
$1,211,352 |
11/30/24 |
$1,234,673 |
$1,143,821 |
$1,216,089 |
12/31/24 |
$1,267,679 |
$1,125,101 |
$1,220,844 |
1/31/25 |
$1,244,453 |
$1,131,070 |
$1,225,398 |
2/28/25 |
$1,215,114 |
$1,155,956 |
$1,229,539 |
3/31/25 |
$1,210,224 |
$1,156,391 |
$1,234,125 |
|
| Average Annual Return [Table Text Block] |
Class/Index Name |
1 Year |
5 Years |
10 Years |
I-2 |
(10.65%) |
2.88% |
1.93% |
Bloomberg U.S. Aggregate Index |
4.88% |
(0.40%) |
1.46% |
ICE BofA SOFR Overnight Rate IndexFootnote Reference(1)Footnote Reference(2) |
5.10% |
2.66% |
-% | |
| No Deduction of Taxes [Text Block] |
Returns shown do not reflect the deduction of taxes that a shareholder would pay on Fund distributions or the redemption of Fund shares.
|
| Performance Table Market Index Changed [Text Block] |
Differences in the Fund’s performance versus an index and related attribution information with respect to particular categories of securities or individual positions may be attributable, in part, to differences in the pricing methodologies used by the Fund and the index.
|
| Updated Performance Information Location [Text Block] |
For performance current to the most recent month-end, visit www.pimco.com/literature or via 888.87.PIMCO (888.877.4626).
|
| AssetsNet |
$ 2,009,333,000
|
| Holdings Count | Holding |
1,306
|
| Advisory Fees Paid, Amount |
$ 30,112,000
|
| InvestmentCompanyPortfolioTurnover |
919.00%
|
| Additional Fund Statistics [Text Block] |
Key Fund StatisticsFootnote Reference† (as of the end of the reporting period)
Total Net Assets |
$2,009,333 |
# of Portfolio Holdings |
1,306 |
Portfolio Turnover Rate |
919% |
Total Net Advisory Fees Paid During the Reporting Period |
$30,112 |
| Footnote |
Description |
Footnote† |
Dollar amounts displayed in 000's | |
| Holdings [Text Block] |
Security Type Breakdown (% of Net Asset Value)Footnote Reference*
U.S. Government Agencies |
41.4% |
Commodities |
27.0% |
Corporate Bonds & Notes |
5.4% |
Asset-Backed Securities |
3.5% |
Non-Agency Mortgage-Backed Securities |
0.3% |
Short-Term Instruments |
11.1% |
Affiliated Investments |
42.1% |
Financial Derivative Instruments |
(3.7%) |
Other Assets and Liabilities, Net |
(27.1%) |
Total |
100.0% |
| Footnote |
Description |
Footnote* |
% of Net Asset Value includes derivatives instruments, if any, valued at the value used for determining the Fund's net asset value. The notional exposure of such derivatives investments therefore may be greater than what is depicted. | |
| Material Fund Change [Text Block] |
This is a summary of certain changes and planned changes of the Fund since the beginning of the reporting period. For more information, you may refer to the Fund's next prospectus, which we expect to be available by July 31, 2025 or upon request at 888.87.PIMCO (888.877.4626). Changes to Total Annual Fund Operating Expenses. Annual fund operating expenses decreased during the year by 0.82% as a result of lower expenses related to interest. |
| Material Fund Change Expenses [Text Block] |
Changes to Total Annual Fund Operating Expenses. Annual fund operating expenses decreased during the year by 0.82% as a result of lower expenses related to interest.
|
| Summary of Change Legend [Text Block] |
This is a summary of certain changes and planned changes of the Fund since the beginning of the reporting period. For more information, you may refer to the Fund's next prospectus, which we expect to be available by July 31, 2025 or upon request at 888.87.PIMCO (888.877.4626).
|