The CEO Pay Ratio reported above is a reasonable estimate calculated in a manner consistent with SEC rules, based on our internal records and the methodology described above. The SEC rules for identifying the median compensated employee allow companies to adopt a variety of methodologies, to apply certain exclusions and to make reasonable estimates and assumptions that reflect their employee populations and compensation practices. Accordingly, the pay ratio reported by other companies may not be comparable to the CEO Pay Ratio reported above, as other companies have different employee populations and compensation practices and may use different methodologies, exclusions, estimates and assumptions in calculating their own pay ratios.
Pay Versus Performance Table
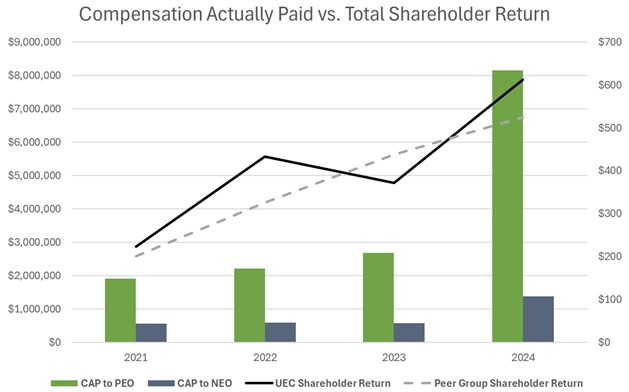
As required by Item 402(v) of Regulation S-K, we are providing the following information for the principal executive officer (the “PEO; Amir Adnani”) and the average for the Named Executive Officers excluding the PEO (the “Non-PEO NEOs”) for the fiscal years ended July 31, 2024, 2023, 2022 and 2021.
|
|
|
|
Average Summary Compensation Table Total for Non-PEO ($) (d) |
Average Actually Paid to Non-PEO NEOs (2) ($) (e) |
Value of Initial Fixed $100 Investment Based On: |
|
||||||||||||||||||||
|
Year (a) |
Summary Compensation ($) (b) |
Compensation Actually Paid to PEO (2) ($) (c) |
Total Shareholder Return (3) ($) (f) |
Peer Group Total Shareholder Return (3)(4) ($) (g) |
Net Income (loss) (4)(5) ($ in thousands) (h) |
|||||||||||||||||||||
|
2024 |
5,365,453 | 8,144,553 | 807,301 | 1,378,756 | 612.41 | 524.59 | (29,221 | ) | ||||||||||||||||||
|
2023 |
3,700,780 | 2,690,924 | 742,727 | 581,394 | 371.79 | 437.58 | (3,307 | ) | ||||||||||||||||||
|
2022 |
2,315,872 | 2,212,036 | 603,525 | 590,809 | 433.75 | 325.49 | 5,252 | |||||||||||||||||||
|
2021 |
1,635,553 | 1,907,583 | 500,947 | 557,369 | 224.10 | 201.29 | (14,813 | ) | ||||||||||||||||||
Notes:
|
(1) |
For column (b), the dollar amounts represent total compensation paid to our PEO, Amir Adnani, and are taken directly from the Summary Compensation Table included in the Company’s Annual Reports. For column (d), the dollar amounts represent the average total compensation paid to Non-PEO NEOs, and are taken directly from the Summary Compensation Table included in the Company’s Annual Reports. For Fiscal 2024, our Non-PEO NEOs included Scott Melbye, Pat Obara and Brent Berg. For Fiscals 2023, 2022 and 2021 our Non-PEO NEO’s included Scott Melbye and Pat Obara. |
|
(2) |
The following tables set forth the adjustments made to arrive at the compensation actually paid to our PEO and Non-PEO NEOs during each of the fiscal years reflected in this table. |
Compensation Actually Paid to PEO and Average Compensation Actually Paid to Non-PEO NEOs
|
Adjustments to Determine |
2024 |
2023 |
2022 |
2021 |
||||||||||||||||||||||||||||
|
Compensation Actually Paid |
PEO ($) |
Non-PEO NEOs ($) |
PEO ($) |
Non-PEO NEOs ($) |
PEO ($) |
Non-PEO NEOs ($) |
PEO ($) |
Non-PEO NEOs ($) |
||||||||||||||||||||||||
|
Total reported in Summary Compensation Table |
5,365,453 | 807,301 | 3,700,780 | 742,727 | 2,315,872 | 603,525 | 1,635,553 | 500,947 | ||||||||||||||||||||||||
|
Less, amounts reported under “Stock Awards” in the Summary Compensation Table |
(3,640,453 | ) | (397,756 | ) | (2,026,264 | ) | (312,562 | ) | (964,705 | ) | (233,357 | ) | (895,553 | ) | (255,292 | ) | ||||||||||||||||
|
Less, amounts reported under “Option Awards” in the Summary Compensation Table |
- | - | (240,516 | ) | (37,101 | ) | - | - | - | - | ||||||||||||||||||||||
|
Add, fair value of equity awards granted during the year that were outstanding and unvested as of year end (*) |
3,640,453 | 397,756 | 1,320,337 | 203,669 | 573,602 | 138,751 | 506,250 | 144,314 | ||||||||||||||||||||||||
|
Add, change as of the end of the fiscal year (from the end of the prior fiscal year) in fair value of awards granted in prior fiscal years that are outstanding and unvested as of year end (*) |
1,309,012 | 211,109 | (63,413 | ) | (15,339 | ) | 287,267 | 81,890 | 661,333 | 167,400 | ||||||||||||||||||||||
|
Add, change as of the vesting date (from the end of the prior fiscal year) in fair value of awards granted in prior fiscal years that vested during the fiscal year (*) |
1,470,088 | 360,346 | - | - | - | - | - | - | ||||||||||||||||||||||||
|
Total Adjustments |
2,779,100 | 571,455 | (1,009,856 | ) | (161,333 | ) | (103,836 | ) | (12,716 | ) | 272,030 | 56,422 | ||||||||||||||||||||
|
Compensation Actually Paid |
8,144,553 | 1,378,756 | 2,690,924 | 581,394 | 2,212,036 | 590,809 | 1,907,583 | 557,369 | ||||||||||||||||||||||||
(*) The fair value or incremental fair value of all incentive equity awards is determined in accordance with ASC 718, Compensation – Stock Compensation, generally using the same methodology and assumptions the Company uses for financial reporting purposes when determining the grant date fair value of our equity awards reflected in the Summary Compensation Table.
Notes (continued):
|
(3) |
Total shareholder return represents the value of a deemed fixed investment of $100 at market close on July 31, 2020, assuming the reinvestment of dividends, if any. Total shareholder return is calculated by dividing the sum of the cumulative amount of dividends for the measurement period, assuming dividend reinvestment, and the difference between the Company’s share price at the end and the beginning of the measurement period, by the share price at the beginning of the measurement period. For the purposes of this table the Peer Group consisted of the following companies: Black Stone Minerals, L.P., Cameco Corporation, Comstock Resources, Inc., Denison Mines Corp., Energy Fuels Inc., Gulfport Energy Corporation, Magnolia Oil & Gas Corporation, NexGen Energy Ltd., NGEx Minerals Ltd., Northern Oil and Gas, Inc. and Vital Energy, Inc. For the purposes of understanding the cumulative returns over time, this table should be read from bottom to top. |
|
(4) |
Beginning in Fiscal 2024, the Company updated the peer group used for total return comparison in this table. For more details related to the current Peer Group in comparison to the previous peer group, refer to the “Benchmarking Compensation and Peer Groups” section above. For consistency and comparability, the total return for the current Peer Group has been calculated and presented retroactively for all years included in this table, starting from the base year date of August 1, 2020. The total return of the peer group used prior to Fiscal 2024 for the same period is provided below for reference: |