Shareholder Report
|
12 Months Ended |
|
Mar. 31, 2025
USD ($)
Holding
|
|---|
| Shareholder Report [Line Items] |
|
| Document Type |
N-CSR
|
| Amendment Flag |
false
|
| Registrant Name |
SEI EXCHANGE TRADED FUNDS
|
| Entity Central Index Key |
0001888997
|
| Entity Investment Company Type |
N-1A
|
| Document Period End Date |
Mar. 31, 2025
|
| C000233740 |
|
| Shareholder Report [Line Items] |
|
| Fund Name |
SEI Enhanced U.S. Large Cap Quality Factor ETF
|
| Class Name |
SEI Enhanced U.S. Large Cap Quality Factor ETF
|
| Trading Symbol |
SEIQ
|
| Security Exchange Name |
CboeBZX
|
| Annual or Semi-Annual Statement [Text Block] |
This annual shareholder report contains important information about the SEI Enhanced U.S. Large Cap Quality Factor ETF (the "Fund") for the period from April 1, 2024 to March 31, 2025.
|
| Shareholder Report Annual or Semi-Annual |
Annual Shareholder Report
|
| Additional Information [Text Block] |
You can find additional information about the Fund at https://www.seic.com/mutual-fund-documentation/prospectuses-and-reports. You can also request this information by contacting us at 610-676-1000.
|
| Additional Information Phone Number |
610-676-1000
|
| Additional Information Website |
https://www.seic.com/mutual-fund-documentation/prospectuses-and-reports
|
| Expenses [Text Block] |
What were the Fund costs for the last year?(based on a hypothetical $10,000 investment) Fund Name | Costs of a $10,000 investment | Costs paid as a percentage of a $10,000 investment |
|---|
SEI Enhanced U.S. Large Cap Quality Factor ETF | $16 | 0.15% |
|---|
|
| Expenses Paid, Amount |
$ 16
|
| Expense Ratio, Percent |
0.15%
|
| Factors Affecting Performance [Text Block] |
How did the Fund perform in the last year?The Fund outperformed its primary benchmark, the Russell 1000 Index, for the 12-month period ending March 31, 2025. Quality factors outperformed within the U.S. large-cap equity universe over the reporting period, driven by strong stock-level contributors and exposure to low volatility characteristics. This positioning benefited Fund performance in an environment of decelerating economic growth, elevated geopolitical risk, and persistent inflation uncertainty. While the Fund underperformed its benchmark early in the period—due in part to a structural underweight allocation to expensive, artificial intelligence (AI)-driven mega-cap technology stocks—performance subsequently rebounded as investor sentiment rotated toward more defensive areas of the market. This shift was rewarded through the Fund’s primary quality factor exposure and provided a meaningful tailwind to the relative performance. Regarding sector allocation, Fund performance was bolstered by an overweight to consumer staples (tobacco companies Philip Morris International and Altria Group), an underweight to materials, and stock selection within industrials. Conversely, stock selection within the information technology sector and an underweight to financials detracted from Fund performance for the period. |
| Performance Past Does Not Indicate Future [Text] |
Past performance is not indicative of future performance.
|
| Average Annual Return [Table Text Block] |
Average Annual Total Returns as of March 31, 2025Fund/Index Name | 1 Year | Annualized
Since
Inception |
|---|
SEI Enhanced U.S. Large Cap Quality Factor ETF | 9.65% | 13.64% |
|---|
S&P 500 Index (TR) | 8.25% | 15.03% |
|---|
Russell 1000 Index (USD) | 7.82% | 14.81% |
|---|
|
| Performance Inception Date |
May 18, 2022
|
| No Deduction of Taxes [Text Block] |
The table and graph presented above do not reflect the deduction of taxes a shareholder would pay on Fund distributions or the redemption of Fund Shares.
|
| AssetsNet |
$ 279,166,000
|
| Holdings Count | Holding |
58
|
| Advisory Fees Paid, Amount |
$ 377
|
| InvestmentCompanyPortfolioTurnover |
40.00%
|
| Additional Fund Statistics [Text Block] |
Key Fund Statistics as of March 31, 2025 | Total Net Assets (000's) | Number of Holdings | Total Advisory Fees Paid (000's) | Portfolio Turnover Rate |
|---|
| $279,166 | 58 | $377 | 40% |
|---|
|
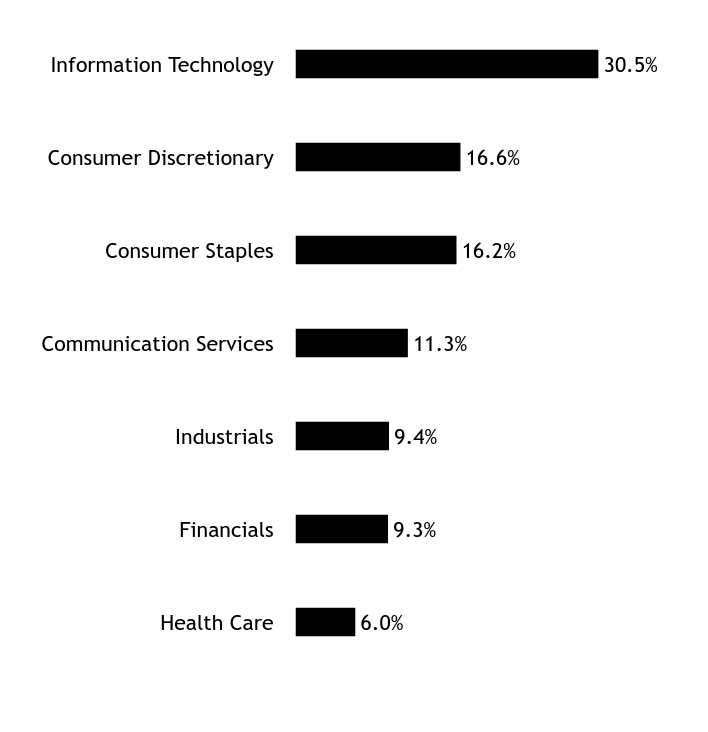
| Holdings [Text Block] |
Sector WeightingsFootnote Reference*Value | Value |
|---|
Health Care | 6.0% | Financials | 9.3% | Industrials | 9.4% | Communication Services | 11.3% | Consumer Staples | 16.2% | Consumer Discretionary | 16.6% | Information Technology | 30.5% |
| Footnote | Description | Footnote* | Percentages are calculated based on total net assets. |
|
| Largest Holdings [Text Block] |
Holding Name | | | Percentage of
Total Net Assets |
|---|
Apple | | | 7.3% | Microsoft | | | 5.5% | Meta Platforms, Cl A | | | 4.4% | Alphabet, Cl C | | | 4.1% | Visa, Cl A | | | 3.4% | Philip Morris International | | | 3.4% | O'Reilly Automotive | | | 3.3% | Booking Holdings | | | 3.0% | Johnson & Johnson | | | 3.0% | Procter & Gamble | | | 2.8% |
|
| Material Fund Change [Text Block] |
There were no material changes during the reporting period. |
| C000233739 |
|
| Shareholder Report [Line Items] |
|
| Fund Name |
SEI Enhanced U.S. Large Cap Momentum Factor ETF
|
| Class Name |
SEI Enhanced U.S. Large Cap Momentum Factor ETF
|
| Trading Symbol |
SEIM
|
| Security Exchange Name |
CboeBZX
|
| Annual or Semi-Annual Statement [Text Block] |
This annual shareholder report contains important information about the SEI Enhanced U.S. Large Cap Momentum Factor ETF (the "Fund") for the period from April 1, 2024 to March 31, 2025.
|
| Shareholder Report Annual or Semi-Annual |
Annual Shareholder Report
|
| Additional Information [Text Block] |
You can find additional information about the Fund at https://www.seic.com/mutual-fund-documentation/prospectuses-and-reports. You can also request this information by contacting us at 610-676-1000.
|
| Additional Information Phone Number |
610-676-1000
|
| Additional Information Website |
https://www.seic.com/mutual-fund-documentation/prospectuses-and-reports
|
| Expenses [Text Block] |
What were the Fund costs for the last year?(based on a hypothetical $10,000 investment) Fund Name | Costs of a $10,000 investment | Costs paid as a percentage of a $10,000 investment |
|---|
SEI Enhanced U.S. Large Cap Momentum Factor ETF | $16 | 0.15% |
|---|
|
| Expenses Paid, Amount |
$ 16
|
| Expense Ratio, Percent |
0.15%
|
| Factors Affecting Performance [Text Block] |
How did the Fund perform in the last year?The Fund outperformed its primary benchmark, the Russell 1000 Index, for the 12-month period ending March 31, 2025. Momentum factors outperformed within the U.S. large-cap equity universe over the reporting period due to the persistence of previously established market leadership from mega-cap technology stocks and other artificial intelligence (AI)-related names. The contribution from momentum factors was hampered by the Fund's inherent underweight exposure to the low volatility factor, which held up firmly when the market went through a rotation away from mega-cap stocks in mid-2024 and the first quarter of 2025. Positioning in recent months to steer the Fund away from being overweight in extremely expensive momentum stocks helped to limit a decline in the Fund’s net asset value. While the overall contribution from factors during the reporting period was not significant, Fund performance benefited primarily from an overweight allocation to AppLovin Corp., as investors' enthusiasm in the AI-powered app monetization company continued throughout 2024, on the back of strong earnings reports. Fund performance also was enhanced by an overweight to Howmet Aerospace, as investors took a favorable view of the stock’s performance and profitability guidance amid a recovery in commercial aircraft production, and Axon Enterprise, which experienced strong earnings growth after adding new products and services to its law enforcement technology business. |
| Performance Past Does Not Indicate Future [Text] |
Past performance is not indicative of future performance.
|
| Average Annual Return [Table Text Block] |
Average Annual Total Returns as of March 31, 2025Fund/Index Name | 1 Year | Annualized
Since
Inception |
|---|
SEI Enhanced U.S. Large Cap Momentum Factor ETF | 12.97% | 14.49% |
|---|
S&P 500 Index (TR) | 8.25% | 15.03% |
|---|
Russell 1000 Index (USD) | 7.82% | 14.81% |
|---|
|
| Performance Inception Date |
May 18, 2022
|
| No Deduction of Taxes [Text Block] |
The table and graph presented above do not reflect the deduction of taxes a shareholder would pay on Fund distributions or the redemption of Fund Shares.
|
| AssetsNet |
$ 516,041,000
|
| Holdings Count | Holding |
65
|
| Advisory Fees Paid, Amount |
$ 757
|
| InvestmentCompanyPortfolioTurnover |
78.00%
|
| Additional Fund Statistics [Text Block] |
Key Fund Statistics as of March 31, 2025 | Total Net Assets (000's) | Number of Holdings | Total Advisory Fees Paid (000's) | Portfolio Turnover Rate |
|---|
| $516,041 | 65 | $757 | 78% |
|---|
|
| Holdings [Text Block] |
Sector WeightingsFootnote Reference*Value | Value |
|---|
Energy | 0.5% | Materials | 1.8% | Utilities | 2.6% | Consumer Staples | 3.5% | Consumer Discretionary | 10.1% | Communication Services | 11.0% | Industrials | 12.8% | Financials | 15.0% | Health Care | 16.3% | Information Technology | 25.6% |
| Footnote | Description | Footnote* | Percentages are calculated based on total net assets. |
|
| Largest Holdings [Text Block] |
Holding Name | | | Percentage of
Total Net Assets |
|---|
NVIDIA | | | 6.8% | Apple | | | 6.1% | Meta Platforms, Cl A | | | 4.8% | Walmart | | | 3.0% | Microsoft | | | 3.0% | Alphabet, Cl A | | | 3.0% | Howmet Aerospace | | | 2.9% | Boston Scientific | | | 2.7% | Entergy | | | 2.6% | Cencora | | | 2.5% |
|
| Material Fund Change [Text Block] |
There were no material changes during the reporting period. |
| C000233741 |
|
| Shareholder Report [Line Items] |
|
| Fund Name |
SEI Enhanced U.S. Large Cap Value Factor ETF
|
| Class Name |
SEI Enhanced U.S. Large Cap Value Factor ETF
|
| Trading Symbol |
SEIV
|
| Security Exchange Name |
CboeBZX
|
| Annual or Semi-Annual Statement [Text Block] |
This annual shareholder report contains important information about the SEI Enhanced U.S. Large Cap Value Factor ETF (the "Fund") for the period from April 1, 2024 to March 31, 2025.
|
| Shareholder Report Annual or Semi-Annual |
Annual Shareholder Report
|
| Additional Information [Text Block] |
You can find additional information about the Fund at https://www.seic.com/mutual-fund-documentation/prospectuses-and-reports. You can also request this information by contacting us at 610-676-1000.
|
| Additional Information Phone Number |
610-676-1000
|
| Additional Information Website |
https://www.seic.com/mutual-fund-documentation/prospectuses-and-reports
|
| Expenses [Text Block] |
What were the Fund costs for the last year?(based on a hypothetical $10,000 investment) Fund Name | Costs of a $10,000 investment | Costs paid as a percentage of a $10,000 investment |
|---|
SEI Enhanced U.S. Large Cap Value Factor ETF | $15 | 0.15% |
|---|
|
| Expenses Paid, Amount |
$ 15
|
| Expense Ratio, Percent |
0.15%
|
| Factors Affecting Performance [Text Block] |
How did the Fund perform in the last year?The Fund underperformed its primary benchmark, the Russell 1000 Index, for the 12-month period ending March 31, 2025. Value factors lagged within the U.S. large-cap equity universe over the reporting period, weighed down by a slowing U.S. macroeconomic backdrop, elevated market volatility driven by concerns about the Trump administration’s imposition of tariffs on imported goods, and the concentrated outperformance of expensive, artificial intelligence (AI)-related mega-cap technology stocks. This environment proved unfavorable for value-focused strategies, and the primary headwind to the Fund’s relative performance for the period resulted from sustained value factor underperformance. Despite these challenges, stock-level active risk controls contributed positively to Fund performance. In addition, secondary quality factors provided some support to Fund performance, particularly through exposure to defensive stocks. Sector allocation effects modestly enhanced the Fund’s relative performance for the reporting period. A small overweight allocation to the communication services sector and an underweight to the consumer discretionary sector bolstered performance. At the stock level, key detractors included structural underweights to shares of mega-cap companies such as Tesla Inc., Apple Inc., and Nvidia Corp., which benefited from strong investor enthusiasm around AI. Exposure to wireless chip-maker Skyworks Solutions weighed on Fund performance, reflecting investors’ concerns over its competitive positioning and loss of its major customer, Apple. These detractors were partially offset by positive contributions from positions in telecommunications company AT&T Corp. and tobacco company Altria Group, which benefited from a market rotation into defensive stocks amid shifting investor sentiment. |
| Performance Past Does Not Indicate Future [Text] |
Past performance is not indicative of future performance.
|
| Average Annual Return [Table Text Block] |
Average Annual Total Returns as of March 31, 2025Fund/Index Name | 1 Year | Annualized
Since
Inception |
|---|
SEI Enhanced U.S. Large Cap Value Factor ETF | 6.65% | 11.79% |
|---|
S&P 500 Index (TR) | 8.25% | 15.03% |
|---|
Russell 1000 Index (USD) | 7.82% | 14.81% |
|---|
|
| Performance Inception Date |
May 18, 2022
|
| No Deduction of Taxes [Text Block] |
The table and graph presented above do not reflect the deduction of taxes a shareholder would pay on Fund distributions or the redemption of Fund Shares.
|
| AssetsNet |
$ 526,127,000
|
| Holdings Count | Holding |
118
|
| Advisory Fees Paid, Amount |
$ 740
|
| InvestmentCompanyPortfolioTurnover |
60.00%
|
| Additional Fund Statistics [Text Block] |
Key Fund Statistics as of March 31, 2025 | Total Net Assets (000's) | Number of Holdings | Total Advisory Fees Paid (000's) | Portfolio Turnover Rate |
|---|
| $526,127 | 118 | $740 | 60% |
|---|
|
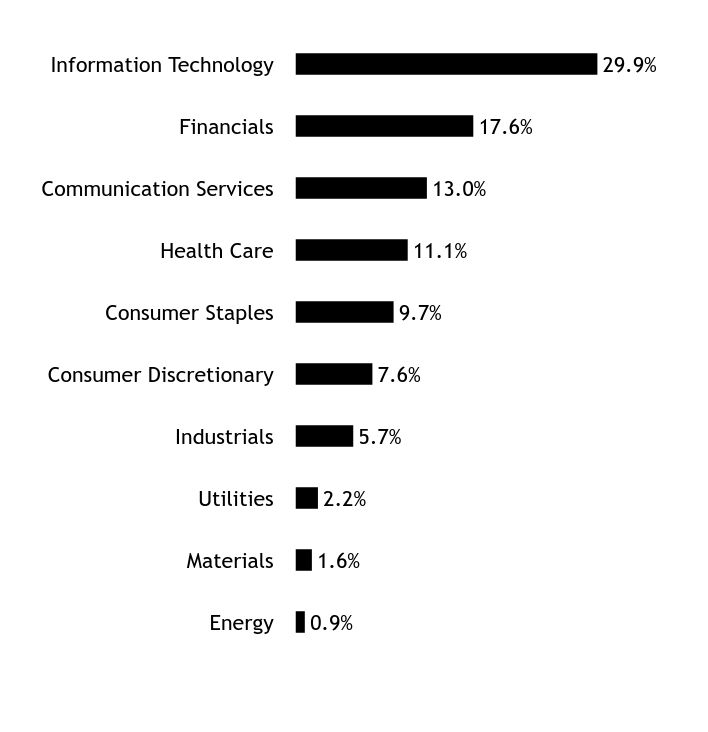
| Holdings [Text Block] |
Sector WeightingsFootnote Reference*Value | Value |
|---|
Energy | 0.9% | Materials | 1.6% | Utilities | 2.2% | Industrials | 5.7% | Consumer Discretionary | 7.6% | Consumer Staples | 9.7% | Health Care | 11.1% | Communication Services | 13.0% | Financials | 17.6% | Information Technology | 29.9% |
| Footnote | Description | Footnote* | Percentages are calculated based on total net assets. |
|
| Largest Holdings [Text Block] |
Holding Name | | | Percentage of
Total Net Assets |
|---|
Apple | | | 3.5% | AT&T | | | 3.1% | Microsoft | | | 2.9% | International Business Machines | | | 2.9% | Verizon Communications | | | 2.7% | Altria Group | | | 2.7% | Citigroup | | | 2.3% | Kroger | | | 2.3% | QUALCOMM | | | 2.3% | Alphabet, Cl C | | | 2.1% |
|
| Material Fund Change [Text Block] |
There were no material changes during the reporting period. |
| C000233738 |
|
| Shareholder Report [Line Items] |
|
| Fund Name |
SEI Enhanced Low Volatility U.S. Large Cap ETF
|
| Class Name |
SEI Enhanced Low Volatility U.S. Large Cap ETF
|
| Trading Symbol |
SELV
|
| Security Exchange Name |
CboeBZX
|
| Annual or Semi-Annual Statement [Text Block] |
This annual shareholder report contains important information about the SEI Enhanced Low Volatility U.S. Large Cap ETF (the "Fund") for the period from April 1, 2024 to March 31, 2025.
|
| Shareholder Report Annual or Semi-Annual |
Annual Shareholder Report
|
| Additional Information [Text Block] |
You can find additional information about the Fund at https://www.seic.com/mutual-fund-documentation/prospectuses-and-reports. You can also request this information by contacting us at 610-676-1000.
|
| Additional Information Phone Number |
610-676-1000
|
| Additional Information Website |
https://www.seic.com/mutual-fund-documentation/prospectuses-and-reports
|
| Expenses [Text Block] |
What were the Fund costs for the last year?(based on a hypothetical $10,000 investment) Fund Name | Costs of a $10,000 investment | Costs paid as a percentage of a $10,000 investment |
|---|
SEI Enhanced Low Volatility U.S. Large Cap ETF | $16 | 0.15% |
|---|
|
| Expenses Paid, Amount |
$ 16
|
| Expense Ratio, Percent |
0.15%
|
| Factors Affecting Performance [Text Block] |
How did the Fund perform in the last year?The Fund outperformed its primary benchmark, the Russell 1000 Index, for the 12-month period ending March 31, 2025. Low volatility factors outperformed within the U.S. large-cap equity universe over the reporting period, with gains particularly pronounced in the first quarter of 2025. This outperformance was driven by a slowing U.S. macroeconomic backdrop and heightened trade tensions related to the Trump administration’s tariffs on imported goods—an environment that favored defensive, low-beta stocks. (Beta is a quantitative measure of the volatility of a security relative to a benchmark.) The sustained exposure to the low volatility factor served as the primary driver of the Fund’s outperformance for the period. Sector allocation also contributed positively to Fund performance during the reporting period, attributable mainly to overweight positions in traditionally defensive sectors and underweights to more cyclical areas of the market. At the stock level, notable contributors to performance included defensive names such as AT&T Corp. (telecommunications), Walmart Inc. (consumer staples), Gilead Sciences Inc. (health care), and Duke Energy Corp. (utilities), which benefited from the broad rotation into relatively lower-risk stocks amid increased market uncertainty and growing investor demand for downside protection. |
| Performance Past Does Not Indicate Future [Text] |
Past performance is not indicative of future performance.
|
| Average Annual Return [Table Text Block] |
Average Annual Total Returns as of March 31, 2025Fund/Index Name | 1 Year | Annualized
Since
Inception |
|---|
SEI Enhanced Low Volatility U.S. Large Cap ETF | 12.53% | 9.68% |
|---|
S&P 500 Index (TR) | 8.25% | 15.03% |
|---|
Russell 1000 Index (USD) | 7.82% | 14.81% |
|---|
|
| Performance Inception Date |
May 18, 2022
|
| No Deduction of Taxes [Text Block] |
The table and graph presented above do not reflect the deduction of taxes a shareholder would pay on Fund distributions or the redemption of Fund Shares.
|
| AssetsNet |
$ 145,715,000
|
| Holdings Count | Holding |
79
|
| Advisory Fees Paid, Amount |
$ 200
|
| InvestmentCompanyPortfolioTurnover |
16.00%
|
| Additional Fund Statistics [Text Block] |
Key Fund Statistics as of March 31, 2025 | Total Net Assets (000's) | Number of Holdings | Total Advisory Fees Paid (000's) | Portfolio Turnover Rate |
|---|
| $145,715 | 79 | $200 | 16% |
|---|
|
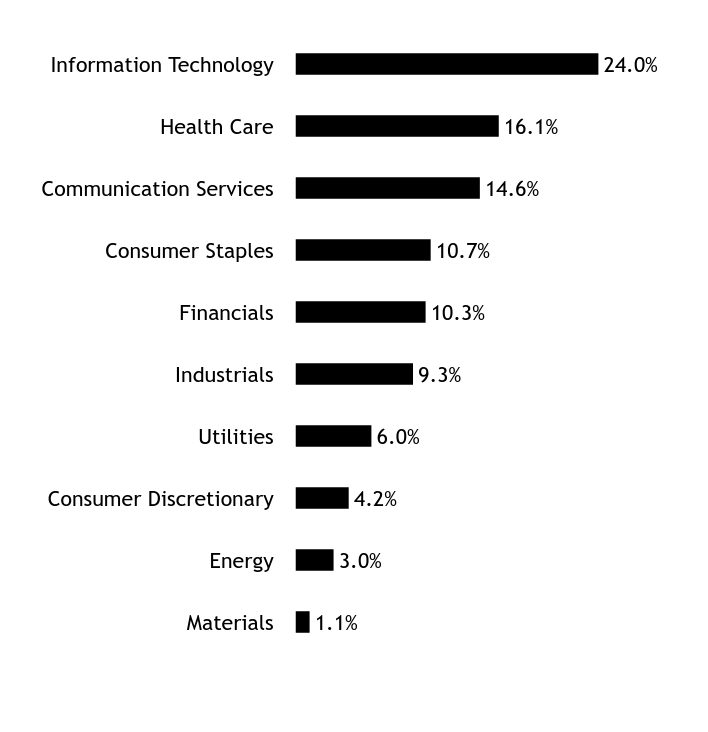
| Holdings [Text Block] |
Sector WeightingsFootnote Reference*Value | Value |
|---|
Materials | 1.1% | Energy | 3.0% | Consumer Discretionary | 4.2% | Utilities | 6.0% | Industrials | 9.3% | Financials | 10.3% | Consumer Staples | 10.7% | Communication Services | 14.6% | Health Care | 16.1% | Information Technology | 24.0% |
| Footnote | Description | Footnote* | Percentages are calculated based on total net assets. |
|
| Largest Holdings [Text Block] |
Holding Name | | | Percentage of
Total Net Assets |
|---|
Microsoft | | | 5.0% | Apple | | | 4.0% | Walmart | | | 3.3% | AT&T | | | 3.2% | Republic Services, Cl A | | | 2.9% | Johnson & Johnson | | | 2.8% | Procter & Gamble | | | 2.5% | Gilead Sciences | | | 2.4% | Cisco Systems | | | 2.4% | Cardinal Health | | | 2.4% |
|
| Material Fund Change [Text Block] |
There were no material changes during the reporting period. |
| C000251374 |
|
| Shareholder Report [Line Items] |
|
| Fund Name |
SEI Select Emerging Markets Equity ETF
|
| Class Name |
SEI Select Emerging Markets Equity ETF
|
| Trading Symbol |
SEEM
|
| Security Exchange Name |
NASDAQ
|
| Annual or Semi-Annual Statement [Text Block] |
This annual shareholder report contains important information about the SEI Select Emerging Markets Equity ETF (the "Fund") for the period from October 8, 2024 (commencement of operations) to March 31, 2025.
|
| Shareholder Report Annual or Semi-Annual |
Annual Shareholder Report
|
| Additional Information [Text Block] |
You can find additional information about the Fund at https://www.seic.com/mutual-fund-documentation/prospectuses-and-reports. You can also request this information by calling 610-676-1000.
|
| Additional Information Phone Number |
610-676-1000
|
| Additional Information Website |
https://www.seic.com/mutual-fund-documentation/prospectuses-and-reports
|
| Expenses [Text Block] |
What were the Fund costs for the period?(based on a hypothetical $10,000 investment) Fund Name | Costs of a $10,000 investmentFootnote Reference* | Costs paid as a percentage of a $10,000 investment |
|---|
SEI Select Emerging Markets Equity ETF | $28 | 0.60% |
|---|
| Footnote | Description | Footnote* | Costs shown not annualized. If the Fund had been open for the full fiscal year, costs shown would have been higher for the period ended. |
|
| Expenses Paid, Amount |
$ 28
|
| Expense Ratio, Percent |
0.60%
|
| AssetsNet |
$ 206,065,000
|
| Holdings Count | Holding |
241
|
| Advisory Fees Paid, Amount |
$ 509
|
| InvestmentCompanyPortfolioTurnover |
34.00%
|
| Additional Fund Statistics [Text Block] |
Key Fund Statistics as of March 31, 2025 | Total Net Assets (000's) | Number of Holdings | Total Advisory Fees Paid (000's) | Portfolio Turnover Rate |
|---|
| $206,065 | 241 | $509 | 34% |
|---|
|
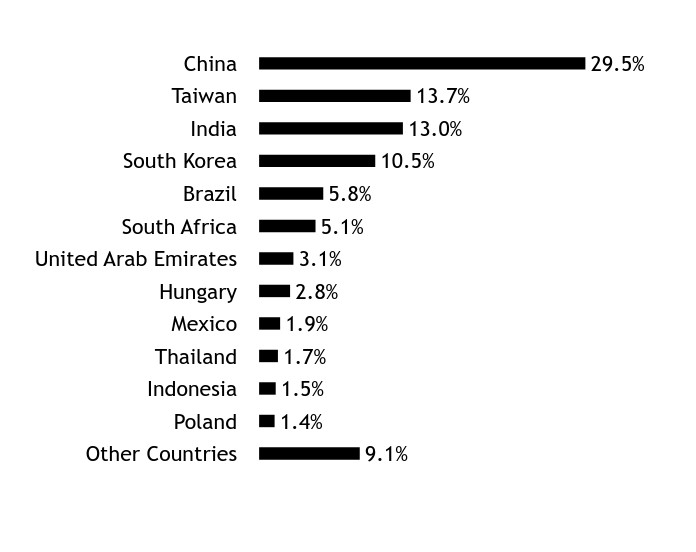
| Holdings [Text Block] |
Country WeightingsFootnote Reference*Value | Value |
|---|
Other Countries | 9.1% | Poland | 1.4% | Indonesia | 1.5% | Thailand | 1.7% | Mexico | 1.9% | Hungary | 2.8% | United Arab Emirates | 3.1% | South Africa | 5.1% | Brazil | 5.8% | South Korea | 10.5% | India | 13.0% | Taiwan | 13.7% | China | 29.5% |
| Footnote | Description | Footnote* | Percentages are calculated based on total net assets. |
|
| Largest Holdings [Text Block] |
Holding Name | | | Percentage of
Total Net Assets |
|---|
Taiwan Semiconductor Manufacturing | | | 8.2% | Tencent Holdings | | | 5.0% | Alibaba Group Holding | | | 3.8% | Samsung Electronics | | | 1.9% | Petroleo Brasileiro, Preference | | | 1.7% | Emaar Properties PJSC | | | 1.5% | OTP Bank Nyrt | | | 1.5% | ICICI Bank ADR | | | 1.4% | Meituan, Cl B | | | 1.3% | Xiaomi, Cl B | | | 1.3% |
|
| C000251375 |
|
| Shareholder Report [Line Items] |
|
| Fund Name |
SEI Select International Equity ETF
|
| Class Name |
SEI Select International Equity ETF
|
| Trading Symbol |
SEIE
|
| Security Exchange Name |
NASDAQ
|
| Annual or Semi-Annual Statement [Text Block] |
This annual shareholder report contains important information about the SEI Select International Equity ETF (the "Fund") for the period from October 8, 2024 (commencement of operations) to March 31, 2025.
|
| Shareholder Report Annual or Semi-Annual |
Annual Shareholder Report
|
| Additional Information [Text Block] |
You can find additional information about the Fund at https://www.seic.com/mutual-fund-documentation/prospectuses-and-reports. You can also request this information by calling 610-676-1000.
|
| Additional Information Phone Number |
610-676-1000
|
| Additional Information Website |
https://www.seic.com/mutual-fund-documentation/prospectuses-and-reports
|
| Expenses [Text Block] |
What were the Fund costs for the period?(based on a hypothetical $10,000 investment) Fund Name | Costs of a $10,000 investmentFootnote Reference* | Costs paid as a percentage of a $10,000 investment |
|---|
SEI Select International Equity ETF | $24 | 0.50% |
|---|
| Footnote | Description | Footnote* | Costs shown not annualized. If the Fund had been open for the full fiscal year, costs shown would have been higher for the period ended. |
|
| Expenses Paid, Amount |
$ 24
|
| Expense Ratio, Percent |
0.50%
|
| AssetsNet |
$ 543,113,000
|
| Holdings Count | Holding |
320
|
| Advisory Fees Paid, Amount |
$ 1,099
|
| InvestmentCompanyPortfolioTurnover |
31.00%
|
| Additional Fund Statistics [Text Block] |
Key Fund Statistics as of March 31, 2025 | Total Net Assets (000's) | Number of Holdings | Total Advisory Fees Paid (000's) | Portfolio Turnover Rate |
|---|
| $543,113 | 320 | $1,099 | 31% |
|---|
|
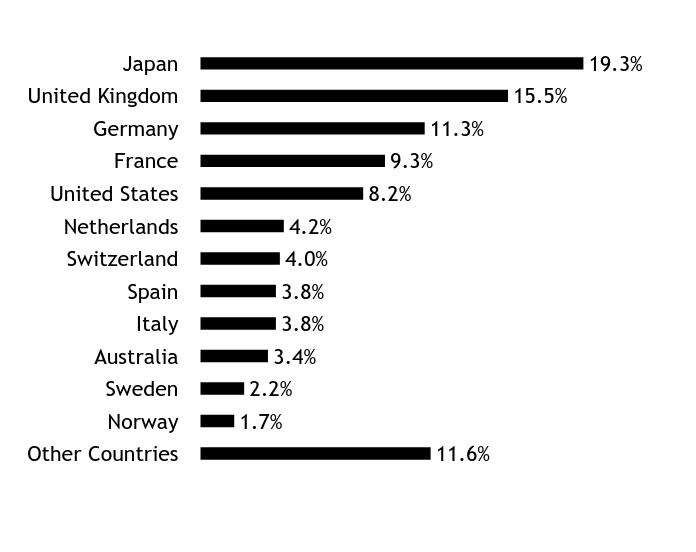
| Holdings [Text Block] |
Country WeightingsFootnote Reference*Value | Value |
|---|
Other Countries | 11.6% | Norway | 1.7% | Sweden | 2.2% | Australia | 3.4% | Italy | 3.8% | Spain | 3.8% | Switzerland | 4.0% | Netherlands | 4.2% | United States | 8.2% | France | 9.3% | Germany | 11.3% | United Kingdom | 15.5% | Japan | 19.3% |
| Footnote | Description | Footnote* | Percentages are calculated based on total net assets. |
|
| Largest Holdings [Text Block] |
Holding Name | | | Percentage of
Total Net Assets |
|---|
Roche Holding | | | 2.1% | SAP | | | 1.4% | Barclays | | | 1.3% | Novartis | | | 1.3% | Deutsche Boerse | | | 1.3% | GSK | | | 1.0% | ING Groep | | | 1.0% | NatWest Group | | | 1.0% | CaixaBank | | | 1.0% | Equinor | | | 1.0% |
|
| C000251376 |
|
| Shareholder Report [Line Items] |
|
| Fund Name |
SEI Select Small Cap ETF
|
| Class Name |
SEI Select Small Cap ETF
|
| Trading Symbol |
SEIS
|
| Security Exchange Name |
NASDAQ
|
| Annual or Semi-Annual Statement [Text Block] |
This annual shareholder report contains important information about the SEI Select Small Cap ETF (the "Fund") for the period from October 8, 2024 (commencement of operations) to March 31, 2025.
|
| Shareholder Report Annual or Semi-Annual |
Annual Shareholder Report
|
| Additional Information [Text Block] |
You can find additional information about the Fund at https://www.seic.com/mutual-fund-documentation/prospectuses-and-reports. You can also request this information by contacting us at 610-676-1000.
|
| Additional Information Phone Number |
610-676-1000
|
| Additional Information Website |
https://www.seic.com/mutual-fund-documentation/prospectuses-and-reports
|
| Expenses [Text Block] |
What were the Fund costs for the period?(based on a hypothetical $10,000 investment) Fund Name | Costs of a $10,000 investmentFootnote Reference* | Costs paid as a percentage of a $10,000 investment |
|---|
SEI Select Small Cap ETF | $26 | 0.55% |
|---|
| Footnote | Description | Footnote* | Costs shown not annualized. If the Fund had been open for the full fiscal year, costs shown would have been higher for the period ended. |
|
| Expenses Paid, Amount |
$ 26
|
| Expense Ratio, Percent |
0.55%
|
| AssetsNet |
$ 217,858,000
|
| Holdings Count | Holding |
358
|
| Advisory Fees Paid, Amount |
$ 535
|
| InvestmentCompanyPortfolioTurnover |
24.00%
|
| Additional Fund Statistics [Text Block] |
Key Fund Statistics as of March 31, 2025 | Total Net Assets (000's) | Number of Holdings | Total Advisory Fees Paid (000's) | Portfolio Turnover Rate |
|---|
| $217,858 | 358 | $535 | 24% |
|---|
|
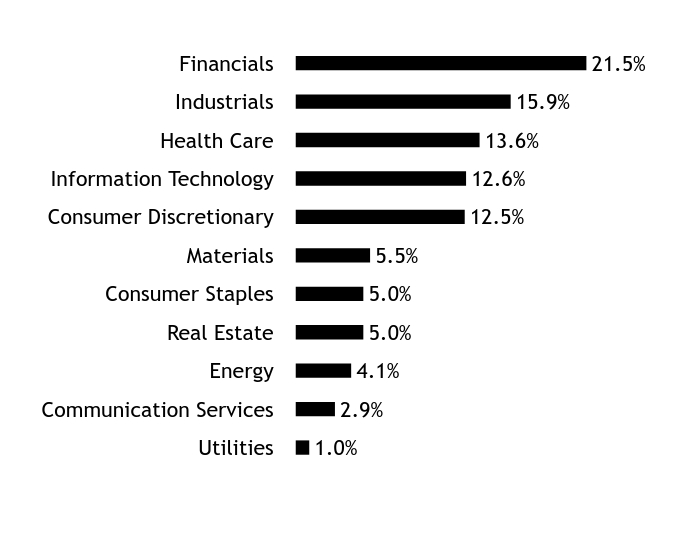
| Holdings [Text Block] |
Sector WeightingsFootnote Reference*Value | Value |
|---|
Utilities | 1.0% | Communication Services | 2.9% | Energy | 4.1% | Real Estate | 5.0% | Consumer Staples | 5.0% | Materials | 5.5% | Consumer Discretionary | 12.5% | Information Technology | 12.6% | Health Care | 13.6% | Industrials | 15.9% | Financials | 21.5% |
| Footnote | Description | Footnote* | Percentages are calculated based on total net assets. |
|
| Largest Holdings [Text Block] |
Holding Name | | | Percentage of
Total Net Assets |
|---|
Sprouts Farmers Market | | | 1.4% | CNO Financial Group | | | 1.4% | Urban Outfitters | | | 1.4% | Corcept Therapeutics | | | 1.3% | ExlService Holdings | | | 1.3% | Old National Bancorp | | | 1.1% | Commercial Metals | | | 1.0% | Jackson Financial, Cl A | | | 1.0% | Stride | | | 0.9% | Columbia Banking System | | | 0.9% |
|