Shareholder Report
Mar. 31, 2025
USD ($)
Holding
www.ubs.com/prfunds
or by contacting us at 787-250-3600.
What were the Portfolio costs for the last year? Annual Fund Operating Expenses (based on a hypothetical $10,000 investment) |
Class Name |
Cost of a $10,000 investment |
Cost paid as a percentage of a $10,000 investment |
|||||||||
| Class A | $670 | 1.76% | ||||||||||
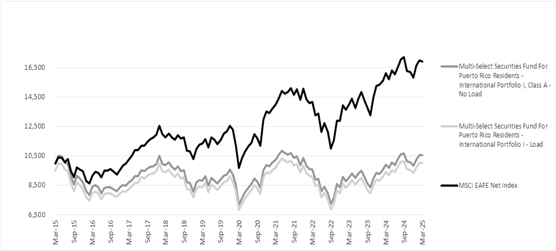
How did the Portfolio perform last year and what affected its performance?
The equity portion of the Portfolio returned 10.2% gross of fees for the year ended March 31, 2025. The return was almost exclusively a
by-product
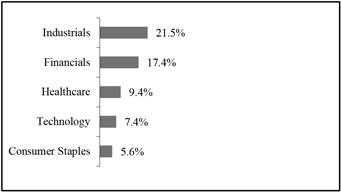
of positive stock selection. After a long period of underperformance versus the U.S. markets, international equities have outperformed thus far in 2025. The performance of the Healthcare sector was a notable highlight in the portfolio, offset by an overweight to the Energy sector and a challenging performance for the Consumer Staples sector. A boost to the performance of the portfolio was the increase in the price of gold.
Two of the best performing stocks in the portfolio were pharmaceuticals UCB SA, and Roche Holding AG. Another top performer, Agnico Eagle Mines, was boosted by the increase in the price of gold. The two top underperforming stocks were Diageo PLC, a spirit producer, and Barry Callebut, a chocolate producer.
The Puerto Rico securities portion of the Portfolio continued to be invested in cash and futures. This portion of the Portfolio generated interest from the cash investment and there was a positive return from the investment in futures contracts. The return of the Puerto Rico securities portion of the Portfolio underperformed the equity portion of the Portfolio.
Average Annual Total Returns as of March 31, 2025 | ||||||
1-Year |
5-Year |
10-Year | ||||
International Portfolio I, Class A - No Load |
6.61 % |
8.07% | 0.55% | |||
International Portfolio I, Class A - Load |
1.25% | 6.97% | 0.04% | |||
MSCI EAFE Net Index |
4.88% | 11.77% | 5.40% | |||
Key Portfolio Statistics |
||||
PORTFOLIO STATISTICS |
||||
Total Net Assets |
$2,537,131 | |||
# of Portfolio Holdings |
47 | |||
Portfolio Turnover Rate |
37.63% | |||
Total Advisory Fees Paid |
$24,952 | |||
Top 5 Sectors (% of Net Assets)
Portfolio Holdings Summaries
The equity portion of the Portfolio consists 100% of equity securities.
Top 5 Holdings (% of Net Assets) |
||||
ING Group N.V. |
3.16% | |||
Barclays PLC |
3.1% | |||
Sony Group Corp. |
3.1% | |||
KBC Group N.V. |
2.7% | |||
Roche Holding AG |
2.5% | |||
Top 5 Holdings (% of Net Assets) |
||||
ING Group N.V. |
3.16% | |||
Barclays PLC |
3.1% | |||
Sony Group Corp. |
3.1% | |||
KBC Group N.V. |
2.7% | |||
Roche Holding AG |
2.5% | |||
www.ubs.com/prfunds
or by contacting us at 787-250-3600.
What were the Portfolio costs for the last year? Annual Fund Operating Expenses (based on a hypothetical $10,000 investment) |
Class Name |
Cost of a $10,000 investment |
Cost paid as a percentage of a $10,000 investment |
|||||||||
| Class A | $669 | 1.75% | ||||||||||
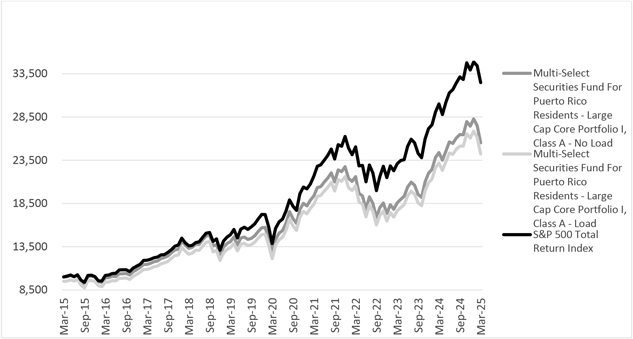
How did the Portfolio perform last year and what affected its performance?
The equity portion of the Portfolio returned 7.19% gross of fees for the year ended March 31, 2025. The underperformance was mostly the result of sector allocation although stock selection contributed.
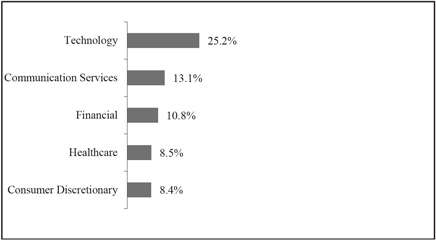
The top three sectors detracting from relative performance were Consumer Discretionary, Financials and an underweight to Utilities. The top three contributing sectors to relative performance were Real Communication Services, Health Care and Consumer Staples.
With respect to stock selection, the worst performing stocks were Salesforce, Inc., Micron Technology, Inc., Visa, Inc., United Rental and ConocoPhillips. The top relative performing stocks were
T-Mobile
US, Inc., Boston Scientific Co., Walmart, Inc. and RTX Corporation. The Puerto Rico securities portion of the Portfolio continued to be invested in cash and futures. This portion of the Portfolio generated interest from the cash investment and there was a positive return from the investment in futures contracts. The return of the Puerto Rico securities portion of the Portfolio underperformed the equity portion of the Portfolio.
Average Annual Total Returns as of March 31, 2025 | ||||||
1-Year |
5-Year |
10-Year | ||||
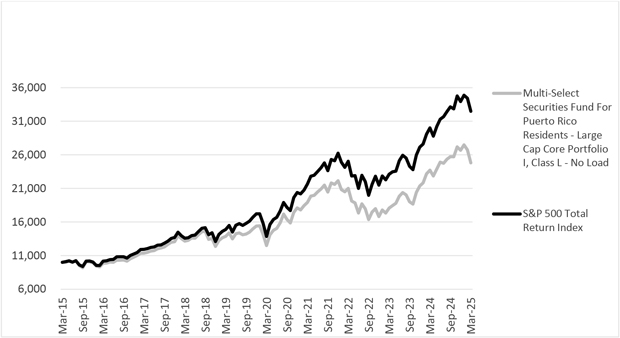
Large Cap Core Portfolio I, Class A - No Load |
4.64% | 14.89% | 9.82% | |||
Large Cap Core Portfolio I, Class A - Load |
-0.60% | 13.72% | 9.26% | |||
S&P 500 Total Return Index |
8.25% | 18.59% | 12.50% | |||
Key Portfolio Statistics |
||||
PORTFOLIO STATISTICS |
||||
Total Net Assets |
$ | 4,327,508 | ||
# of Portfolio Holdings |
46 | |||
Portfolio Turnover Rate |
50.27% | |||
Total Advisory Fees Paid |
$75,337 | |||
Top 5 Sectors (% of Net Assets)
Portfolio Holdings Summaries
The equity portion of the Portfolio consists 100% of equity securities.
Top 5 Holdings (% of Net Assets) |
||||
Apple, Inc. |
7.00% | |||
Microsoft Corp. |
5.7% | |||
NVIDIA Corp. |
5.1% | |||
Amazon.com, Inc. |
4.3% | |||
Alphabet, Inc. Class A |
3.8% | |||
Top 5 Holdings (% of Net Assets) |
||||
Apple, Inc. |
7.00% | |||
Microsoft Corp. |
5.7% | |||
NVIDIA Corp. |
5.1% | |||
Amazon.com, Inc. |
4.3% | |||
Alphabet, Inc. Class A |
3.8% | |||
www.ubs.com/prfunds
or by contacting us at 787-250-3600.
What were the Portfolio costs for the last year? Annual Fund Operating Expenses (based on a hypothetical $10,000 investment) |
Class Name |
Cost of a $10,000 investment |
Cost paid as a percentage of a $10,000 investment |
|||||||||
| Class L | $178 | 1.75% | ||||||||||
How did the Portfolio perform last year and what affected its performance?
The equity portion of the Portfolio returned 7.19% gross of fees for the year ended March 31, 2025. The underperformance was mostly the result of sector allocation although stock selection contributed.
The top three sectors detracting from relative performance were Consumer Discretionary, Financials and an underweight to Utilities. The top three contributing sectors to relative performance were Real Communication Services, Health Care and Consumer Staples.
With respect to stock selection, the worst performing stocks were Salesforce, Inc., Micron Technology, Inc., Visa, Inc., United Rental and ConocoPhillips. The top relative performing stocks were
T-Mobile
US, Inc., Boston Scientific Co., Walmart, Inc. and RTX Corporation. The Puerto Rico securities portion of the Portfolio continued to be invested in cash and futures. This portion of the Portfolio generated interest from the cash investment and there was a positive return from the investment in futures contracts. The return of the Puerto Rico securities portion of the Portfolio underperformed the equity portion of the Portfolio.
Average Annual Total Returns as of March 31, 2025 | ||||||
1-Year |
5-Year |
10-Year | ||||
Large Cap Core Portfolio I, Class L - No Load |
4.62% | 14.68% | 9.51% | |||
S&P 500 Total Return Index |
8.25% | 18.59% | 12.50% | |||
Key Portfolio Statistics |
||||
PORTFOLIO STATISTICS |
||||
Total Net Assets |
$ | 2,436,198 | ||
# of Portfolio Holdings |
46 | |||
Portfolio Turnover Rate |
50.27% | |||
Total Advisory Fees Paid |
$75,337 | |||
Top 5 Sectors (% of Net Assets)

Portfolio Holdings Summaries
The equity portion of the Portfolio consists 100% of equity securities
Top 5 Holdings (% of Net Assets) |
||||
Apple, Inc. |
7.00 | % | ||
Microsoft Corp. |
5.7 | % | ||
NVIDIA Corp. |
5.1 | % | ||
Amazon.com, Inc. |
4.3 | % | ||
Alphabet, Inc. Class A |
3.8 | % | ||
Top 5 Holdings (% of Net Assets) |
||||
Apple, Inc. |
7.00 | % | ||
Microsoft Corp. |
5.7 | % | ||
NVIDIA Corp. |
5.1 | % | ||
Amazon.com, Inc. |
4.3 | % | ||
Alphabet, Inc. Class A |
3.8 | % | ||
www.ubs.com/prfunds
or by contacting us at 787-250-3600.
What were the Portfolio costs for the last year? Annual Fund Operating Expenses (based on a hypothetical $10,000 investment) |
Class Name |
Cost of a $10,000 investment |
Cost paid as a percentage of a $10,000 investment |
|||||||||
| Class A | $670 | 1.76% | ||||||||||
How did the Portfolio perform last year and what affected its performance?
The equity portion of the Portfolio returned 6.08% gross of fees for the year ended March 31, 2025. Markets soared following the U.S. Presidential election results in the fourth quarter of 2024, yet volatility spiked as the calendar turned to 2025. There is a lot riding on Artificial Intelligence (“AI”) as the future growth and profitability engine of the U.S. stock market.
Overall, the portfolio generated strong returns, yet it trailed the benchmark. The spike in volatility due to concerns of slowing AI investment and a mix of economic concerns and policy developments weighed on investor sentiment. Additionally, investors were focused on pending tariff news. The largest contributing sectors to relative performance were Services, Healthcare and Financials. The largest detractors were Information Technology, Energy and Utilities sectors.
The Puerto Rico securities
portion
of the Portfolio continued to be invested in cash and futures. This portion of the Portfolio generated interest from the cash investment and there was a positive
return from the investment in futures contracts. The return of the Puerto Rico securities portion of the Portfolio underperformed the equity portion of the Portfolio. 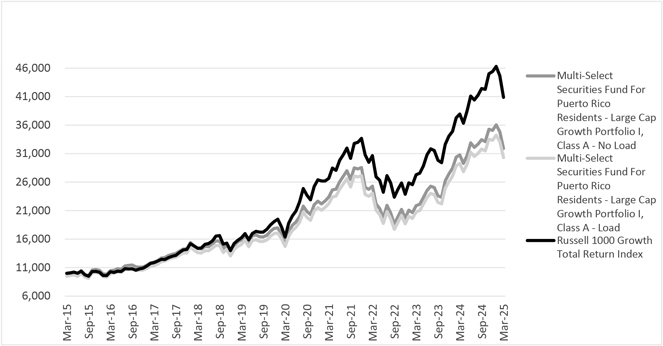
Average Annual Total Returns as of March 31, 2025 | ||||||
1-Year |
5-Year |
10-Year | ||||
Large Cap Growth Portfolio I, Class A - No Load |
3.69% | 15.56% | 12.30% | |||
Large Cap Growth Portfolio I, Class A - Load |
-1.50% | 14.38% | 11.73% | |||
Russell 1000 Growth Total Return Index |
7.72% | 20.08% | 15.12% | |||
Key Portfolio Statistics |
||||
PORTFOLIO STATISTICS |
||||
Total Net Assets |
$5,780,956 | |||
# of Portfolio Holdings |
45 | |||
Portfolio Turnover Rate |
72.43% | |||
Total Advisory Fees Paid |
$89,143 | |||
Top 5 Sectors (% of Net Assets)
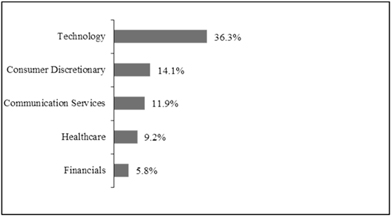
Portfolio Holdings Summaries
The equity portion of the Portfolio consists 100% of equity securities.
Top 5 Holdings (% of Net Assets) |
||||
Microsoft, Corp. |
7.98% | |||
Amazon.com, Inc. |
6.8% | |||
NVIDIA Corp. |
6.2% | |||
Apple, Inc. |
4.9% | |||
Meta Platforms, Inc. |
4.5% | |||
Top 5 Holdings (% of Net Assets) |
||||
Microsoft, Corp. |
7.98% | |||
Amazon.com, Inc. |
6.8% | |||
NVIDIA Corp. |
6.2% | |||
Apple, Inc. |
4.9% | |||
Meta Platforms, Inc. |
4.5% | |||
www.ubs.com/prfunds
or by contacting us at 787-250-3600.
What were the Portfolio costs for the last year? Annual Fund Operating Expenses (based on a hypothetical $10,000 investment) |
Class Name |
Cost of a $10,000 investment |
Cost paid as a percentage of a $10,000 investment |
|||||||||
| Class L | $179 | 1.76% | ||||||||||
How did the Portfolio perform last year and what affected its performance?
The equity portion of the Portfolio returned 6.08% gross of fees for the year ended March 31, 2025. Markets soared following the U.S. Presidential election results in the fourth quarter of 2024, yet volatility spiked as the calendar turned to 2025. There is a lot riding on Artificial Intelligence (“AI”) as the future growth and profitability engine of the U.S. stock market.
Overall, the portfolio generated strong returns, yet it trailed the benchmark. The spike in volatility due to concerns of slowing AI investment and a mix of economic concerns and policy developments weighed on investor sentiment. Additionally, investors were focused on pending tariff news. The largest contributing sectors to relative performance were Services, Healthcare and Financials. The largest detractors were Information Technology, Energy and Utilities sectors.
The Puerto Rico securities portion of the Portfolio continued to be invested in cash and futures. This portion of the Portfolio generated interest from the cash investment and there was a positive return from the
investment
in futures contracts. The return of the Puerto Rico securities portion of the Portfolio underperformed the equity portion of the Portfolio. 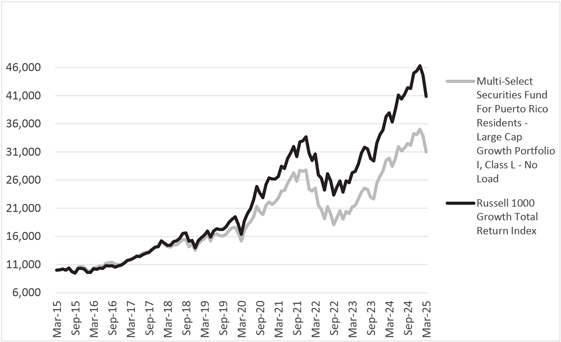
Average Annual Total Returns as of March 31, 2025 | ||||||
1-Year |
5-Year |
10-Year | ||||
Large Cap Growth Portfolio I, Class L - No Load |
3.68% | 15.36% | 11.98% | |||
Russell 1000 Growth Total Return Index |
7.72% | 20.08% | 15.12% | |||
Key Portfolio Statistics |
||||
PORTFOLIO STATISTICS |
||||
Total Net Assets |
$ | 2,535,627 | ||
# of Portfolio Holdings |
45 | |||
Portfolio Turnover Rate |
72.43% | |||
Total Advisory Fees Paid |
$89,143 | |||
Top 5 Sectors (% of Net Assets)

Portfolio Holdings Summaries
The equity portion of the
Portfolio
consists 100% of equity securities. Top 5 Holdings (% of Net Assets) |
||||
Microsoft, Corp. |
7.98% | |||
Amazon.com, Inc. |
6.8% | |||
NVIDIA Corp. |
6.2% | |||
Apple, Inc. |
4.9% | |||
Meta Platforms, Inc. |
4.5% | |||
Top 5 Holdings (% of Net Assets) |
||||
Microsoft, Corp. |
7.98% | |||
Amazon.com, Inc. |
6.8% | |||
NVIDIA Corp. |
6.2% | |||
Apple, Inc. |
4.9% | |||
Meta Platforms, Inc. |
4.5% | |||
www.ubs.com/prfunds
or by contacting us at 787-250-3600.
What were the Portfolio costs for the last year? Annual Fund Operating Expenses |
Class Name |
Cost of a $10,000 investment |
Cost paid as a percentage of a $10,000 investment | |||||
| Class A | $ 670 |
1.76 % | ||||||
(based on a hypothetical $10,000 investment) |
How did the Portfolio perform last year and what affected its performance?
The equity portion of the Portfolio returned 10.9% gross of fees for the year ended March 31, 2025. While growth, volatility and momentum were a factor for much of 2024, the shift of quality and yield factors in the third quarter of 2024 and the first quarter of 2025 contributed to relative performance.
Overall sector allocation detracted from relative performance. An underweight in Health Care and overweight in Consumer Staples contributed to relative performance was offset by the negative impact of an overweight in Technology and an underweight in Utilities. Stock selection was a tailwind to relative performance. The best performing stocks based on relative performance versus the benchmark were Philip Morris International, Inc., The Progressive Corporation, and despite volatility, Apple, Inc. The worst performing positions based on relative performance were Merck, Diageo PLC, and Microsoft Corp.
The Puerto Rico securities portion of the Portfolio continued to be invested in cash and futures. This portion of the Portfolio generated interest from the cash investment and there was a positive return from the investment in
futures
contracts. The return of the Puerto Rico securities portion of the Portfolio underperformed the equity portion of the Portfolio. 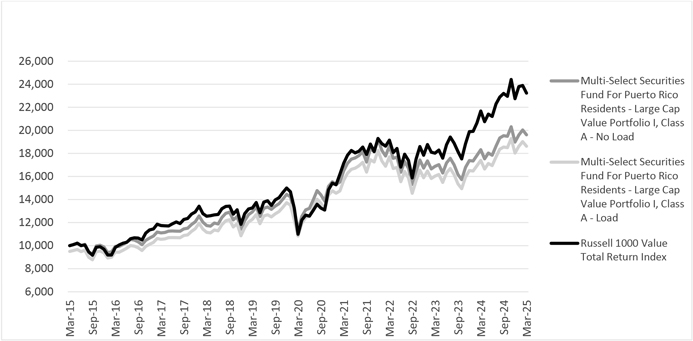
Average Annual Total Returns as of March 31, 2025 | ||||||
1-Year |
5-Year |
10-Year | ||||
| Large Cap Value Portfolio I, Class A - No Load | 7.07% | 11.44% | 6.97% | |||
| Large Cap Value Portfolio I, Class A - Load | 1.70% | 10.31% | 6.42% | |||
| Russell 1000 Value Total Return Index | 7.18% | 16.15% | 8.79% | |||
Key Portfolio Statistics |
||||
PORTFOLIO STATISTICS |
||||
Total Net Assets |
$ | 4,374,436 | ||
# of Portfolio Holdings |
30 | |||
Portfolio Turnover Rate |
8.26% | |||
Total Advisory Fees Paid |
$ | 62,904 | ||
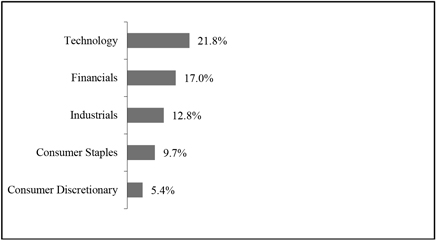
Top 5 Sectors (% of Net )
Assets
Portfolio
Holdings
Summaries
The equity portion of the Portfolio consists 100% of equity securities.
Top 5 Holdings (% of Net Assets) |
||||
Phillip Morris International, Inc. |
4.66% | |||
Berkshire Hathaway, Inc. |
4.5% | |||
Apple, Inc. |
4.2% | |||
The Progressive Corporation |
4.0% | |||
Air Products and Chemicals, Inc. |
3.8% | |||
Top 5 Holdings (% of Net Assets) |
||||
Phillip Morris International, Inc. |
4.66% | |||
Berkshire Hathaway, Inc. |
4.5% | |||
Apple, Inc. |
4.2% | |||
The Progressive Corporation |
4.0% | |||
Air Products and Chemicals, Inc. |
3.8% | |||
www.ubs.com/prfunds
or by contacting us at 787-250-3600.
What were the Portfolio costs for the last year? |
Class Name |
Cost of a $10,000 investment |
Cost paid as a percentage of a $10,000 investment |
|||||||||
| Class L | $179 | 1.76% | ||||||||||
Annual Fund Operating Expenses |
||||||||||||
(based on a hypothetical $10,000 investment) |
||||||||||||
How did the Fund perform last year and what affected its performance?
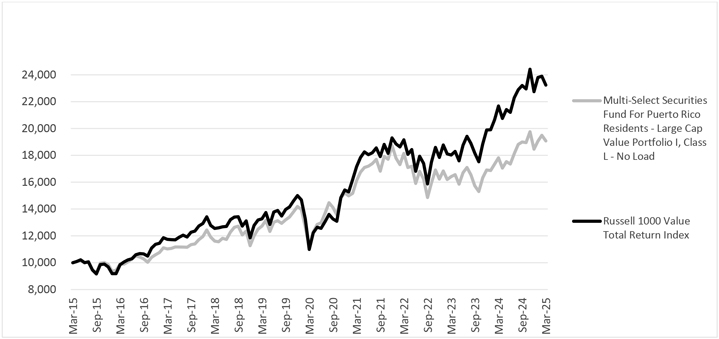
The equity portion of the Portfolio returned 10.9% gross of fees for the year ended March 31, 2025. While growth, volatility and momentum were a factor for much of 2024, the shift of quality and yield factors in the third quarter of 2024 and the first quarter of 2025 contributed to relative performance.
Overall sector allocation detracted from relative performance. An underweight in Health Care and overweight in Consumer Staples contributed to relative performance was offset by the negative impact of an overweight in Technology and an underweight in Utilities. Stock selection was a tailwind to relative performance. The best performing stocks based on relative performance versus the benchmark were Philip Morris International, Inc., The Progressive Corporation, and despite volatility, Apple, Inc. The worst performing positions based on relative performance were Merck, Diageo PLC, and Microsoft Corp.
The Puerto Rico securities portion of the Portfolio continued to be invested in cash and futures. This portion of the Portfolio generated interest from the cash investment and there was a positive return from the investment in futures contracts. The return of the Puerto Rico securities portion of the Portfolio underperformed the equity portion of the Portfolio.
Average Annual Total Returns | |||||||||||||||||||||||||
as of March 31, 2025 | |||||||||||||||||||||||||
1-Year |
5-Year |
10-Year | |||||||||||||||||||||||
Large Cap Value Portfolio I, Class L - No Load |
7.07% | 11.25% | 6.67% | ||||||||||||||||||||||
Russell 1000 Value Total Return Index |
7.18% | 16.15% | 8.79% | ||||||||||||||||||||||
Key Portfolio Statistics |
||||
PORTFOLIO STATISTICS |
||||
Total Net Assets |
$1,880,672 | |||
# of Portfolio Holdings |
30 | |||
Portfolio Turnover Rate |
8.26% | |||
Total Advisory Fees Paid |
$62,904 | |||
Top 5 Sectors (% of )
Net
Assets

Portfolio
Holdings
Summaries
The equity portion of the Portfolio consists 100% of equity securities.
Top 5 Holdings (% of Net Assets) |
||||
Phillip Morris International, Inc. |
4.66 | % | ||
Berkshire Hathaway, Inc. |
4.5 | % | ||
Apple, Inc. |
4.2 | % | ||
The Progressive Corporation |
4.0 | % | ||
Air Products and Chemicals, Inc. |
3.8 | % | ||
Top 5 Holdings (% of Net Assets) |
||||
Phillip Morris International, Inc. |
4.66 | % | ||
Berkshire Hathaway, Inc. |
4.5 | % | ||
Apple, Inc. |
4.2 | % | ||
The Progressive Corporation |
4.0 | % | ||
Air Products and Chemicals, Inc. |
3.8 | % | ||
www.ubs.com/prfunds
or by contacting us at 787-250-3600.
What were the Portfolio costs for the last year? |
Class Name |
Cost of a $10,000 investment |
Cost paid as a percentage of a $10,000 investment |
|||||||||
| Class A | $669 | 1.75% | ||||||||||
Annual Fund Operating Expenses |
||||||||||||
(based on a hypothetical $10,000 investment) |
||||||||||||
How did the Portfolio perform last year and what affected its performance?
The equity portion of the Portfolio returned negative 5.9% gross of fees for the year ended March 31, 2025. Returns were weaker down the market cap spectrum and less exposure than the benchmark to growth and momentum factors was a headwind. The underperforming stocks remain in the portfolio reflecting our long-term conviction in the businesses.
Sector allocation detracted from relative performance. An overweight in Consumer Discretionary and an underweight in Health Care contributed to relative performance, offset by the negative impact of an overweight in Materials and underweight in Utilities.
Overall, stock selection detracted from relative performance. The worst performing stocks were Entegris, Inc. (semi-conductors), Bruker Corporation (life sciences) and Lamb Weston Holdings, Inc. (industrial). The best performing stocks based on relative performance were CBRE Group, Inc. (real estate services), M&T Bank Corp. (financial services) and AerCap Holdings N.V. (industrial).
The Puerto Rico securities portion of the Portfolio continued to be invested in cash and futures. This portion of the Portfolio
generated
interest from the cash investment and there was a positive return from the investment in futures contracts. The return of the Puerto Rico securities portion of the Portfolio underperformed the equity portion of the Portfolio. 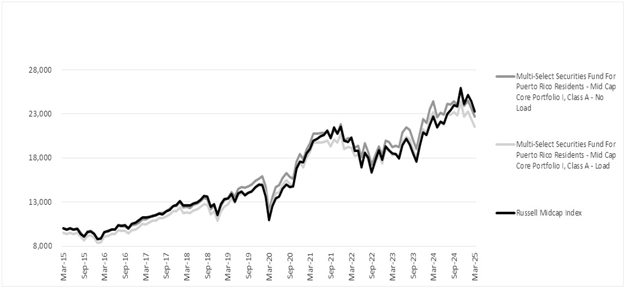
Average Annual Total Returns as of March 31, 2025 | ||||||
1-Year |
5-Year |
10-Year | ||||
Mid Cap Core Portfolio I, Class A - No Load |
-6.98% | 13.80% | 8.54% | |||
Mid Cap Core Portfolio I, Class A - Load |
-11.62% | 12.65% | 7.99% | |||
Russell Midcap Index |
2.59% | 16.28% | 8.82% | |||
Key Portfolio Statistics |
||||
PORTFOLIO STATISTICS |
||||
Total Net Assets |
$ | 2,842,395 | ||
# of Portfolio Holdings |
33 | |||
Portfolio Turnover Rate |
10.39% | |||
Total Advisory Fees Paid |
$ | 48,132 | ||
Top 5 Sectors (% of Net Assets)

Portfolio Holdings Summaries
The equity portion of the Portfolio consists 100% of equity securities.
Top 5 Holdings (% of Net Assets) |
||||
Armstrong World Industries, Inc. |
3.84% | |||
AerCap Holdings N.V. |
3.7% | |||
Allison Transmission Holdings, Inc. |
3.3% | |||
Entegris, Inc. |
3.3% | |||
Fidelity National Information Services, Inc. |
3.0% | |||
Top 5 Holdings (% of Net Assets) |
||||
Armstrong World Industries, Inc. |
3.84% | |||
AerCap Holdings N.V. |
3.7% | |||
Allison Transmission Holdings, Inc. |
3.3% | |||
Entegris, Inc. |
3.3% | |||
Fidelity National Information Services, Inc. |
3.0% | |||
www.ubs.com/prfunds
or by contacting us at 787-250-3600.
What were the Portfolio costs for the last year? |
Class Name |
Cost of a $10,000 investment |
Cost paid as a percentage of a $10,000 investment |
|||||||||
| Class L | $178 | 1.75% | ||||||||||
Annual Fund Operating Expenses |
||||||||||||
(based on a hypothetical $10,000 investment) |
||||||||||||
How did the Fund perform last year and what affected its performance?
T The equity portion of the Portfolio returned negative 5.9% gross of fees for the year ended March 31, 2025. Returns were weaker down the market cap spectrum and less exposure than the benchmark to growth and momentum factors was a headwind. The underperforming stocks remain in the portfolio reflecting our long-term conviction in the businesses.
Sector allocation detracted from relative performance. An overweight in Consumer Discretionary and an underweight in Health Care contributed to relative performance, offset by the negative impact of an overweight in Materials and underweight in Utilities.
Overall, stock selection detracted from relative performance. The worst performing stocks were Entegris, Inc. (semi-conductors), Bruker Corporation (life sciences) and Lamb Weston Holdings, Inc. (industrial). The best performing stocks based on relative performance were CBRE Group, Inc. (real estate services), M&T Bank Corp. (financial services) and AerCap Holdings N.V. (industrial).
The Puerto Rico sec
ur
ities portion of the Portfolio continued to be invested in cash and futures. This portion of the Portfolio generated interest from the cash investment and there was a positive return from the investment in futures contracts. The return of the Puerto Rico securities portion of the Portfolio underperformed the equity portion of the Portfolio. 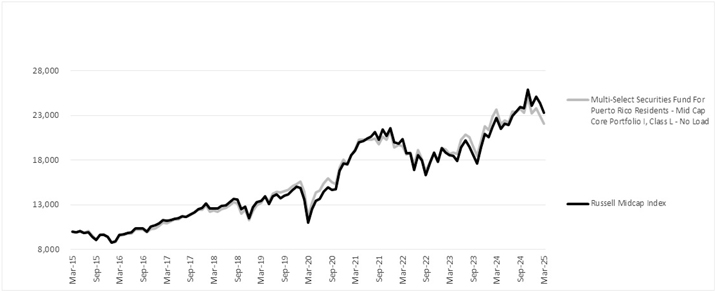
Average Annual Total Returns as of March 31, 2025 | ||||||
1-Year |
5-Year |
10-Year | ||||
Mid Cap Core Portfolio I, Class L - No Load |
-6.96% | 13.60% | 8.23% | |||
Russell Midcap Index |
2.59% | 16.28% | 8.82% | |||
Key Portfolio Statistics |
||||
PORTFOLIO STATISTICS |
||||
Total Net Assets |
$ | 1,606,374 | ||
# of Portfolio Holdings |
33 | |||
Portfolio Turnover Rate |
10.39% | |||
Total Advisory Fees Paid |
$ | 48,132 | ||
Top 5 Sectors (% of
Net
Assets)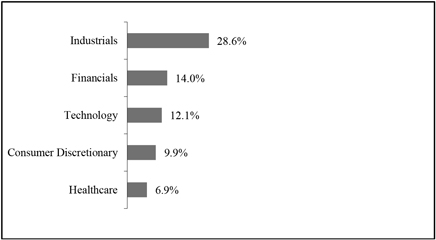
Portfolio Holdings Summaries
The equity portion of the Portfolio
consists
100% of equity securities. Top 5 Holdings (% of N et Assets) |
||||
Armstrong World Industries, Inc. |
3.84% |
|||
AerCap Holdings N.V. |
3.7% | |||
Allison Transmission Holdings, Inc. |
3.3% | |||
Entegris, Inc. |
3.3% | |||
Fidelity National Information Services, Inc. |
3.0% | |||
Top 5 Holdings (% of N et Assets) |
||||
Armstrong World Industries, Inc. |
3.84% |
|||
AerCap Holdings N.V. |
3.7% | |||
Allison Transmission Holdings, Inc. |
3.3% | |||
Entegris, Inc. |
3.3% | |||
Fidelity National Information Services, Inc. |
3.0% | |||
www.ubs.com/prfunds
or by contacting us at 787-250-3600.
What were the Portfolio costs for the last year? |
Class Name |
Cost of a $10,000 investment |
Cost paid as a percentage of a $10,000 investment |
|||||||||
| Class A | $670 | 1.76% | ||||||||||
Annual Fund Operating Expenses |
||||||||||||
(based on a hypothetical $10,000 investment) |
||||||||||||
How did the Portfolio perform last year and what affected its performance?
The equity portion of the Portfolio returned 0.8% gross of fees for the year ended March 31, 2025. The excess return was a function of both positive security selection as well as favorable sector allocations.
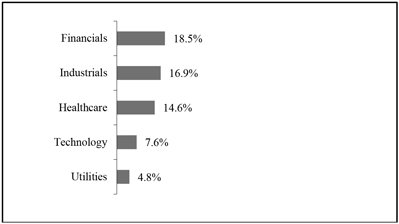
The two sectors providing the best performance were Consumer Discretionary and Healthcare. The top two detractors from performance were Real Estate and Technology.
Two of the best performing stocks in the portfolio were pharmaceutical companies, Exelixis, Inc. and Globus Medical, Inc. Sportradar Group AG, a sports technology company, and Frontdoor, Inc, the owner of the American Home Shield homeowner’s protection brand, also outperformed. Detractors from performance included Innovative Industrial Properties (Real Estate) and technology companies Diodes (semiconductors) and ASGN Incorporated (technology consulting).
The Puerto Rico s
ecur
ities portion of the Portfolio continued to be invested in cash and futures. This portion of the Portfolio generated interest from the cash investment and there was a positive return from the investment in futures contracts. The return of the Puerto Rico securities portion of the Portfolio underperformed the equity portion of the Portfolio. 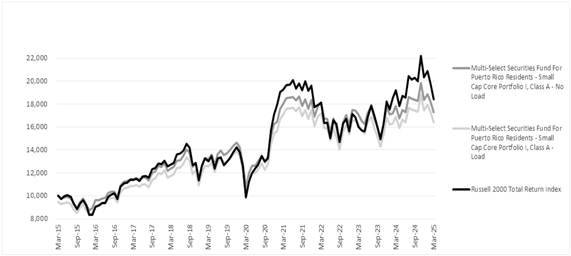
Average Annual Total Returns | |||||||||||||||||||||||||
as of March 31, 2025 | |||||||||||||||||||||||||
1-Year |
5-Year |
10-Year | |||||||||||||||||||||||
Small Cap Core Portfolio I, Class A - No Load |
-3.00% | 10.02% | 5.62% | ||||||||||||||||||||||
Small Cap Core Portfolio I, Class A - Load |
-7.84% | 8.90% | 5.08% | ||||||||||||||||||||||
Russell 200 Index TR |
-4.01% | 13.27% | 6.30% | ||||||||||||||||||||||
Key Portfolio Statistics |
||||
PORTFOLIO STATISTICS |
||||
Total Net Assets |
$4,448,769 | |||
# of Portfolio Holdings |
41 | |||
Portfolio Turnover Rate |
6.33% | |||
Total Advisory Fees Paid |
$28,330 | |||
Top 5 Sectors (% of Net Assets)
Portfolio Holdings Summaries
The equity portion of the Portfolio consists 100% of equity securities.
Top 5 Hold in gs (% of Net As sets) |
||||
AXIS Capital Holdings Ltd. |
3.65 | % | ||
Sportradar Group AG |
3.2 | % | ||
Globus Medical, Inc. |
2.7 | % | ||
TXNM Energy, Inc. |
2.5 | % | ||
Monarch Casino & Resort, Inc. |
2.4 | % | ||
Top 5 Hold in gs (% of Net As sets) |
||||
AXIS Capital Holdings Ltd. |
3.65 | % | ||
Sportradar Group AG |
3.2 | % | ||
Globus Medical, Inc. |
2.7 | % | ||
TXNM Energy, Inc. |
2.5 | % | ||
Monarch Casino & Resort, Inc. |
2.4 | % | ||