Shareholder Report
|
6 Months Ended |
|
Mar. 31, 2025
USD ($)
Holdings
|
|---|
| Shareholder Report [Line Items] |
|
| Document Type |
N-CSRS
|
| Amendment Flag |
false
|
| Registrant Name |
Artisan
Partners Funds, Inc.
|
| Entity Central Index Key |
0000935015
|
| Entity Investment Company Type |
N-1A
|
| Document Period End Date |
Mar. 31, 2025
|
| Artisan Developing World Fund - Advisor Shares |
|
| Shareholder Report [Line Items] |
|
| Fund Name |
Artisan
Developing World Fund
|
| Class Name |
Advisor
Shares
|
| Trading Symbol |
APDYX
|
| Annual or Semi-Annual Statement [Text Block] |
This
semi-annual shareholder report contains important information about Artisan Developing World Fund for the period of October 1,
2024 to March 31, 2025.
|
| Shareholder Report Annual or Semi-Annual |
Semi-Annual
Shareholder Report
|
| Additional Information [Text Block] |
This
semi-annual shareholder report contains important information about Artisan Developing World Fund for the period of October 1,
2024 to March 31, 2025. You can find additional information about the Fund at www.artisanpartners.com/prospectus. You can also
request this information by contacting us at 800.344.1770.
|
| Additional Information Phone Number |
800.344.1770
|
| Additional Information Website |
www.artisanpartners.com/prospectus
|
| Expenses [Text Block] |
What
were the Fund costs for the last six months?
(based
on a hypothetical $10,000 investment)
| Class
Name |
Costs
of a $10,000 investment |
Costs
paid as a percentage of a $10,000 investment |
| Advisor |
$57 |
1.13% |
| |
|
|
|
| Expenses Paid, Amount |
$ 57
|
| Expense Ratio, Percent |
1.13%
|
| Net Assets |
$ 3,615,730,000
|
| Holdings Count | Holdings |
35
|
| Advisory Fees Paid, Amount |
$ 18,770,000
|
| Investment Company, Portfolio Turnover |
36.45%
|
| Additional Fund Statistics [Text Block] |
| Key
Fund Statistics |
| Dollar
values in thousands |
| Net
Assets |
$3,615,730 |
| Number
of Portfolio Holdings |
35 |
| Total
Investment Advisory Fees (net of waivers and reimbursements) |
$18,770 |
| Portfolio
Turnover Rate |
36.45% |
|
| Holdings [Text Block] |
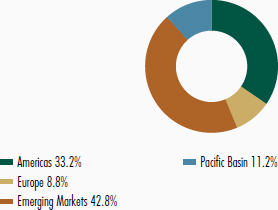
REGION
ALLOCATION
(As
a Percentage of Total Net Assets)
| Region |
|
| Americas |
33.2% |
| Europe |
8.8% |
| Emerging Markets |
42.8% |
| Pacific Basin |
11.2% |

| TRADING
CURRENCIES | |
| | |
| | |
| | |
| Currency | |
| Percentage of
Total Investments |
| Australian
dollar | |
| 1.6 | % |
| Chinese
yuan renminbi offshore | |
| 3.4 | |
| Euro | |
| 7.7 | |
| Hong
Kong dollar | |
| 8.8 | |
| Indian
rupee | |
| 6.7 | |
| U.S.
dollar | |
| 71.8 | |
| Total
investments | |
| 100.0 | % |
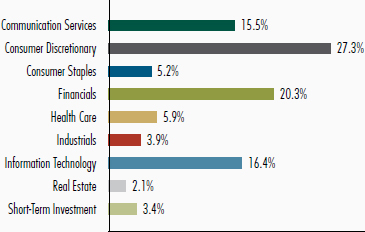
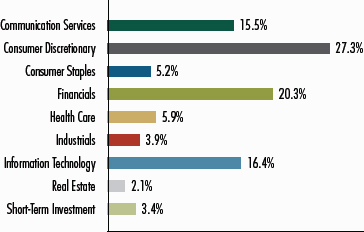
PORTFOLIO
DIVERSIFICATION
(As
a Percentage of Total Investments)
| Sector |
|
| Communication Services |
15.5% |
| Consumer Discretionary |
27.3% |
| Consumer Staples |
5.2% |
| Financials |
20.3% |
| Health Care |
5.9% |
| Industrials |
3.9% |
| Information Technology |
16.4% |
| Real Estate |
2.1% |
| Short-Term Investment |
3.4% |
|
| Largest Holdings [Text Block] |
| TOP
TEN HOLDINGS* | |
|
| |
| | |
|
| |
| Company
Name | |
Country |
Percentage of
Total Net Assets |
| Sea
Ltd. | |
Singapore |
5.7 | % |
| MercadoLibre,
Inc. | |
Brazil |
5.3 | |
| Visa,
Inc. | |
United
States |
4.7 | |
| Meituan | |
China |
4.5 | |
| MakeMyTrip
Ltd. | |
India |
4.4 | |
| Adyen
NV | |
Netherlands |
4.4 | |
| Tencent
Holdings Ltd. | |
China |
4.3 | |
| NU
Holdings Ltd. | |
Brazil |
4.0 | |
| Crowdstrike
Holdings, Inc. | |
United
States |
3.9 | |
| Grab
Holdings Ltd. | |
Singapore |
3.8 | |
| Total | |
|
45.0 | % |
| * | Excludes
short-term investments. |
|
| Artisan Developing World Fund - Institutional Shares |
|
| Shareholder Report [Line Items] |
|
| Fund Name |
Artisan
Developing World Fund
|
| Class Name |
Institutional Shares
|
| Trading Symbol |
APHYX
|
| Annual or Semi-Annual Statement [Text Block] |
This semi-annual shareholder report contains important information about Artisan Developing World Fund for the period of October
1, 2024 to March 31, 2025.
|
| Shareholder Report Annual or Semi-Annual |
Semi-Annual Shareholder Report
|
| Additional Information [Text Block] |
This semi-annual shareholder report contains important information about Artisan Developing World Fund for the period of October
1, 2024 to March 31, 2025. You can find additional information about the Fund at www.artisanpartners.com/prospectus. You can
also request this information by contacting us at 800.344.1770.
|
| Additional Information Phone Number |
800.344.1770
|
| Additional Information Website |
www.artisanpartners.com/prospectus
|
| Expenses [Text Block] |
What
were the Fund costs for the last six months?
(based
on a hypothetical $10,000 investment)
| Class
Name |
Costs
of a $10,000 investment |
Costs
paid as a percentage of a $10,000 investment |
| Institutional |
$53 |
1.04% |
| |
|
|
|
| Expenses Paid, Amount |
$ 53
|
| Expense Ratio, Percent |
1.04%
|
| Net Assets |
$ 3,615,730,000
|
| Holdings Count | Holdings |
35
|
| Advisory Fees Paid, Amount |
$ 18,770,000
|
| Investment Company, Portfolio Turnover |
36.45%
|
| Additional Fund Statistics [Text Block] |
| Key
Fund Statistics |
| Dollar
values in thousands |
| Net
Assets |
$3,615,730 |
| Number
of Portfolio Holdings |
35 |
| Total
Investment Advisory Fees (net of waivers and reimbursements) |
$18,770 |
| Portfolio
Turnover Rate |
36.45% |
|
| Holdings [Text Block] |
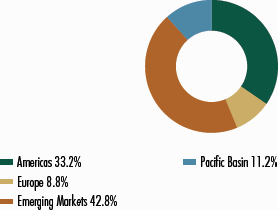
REGION
ALLOCATION
(As
a Percentage of Total Net Assets)
| Region |
|
| Americas |
33.2% |
| Europe |
8.8% |
| Emerging Markets |
42.8% |
| Pacific Basin |
11.2% |
| TRADING
CURRENCIES | |
| | |
| | |
| | |
| Currency | |
| Percentage of
Total Investments |
| Australian
dollar | |
| 1.6 | % |
| Chinese
yuan renminbi offshore | |
| 3.4 | |
| Euro | |
| 7.7 | |
| Hong
Kong dollar | |
| 8.8 | |
| Indian
rupee | |
| 6.7 | |
| U.S.
dollar | |
| 71.8 | |
| Total
investments | |
| 100.0 | % |
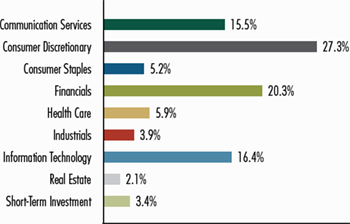
PORTFOLIO
DIVERSIFICATION
(As
a Percentage of Total Investments)
| Sector |
|
| Communication Services |
15.5% |
| Consumer Discretionary |
27.3% |
| Consumer Staples |
5.2% |
| Financials |
20.3% |
| Health Care |
5.9% |
| Industrials |
3.9% |
| Information Technology |
16.4% |
| Real Estate |
2.1% |
| Short-Term Investment |
3.4% |
|
| Largest Holdings [Text Block] |
| TOP
TEN HOLDINGS* | |
|
| |
| | |
|
| |
| Company
Name | |
Country |
Percentage of
Total Net Assets |
| Sea
Ltd. | |
Singapore |
5.7 | % |
| MercadoLibre,
Inc. | |
Brazil |
5.3 | |
| Visa,
Inc. | |
United
States |
4.7 | |
| Meituan | |
China |
4.5 | |
| MakeMyTrip
Ltd. | |
India |
4.4 | |
| Adyen
NV | |
Netherlands |
4.4 | |
| Tencent
Holdings Ltd. | |
China |
4.3 | |
| NU
Holdings Ltd. | |
Brazil |
4.0 | |
| Crowdstrike
Holdings, Inc. | |
United
States |
3.9 | |
| Grab
Holdings Ltd. | |
Singapore |
3.8 | |
| Total | |
|
45.0 | % |
| * | Excludes
short-term investments. |
|
| Artisan Developing World Fund - Investor Shares |
|
| Shareholder Report [Line Items] |
|
| Fund Name |
Artisan
Developing World Fund
|
| Class Name |
Investor Shares
|
| Trading Symbol |
ARTYX
|
| Annual or Semi-Annual Statement [Text Block] |
This semi-annual shareholder report contains important information about Artisan Developing World Fund for the period of October
1, 2024 to March 31, 2025.
|
| Shareholder Report Annual or Semi-Annual |
Semi-Annual Shareholder Report
|
| Additional Information [Text Block] |
This semi-annual shareholder report contains important information about Artisan Developing World Fund for the period of October
1, 2024 to March 31, 2025. You can find additional information about the Fund at www.artisanpartners.com/prospectus. You can
also request this information by contacting us at 800.344.1770.
|
| Additional Information Phone Number |
800.344.1770
|
| Additional Information Website |
www.artisanpartners.com/prospectus
|
| Expenses [Text Block] |
What
were the Fund costs for the last six months?
(based
on a hypothetical $10,000 investment)
| Class
Name |
Costs
of a $10,000 investment |
Costs
paid as a percentage of a $10,000 investment |
| Investor |
$66 |
1.30% |
| |
|
|
|
| Expenses Paid, Amount |
$ 66
|
| Expense Ratio, Percent |
1.30%
|
| Net Assets |
$ 3,615,730,000
|
| Holdings Count | Holdings |
35
|
| Advisory Fees Paid, Amount |
$ 18,770,000
|
| Investment Company, Portfolio Turnover |
36.45%
|
| Additional Fund Statistics [Text Block] |
| Key
Fund Statistics |
| Dollar
values in thousands |
| Net
Assets |
$3,615,730 |
| Number
of Portfolio Holdings |
35 |
| Total
Investment Advisory Fees (net of waivers and reimbursements) |
$18,770 |
| Portfolio
Turnover Rate |
36.45% |
|
| Holdings [Text Block] |
REGION
ALLOCATION
(As
a Percentage of Total Net Assets)
| Region |
|
| Americas |
33.2% |
| Europe |
8.8% |
| Emerging Markets |
42.8% |
| Pacific Basin |
11.2% |
| TRADING
CURRENCIES | |
| | |
| | |
| | |
| Currency | |
| Percentage of
Total Investments |
| Australian
dollar | |
| 1.6 | % |
| Chinese
yuan renminbi offshore | |
| 3.4 | |
| Euro | |
| 7.7 | |
| Hong
Kong dollar | |
| 8.8 | |
| Indian
rupee | |
| 6.7 | |
| U.S.
dollar | |
| 71.8 | |
| Total
investments | |
| 100.0 | % |
PORTFOLIO
DIVERSIFICATION
(As
a Percentage of Total Investments)
| Sector |
|
| Communication Services |
15.5% |
| Consumer Discretionary |
27.3% |
| Consumer Staples |
5.2% |
| Financials |
20.3% |
| Health Care |
5.9% |
| Industrials |
3.9% |
| Information Technology |
16.4% |
| Real Estate |
2.1% |
| Short-Term Investment |
3.4% |
|
| Largest Holdings [Text Block] |
| TOP
TEN HOLDINGS* | |
|
| |
| | |
|
| |
| Company
Name | |
Country |
Percentage of
Total Net Assets |
| Sea
Ltd. | |
Singapore |
5.7 | % |
| MercadoLibre,
Inc. | |
Brazil |
5.3 | |
| Visa,
Inc. | |
United
States |
4.7 | |
| Meituan | |
China |
4.5 | |
| MakeMyTrip
Ltd. | |
India |
4.4 | |
| Adyen
NV | |
Netherlands |
4.4 | |
| Tencent
Holdings Ltd. | |
China |
4.3 | |
| NU
Holdings Ltd. | |
Brazil |
4.0 | |
| Crowdstrike
Holdings, Inc. | |
United
States |
3.9 | |
| Grab
Holdings Ltd. | |
Singapore |
3.8 | |
| Total | |
|
45.0 | % |
| * | Excludes
short-term investments. |
|
| Artisan Emerging Markets Debt Opportunities Fund - Advisor Shares |
|
| Shareholder Report [Line Items] |
|
| Fund Name |
Artisan
Emerging Markets Debt Opportunities Fund
|
| Class Name |
Advisor Shares
|
| Trading Symbol |
APDOX
|
| Annual or Semi-Annual Statement [Text Block] |
This
semi-annual shareholder report contains important information about Artisan Emerging
Markets Debt Opportunities Fund for the period of October 1, 2024 to March 31, 2025.
|
| Shareholder Report Annual or Semi-Annual |
Semi-Annual Shareholder Report
|
| Additional Information [Text Block] |
This
semi-annual shareholder report contains important information about Artisan Emerging
Markets Debt Opportunities Fund for the period of October 1, 2024 to March 31, 2025.
You can find additional information about the Fund at www.artisanpartners.com/prospectus.
You can also request this information by contacting us at 800.344.1770. This report
describes changes to the Fund that occurred during the reporting period.
|
| Material Fund Change Notice [Text Block] |
This report
describes changes to the Fund that occurred during the reporting period.
|
| Additional Information Phone Number |
800.344.1770
|
| Additional Information Website |
www.artisanpartners.com/prospectus
|
| Expenses [Text Block] |
What
were the Fund costs for the last six months?
(based
on a hypothetical $10,000 investment)
| Class
Name |
Costs
of a $10,000 investment |
Costs
paid as a percentage of a $10,000 investment |
| Advisor |
$59 |
1.16% |
| |
|
|
|
| Expenses Paid, Amount |
$ 59
|
| Expense Ratio, Percent |
1.16%
|
| Net Assets |
$ 94,057,000
|
| Holdings Count | Holdings |
221
|
| Advisory Fees Paid, Amount |
$ 164,000
|
| Investment Company, Portfolio Turnover |
37.53%
|
| Additional Fund Statistics [Text Block] |
| Key
Fund Statistics |
| Dollar
values in thousands |
| Net
Assets |
$94,057 |
| Number
of Portfolio Holdings |
221 |
| Total
Investment Advisory Fees (net of waivers and reimbursements) |
$164 |
| Portfolio
Turnover Rate |
37.53% |
|
| Holdings [Text Block] |
PORTFOLIO
COMPOSITION
(As
a Percentage of Total Net Assets)
| PORTFOLIO COMPOSITION |
|
| Type |
|
| Sovereign Government Bonds |
49.4% |
| Corporate Bonds |
17.6% |
| Bank Loans |
4.0% |
| Convertible Bond |
0.1% |
| Common Stock |
0.0% |
| Other assets less liabilities |
28.9% |
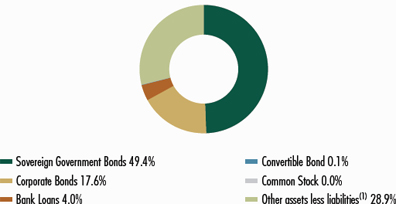
| (1) | Includes any short-term
investments and net other assets (liabilities). |
| TRADING
CURRENCIES | |
| | |
| | |
| | |
| Currency | |
| Percentage of
Total Investments |
| Albanian
lek | |
| 2.5 | % |
| Dominican
peso | |
| 3.8 | |
| Egyptian
pound | |
| 6.1 | |
| Euro | |
| 9.4 | |
| Indonesian
rupiah | |
| 4.5 | |
| Nigerian
naira | |
| 5.9 | |
| Peruvian
nuevo sol | |
| 6.2 | |
| U.S.
dollar | |
| 57.2 | |
| Uruguayan
peso | |
| 1.5 | |
| Uzbekistani
som | |
| 1.8 | |
| Other | |
| 1.1 | |
| Total
investments | |
| 100.0 | % |
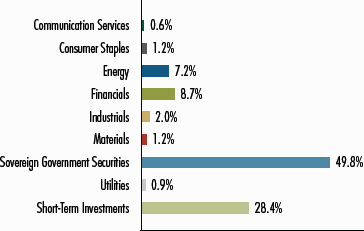
PORTFOLIO
DIVERSIFICATION
(As
a Percentage of Total Investments)
| Sector |
|
| Communication Services |
0.6% |
| Consumer Staples |
1.2% |
| Energy |
7.2% |
| Financials |
8.7% |
| Industrials |
2.0% |
| Materials |
1.2% |
| Sovereign Government Securities |
49.8% |
| Utilities |
0.9% |
| Short-Term Investments |
28.4% |

|
| Largest Holdings [Text Block] |
| TOP TEN HOLDINGS* | |
|
| |
| | |
|
| |
| Company Name | |
Country |
Percentage of
Total Net Assets |
| Commonwealth of the Bahamas | |
Bahamas |
6.5 | % |
| Bonos de la Tesoreria | |
Peru |
6.1 | |
| Republic of Indonesia | |
Indonesia |
4.5 | |
| Benin Government Bond | |
Benin |
3.8 | |
| Republic of Iraq | |
Iraq |
3.7 | |
| Banco Central de la Republica Dominicana, GDN | |
Dominican Republic |
3.7 | |
| Argentine Republic | |
Argentina |
2.7 | |
| Ukraine Government Bond | |
Ukraine |
2.4 | |
| Republic of Zambia | |
Zambia |
2.1 | |
| Federal Republic of Nigeria | |
Nigeria |
1.7 | |
| Total | |
|
37.2 | % |
| * | Excludes
short-term investments. |
|
| Material Fund Change [Text Block] |
This
is a summary of certain changes of the Fund since September 30, 2024. On January 2, 2025,
the fair value methodology used to value emerging markets debt, as determined by a third
party vendor, held by the Fund was changed from using bid pricing to using the midpoint
between the bid and ask price. The change resulted in a one-time increase of less than
0.40% in the net asset value for the Fund. Effective March 14, 2025, the Fund’s 2% redemption
fee was eliminated. For more information, you may review the Fund’s current prospectus,
which is available at www.artisanpartners.com/prospectus or upon request by calling 800.344.1770.
|
| Summary of Change Legend [Text Block] |
This
is a summary of certain changes of the Fund since September 30, 2024. On January 2, 2025,
the fair value methodology used to value emerging markets debt, as determined by a third
party vendor, held by the Fund was changed from using bid pricing to using the midpoint
between the bid and ask price. The change resulted in a one-time increase of less than
0.40% in the net asset value for the Fund. Effective March 14, 2025, the Fund’s 2% redemption
fee was eliminated.
|
| Updated Prospectus Phone Number |
800.344.1770
|
| Updated Prospectus Web Address |
www.artisanpartners.com/prospectus
|
| Artisan Emerging Markets Debt Opportunities Fund - Institutional Shares |
|
| Shareholder Report [Line Items] |
|
| Fund Name |
Artisan
Emerging Markets Debt Opportunities Fund
|
| Class Name |
Institutional Shares
|
| Trading Symbol |
APHOX
|
| Annual or Semi-Annual Statement [Text Block] |
This semi-annual shareholder report contains important information about Artisan Emerging Markets Debt Opportunities Fund
for the period of October 1, 2024 to March 31, 2025.
|
| Shareholder Report Annual or Semi-Annual |
Semi-Annual Shareholder Report
|
| Additional Information [Text Block] |
This semi-annual shareholder report contains important information about Artisan Emerging Markets Debt Opportunities Fund
for the period of October 1, 2024 to March 31, 2025. You can find additional information about the Fund at www.artisanpartners.com/prospectus.
You can also request this information by contacting us at 800.344.1770. This report
describes changes to the Fund that occurred during the reporting period.
|
| Material Fund Change Notice [Text Block] |
This report
describes changes to the Fund that occurred during the reporting period.
|
| Additional Information Phone Number |
800.344.1770
|
| Additional Information Website |
www.artisanpartners.com/prospectus
|
| Expenses [Text Block] |
What
were the Fund costs for the last six months?
(based
on a hypothetical $10,000 investment)
| Class
Name |
Costs
of a $10,000 investment |
Costs
paid as a percentage of a $10,000 investment |
| Institutional |
$56 |
1.11% |
| |
|
|
|
| Expenses Paid, Amount |
$ 56
|
| Expense Ratio, Percent |
1.11%
|
| Net Assets |
$ 94,057,000
|
| Holdings Count | Holdings |
221
|
| Advisory Fees Paid, Amount |
$ 164,000
|
| Investment Company, Portfolio Turnover |
37.53%
|
| Additional Fund Statistics [Text Block] |
| Key
Fund Statistics |
| Dollar
values in thousands |
| Net
Assets |
$94,057 |
| Number
of Portfolio Holdings |
221 |
| Total
Investment Advisory Fees (net of waivers and reimbursements) |
$164 |
| Portfolio
Turnover Rate |
37.53% |
|
| Holdings [Text Block] |
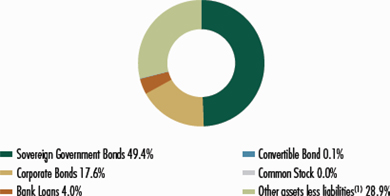
PORTFOLIO
COMPOSITION
(As
a Percentage of Total Net Assets)
| PORTFOLIO COMPOSITION |
|
| Type |
|
| Sovereign Government Bonds |
49.4% |
| Corporate Bonds |
17.6% |
| Bank Loans |
4.0% |
| Convertible Bond |
0.1% |
| Common Stock |
0.0% |
| Other assets less liabilities |
28.9% |

| (1) | Includes any short-term
investments and net other assets (liabilities). |
| TRADING
CURRENCIES | |
| | |
| | |
| | |
| Currency | |
| Percentage of
Total Investments |
| Albanian
lek | |
| 2.5 | % |
| Dominican
peso | |
| 3.8 | |
| Egyptian
pound | |
| 6.1 | |
| Euro | |
| 9.4 | |
| Indonesian
rupiah | |
| 4.5 | |
| Nigerian
naira | |
| 5.9 | |
| Peruvian
nuevo sol | |
| 6.2 | |
| U.S.
dollar | |
| 57.2 | |
| Uruguayan
peso | |
| 1.5 | |
| Uzbekistani
som | |
| 1.8 | |
| Other | |
| 1.1 | |
| Total
investments | |
| 100.0 | % |
PORTFOLIO
DIVERSIFICATION
(As
a Percentage of Total Investments)
| Sector |
|
| Communication Services |
0.6% |
| Consumer Staples |
1.2% |
| Energy |
7.2% |
| Financials |
8.7% |
| Industrials |
2.0% |
| Materials |
1.2% |
| Sovereign Government Securities |
49.8% |
| Utilities |
0.9% |
| Short-Term Investments |
28.4% |

|
| Largest Holdings [Text Block] |
| TOP TEN HOLDINGS* | |
|
| |
| | |
|
| |
| Company Name | |
Country |
Percentage of
Total Net Assets |
| Commonwealth of the Bahamas | |
Bahamas |
6.5 | % |
| Bonos de la Tesoreria | |
Peru |
6.1 | |
| Republic of Indonesia | |
Indonesia |
4.5 | |
| Benin Government Bond | |
Benin |
3.8 | |
| Republic of Iraq | |
Iraq |
3.7 | |
| Banco Central de la Republica Dominicana, GDN | |
Dominican Republic |
3.7 | |
| Argentine Republic | |
Argentina |
2.7 | |
| Ukraine Government Bond | |
Ukraine |
2.4 | |
| Republic of Zambia | |
Zambia |
2.1 | |
| Federal Republic of Nigeria | |
Nigeria |
1.7 | |
| Total | |
|
37.2 | % |
| * | Excludes
short-term investments. |
|
| Material Fund Change [Text Block] |
This is a summary of certain changes of the Fund since September 30, 2024. On January 2, 2025, the fair value methodology
used to value emerging markets debt, as determined by a third party vendor, held by the Fund was changed from using bid pricing
to using the midpoint between the bid and ask price. The change resulted in a one-time increase of less than 0.40% in the
net asset value for the Fund. Effective March 14, 2025, the Fund’s 2% redemption fee was eliminated. For more information,
you may review the Fund’s current prospectus, which is available at www.artisanpartners.com/prospectus or upon request by
calling 800.344.1770.
|
| Summary of Change Legend [Text Block] |
This is a summary of certain changes of the Fund since September 30, 2024. On January 2, 2025, the fair value methodology
used to value emerging markets debt, as determined by a third party vendor, held by the Fund was changed from using bid pricing
to using the midpoint between the bid and ask price. The change resulted in a one-time increase of less than 0.40% in the
net asset value for the Fund. Effective March 14, 2025, the Fund’s 2% redemption fee was eliminated.
|
| Updated Prospectus Phone Number |
800.344.1770
|
| Updated Prospectus Web Address |
www.artisanpartners.com/prospectus
|
| Artisan Emerging Markets Debt Opportunities Fund - Investor Shares |
|
| Shareholder Report [Line Items] |
|
| Fund Name |
Artisan
Emerging Markets Debt Opportunities Fund
|
| Class Name |
Investor Shares
|
| Trading Symbol |
APFOX
|
| Annual or Semi-Annual Statement [Text Block] |
This semi-annual shareholder report contains important information about Artisan Emerging Markets Debt Opportunities Fund
for the period of October 1, 2024 to March 31, 2025.
|
| Shareholder Report Annual or Semi-Annual |
Semi-Annual Shareholder Report
|
| Additional Information [Text Block] |
This semi-annual shareholder report contains important information about Artisan Emerging Markets Debt Opportunities Fund
for the period of October 1, 2024 to March 31, 2025. You can find additional information about the Fund at www.artisanpartners.com/prospectus.
You can also request this information by contacting us at 800.344.1770. This report
describes changes to the Fund that occurred during the reporting period.
|
| Material Fund Change Notice [Text Block] |
This report
describes changes to the Fund that occurred during the reporting period.
|
| Additional Information Phone Number |
800.344.1770
|
| Additional Information Website |
www.artisanpartners.com/prospectus
|
| Expenses [Text Block] |
What
were the Fund costs for the last six months?
(based
on a hypothetical $10,000 investment)
| Class
Name |
Costs
of a $10,000 investment |
Costs
paid as a percentage of a $10,000 investment |
| Investor |
$64 |
1.26% |
| |
|
|
|
| Expenses Paid, Amount |
$ 64
|
| Expense Ratio, Percent |
1.26%
|
| Net Assets |
$ 94,057,000
|
| Holdings Count | Holdings |
221
|
| Advisory Fees Paid, Amount |
$ 164,000
|
| Investment Company, Portfolio Turnover |
37.53%
|
| Additional Fund Statistics [Text Block] |
| Key
Fund Statistics |
| Dollar
values in thousands |
| Net
Assets |
$94,057 |
| Number
of Portfolio Holdings |
221 |
| Total
Investment Advisory Fees (net of waivers and reimbursements) |
$164 |
| Portfolio
Turnover Rate |
37.53% |
|
| Holdings [Text Block] |
PORTFOLIO
COMPOSITION
(As
a Percentage of Total Net Assets)
| PORTFOLIO COMPOSITION |
|
| Type |
|
| Sovereign Government Bonds |
49.4% |
| Corporate Bonds |
17.6% |
| Bank Loans |
4.0% |
| Convertible Bond |
0.1% |
| Common Stock |
0.0% |
| Other assets less liabilities |
28.9% |
| (1) | Includes any short-term
investments and net other assets (liabilities). |
| TRADING
CURRENCIES | |
| | |
| | |
| | |
| Currency | |
| Percentage of
Total Investments |
| Albanian
lek | |
| 2.5 | % |
| Dominican
peso | |
| 3.8 | |
| Egyptian
pound | |
| 6.1 | |
| Euro | |
| 9.4 | |
| Indonesian
rupiah | |
| 4.5 | |
| Nigerian
naira | |
| 5.9 | |
| Peruvian
nuevo sol | |
| 6.2 | |
| U.S.
dollar | |
| 57.2 | |
| Uruguayan
peso | |
| 1.5 | |
| Uzbekistani
som | |
| 1.8 | |
| Other | |
| 1.1 | |
| Total
investments | |
| 100.0 | % |
PORTFOLIO
DIVERSIFICATION
(As
a Percentage of Total Investments)
| Sector |
|
| Communication Services |
0.6% |
| Consumer Staples |
1.2% |
| Energy |
7.2% |
| Financials |
8.7% |
| Industrials |
2.0% |
| Materials |
1.2% |
| Sovereign Government Securities |
49.8% |
| Utilities |
0.9% |
| Short-Term Investments |
28.4% |
|
| Largest Holdings [Text Block] |
| TOP TEN HOLDINGS* | |
|
| |
| | |
|
| |
| Company Name | |
Country |
Percentage of
Total Net Assets |
| Commonwealth of the Bahamas | |
Bahamas |
6.5 | % |
| Bonos de la Tesoreria | |
Peru |
6.1 | |
| Republic of Indonesia | |
Indonesia |
4.5 | |
| Benin Government Bond | |
Benin |
3.8 | |
| Republic of Iraq | |
Iraq |
3.7 | |
| Banco Central de la Republica Dominicana, GDN | |
Dominican Republic |
3.7 | |
| Argentine Republic | |
Argentina |
2.7 | |
| Ukraine Government Bond | |
Ukraine |
2.4 | |
| Republic of Zambia | |
Zambia |
2.1 | |
| Federal Republic of Nigeria | |
Nigeria |
1.7 | |
| Total | |
|
37.2 | % |
| * | Excludes
short-term investments. |
|
| Material Fund Change [Text Block] |
This is a summary of certain changes of the Fund since September 30, 2024. On January 2, 2025, the fair value methodology
used to value emerging markets debt, as determined by a third party vendor, held by the Fund was changed from using bid pricing
to using the midpoint between the bid and ask price. The change resulted in a one-time increase of less than 0.40% in the
net asset value for the Fund. Effective March 14, 2025, the Fund’s 2% redemption fee was eliminated. For more information,
you may review the Fund’s current prospectus, which is available at www.artisanpartners.com/prospectus or upon request by
calling 800.344.1770.
|
| Summary of Change Legend [Text Block] |
This is a summary of certain changes of the Fund since September 30, 2024. On January 2, 2025, the fair value methodology
used to value emerging markets debt, as determined by a third party vendor, held by the Fund was changed from using bid pricing
to using the midpoint between the bid and ask price. The change resulted in a one-time increase of less than 0.40% in the
net asset value for the Fund. Effective March 14, 2025, the Fund’s 2% redemption fee was eliminated.
|
| Updated Prospectus Phone Number |
800.344.1770
|
| Updated Prospectus Web Address |
www.artisanpartners.com/prospectus
|
| Artisan Floating Rate Fund - Advisor Shares |
|
| Shareholder Report [Line Items] |
|
| Fund Name |
Artisan
Floating Rate Fund
|
| Class Name |
Advisor Shares
|
| Trading Symbol |
APDUX
|
| Annual or Semi-Annual Statement [Text Block] |
This semi-annual shareholder report contains important information about Artisan Floating Rate Fund for the period of October
1, 2024 to March 31, 2025.
|
| Shareholder Report Annual or Semi-Annual |
Semi-Annual Shareholder Report
|
| Additional Information [Text Block] |
This semi-annual shareholder report contains important information about Artisan Floating Rate Fund for the period of October
1, 2024 to March 31, 2025. You can find additional information about the Fund at www.artisanpartners.com/prospectus. You can
also request this information by contacting us at 800.344.1770.
|
| Additional Information Phone Number |
800.344.1770
|
| Additional Information Website |
www.artisanpartners.com/prospectus
|
| Expenses [Text Block] |
What
were the Fund costs for the last six months?
(based
on a hypothetical $10,000 investment)
| Class
Name |
Costs
of a $10,000 investment |
Costs
paid as a percentage of a $10,000 investment |
| Advisor |
$56 |
1.10% |
| |
|
|
|
| Expenses Paid, Amount |
$ 56
|
| Expense Ratio, Percent |
1.10%
|
| Net Assets |
$ 85,081,000
|
| Holdings Count | Holdings |
102
|
| Advisory Fees Paid, Amount |
$ 149,000
|
| Investment Company, Portfolio Turnover |
44.52%
|
| Additional Fund Statistics [Text Block] |
| Key
Fund Statistics |
| Dollar
values in thousands |
| Net
Assets |
$85,081 |
| Number
of Portfolio Holdings |
102 |
| Total
Investment Advisory Fees (net of waivers and reimbursements) |
$149 |
| Portfolio
Turnover Rate |
44.52% |
|
| Holdings [Text Block] |
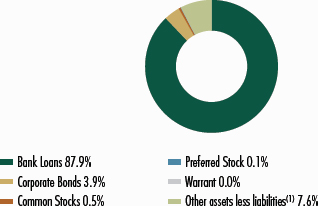
PORTFOLIO
COMPOSITION
(As
a Percentage of Total Net Assets)
| PORTFOLIO COMPOSITION |
|
| Type |
|
| Bank Loans |
87.9% |
| Corporate Bonds |
3.9% |
| Common Stocks |
0.5% |
| Preferred Stock |
0.1% |
| Warrant |
0.0% |
| Other assets less liabilities |
7.6% |

| (1) | Includes any short-term
investments and net other assets (liabilities). |
| TRADING
CURRENCIES | |
| | |
| | |
| | |
| Currency | |
| Percentage of
Total Investments |
| U.S. dollar | |
| 100.0 | % |
| Total
investments | |
| 100.0 | % |
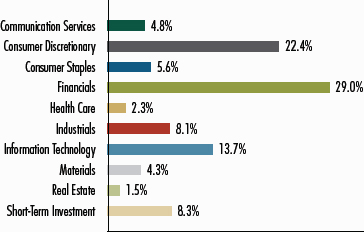
PORTFOLIO
DIVERSIFICATION
(As
a Percentage of Total Investments)
| Sector |
|
| Communication Services |
4.8% |
| Consumer Discretionary |
22.4% |
| Consumer Staples |
5.6% |
| Financials |
29.0% |
| Health Care |
2.3% |
| Industrials |
8.1% |
| Information Technology |
13.7% |
| Materials |
4.3% |
| Real Estate |
1.5% |
| Short-Term Investment |
8.3% |

|
| Largest Holdings [Text Block] |
| TOP TEN HOLDINGS* | |
|
| |
| | |
|
| |
| Company Name | |
Country |
Percentage of
Total Net Assets |
| GSM Holdings, Inc. First Lien Term Loan | |
United States |
2.9 | % |
| Nexus Buyer LLC First Lien Term Loan | |
United States |
2.8 | |
| Delta Topco, Inc. First Lien Term Loan | |
United States |
2.8 | |
| UKG, Inc. First Lien Term Loan | |
United States |
2.3 | |
| Nexus Buyer LLC Second Lien Term Loan | |
United States |
2.2 | |
| Arches Buyer, Inc. First Lien Term Loan | |
United States |
2.2 | |
| TKC Holdings, Inc. | |
United States |
2.0 | |
| CCI Buyer, Inc. First Lien Term Loan | |
United States |
1.9 | |
| Acrisure LLC First Lien Term Loan B1 | |
United States |
1.9 | |
| BCPE Grill Parent, Inc. First Lien Term Loan | |
United States |
1.9 | |
| Total | |
|
22.9 | % |
| * | Excludes
short-term investments. |
|
| Artisan Floating Rate Fund - Institutional Shares |
|
| Shareholder Report [Line Items] |
|
| Fund Name |
Artisan
Floating Rate Fund
|
| Class Name |
Institutional Shares
|
| Trading Symbol |
APHUX
|
| Annual or Semi-Annual Statement [Text Block] |
This semi-annual shareholder report contains important information about Artisan Floating Rate Fund for the period of October
1, 2024 to March 31, 2025.
|
| Shareholder Report Annual or Semi-Annual |
Semi-Annual Shareholder Report
|
| Additional Information [Text Block] |
This semi-annual shareholder report contains important information about Artisan Floating Rate Fund for the period of October
1, 2024 to March 31, 2025. You can find additional information about the Fund at www.artisanpartners.com/prospectus. You can
also request this information by contacting us at 800.344.1770.
|
| Additional Information Phone Number |
800.344.1770
|
| Additional Information Website |
www.artisanpartners.com/prospectus
|
| Expenses [Text Block] |
What
were the Fund costs for the last six months?
(based
on a hypothetical $10,000 investment)
| Class
Name |
Costs
of a $10,000 investment |
Costs
paid as a percentage of a $10,000 investment |
| Institutional |
$53 |
1.05% |
| |
|
|
|
| Expenses Paid, Amount |
$ 53
|
| Expense Ratio, Percent |
1.05%
|
| Net Assets |
$ 85,081,000
|
| Holdings Count | Holdings |
102
|
| Advisory Fees Paid, Amount |
$ 149,000
|
| Investment Company, Portfolio Turnover |
44.52%
|
| Additional Fund Statistics [Text Block] |
| Key
Fund Statistics |
| Dollar
values in thousands |
| Net
Assets |
$85,081 |
| Number
of Portfolio Holdings |
102 |
| Total
Investment Advisory Fees (net of waivers and reimbursements) |
$149 |
| Portfolio
Turnover Rate |
44.52% |
|
| Holdings [Text Block] |
PORTFOLIO
COMPOSITION
(As
a Percentage of Total Net Assets)
| PORTFOLIO COMPOSITION |
|
| Type |
|
| Bank Loans |
87.9% |
| Corporate Bonds |
3.9% |
| Common Stocks |
0.5% |
| Preferred Stock |
0.1% |
| Warrant |
0.0% |
| Other assets less liabilities |
7.6% |

| (1) | Includes any short-term
investments and net other assets (liabilities). |
| TRADING
CURRENCIES | |
| | |
| | |
| | |
| Currency | |
| Percentage of
Total Investments |
| U.S. dollar | |
| 100.0 | % |
| Total
investments | |
| 100.0 | % |
PORTFOLIO
DIVERSIFICATION
(As
a Percentage of Total Investments)
| Sector |
|
| Communication Services |
4.8% |
| Consumer Discretionary |
22.4% |
| Consumer Staples |
5.6% |
| Financials |
29.0% |
| Health Care |
2.3% |
| Industrials |
8.1% |
| Information Technology |
13.7% |
| Materials |
4.3% |
| Real Estate |
1.5% |
| Short-Term Investment |
8.3% |

|
| Largest Holdings [Text Block] |
| TOP TEN HOLDINGS* | |
|
| |
| | |
|
| |
| Company Name | |
Country |
Percentage of
Total Net Assets |
| GSM Holdings, Inc. First Lien Term Loan | |
United States |
2.9 | % |
| Nexus Buyer LLC First Lien Term Loan | |
United States |
2.8 | |
| Delta Topco, Inc. First Lien Term Loan | |
United States |
2.8 | |
| UKG, Inc. First Lien Term Loan | |
United States |
2.3 | |
| Nexus Buyer LLC Second Lien Term Loan | |
United States |
2.2 | |
| Arches Buyer, Inc. First Lien Term Loan | |
United States |
2.2 | |
| TKC Holdings, Inc. | |
United States |
2.0 | |
| CCI Buyer, Inc. First Lien Term Loan | |
United States |
1.9 | |
| Acrisure LLC First Lien Term Loan B1 | |
United States |
1.9 | |
| BCPE Grill Parent, Inc. First Lien Term Loan | |
United States |
1.9 | |
| Total | |
|
22.9 | % |
| * | Excludes
short-term investments. |
|
| Artisan Floating Rate Fund - Investor Shares |
|
| Shareholder Report [Line Items] |
|
| Fund Name |
Artisan
Floating Rate Fund
|
| Class Name |
Investor Shares
|
| Trading Symbol |
ARTUX
|
| Annual or Semi-Annual Statement [Text Block] |
This semi-annual shareholder report contains important information about Artisan Floating Rate Fund for the period of October
1, 2024 to March 31, 2025.
|
| Shareholder Report Annual or Semi-Annual |
Semi-Annual Shareholder Report
|
| Additional Information [Text Block] |
This semi-annual shareholder report contains important information about Artisan Floating Rate Fund for the period of October
1, 2024 to March 31, 2025. You can find additional information about the Fund at www.artisanpartners.com/prospectus. You can
also request this information by contacting us at 800.344.1770.
|
| Additional Information Phone Number |
800.344.1770
|
| Additional Information Website |
www.artisanpartners.com/prospectus
|
| Expenses [Text Block] |
What
were the Fund costs for the last six months?
(based
on a hypothetical $10,000 investment)
| Class
Name |
Costs
of a $10,000 investment |
Costs
paid as a percentage of a $10,000 investment |
| Investor |
$61 |
1.20% |
| |
|
|
|
| Expenses Paid, Amount |
$ 61
|
| Expense Ratio, Percent |
1.20%
|
| Net Assets |
$ 85,081,000
|
| Holdings Count | Holdings |
102
|
| Advisory Fees Paid, Amount |
$ 149,000
|
| Investment Company, Portfolio Turnover |
44.52%
|
| Additional Fund Statistics [Text Block] |
| Key
Fund Statistics |
| Dollar
values in thousands |
| Net
Assets |
$85,081 |
| Number
of Portfolio Holdings |
102 |
| Total
Investment Advisory Fees (net of waivers and reimbursements) |
$149 |
| Portfolio
Turnover Rate |
44.52% |
|
| Holdings [Text Block] |
PORTFOLIO
COMPOSITION
(As
a Percentage of Total Net Assets)
| PORTFOLIO COMPOSITION |
|
| Type |
|
| Bank Loans |
87.9% |
| Corporate Bonds |
3.9% |
| Common Stocks |
0.5% |
| Preferred Stock |
0.1% |
| Warrant |
0.0% |
| Other assets less liabilities |
7.6% |
| (1) | Includes any short-term
investments and net other assets (liabilities). |
| TRADING
CURRENCIES | |
| | |
| | |
| | |
| Currency | |
| Percentage of
Total Investments |
| U.S. dollar | |
| 100.0 | % |
| Total
investments | |
| 100.0 | % |
PORTFOLIO
DIVERSIFICATION
(As
a Percentage of Total Investments)
| Sector |
|
| Communication Services |
4.8% |
| Consumer Discretionary |
22.4% |
| Consumer Staples |
5.6% |
| Financials |
29.0% |
| Health Care |
2.3% |
| Industrials |
8.1% |
| Information Technology |
13.7% |
| Materials |
4.3% |
| Real Estate |
1.5% |
| Short-Term Investment |
8.3% |
|
| Largest Holdings [Text Block] |
| TOP TEN HOLDINGS* | |
|
| |
| | |
|
| |
| Company Name | |
Country |
Percentage of
Total Net Assets |
| GSM Holdings, Inc. First Lien Term Loan | |
United States |
2.9 | % |
| Nexus Buyer LLC First Lien Term Loan | |
United States |
2.8 | |
| Delta Topco, Inc. First Lien Term Loan | |
United States |
2.8 | |
| UKG, Inc. First Lien Term Loan | |
United States |
2.3 | |
| Nexus Buyer LLC Second Lien Term Loan | |
United States |
2.2 | |
| Arches Buyer, Inc. First Lien Term Loan | |
United States |
2.2 | |
| TKC Holdings, Inc. | |
United States |
2.0 | |
| CCI Buyer, Inc. First Lien Term Loan | |
United States |
1.9 | |
| Acrisure LLC First Lien Term Loan B1 | |
United States |
1.9 | |
| BCPE Grill Parent, Inc. First Lien Term Loan | |
United States |
1.9 | |
| Total | |
|
22.9 | % |
| * | Excludes
short-term investments. |
|
| Artisan Focus Fund - Advisor Shares |
|
| Shareholder Report [Line Items] |
|
| Fund Name |
Artisan
Focus Fund
|
| Class Name |
Advisor Shares
|
| Trading Symbol |
APDTX
|
| Annual or Semi-Annual Statement [Text Block] |
This semi-annual shareholder report contains important information about Artisan Focus Fund for the period of October 1, 2024
to March 31, 2025.
|
| Shareholder Report Annual or Semi-Annual |
Semi-Annual Shareholder Report
|
| Additional Information [Text Block] |
This semi-annual shareholder report contains important information about Artisan Focus Fund for the period of October 1, 2024
to March 31, 2025. You can find additional information about the Fund at www.artisanpartners.com/prospectus. You can also
request this information by contacting us at 800.344.1770.
|
| Additional Information Phone Number |
800.344.1770
|
| Additional Information Website |
www.artisanpartners.com/prospectus
|
| Expenses [Text Block] |
What
were the Fund costs for the last six months?
(based
on a hypothetical $10,000 investment)
| Class
Name |
Costs
of a $10,000 investment |
Costs
paid as a percentage of a $10,000 investment |
| Advisor |
$58 |
1.16% |
| |
|
|
|
| Expenses Paid, Amount |
$ 58
|
| Expense Ratio, Percent |
1.16%
|
| Net Assets |
$ 989,311,000
|
| Holdings Count | Holdings |
39
|
| Advisory Fees Paid, Amount |
$ 5,437,000
|
| Investment Company, Portfolio Turnover |
131.24%
|
| Additional Fund Statistics [Text Block] |
| Key
Fund Statistics |
| Dollar
values in thousands |
| Net
Assets |
$989,311 |
| Number
of Portfolio Holdings |
39 |
| Total
Investment Advisory Fees (net of waivers and reimbursements) |
$5,437 |
| Portfolio
Turnover Rate |
131.24% |
|
| Holdings [Text Block] |
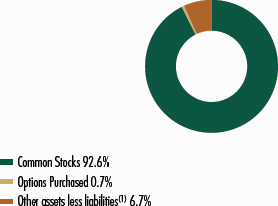
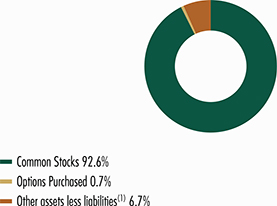
PORTFOLIO COMPOSITION
(As
a Percentage of Total Net Assets)
| PORTFOLIO COMPOSITION |
|
| Type |
|
| Common Stocks |
92.6% |
| Options Purchased |
0.7% |
| Other assets less liabilities |
6.7% |

| (1) | Includes any short-term
investments and net other assets (liabilities). |
| TRADING
CURRENCIES | |
| | |
| | |
| | |
| Currency | |
| Percentage of
Total Investments |
| British
pound | |
| 4.3 | % |
| Euro | |
| 4.7 | |
| U.S.
dollar | |
| 91.0 | |
| Total
investments | |
| 100.0 | % |
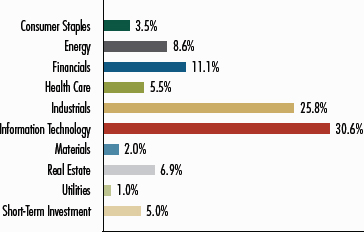
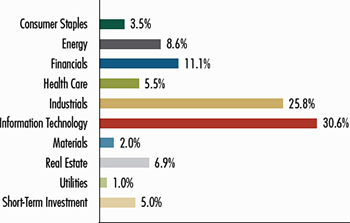
PORTFOLIO
DIVERSIFICATION
(As
a Percentage of Total Investments)
| Sector |
|
| Consumer Staples |
3.5% |
| Energy |
8.6% |
| Financials |
11.1% |
| Health Care |
5.5% |
| Industrials |
25.8% |
| Information Technology |
30.6% |
| Materials |
2.0% |
| Real Estate |
6.9% |
| Utilities |
1.0% |
| Short-Term Investment |
5.0% |

|
| Largest Holdings [Text Block] |
| TOP TEN HOLDINGS* | |
|
| |
| | |
|
| |
| Company
Name | |
Country |
Percentage of
Total Net Assets |
| Microsoft
Corp. | |
United States |
9.3 | % |
| NVIDIA Corp. | |
United States |
8.1 | |
| Taiwan Semiconductor
Manufacturing Co. Ltd. | |
Taiwan |
7.4 | |
| GE Aerospace | |
United States |
6.8 | |
| Williams Cos., Inc. (The) | |
United States |
4.4 | |
| Rolls-Royce Holdings
plc | |
United Kingdom |
4.2 | |
| Howmet Aerospace, Inc. | |
United States |
4.1 | |
| Kinder Morgan, Inc. | |
United States |
4.0 | |
| Intuitive Surgical, Inc. | |
United States |
3.9 | |
| Crown
Castle, Inc. | |
United
States |
3.6 | |
| Total | |
|
55.8 | % |
| * | Excludes
short-term investments. |
|
| Artisan Focus Fund - Institutional Shares |
|
| Shareholder Report [Line Items] |
|
| Fund Name |
Artisan
Focus Fund
|
| Class Name |
Institutional Shares
|
| Trading Symbol |
APHTX
|
| Annual or Semi-Annual Statement [Text Block] |
This semi-annual shareholder report contains important information about Artisan Focus Fund for the period of October 1, 2024
to March 31, 2025.
|
| Shareholder Report Annual or Semi-Annual |
Semi-Annual Shareholder Report
|
| Additional Information [Text Block] |
This semi-annual shareholder report contains important information about Artisan Focus Fund for the period of October 1, 2024
to March 31, 2025. You can find additional information about the Fund at www.artisanpartners.com/prospectus. You can also
request this information by contacting us at 800.344.1770.
|
| Additional Information Phone Number |
800.344.1770
|
| Additional Information Website |
www.artisanpartners.com/prospectus
|
| Expenses [Text Block] |
What
were the Fund costs for the last six months?
(based
on a hypothetical $10,000 investment)
| Class
Name |
Costs
of a $10,000 investment |
Costs
paid as a percentage of a $10,000 investment |
| Institutional |
$54 |
1.08% |
| |
|
|
|
| Expenses Paid, Amount |
$ 54
|
| Expense Ratio, Percent |
1.08%
|
| Net Assets |
$ 989,311,000
|
| Holdings Count | Holdings |
39
|
| Advisory Fees Paid, Amount |
$ 5,437,000
|
| Investment Company, Portfolio Turnover |
131.24%
|
| Additional Fund Statistics [Text Block] |
| Key
Fund Statistics |
| Dollar
values in thousands |
| Net
Assets |
$989,311 |
| Number
of Portfolio Holdings |
39 |
| Total
Investment Advisory Fees (net of waivers and reimbursements) |
$5,437 |
| Portfolio
Turnover Rate |
131.24% |
|
| Holdings [Text Block] |
PORTFOLIO COMPOSITION
(As
a Percentage of Total Net Assets)
| PORTFOLIO COMPOSITION |
|
| Type |
|
| Common Stocks |
92.6% |
| Options Purchased |
0.7% |
| Other assets less liabilities |
6.7% |
| (1) | Includes any short-term
investments and net other assets (liabilities). |
| TRADING
CURRENCIES | |
| | |
| | |
| | |
| Currency | |
| Percentage of
Total Investments |
| British
pound | |
| 4.3 | % |
| Euro | |
| 4.7 | |
| U.S.
dollar | |
| 91.0 | |
| Total
investments | |
| 100.0 | % |
PORTFOLIO
DIVERSIFICATION
(As
a Percentage of Total Investments)
| Sector |
|
| Consumer Staples |
3.5% |
| Energy |
8.6% |
| Financials |
11.1% |
| Health Care |
5.5% |
| Industrials |
25.8% |
| Information Technology |
30.6% |
| Materials |
2.0% |
| Real Estate |
6.9% |
| Utilities |
1.0% |
| Short-Term Investment |
5.0% |
|
| Largest Holdings [Text Block] |
| TOP TEN HOLDINGS* | |
|
| |
| | |
|
| |
| Company
Name | |
Country |
Percentage of
Total Net Assets |
| Microsoft
Corp. | |
United States |
9.3 | % |
| NVIDIA Corp. | |
United States |
8.1 | |
| Taiwan Semiconductor
Manufacturing Co. Ltd. | |
Taiwan |
7.4 | |
| GE Aerospace | |
United States |
6.8 | |
| Williams Cos., Inc. (The) | |
United States |
4.4 | |
| Rolls-Royce Holdings
plc | |
United Kingdom |
4.2 | |
| Howmet Aerospace, Inc. | |
United States |
4.1 | |
| Kinder Morgan, Inc. | |
United States |
4.0 | |
| Intuitive Surgical, Inc. | |
United States |
3.9 | |
| Crown
Castle, Inc. | |
United
States |
3.6 | |
| Total | |
|
55.8 | % |
| * | Excludes
short-term investments. |
|
| Artisan Focus Fund - Investor Shares |
|
| Shareholder Report [Line Items] |
|
| Fund Name |
Artisan
Focus Fund
|
| Class Name |
Investor Shares
|
| Trading Symbol |
ARTTX
|
| Annual or Semi-Annual Statement [Text Block] |
This semi-annual shareholder report contains important information
about Artisan Focus Fund for the period of October 1, 2024 to March
31, 2025.
|
| Shareholder Report Annual or Semi-Annual |
Semi-Annual
Shareholder Report
|
| Additional Information [Text Block] |
This semi-annual shareholder report contains important information
about Artisan Focus Fund for the period of October 1, 2024 to March
31, 2025. You can find additional information about the Fund at
www.artisanpartners.com/prospectus. You can also request this information by contacting us at 800.344.1770.
|
| Additional Information Phone Number |
800.344.1770
|
| Additional Information Website |
www.artisanpartners.com/prospectus
|
| Expenses [Text Block] |
What
were the Fund costs for the last six months?
(based
on a hypothetical $10,000 investment)
| Class
Name |
Costs
of a $10,000 investment |
Costs
paid as a percentage of a $10,000 investment |
| Investor |
$67 |
1.34% |
| |
|
|
|
| Expenses Paid, Amount |
$ 67
|
| Expense Ratio, Percent |
1.34%
|
| Net Assets |
$ 989,311,000
|
| Holdings Count | Holdings |
39
|
| Advisory Fees Paid, Amount |
$ 5,437,000
|
| Investment Company, Portfolio Turnover |
131.24%
|
| Additional Fund Statistics [Text Block] |
| Key
Fund Statistics |
| Dollar
values in thousands |
| Net
Assets |
$989,311 |
| Number
of Portfolio Holdings |
39 |
| Total
Investment Advisory Fees (net of waivers and reimbursements) |
$5,437 |
| Portfolio
Turnover Rate |
131.24% |
|
| Holdings [Text Block] |
PORTFOLIO
COMPOSITION
(As
a Percentage of Total Net Assets)
| PORTFOLIO COMPOSITION |
|
| Type |
|
| Common Stocks |
92.6% |
| Options Purchased |
0.7% |
| Other assets less liabilities |
6.7% |
| (1) | Includes
any short-term investments and net other assets (liabilities). |
| TRADING
CURRENCIES | |
| | |
| | |
| | |
| Currency | |
| Percentage of
Total Investments |
| British pound | |
| 4.3 | % |
| Euro | |
| 4.7 | |
| U.S.
dollar | |
| 91.0 | |
| Total
investments | |
| 100.0 | % |
PORTFOLIO
DIVERSIFICATION
(As
a Percentage of Total Investments)
| Sector |
|
| Consumer Staples |
3.5% |
| Energy |
8.6% |
| Financials |
11.1% |
| Health Care |
5.5% |
| Industrials |
25.8% |
| Information Technology |
30.6% |
| Materials |
2.0% |
| Real Estate |
6.9% |
| Utilities |
1.0% |
| Short-Term Investment |
5.0% |
|
| Largest Holdings [Text Block] |
| Company Name | |
Country |
Percentage
of
Total Net Assets |
| Microsoft
Corp. | |
United States |
9.3 | % |
| NVIDIA Corp. | |
United States |
8.1 | |
| Taiwan Semiconductor
Manufacturing Co. Ltd. | |
Taiwan |
7.4 | |
| GE Aerospace | |
United States |
6.8 | |
| Williams Cos., Inc. (The) | |
United States |
4.4 | |
| Rolls-Royce Holdings
plc | |
United Kingdom |
4.2 | |
| Howmet Aerospace, Inc. | |
United States |
4.1 | |
| Kinder Morgan, Inc. | |
United States |
4.0 | |
| Intuitive Surgical, Inc. | |
United States |
3.9 | |
| Crown Castle, Inc. | |
United States |
3.6 | |
| Total | |
|
55.8 | % |
| * | Excludes
short-term investments. |
|
| Artisan Global Discovery Fund - Advisor Shares |
|
| Shareholder Report [Line Items] |
|
| Fund Name |
Artisan
Global Discovery Fund
|
| Class Name |
Advisor Shares
|
| Trading Symbol |
APDDX
|
| Annual or Semi-Annual Statement [Text Block] |
This
semi-annual shareholder report contains important information about Artisan Global Discovery
Fund for the period of October 1, 2024 to March 31, 2025.
|
| Shareholder Report Annual or Semi-Annual |
Semi-Annual
Shareholder Report
|
| Additional Information [Text Block] |
This
semi-annual shareholder report contains important information about Artisan Global Discovery
Fund for the period of October 1, 2024 to March 31, 2025. You can find additional information
about the Fund at www.artisanpartners.com/prospectus. You can also request this information
by contacting us at 800.344.1770. This report describes changes to the Fund that occurred
during the reporting period.
|
| Material Fund Change Notice [Text Block] |
This report describes changes to the Fund that occurred
during the reporting period.
|
| Additional Information Phone Number |
800.344.1770
|
| Additional Information Website |
www.artisanpartners.com/prospectus
|
| Expenses [Text Block] |
What
were the Fund costs for the last six months?
(based
on a hypothetical $10,000 investment)
| Class
Name |
Costs
of a $10,000 investment |
Costs
paid as a percentage of a $10,000 investment |
| Advisor |
$65 |
1.30% |
| |
|
|
|
| Expenses Paid, Amount |
$ 65
|
| Expense Ratio, Percent |
1.30%
|
| Net Assets |
$ 223,291,000
|
| Holdings Count | Holdings |
62
|
| Advisory Fees Paid, Amount |
$ 1,193,000
|
| Investment Company, Portfolio Turnover |
34.96%
|
| Additional Fund Statistics [Text Block] |
| Key
Fund Statistics |
| Dollar
values in thousands |
| Net
Assets |
$223,291 |
| Number
of Portfolio Holdings |
62 |
| Total
Investment Advisory Fees (net of waivers and reimbursements) |
$1,193 |
| Portfolio
Turnover Rate |
34.96% |
|
| Holdings [Text Block] |
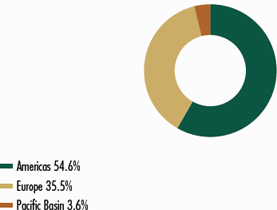
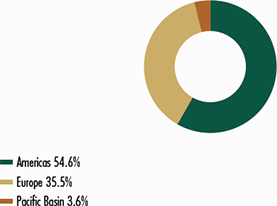
REGION
ALLOCATION
(As
a Percentage of Total Net Assets)
| REGION ALLOCATION |
|
| Region |
|
| Americas |
54.6% |
| Europe |
35.5% |
| Pacific Basin |
3.6% |
| TRADING CURRENCIES | |
| | |
| | |
| | |
| Currency | |
| Percentage of
Total Investments
|
| British pound | |
| 10.3 | % |
| Canadian dollar | |
| 1.1 | |
| Danish krone | |
| 1.8 | |
| Euro | |
| 9.6 | |
| Hong Kong dollar | |
| 1.4 | |
| Swedish krona | |
| 0.9 | |
| Swiss franc | |
| 5.0 | |
| U.S. dollar | |
| 69.9 | |
| Total
investments | |
| 100.0 | % |
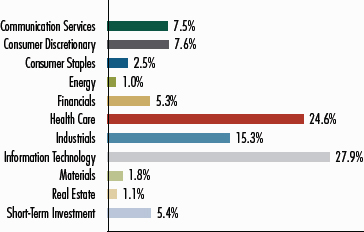
PORTFOLIO
DIVERSIFICATION
(As
a Percentage of Total Investments)
| Sector |
|
| Communication Services |
7.5% |
| Consumer Discretionary |
7.6% |
| Consumer Staples |
2.5% |
| Energy |
1.0% |
| Financials |
5.3% |
| Health Care |
24.6% |
| Industrials |
15.3% |
| Information Technology |
27.9% |
| Materials |
1.8% |
| Real Estate |
1.1% |
| Short-Term Investment |
5.4% |
|
| Largest Holdings [Text Block] |
| Company Name | |
Country |
Percentage of
Total Net Assets
|
| Argenx SE | |
Netherlands |
4.5 | % |
| Ascendis Pharma A/S | |
Denmark |
3.6 | |
| Babcock International
Group plc | |
United Kingdom |
3.4 | |
| London Stock Exchange
Group plc | |
United Kingdom |
3.4 | |
| Tyler Technologies, Inc. | |
United States |
2.9 | |
| Guidewire Software, Inc. | |
United States |
2.5 | |
| iRhythm Technologies,
Inc. | |
United States |
2.2 | |
| Sea Ltd. | |
Singapore |
2.2 | |
| Liberty Media Corp-Liberty
Formula One | |
United States |
2.1 | |
| adidas
AG | |
Germany |
2.0 | |
| Total | |
|
28.8 | % |
| * | Excludes
short-term investments. |
|
| Material Fund Change [Text Block] |
This
is a summary of certain changes of the Fund since September 30, 2024. Effective December
31, 2024, Craigh Cepukenas stepped down as portfolio manager of the Fund. Mr. Cepukenas
will remain an active member of the Artisan Partners Growth Team in an advisory capacity
as a managing director. For more information, you may review the Fund’s current prospectus,
which is available at www.artisanpartners.com/prospectus or upon request by calling 800.344.1770.
|
| Summary of Change Legend [Text Block] |
This
is a summary of certain changes of the Fund since September 30, 2024. Effective December
31, 2024, Craigh Cepukenas stepped down as portfolio manager of the Fund. Mr. Cepukenas
will remain an active member of the Artisan Partners Growth Team in an advisory capacity
as a managing director.
|
| Updated Prospectus Phone Number |
800.344.1770
|
| Updated Prospectus Web Address |
www.artisanpartners.com/prospectus
|
| Artisan Global Discovery Fund - Institutional Shares |
|
| Shareholder Report [Line Items] |
|
| Fund Name |
Artisan
Global Discovery Fund
|
| Class Name |
Institutional Shares
|
| Trading Symbol |
APHDX
|
| Annual or Semi-Annual Statement [Text Block] |
This
semi-annual shareholder report contains important information about Artisan Global Discovery
Fund for the period of October 1, 2024 to March 31, 2025.
|
| Shareholder Report Annual or Semi-Annual |
Semi-Annual
Shareholder Report
|
| Additional Information [Text Block] |
This
semi-annual shareholder report contains important information about Artisan Global Discovery
Fund for the period of October 1, 2024 to March 31, 2025. You can find additional information
about the Fund at www.artisanpartners.com/prospectus. You can also request this information
by contacting us at 800.344.1770. This report describes changes to the Fund that occurred
during the reporting period.
|
| Material Fund Change Notice [Text Block] |
This report describes changes to the Fund that occurred
during the reporting period.
|
| Additional Information Phone Number |
800.344.1770
|
| Additional Information Website |
www.artisanpartners.com/prospectus
|
| Expenses [Text Block] |
What
were the Fund costs for the last six months?
(based
on a hypothetical $10,000 investment)
| Class
Name |
Costs
of a $10,000 investment |
Costs
paid as a percentage of a $10,000 investment |
| Institutional |
$54 |
1.08% |
| |
|
|
|
| Expenses Paid, Amount |
$ 54
|
| Expense Ratio, Percent |
1.08%
|
| Net Assets |
$ 223,291,000
|
| Holdings Count | Holdings |
62
|
| Advisory Fees Paid, Amount |
$ 1,193,000
|
| Investment Company, Portfolio Turnover |
34.96%
|
| Additional Fund Statistics [Text Block] |
| Key
Fund Statistics |
| Dollar
values in thousands |
| Net
Assets |
$223,291 |
| Number
of Portfolio Holdings |
62 |
| Total
Investment Advisory Fees (net of waivers and reimbursements) |
$1,193 |
| Portfolio
Turnover Rate |
34.96% |
|
| Holdings [Text Block] |
REGION
ALLOCATION
(As
a Percentage of Total Net Assets)
| REGION ALLOCATION |
|
| Region |
|
| Americas |
54.6% |
| Europe |
35.5% |
| Pacific Basin |
3.6% |
| TRADING CURRENCIES | |
| | |
| | |
| | |
| Currency | |
| Percentage of
Total Investments
|
| British pound | |
| 10.3 | % |
| Canadian dollar | |
| 1.1 | |
| Danish krone | |
| 1.8 | |
| Euro | |
| 9.6 | |
| Hong Kong dollar | |
| 1.4 | |
| Swedish krona | |
| 0.9 | |
| Swiss franc | |
| 5.0 | |
| U.S. dollar | |
| 69.9 | |
| Total
investments | |
| 100.0 | % |
PORTFOLIO
DIVERSIFICATION
(As
a Percentage of Total Investments)
| Sector |
|
| Communication Services |
7.5% |
| Consumer Discretionary |
7.6% |
| Consumer Staples |
2.5% |
| Energy |
1.0% |
| Financials |
5.3% |
| Health Care |
24.6% |
| Industrials |
15.3% |
| Information Technology |
27.9% |
| Materials |
1.8% |
| Real Estate |
1.1% |
| Short-Term Investment |
5.4% |

|
| Largest Holdings [Text Block] |
| Company Name | |
Country |
Percentage of
Total Net Assets
|
| Argenx SE | |
Netherlands |
4.5 | % |
| Ascendis Pharma A/S | |
Denmark |
3.6 | |
| Babcock International
Group plc | |
United Kingdom |
3.4 | |
| London Stock Exchange
Group plc | |
United Kingdom |
3.4 | |
| Tyler Technologies, Inc. | |
United States |
2.9 | |
| Guidewire Software, Inc. | |
United States |
2.5 | |
| iRhythm Technologies,
Inc. | |
United States |
2.2 | |
| Sea Ltd. | |
Singapore |
2.2 | |
| Liberty Media Corp-Liberty
Formula One | |
United States |
2.1 | |
| adidas
AG | |
Germany |
2.0 | |
| Total | |
|
28.8 | % |
| * | Excludes
short-term investments. |
|
| Material Fund Change [Text Block] |
This is a summary of certain changes of the Fund since September 30, 2024. Effective December 31, 2024,
Craigh Cepukenas stepped down as portfolio manager of the Fund. Mr. Cepukenas will remain an active
member of the Artisan Partners Growth Team in an advisory capacity as a managing director. For more
information, you may review the Fund’s current prospectus, which is available at
www.artisanpartners.com/prospectus or upon request by calling 800.344.1770.
|
| Summary of Change Legend [Text Block] |
This is a summary of certain changes of the Fund since September 30, 2024. Effective December 31, 2024,
Craigh Cepukenas stepped down as portfolio manager of the Fund. Mr. Cepukenas will remain an active
member of the Artisan Partners Growth Team in an advisory capacity as a managing director.
|
| Updated Prospectus Phone Number |
800.344.1770
|
| Updated Prospectus Web Address |
www.artisanpartners.com/prospectus
|
| Artisan Global Discovery Fund - Investor Shares |
|
| Shareholder Report [Line Items] |
|
| Fund Name |
Artisan
Global Discovery Fund
|
| Class Name |
Investor Shares
|
| Trading Symbol |
APFDX
|
| Annual or Semi-Annual Statement [Text Block] |
This
semi-annual shareholder report contains important information about Artisan Global Discovery
Fund for the period of October 1, 2024 to March 31, 2025.
|
| Shareholder Report Annual or Semi-Annual |
Semi-Annual
Shareholder Report
|
| Additional Information [Text Block] |
This
semi-annual shareholder report contains important information about Artisan Global Discovery
Fund for the period of October 1, 2024 to March 31, 2025. You can find additional information
about the Fund at www.artisanpartners.com/prospectus. You can also request this information
by contacting us at 800.344.1770. This report describes changes to the Fund that occurred
during the reporting period.
|
| Material Fund Change Notice [Text Block] |
This report describes changes to the Fund that occurred
during the reporting period.
|
| Additional Information Phone Number |
800.344.1770
|
| Additional Information Website |
www.artisanpartners.com/prospectus
|
| Expenses [Text Block] |
What
were the Fund costs for the last six months?
(based
on a hypothetical $10,000 investment)
| Class
Name |
Costs
of a $10,000 investment |
Costs
paid as a percentage of a $10,000 investment |
| Investor |
$69 |
1.39% |
| |
|
|
|
| Expenses Paid, Amount |
$ 69
|
| Expense Ratio, Percent |
1.39%
|
| Net Assets |
$ 223,291,000
|
| Holdings Count | Holdings |
62
|
| Advisory Fees Paid, Amount |
$ 1,193,000
|
| Investment Company, Portfolio Turnover |
34.96%
|
| Additional Fund Statistics [Text Block] |
| Key
Fund Statistics |
| Dollar
values in thousands |
| Net
Assets |
$223,291 |
| Number
of Portfolio Holdings |
62 |
| Total
Investment Advisory Fees (net of waivers and reimbursements) |
$1,193 |
| Portfolio
Turnover Rate |
34.96% |
|
| Holdings [Text Block] |
REGION
ALLOCATION
(As
a Percentage of Total Net Assets)
| REGION ALLOCATION |
|
| Region |
|
| Americas |
54.6% |
| Europe |
35.5% |
| Pacific Basin |
3.6% |

| TRADING CURRENCIES | |
| | |
| | |
| | |
| Currency | |
| Percentage of
Total Investments
|
| British pound | |
| 10.3 | % |
| Canadian dollar | |
| 1.1 | |
| Danish krone | |
| 1.8 | |
| Euro | |
| 9.6 | |
| Hong Kong dollar | |
| 1.4 | |
| Swedish krona | |
| 0.9 | |
| Swiss franc | |
| 5.0 | |
| U.S. dollar | |
| 69.9 | |
| Total
investments | |
| 100.0 | % |
PORTFOLIO
DIVERSIFICATION
(As
a Percentage of Total Investments)
| Sector |
|
| Communication Services |
7.5% |
| Consumer Discretionary |
7.6% |
| Consumer Staples |
2.5% |
| Energy |
1.0% |
| Financials |
5.3% |
| Health Care |
24.6% |
| Industrials |
15.3% |
| Information Technology |
27.9% |
| Materials |
1.8% |
| Real Estate |
1.1% |
| Short-Term Investment |
5.4% |

|
| Largest Holdings [Text Block] |
| Company Name | |
Country |
Percentage of
Total Net Assets
|
| Argenx SE | |
Netherlands |
4.5 | % |
| Ascendis Pharma A/S | |
Denmark |
3.6 | |
| Babcock International
Group plc | |
United Kingdom |
3.4 | |
| London Stock Exchange
Group plc | |
United Kingdom |
3.4 | |
| Tyler Technologies, Inc. | |
United States |
2.9 | |
| Guidewire Software, Inc. | |
United States |
2.5 | |
| iRhythm Technologies,
Inc. | |
United States |
2.2 | |
| Sea Ltd. | |
Singapore |
2.2 | |
| Liberty Media Corp-Liberty
Formula One | |
United States |
2.1 | |
| adidas
AG | |
Germany |
2.0 | |
| Total | |
|
28.8 | % |
| * | Excludes
short-term investments. |
|
| Material Fund Change [Text Block] |
This
is a summary of certain changes of the Fund since September 30, 2024. Effective December
31, 2024, Craigh Cepukenas stepped down as portfolio manager of the Fund. Mr. Cepukenas
will remain an active member of the Artisan Partners Growth Team in an advisory capacity
as a managing director. For more information, you may review the Fund’s current prospectus,
which is available at www.artisanpartners.com/prospectus or upon request by calling 800.344.1770.
|
| Summary of Change Legend [Text Block] |
This
is a summary of certain changes of the Fund since September 30, 2024. Effective December
31, 2024, Craigh Cepukenas stepped down as portfolio manager of the Fund. Mr. Cepukenas
will remain an active member of the Artisan Partners Growth Team in an advisory capacity
as a managing director.
|
| Updated Prospectus Phone Number |
800.344.1770
|
| Updated Prospectus Web Address |
www.artisanpartners.com/prospectus
|
| Artisan Global Equity Fund - Advisor Shares |
|
| Shareholder Report [Line Items] |
|
| Fund Name |
Artisan
Global Equity Fund
|
| Class Name |
Advisor Shares
|
| Trading Symbol |
APDHX
|
| Annual or Semi-Annual Statement [Text Block] |
This semi-annual shareholder report contains important information
about Artisan Global Equity Fund for the period of October 1, 2024
to March 31, 2025.
|
| Shareholder Report Annual or Semi-Annual |
Semi-Annual
Shareholder Report
|
| Additional Information [Text Block] |
This semi-annual shareholder report contains important information
about Artisan Global Equity Fund for the period of October 1, 2024
to March 31, 2025. You can find additional information about the Fund
at www.artisanpartners.com/prospectus. You can also request this information by contacting us at 800.344.1770.
|
| Additional Information Phone Number |
800.344.1770
|
| Additional Information Website |
www.artisanpartners.com/prospectus
|
| Expenses [Text Block] |
What
were the Fund costs for the last six months?
(based
on a hypothetical $10,000 investment)
| Class
Name |
Costs
of a $10,000 investment |
Costs
paid as a percentage of a $10,000 investment |
| Advisor |
$64 |
1.25% |
| |
|
|
|
| Expenses Paid, Amount |
$ 64
|
| Expense Ratio, Percent |
1.25%
|
| Net Assets |
$ 156,066,000
|
| Holdings Count | Holdings |
62
|
| Advisory Fees Paid, Amount |
$ 774,000
|
| Investment Company, Portfolio Turnover |
96.90%
|
| Additional Fund Statistics [Text Block] |
| Key
Fund Statistics |
| Dollar
values in thousands |
| Net
Assets |
$156,066 |
| Number
of Portfolio Holdings |
62 |
| Total
Investment Advisory Fees (net of waivers and reimbursements) |
$774 |
| Portfolio
Turnover Rate |
96.90% |
|
| Holdings [Text Block] |
REGION
ALLOCATION
(As
a Percentage of Total Net Assets)
| Region |
|
| Europe |
40.5% |
| Americas |
24.0% |
| Emerging Markets |
25.5% |
| Pacific Basin |
3.0% |

| | |
| |
| TRADING CURRENCIES | |
| | |
| | |
| | |
| Currency | |
| Percentage of
Total Investments
|
| British pound | |
| 14.8 | % |
| Chilean peso | |
| 0.7 | |
| Danish krone | |
| 1.4 | |
| Euro | |
| 24.0 | |
| Hong Kong dollar | |
| 5.0 | |
| Japanese yen | |
| 2.4 | |
| Korean won | |
| 5.3 | |
| Swiss franc | |
| 8.0 | |
| U.S. dollar | |
| 36.4 | |
| United Arab Emirates dirham | |
| 1.1 | |
| Other | |
| 0.9 | |
| Total investments | |
| 100.0 | % |
PORTFOLIO
DIVERSIFICATION
(As
a Percentage of Total Investments)
| Sector |
|
| Communication Services |
11.3% |
| Consumer Discretionary |
8.0% |
| Consumer Staples |
3.7% |
| Energy |
0.2% |
| Financials |
35.7% |
| Health Care |
3.7% |
| Industrials |
25.6% |
| Information Technology |
1.0% |
| Real Estate |
1.6% |
| Utilities |
6.2% |
| Short-Term Investment |
3.0% |
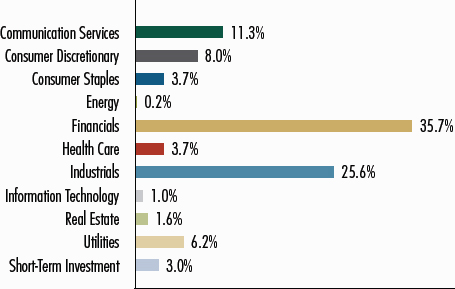
|
| Largest Holdings [Text Block] |
| Company
Name | |
Country |
Percentage of
Total Net Assets
|
| Alpha
Services and Holdings SA | |
Greece |
4.4 | % |
| National
Grid plc | |
United Kingdom |
4.0 | |
| UBS
Group AG | |
Switzerland |
3.8 | |
| Kuaishou
Technology | |
China |
3.4 | |
| BFF
Bank SpA | |
Italy |
3.3 | |
| RTX
Corp. | |
United
States |
3.3 | |
| Babcock
International Group plc | |
United
Kingdom |
3.3 | |
| Visa,
Inc. | |
United
States |
2.8 | |
| Hanwha
Aerospace Co. Ltd. | |
South
Korea |
2.7 | |
| Arthur
J Gallagher & Co. | |
United
States |
2.6 | |
| Total | |
|
33.6 | % |
| * | Excludes
short-term investments. |
|
| Artisan Global Equity Fund - Institutional Shares |
|
| Shareholder Report [Line Items] |
|
| Fund Name |
Artisan
Global Equity Fund
|
| Class Name |
Institutional Shares
|
| Trading Symbol |
APHHX
|
| Annual or Semi-Annual Statement [Text Block] |
This semi-annual shareholder report contains important information
about Artisan Global Equity Fund for the period of October 1, 2024
to March 31, 2025.
|
| Shareholder Report Annual or Semi-Annual |
Semi-Annual
Shareholder Report
|
| Additional Information [Text Block] |
This semi-annual shareholder report contains important information
about Artisan Global Equity Fund for the period of October 1, 2024
to March 31, 2025. You can find additional information about the Fund
at www.artisanpartners.com/prospectus. You can also request this information by contacting us at 800.344.1770.
|
| Additional Information Phone Number |
800.344.1770
|
| Additional Information Website |
www.artisanpartners.com/prospectus
|
| Expenses [Text Block] |
What
were the Fund costs for the last six months?
(based
on a hypothetical $10,000 investment)
| Class
Name |
Costs
of a $10,000 investment |
Costs
paid as a percentage of a $10,000 investment |
| Institutional |
$56 |
1.09% |
| |
|
|
|
| Expenses Paid, Amount |
$ 56
|
| Expense Ratio, Percent |
1.09%
|
| Net Assets |
$ 156,066,000
|
| Holdings Count | Holdings |
62
|
| Advisory Fees Paid, Amount |
$ 774,000
|
| Investment Company, Portfolio Turnover |
96.90%
|
| Additional Fund Statistics [Text Block] |
| Key
Fund Statistics |
| Dollar
values in thousands |
| Net
Assets |
$156,066 |
| Number
of Portfolio Holdings |
62 |
| Total
Investment Advisory Fees (net of waivers and reimbursements) |
$774 |
| Portfolio
Turnover Rate |
96.90% |
|
| Holdings [Text Block] |
REGION
ALLOCATION
(As
a Percentage of Total Net Assets)
| Region |
|
| Europe |
40.5% |
| Americas |
24.0% |
| Emerging Markets |
25.5% |
| Pacific Basin |
3.0% |
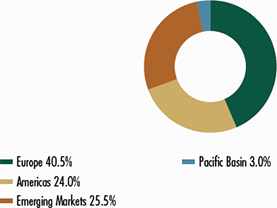
| | |
| |
| TRADING CURRENCIES | |
| | |
| | |
| | |
| Currency | |
| Percentage
of
Total
Investments
|
| British pound | |
| 14.8 | % |
| Chilean peso | |
| 0.7 | |
| Danish krone | |
| 1.4 | |
| Euro | |
| 24.0 | |
| Hong Kong dollar | |
| 5.0 | |
| Japanese yen | |
| 2.4 | |
| Korean won | |
| 5.3 | |
| Swiss franc | |
| 8.0 | |
| U.S. dollar | |
| 36.4 | |
| United Arab Emirates dirham | |
| 1.1 | |
| Other | |
| 0.9 | |
| Total
investments | |
| 100.0 | % |
PORTFOLIO
DIVERSIFICATION
(As
a Percentage of Total Investments)
| Sector |
|
| Communication Services |
11.3% |
| Consumer Discretionary |
8.0% |
| Consumer Staples |
3.7% |
| Energy |
0.2% |
| Financials |
35.7% |
| Health Care |
3.7% |
| Industrials |
25.6% |
| Information Technology |
1.0% |
| Real Estate |
1.6% |
| Utilities |
6.2% |
| Short-Term Investment |
3.0% |
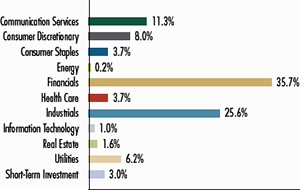
|
| Largest Holdings [Text Block] |
| | |
|
| |
| Company
Name | |
Country |
Percentage of
Total Net Assets
|
| Alpha
Services and Holdings SA | |
Greece |
4.4 | % |
| National
Grid plc | |
United Kingdom |
4.0 | |
| UBS
Group AG | |
Switzerland |
3.8 | |
| Kuaishou
Technology | |
China |
3.4 | |
| BFF
Bank SpA | |
Italy |
3.3 | |
| RTX
Corp. | |
United
States |
3.3 | |
| Babcock
International Group plc | |
United Kingdom |
3.3 | |
| Visa,
Inc. | |
United
States |
2.8 | |
| Hanwha
Aerospace Co. Ltd. | |
South
Korea |
2.7 | |
| Arthur
J Gallagher & Co. | |
United
States |
2.6 | |
| Total | |
|
33.6 | % |
| * | Excludes
short-term investments. |
|
| Artisan Global Equity Fund - Investor Shares |
|
| Shareholder Report [Line Items] |
|
| Fund Name |
Artisan
Global Equity Fund
|
| Class Name |
Investor Shares
|
| Trading Symbol |
ARTHX
|
| Annual or Semi-Annual Statement [Text Block] |
This semi-annual shareholder report contains important information
about Artisan Global Equity Fund for the period of October 1, 2024
to March 31, 2025.
|
| Shareholder Report Annual or Semi-Annual |
Semi-Annual
Shareholder Report
|
| Additional Information [Text Block] |
This semi-annual shareholder report contains important information
about Artisan Global Equity Fund for the period of October 1, 2024
to March 31, 2025. You can find additional information about the Fund
at www.artisanpartners.com/prospectus. You can also request this information by contacting us at 800.344.1770.
|
| Additional Information Phone Number |
800.344.1770
|
| Additional Information Website |
www.artisanpartners.com/prospectus
|
| Expenses [Text Block] |
What
were the Fund costs for the last six months?
(based
on a hypothetical $10,000 investment)
| Class
Name |
Costs
of a $10,000 investment |
Costs
paid as a percentage of a $10,000 investment |
| Investor |
$69 |
1.35% |
| |
|
|
|
| Expenses Paid, Amount |
$ 69
|
| Expense Ratio, Percent |
1.35%
|
| Net Assets |
$ 156,066,000
|
| Holdings Count | Holdings |
62
|
| Advisory Fees Paid, Amount |
$ 774,000
|
| Investment Company, Portfolio Turnover |
96.90%
|
| Additional Fund Statistics [Text Block] |
| Key
Fund Statistics |
| Dollar
values in thousands |
| Net
Assets |
$156,066 |
| Number
of Portfolio Holdings |
62 |
| Total
Investment Advisory Fees (net of waivers and reimbursements) |
$774 |
| Portfolio
Turnover Rate |
96.90% |
|
| Holdings [Text Block] |
REGION
ALLOCATION
(As
a Percentage of Total Net Assets)
| Region |
|
| Europe |
40.5% |
| Americas |
24.0% |
| Emerging Markets |
25.5% |
| Pacific Basin |
3.0% |
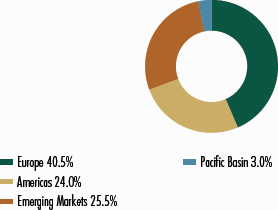
| | |
| |
| TRADING CURRENCIES | |
| | |
| | |
| | |
| Currency | |
| Percentage
of
Total
Investments
|
| British pound | |
| 14.8 | % |
| Chilean peso | |
| 0.7 | |
| Danish krone | |
| 1.4 | |
| Euro | |
| 24.0 | |
| Hong Kong dollar | |
| 5.0 | |
| Japanese yen | |
| 2.4 | |
| Korean won | |
| 5.3 | |
| Swiss franc | |
| 8.0 | |
| U.S. dollar | |
| 36.4 | |
| United Arab Emirates dirham | |
| 1.1 | |
| Other | |
| 0.9 | |
| Total
investments | |
| 100.0 | % |
PORTFOLIO
DIVERSIFICATION
(As
a Percentage of Total Investments)
| Sector |
|
| Communication Services |
11.3% |
| Consumer Discretionary |
8.0% |
| Consumer Staples |
3.7% |
| Energy |
0.2% |
| Financials |
35.7% |
| Health Care |
3.7% |
| Industrials |
25.6% |
| Information Technology |
1.0% |
| Real Estate |
1.6% |
| Utilities |
6.2% |
| Short-Term Investment |
3.0% |
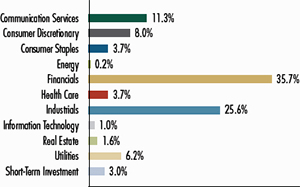
|
| Largest Holdings [Text Block] |
| | |
|
| |
| Company
Name | |
Country |
Percentage of
Total Net Assets
|
| Alpha
Services and Holdings SA | |
Greece |
4.4 | % |
| National
Grid plc | |
United Kingdom |
4.0 | |
| UBS
Group AG | |
Switzerland |
3.8 | |
| Kuaishou
Technology | |
China |
3.4 | |
| BFF
Bank SpA | |
Italy |
3.3 | |
| RTX
Corp. | |
United States |
3.3 | |
| Babcock
International Group plc | |
United Kingdom |
3.3 | |
| Visa,
Inc. | |
United States |
2.8 | |
| Hanwha
Aerospace Co. Ltd. | |
South Korea |
2.7 | |
| Arthur
J Gallagher & Co. | |
United States |
2.6 | |
| Total | |
|
33.6 | % |
| * | Excludes
short-term investments. |
|
| Artisan Global Opportunities Fund - Advisor Shares |
|
| Shareholder Report [Line Items] |
|
| Fund Name |
Artisan Global Opportunities Fund
|
| Class Name |
Advisor Shares
|
| Trading Symbol |
APDRX
|
| Annual or Semi-Annual Statement [Text Block] |
This
semi-annual shareholder report contains important information about Artisan Global Opportunities
Fund for the period of October 1, 2024 to March 31, 2025.
|
| Shareholder Report Annual or Semi-Annual |
Semi-Annual
Shareholder Report
|
| Additional Information [Text Block] |
This
semi-annual shareholder report contains important information about Artisan Global Opportunities
Fund for the period of October 1, 2024 to March 31, 2025. You can find additional information
about the Fund at www.artisanpartners.com/prospectus. You can also request this information
by contacting us at 800.344.1770. This report describes changes to the Fund that occurred
during the reporting period.
|
| Material Fund Change Notice [Text Block] |
This report describes changes to the Fund that occurred
during the reporting period.
|
| Additional Information Phone Number |
800.344.1770
|
| Additional Information Website |
www.artisanpartners.com/prospectus
|
| Expenses [Text Block] |
What
were the Fund costs for the last six months?
(based
on a hypothetical $10,000 investment)
| Class
Name |
Costs
of a $10,000 investment |
Costs
paid as a percentage of a $10,000 investment |
| Advisor |
$52 |
1.06% |
| |
|
|
|
| Expenses Paid, Amount |
$ 52
|
| Expense Ratio, Percent |
1.06%
|
| Net Assets |
$ 2,009,024,000
|
| Holdings Count | Holdings |
47
|
| Advisory Fees Paid, Amount |
$ 10,529,000
|
| Investment Company, Portfolio Turnover |
36.83%
|
| Additional Fund Statistics [Text Block] |
| Key
Fund Statistics |
| Dollar
values in thousands |
| Net
Assets |
$2,009,024 |
| Number
of Portfolio Holdings |
47 |
| Total
Investment Advisory Fees (net of waivers and reimbursements) |
$10,529 |
| Portfolio
Turnover Rate |
36.83% |
|
| Holdings [Text Block] |
REGION
ALLOCATION
(As
a Percentage of Total Net Assets)
| REGION ALLOCATION |
|
| Region |
|
| Americas |
54.4% |
| Europe |
27.9% |
| Emerging Markets |
7.5% |
| Pacific Basin |
5.8% |

| TRADING
CURRENCIES | |
| | |
| | |
| | |
| Currency | |
| Percentage of
Total Investments |
| British pound | |
| 16.0 | % |
| Danish krone | |
| 0.7 | |
| Euro | |
| 3.8 | |
| Hong
Kong dollar | |
| 8.1 | |
| Japanese yen | |
| 1.8 | |
| Swiss franc | |
| 3.5 | |
| U.S.
dollar | |
| 66.1 | |
| Total
investments | |
| 100.0 | % |
PORTFOLIO
DIVERSIFICATION
(As
a Percentage of Total Investments)
| Sector |
|
| Communication Services |
11.6% |
| Consumer Discretionary |
8.7% |
| Consumer Staples |
2.0% |
| Energy |
3.6% |
| Financials |
7.5% |
| Health Care |
22.3% |
| Industrials |
14.3% |
| Information Technology |
22.1% |
| Materials |
3.3% |
| Real Estate |
1.9% |
| Short-Term Investment |
2.7% |
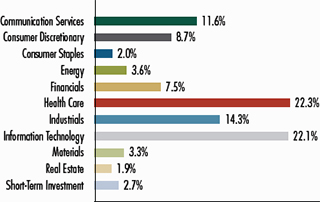
|
| Largest Holdings [Text Block] |
| Company Name | |
Country |
Percentage of
Total Net Assets
|
| Netflix, Inc. | |
United States |
| 5.6 | % |
| Boston Scientific Corp. | |
United States |
| 4.7 | |
| London Stock Exchange
Group plc | |
United Kingdom |
| 4.2 | |
| Argenx SE | |
Netherlands |
| 4.2 | |
| Tencent Holdings Ltd. | |
China |
| 4.2 | |
| Lonza Group AG | |
Switzerland |
| 3.5 | |
| Amazon.com, Inc. | |
United States |
| 3.0 | |
| BAE Systems plc | |
United Kingdom |
| 2.9 | |
| AstraZeneca plc | |
United Kingdom |
| 2.8 | |
| Apple,
Inc. | |
United
States |
| 2.7 | |
| Total | |
|
| 37.8 | % |
| * | Excludes
short-term investments. |
|
| Material Fund Change [Text Block] |
This is a summary of certain changes of the Fund since September 30, 2024. Effective December 31, 2024,
Craigh Cepukenas stepped down as portfolio manager of the Fund. Mr. Cepukenas will remain an active
member of the Artisan Partners Growth Team in an advisory capacity as a managing director. For more
information, you may review the Fund’s current prospectus, which is available at
www.artisanpartners.com/prospectus or upon request by calling 800.344.1770.
|
| Summary of Change Legend [Text Block] |
This is a summary of certain changes of the Fund since September 30, 2024. Effective December 31, 2024,
Craigh Cepukenas stepped down as portfolio manager of the Fund. Mr. Cepukenas will remain an active
member of the Artisan Partners Growth Team in an advisory capacity as a managing director.
|
| Updated Prospectus Phone Number |
800.344.1770
|
| Updated Prospectus Web Address |
www.artisanpartners.com/prospectus
|
| Artisan Global Opportunities Fund - Institutional Shares |
|
| Shareholder Report [Line Items] |
|
| Fund Name |
Artisan Global Opportunities Fund
|
| Class Name |
Institutional Shares
|
| Trading Symbol |
APHRX
|
| Annual or Semi-Annual Statement [Text Block] |
This
semi-annual shareholder report contains important information about Artisan Global Opportunities
Fund for the period of October 1, 2024 to March 31, 2025.
|
| Shareholder Report Annual or Semi-Annual |
Semi-Annual
Shareholder Report
|
| Additional Information [Text Block] |
This
semi-annual shareholder report contains important information about Artisan Global Opportunities
Fund for the period of October 1, 2024 to March 31, 2025. You can find additional information
about the Fund at www.artisanpartners.com/prospectus. You can also request this information
by contacting us at 800.344.1770. This report describes changes to the Fund that occurred
during the reporting period.
|
| Material Fund Change Notice [Text Block] |
This report describes changes to the Fund that occurred
during the reporting period.
|
| Additional Information Phone Number |
800.344.1770
|
| Additional Information Website |
www.artisanpartners.com/prospectus
|
| Expenses [Text Block] |
What
were the Fund costs for the last six months?
(based
on a hypothetical $10,000 investment)
| Class
Name |
Costs
of a $10,000 investment |
Costs
paid as a percentage of a $10,000 investment |
| Institutional |
$46 |
0.95% |
| |
|
|
|
| Expenses Paid, Amount |
$ 46
|
| Expense Ratio, Percent |
0.95%
|
| Net Assets |
$ 2,009,024,000
|
| Holdings Count | Holdings |
47
|
| Advisory Fees Paid, Amount |
$ 10,529,000
|
| Investment Company, Portfolio Turnover |
36.83%
|
| Additional Fund Statistics [Text Block] |
| Key
Fund Statistics |
| Dollar
values in thousands |
| Net
Assets |
$2,009,024 |
| Number
of Portfolio Holdings |
47 |
| Total
Investment Advisory Fees (net of waivers and reimbursements) |
$10,529 |
| Portfolio
Turnover Rate |
36.83% |
|
| Holdings [Text Block] |
REGION
ALLOCATION
(As
a Percentage of Total Net Assets)
| REGION ALLOCATION |
|
| Region |
|
| Americas |
54.4% |
| Europe |
27.9% |
| Emerging Markets |
7.5% |
| Pacific Basin |
5.8% |

| TRADING
CURRENCIES | |
| | |
| | |
| | |
| Currency | |
| Percentage of
Total Investments |
| British pound | |
| 16.0 | % |
| Danish krone | |
| 0.7 | |
| Euro | |
| 3.8 | |
| Hong
Kong dollar | |
| 8.1 | |
| Japanese yen | |
| 1.8 | |
| Swiss franc | |
| 3.5 | |
| U.S.
dollar | |
| 66.1 | |
| Total
investments | |
| 100.0 | % |
PORTFOLIO
DIVERSIFICATION
(As
a Percentage of Total Investments)
| Sector |
|
| Communication Services |
11.6% |
| Consumer Discretionary |
8.7% |
| Consumer Staples |
2.0% |
| Energy |
3.6% |
| Financials |
7.5% |
| Health Care |
22.3% |
| Industrials |
14.3% |
| Information Technology |
22.1% |
| Materials |
3.3% |
| Real Estate |
1.9% |
| Short-Term Investment |
2.7% |

|
| Largest Holdings [Text Block] |
| Company Name | |
Country |
Percentage of
Total Net Assets
|
| Netflix, Inc. | |
United States |
| 5.6 | % |
| Boston Scientific Corp. | |
United States |
| 4.7 | |
| London Stock Exchange
Group plc | |
United Kingdom |
| 4.2 | |
| Argenx SE | |
Netherlands |
| 4.2 | |
| Tencent Holdings Ltd. | |
China |
| 4.2 | |
| Lonza Group AG | |
Switzerland |
| 3.5 | |
| Amazon.com, Inc. | |
United States |
| 3.0 | |
| BAE Systems plc | |
United Kingdom |
| 2.9 | |
| AstraZeneca plc | |
United Kingdom |
| 2.8 | |
| Apple,
Inc. | |
United
States |
| 2.7 | |
| Total | |
|
| 37.8 | % |
| * | Excludes
short-term investments. |
|
| Material Fund Change [Text Block] |
This is a summary of certain changes of the Fund since September 30, 2024. Effective December 31, 2024,
Craigh Cepukenas stepped down as portfolio manager of the Fund. Mr. Cepukenas will remain an active
member of the Artisan Partners Growth Team in an advisory capacity as a managing director. For more
information, you may review the Fund’s current prospectus, which is available at
www.artisanpartners.com/prospectus or upon request by calling 800.344.1770.
|
| Summary of Change Legend [Text Block] |
This is a summary of certain changes of the Fund since September 30, 2024. Effective December 31, 2024,
Craigh Cepukenas stepped down as portfolio manager of the Fund. Mr. Cepukenas will remain an active
member of the Artisan Partners Growth Team in an advisory capacity as a managing director.
|
| Updated Prospectus Phone Number |
800.344.1770
|
| Updated Prospectus Web Address |
www.artisanpartners.com/prospectus
|
| Artisan Global Opportunities Fund - Investor Shares |
|
| Shareholder Report [Line Items] |
|
| Fund Name |
Artisan Global Opportunities Fund
|
| Class Name |
Investor Shares
|
| Trading Symbol |
ARTRX
|
| Annual or Semi-Annual Statement [Text Block] |
This
semi-annual shareholder report contains important information about Artisan Global Opportunities
Fund for the period of October 1, 2024 to March 31, 2025.
|
| Shareholder Report Annual or Semi-Annual |
Semi-Annual
Shareholder Report
|
| Additional Information [Text Block] |
This
semi-annual shareholder report contains important information about Artisan Global Opportunities
Fund for the period of October 1, 2024 to March 31, 2025. You can find additional information
about the Fund at www.artisanpartners.com/prospectus. You can also request this information
by contacting us at 800.344.1770. This report describes changes to the Fund that occurred
during the reporting period.
|
| Material Fund Change Notice [Text Block] |
This report describes changes to the Fund that occurred
during the reporting period.
|
| Additional Information Phone Number |
800.344.1770
|
| Additional Information Website |
www.artisanpartners.com/prospectus
|
| Expenses [Text Block] |
What
were the Fund costs for the last six months?
(based
on a hypothetical $10,000 investment)
| Class
Name |
Costs
of a $10,000 investment |
Costs
paid as a percentage of a $10,000 investment |
| Investor |
$58 |
1.19% |
| |
|
|
|
| Expenses Paid, Amount |
$ 58
|
| Expense Ratio, Percent |
1.19%
|
| Net Assets |
$ 2,009,024,000
|
| Holdings Count | Holdings |
47
|
| Advisory Fees Paid, Amount |
$ 10,529,000
|
| Investment Company, Portfolio Turnover |
36.83%
|
| Additional Fund Statistics [Text Block] |
| Key
Fund Statistics |
| Dollar
values in thousands |
| Net
Assets |
$2,009,024 |
| Number
of Portfolio Holdings |
47 |
| Total
Investment Advisory Fees (net of waivers and reimbursements) |
$10,529 |
| Portfolio
Turnover Rate |
36.83% |
|
| Holdings [Text Block] |
REGION
ALLOCATION
(As
a Percentage of Total Net Assets)
| REGION ALLOCATION |
|
| Region |
|
| Americas |
54.4% |
| Europe |
27.9% |
| Emerging Markets |
7.5% |
| Pacific Basin |
5.8% |
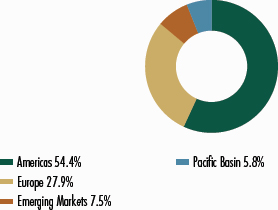
| TRADING
CURRENCIES | |
| | |
| | |
| | |
| Currency | |
| Percentage of
Total Investments |
| British pound | |
| 16.0 | % |
| Danish krone | |
| 0.7 | |
| Euro | |
| 3.8 | |
| Hong
Kong dollar | |
| 8.1 | |
| Japanese yen | |
| 1.8 | |
| Swiss franc | |
| 3.5 | |
| U.S.
dollar | |
| 66.1 | |
| Total
investments | |
| 100.0 | % |
PORTFOLIO
DIVERSIFICATION
(As
a Percentage of Total Investments)
| Sector |
|
| Communication Services |
11.6% |
| Consumer Discretionary |
8.7% |
| Consumer Staples |
2.0% |
| Energy |
3.6% |
| Financials |
7.5% |
| Health Care |
22.3% |
| Industrials |
14.3% |
| Information Technology |
22.1% |
| Materials |
3.3% |
| Real Estate |
1.9% |
| Short-Term Investment |
2.7% |
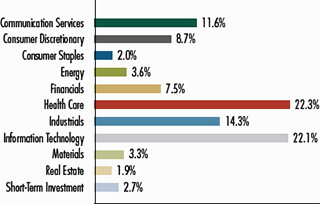
|
| Largest Holdings [Text Block] |
| Company Name | |
Country |
Percentage of
Total Net Assets
|
| Netflix, Inc. | |
United States |
| 5.6 | % |
| Boston Scientific Corp. | |
United States |
| 4.7 | |
| London Stock Exchange
Group plc | |
United Kingdom |
| 4.2 | |
| Argenx SE | |
Netherlands |
| 4.2 | |
| Tencent Holdings Ltd. | |
China |
| 4.2 | |
| Lonza Group AG | |
Switzerland |
| 3.5 | |
| Amazon.com, Inc. | |
United States |
| 3.0 | |
| BAE Systems plc | |
United Kingdom |
| 2.9 | |
| AstraZeneca plc | |
United Kingdom |
| 2.8 | |
| Apple,
Inc. | |
United
States |
| 2.7 | |
| Total | |
|
| 37.8 | % |
| * | Excludes
short-term investments. |
|
| Material Fund Change [Text Block] |
This is a summary of certain changes of the Fund since September 30, 2024. Effective December 31, 2024,
Craigh Cepukenas stepped down as portfolio manager of the Fund. Mr. Cepukenas will remain an active
member of the Artisan Partners Growth Team in an advisory capacity as a managing director. For more
information, you may review the Fund’s current prospectus, which is available at
www.artisanpartners.com/prospectus or upon request by calling 800.344.1770.
|
| Summary of Change Legend [Text Block] |
This is a summary of certain changes of the Fund since September 30, 2024. Effective December 31, 2024,
Craigh Cepukenas stepped down as portfolio manager of the Fund. Mr. Cepukenas will remain an active
member of the Artisan Partners Growth Team in an advisory capacity as a managing director.
|
| Updated Prospectus Phone Number |
800.344.1770
|
| Updated Prospectus Web Address |
www.artisanpartners.com/prospectus
|
| Artisan Global Unconstrained Fund - Advisor Shares |
|
| Shareholder Report [Line Items] |
|
| Fund Name |
Artisan
Global Unconstrained Fund
|
| Class Name |
Advisor Shares
|
| Trading Symbol |
APDPX
|
| Annual or Semi-Annual Statement [Text Block] |
This
semi-annual shareholder report contains important information about Artisan Global Unconstrained
Fund for the period of October 1, 2024 to March 31, 2025.
|
| Shareholder Report Annual or Semi-Annual |
Semi-Annual
Shareholder Report
|
| Additional Information [Text Block] |
This
semi-annual shareholder report contains important information about Artisan Global Unconstrained
Fund for the period of October 1, 2024 to March 31, 2025. You can find additional information
about the Fund at www.artisanpartners.com/prospectus. You can also request this information
by contacting us at 800.344.1770. This report describes changes to the Fund that occurred
during the reporting period.
|
| Material Fund Change Notice [Text Block] |
This report describes changes to the Fund that occurred
during the reporting period.
|
| Additional Information Phone Number |
800.344.1770
|
| Additional Information Website |
www.artisanpartners.com/prospectus
|
| Expenses [Text Block] |
What
were the Fund costs for the last six months?
(based on a hypothetical $10,000 investment)
| Class
Name |
Costs
of a $10,000 investment |
Costs
paid as a percentage of a $10,000 investment |
| Advisor |
$79 |
1.54% |
| |
|
|
|
| Expenses Paid, Amount |
$ 79
|
| Expense Ratio, Percent |
1.54%
|
| Net Assets |
$ 300,225,000
|
| Holdings Count | Holdings |
425
|
| Advisory Fees Paid, Amount |
$ 514,000
|
| Investment Company, Portfolio Turnover |
32.63%
|
| Additional Fund Statistics [Text Block] |
| Key
Fund Statistics |
| Dollar
values in thousands |
| Net
Assets |
$300,225 |
| Number
of Portfolio Holdings |
425 |
| Total
Investment Advisory Fees (net of waivers and reimbursements) |
$514 |
| Portfolio
Turnover Rate |
32.63% |
|
| Holdings [Text Block] |
PORTFOLIO
COMPOSITION
(As
a Percentage of Total Net Assets)
| PORTFOLIO COMPOSITION |
|
| Type |
|
| Sovereign Government Bonds |
40.4% |
| Corporate Bonds |
12.8% |
| Common Stocks |
3.6% |
| Bank Loans |
2.9% |
| Closed End Fund |
0.2% |
| Convertible Bond |
0.1% |
| Other assets less liabilities |
40.0% |
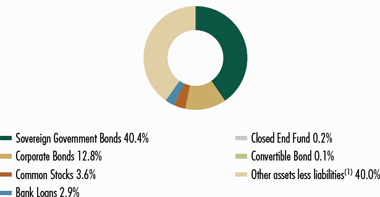
| (1) | Includes
any short-term investments and net other assets (liabilities). |
| * | Portfolio
composition is net of positions held short. |
| TRADING
CURRENCIES | |
| | |
| | |
| | |
| Currency | |
| Percentage of
Total Investments |
| Albanian lek | |
| 2.1 | % |
| Dominican peso | |
| 2.5 | |
| Egyptian pound | |
| 7.2 | |
| Euro | |
| 9.0 | |
| Iceland krona | |
| 6.1 | |
| Indonesian rupiah | |
| 1.7 | |
| Nigerian naira | |
| 4.2 | |
| Peruvian nuevo sol | |
| 4.5 | |
| U.S. dollar | |
| 57.5 | |
| Uzbekistani som | |
| 1.7 | |
| Other | |
| 3.5 | |
| Total
investments | |
| 100.0 | % |
PORTFOLIO
DIVERSIFICATION*
(As
a Percentage of Total Investments)
| Sector |
|
| Communication Services |
0.6% |
| Consumer Staples |
0.9% |
| Energy |
6.9% |
| Financials |
5.7% |
| Industrials |
1.0% |
| Investment Funds |
(1.0)% |
| Materials |
4.5% |
| Mutual Funds |
0.2% |
| Sovereign Government Securities |
43.5% |
| Utilities |
1.2% |
| Short-Term Investments |
36.5% |
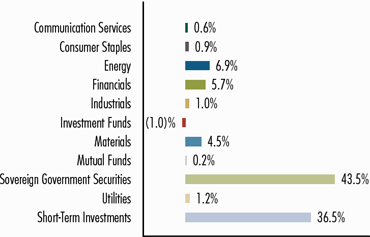
| * | Portfolio
diversification is net of positions held short. |
|
| Largest Holdings [Text Block] |
| TOP
TEN HOLDINGS* | |
|
| |
| | |
|
| |
| Company
Name | |
Country |
Percentage of
Total Net Assets |
| Commonwealth of the Bahamas | |
Bahamas |
4.8 | % |
| Bonos de la Tesoreria | |
Peru |
4.2 | |
| Republic of Iceland | |
Iceland |
3.8 | |
| Republic of Iraq | |
Iraq |
3.3 | |
| Benin Government Bond | |
Benin |
2.9 | |
| Federal Republic of Nigeria | |
Nigeria |
2.4 | |
| Banco Central de la Republica Dominicana, GDN | |
Dominican Republic |
2.3 | |
| Aris Mining Corp. | |
Colombia |
2.0 | |
| Ukraine Government Bond | |
Ukraine |
1.9 | |
| Republic of Uzbekistan International Bond | |
Uzbekistan |
1.6 | |
| Total | |
|
29.2 | % |
| * | Excludes
short-term investments. |
|
| Material Fund Change [Text Block] |
This
is a summary of certain changes of the Fund since September 30, 2024. On January 2, 2025,
the fair value methodology used to value emerging markets debt, as determined by a third
party vendor, held by the Fund was changed from using bid pricing to using the midpoint
between the bid and ask price. The change resulted in a one-time increase of less than
0.35% in the net asset value for the Fund. Effective March 14, 2025, the Fund's 2% redemption
fee was eliminated. For more information, you may review the Fund's current prospectus,
which is available at www.artisanpartners.com/prospectus or upon request by calling 800.344.1770.
|
| Summary of Change Legend [Text Block] |
This
is a summary of certain changes of the Fund since September 30, 2024. On January 2, 2025,
the fair value methodology used to value emerging markets debt, as determined by a third
party vendor, held by the Fund was changed from using bid pricing to using the midpoint
between the bid and ask price. The change resulted in a one-time increase of less than
0.35% in the net asset value for the Fund. Effective March 14, 2025, the Fund's 2% redemption
fee was eliminated.
|
| Updated Prospectus Phone Number |
800.344.1770
|
| Updated Prospectus Web Address |
www.artisanpartners.com/prospectus
|
| Artisan Global Unconstrained Fund - Institutional Shares |
|
| Shareholder Report [Line Items] |
|
| Fund Name |
Artisan
Global Unconstrained Fund
|
| Class Name |
Institutional Shares
|
| Trading Symbol |
APHPX
|
| Annual or Semi-Annual Statement [Text Block] |
This
semi-annual shareholder report contains important information about Artisan Global Unconstrained
Fund for the period of October 1, 2024 to March 31, 2025.
|
| Shareholder Report Annual or Semi-Annual |
Semi-Annual
Shareholder Report
|
| Additional Information [Text Block] |
This
semi-annual shareholder report contains important information about Artisan Global Unconstrained
Fund for the period of October 1, 2024 to March 31, 2025. You can find additional information
about the Fund at www.artisanpartners.com/prospectus. You can also request this information
by contacting us at 800.344.1770. This report describes changes to the Fund that occurred
during the reporting period.
|
| Material Fund Change Notice [Text Block] |
This report describes changes to the Fund that occurred
during the reporting period.
|
| Additional Information Phone Number |
800.344.1770
|
| Additional Information Website |
www.artisanpartners.com/
|
| Expenses [Text Block] |
What
were the Fund costs for the last six months?
(based on a hypothetical $10,000 investment)
| Class
Name |
Costs
of a $10,000 investment |
Costs
paid as a percentage of a $10,000 investment |
| Institutional |
$77 |
1.50% |
| |
|
|
|
| Expenses Paid, Amount |
$ 77
|
| Expense Ratio, Percent |
1.50%
|
| Net Assets |
$ 300,225,000
|
| Holdings Count | Holdings |
425
|
| Advisory Fees Paid, Amount |
$ 514,000
|
| Investment Company, Portfolio Turnover |
32.63%
|
| Additional Fund Statistics [Text Block] |
| Key
Fund Statistics |
| Dollar
values in thousands |
| Net
Assets |
$300,225 |
| Number
of Portfolio Holdings |
425 |
| Total
Investment Advisory Fees (net of waivers and reimbursements) |
$514 |
| Portfolio
Turnover Rate |
32.63% |
|
| Holdings [Text Block] |
PORTFOLIO
COMPOSITION
(As
a Percentage of Total Net Assets)
| PORTFOLIO COMPOSITION |
|
| Type |
|
| Sovereign Government Bonds |
40.4% |
| Corporate Bonds |
12.8% |
| Common Stocks |
3.6% |
| Bank Loans |
2.9% |
| Closed End Fund |
0.2% |
| Convertible Bond |
0.1% |
| Other assets less liabilities |
40.0% |
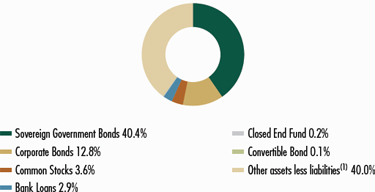
| (1) | Includes
any short-term investments and net other assets (liabilities). |
| * | Portfolio
composition is net of positions held short. |
| TRADING
CURRENCIES | |
| | |
| | |
| | |
| Currency | |
| Percentage of
Total Investments |
| Albanian lek | |
| 2.1 | % |
| Dominican peso | |
| 2.5 | |
| Egyptian pound | |
| 7.2 | |
| Euro | |
| 9.0 | |
| Iceland krona | |
| 6.1 | |
| Indonesian rupiah | |
| 1.7 | |
| Nigerian naira | |
| 4.2 | |
| Peruvian nuevo sol | |
| 4.5 | |
| U.S. dollar | |
| 57.5 | |
| Uzbekistani som | |
| 1.7 | |
| Other | |
| 3.5 | |
| Total
investments | |
| 100.0 | % |
PORTFOLIO
DIVERSIFICATION*
(As
a Percentage of Total Investments)
| Sector |
|
| Communication Services |
0.6% |
| Consumer Staples |
0.9% |
| Energy |
6.9% |
| Financials |
5.7% |
| Industrials |
1.0% |
| Investment Funds |
(1.0)% |
| Materials |
4.5% |
| Mutual Funds |
0.2% |
| Sovereign Government Securities |
43.5% |
| Utilities |
1.2% |
| Short-Term Investments |
36.5% |
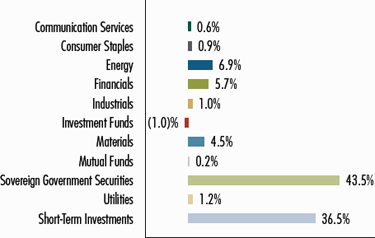
| * | Portfolio
diversification is net of positions held short. |
|
| Largest Holdings [Text Block] |
| TOP
TEN HOLDINGS* | |
|
| |
| | |
|
| |
| Company
Name | |
Country |
Percentage of
Total Net Assets |
| Commonwealth of the Bahamas | |
Bahamas |
4.8 | % |
| Bonos de la Tesoreria | |
Peru |
4.2 | |
| Republic of Iceland | |
Iceland |
3.8 | |
| Republic of Iraq | |
Iraq |
3.3 | |
| Benin Government Bond | |
Benin |
2.9 | |
| Federal Republic of Nigeria | |
Nigeria |
2.4 | |
| Banco Central de la Republica Dominicana, GDN | |
Dominican Republic |
2.3 | |
| Aris Mining Corp. | |
Colombia |
2.0 | |
| Ukraine Government Bond | |
Ukraine |
1.9 | |
| Republic of Uzbekistan International Bond | |
Uzbekistan |
1.6 | |
| Total | |
|
29.2 | % |
| * | Excludes
short-term investments. |
|
| Material Fund Change [Text Block] |
This
is a summary of certain changes of the Fund since September 30, 2024. On January 2, 2025,
the fair value methodology used to value emerging markets debt, as determined by a third
party vendor, held by the Fund was changed from using bid pricing to using the midpoint
between the bid and ask price. The change resulted in a one-time increase of less than
0.35% in the net asset value for the Fund. Effective March 14, 2025, the Fund's 2% redemption
fee was eliminated. For more information, you may review the Fund's current prospectus,
which is available at www.artisanpartners.com/prospectus or upon request by calling 800.344.1770.
|
| Summary of Change Legend [Text Block] |
This
is a summary of certain changes of the Fund since September 30, 2024. On January 2, 2025,
the fair value methodology used to value emerging markets debt, as determined by a third
party vendor, held by the Fund was changed from using bid pricing to using the midpoint
between the bid and ask price. The change resulted in a one-time increase of less than
0.35% in the net asset value for the Fund. Effective March 14, 2025, the Fund's 2% redemption
fee was eliminated.
|
| Updated Prospectus Phone Number |
800.344.1770
|
| Updated Prospectus Web Address |
www.artisanpartners.com/prospectus
|
| Artisan Global Unconstrained Fund - Investor Shares |
|
| Shareholder Report [Line Items] |
|
| Fund Name |
Artisan
Global Unconstrained Fund
|
| Class Name |
Investor Shares
|
| Trading Symbol |
APFPX
|
| Annual or Semi-Annual Statement [Text Block] |
This
semi-annual shareholder report contains important information about Artisan Global Unconstrained
Fund for the period of October 1, 2024 to March 31, 2025.
|
| Shareholder Report Annual or Semi-Annual |
Semi-Annual
Shareholder Report
|
| Additional Information [Text Block] |
This
semi-annual shareholder report contains important information about Artisan Global Unconstrained
Fund for the period of October 1, 2024 to March 31, 2025. You can find additional information
about the Fund at www.artisanpartners.com/prospectus. You can also request this information
by contacting us at 800.344.1770. This report describes changes to the Fund that occurred
during the reporting period.
|
| Material Fund Change Notice [Text Block] |
This report describes changes to the Fund that occurred
during the reporting period.
|
| Additional Information Phone Number |
800.344.1770
|
| Additional Information Website |
www.artisanpartners.com/prospectus
|
| Expenses [Text Block] |
What
were the Fund costs for the last six months?
(based on a hypothetical $10,000 investment)
| Class
Name |
Costs
of a $10,000 investment |
Costs
paid as a percentage of a $10,000 investment |
| Investor |
$85 |
1.65% |
| |
|
|
|
| Expenses Paid, Amount |
$ 85
|
| Expense Ratio, Percent |
1.65%
|
| Net Assets |
$ 300,225,000
|
| Holdings Count | Holdings |
425
|
| Advisory Fees Paid, Amount |
$ 514,000
|
| Investment Company, Portfolio Turnover |
32.63%
|
| Additional Fund Statistics [Text Block] |
| Key
Fund Statistics |
| Dollar
values in thousands |
| Net
Assets |
$300,225 |
| Number
of Portfolio Holdings |
425 |
| Total
Investment Advisory Fees (net of waivers and reimbursements) |
$514 |
| Portfolio
Turnover Rate |
32.63% |
|
| Holdings [Text Block] |
PORTFOLIO
COMPOSITION
(As
a Percentage of Total Net Assets)
| PORTFOLIO COMPOSITION |
|
| Type |
|
| Sovereign Government Bonds |
40.4% |
| Corporate Bonds |
12.8% |
| Common Stocks |
3.6% |
| Bank Loans |
2.9% |
| Closed End Fund |
0.2% |
| Convertible Bond |
0.1% |
| Other assets less liabilities |
40.0% |
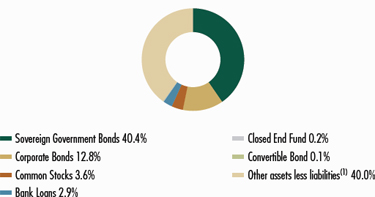
| (1) | Includes
any short-term investments and net other assets (liabilities). |
| * | Portfolio
composition is net of positions held short. |
| TRADING
CURRENCIES | |
| | |
| | |
| | |
| Currency | |
| Percentage of
Total Investments |
| Albanian lek | |
| 2.1 | % |
| Dominican peso | |
| 2.5 | |
| Egyptian pound | |
| 7.2 | |
| Euro | |
| 9.0 | |
| Iceland krona | |
| 6.1 | |
| Indonesian rupiah | |
| 1.7 | |
| Nigerian naira | |
| 4.2 | |
| Peruvian nuevo sol | |
| 4.5 | |
| U.S. dollar | |
| 57.5 | |
| Uzbekistani som | |
| 1.7 | |
| Other | |
| 3.5 | |
| Total
investments | |
| 100.0 | % |
PORTFOLIO
DIVERSIFICATION*
(As
a Percentage of Total Investments)
| Sector |
|
| Communication Services |
0.6% |
| Consumer Staples |
0.9% |
| Energy |
6.9% |
| Financials |
5.7% |
| Industrials |
1.0% |
| Investment Funds |
(1.0)% |
| Materials |
4.5% |
| Mutual Funds |
0.2% |
| Sovereign Government Securities |
43.5% |
| Utilities |
1.2% |
| Short-Term Investments |
36.5% |
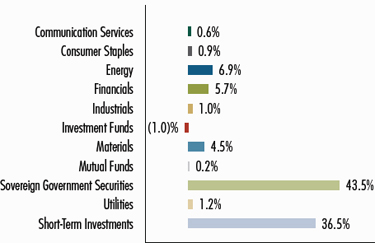
| * | Portfolio
diversification is net of positions held short. |
|
| Largest Holdings [Text Block] |
| TOP
TEN HOLDINGS* | |
|
| |
| | |
|
| |
| Company
Name | |
Country |
Percentage of
Total Net Assets |
| Commonwealth of the Bahamas | |
Bahamas |
4.8 | % |
| Bonos de la Tesoreria | |
Peru |
4.2 | |
| Republic of Iceland | |
Iceland |
3.8 | |
| Republic of Iraq | |
Iraq |
3.3 | |
| Benin Government Bond | |
Benin |
2.9 | |
| Federal Republic of Nigeria | |
Nigeria |
2.4 | |
| Banco Central de la Republica Dominicana, GDN | |
Dominican Republic |
2.3 | |
| Aris Mining Corp. | |
Colombia |
2.0 | |
| Ukraine Government Bond | |
Ukraine |
1.9 | |
| Republic of Uzbekistan International Bond | |
Uzbekistan |
1.6 | |
| Total | |
|
29.2 | % |
| * | Excludes
short-term investments. |
|
| Material Fund Change [Text Block] |
This
is a summary of certain changes of the Fund since September 30, 2024. On January 2, 2025,
the fair value methodology used to value emerging markets debt, as determined by a third
party vendor, held by the Fund was changed from using bid pricing to using the midpoint
between the bid and ask price. The change resulted in a one-time increase of less than
0.35% in the net asset value for the Fund. Effective March 14, 2025, the Fund's 2% redemption
fee was eliminated. For more information, you may review the Fund's current prospectus,
which is available at www.artisanpartners.com/prospectus or upon request by calling 800.344.1770.
|
| Summary of Change Legend [Text Block] |
This
is a summary of certain changes of the Fund since September 30, 2024. On January 2, 2025,
the fair value methodology used to value emerging markets debt, as determined by a third
party vendor, held by the Fund was changed from using bid pricing to using the midpoint
between the bid and ask price. The change resulted in a one-time increase of less than
0.35% in the net asset value for the Fund. Effective March 14, 2025, the Fund's 2% redemption
fee was eliminated.
|
| Updated Prospectus Phone Number |
800.344.1770
|
| Updated Prospectus Web Address |
www.artisanpartners.com/prospectus
|
| Artisan Global Value Fund - Advisor Shares |
|
| Shareholder Report [Line Items] |
|
| Fund Name |
Artisan
Global Value Fund
|
| Class Name |
Advisor Shares
|
| Trading Symbol |
APDGX
|
| Annual or Semi-Annual Statement [Text Block] |
This semi-annual shareholder report contains important information about Artisan Global Value Fund for the period of October
1, 2024 to March 31, 2025.
|
| Shareholder Report Annual or Semi-Annual |
Semi-Annual
Shareholder Report
|
| Additional Information [Text Block] |
This semi-annual shareholder report contains important information about Artisan Global Value Fund for the period of October
1, 2024 to March 31, 2025. You can find additional information about the Fund at www.artisanpartners.com/prospectus. You can
also request this information by contacting us at 800.344.1770.
|
| Additional Information Phone Number |
800.344.1770
|
| Additional Information Website |
www.artisanpartners.com/prospectus
|
| Expenses [Text Block] |
What
were the Fund costs for the last six months?
(based on a hypothetical $10,000 investment)
| Class
Name |
Costs
of a $10,000 investment |
Costs
paid as a percentage of a $10,000 investment |
| Advisor |
$56 |
1.10% |
| |
|
|
|
| Expenses Paid, Amount |
$ 56
|
| Expense Ratio, Percent |
1.10%
|
| Net Assets |
$ 2,528,553,000
|
| Holdings Count | Holdings |
41
|
| Advisory Fees Paid, Amount |
$ 12,193,000
|
| Investment Company, Portfolio Turnover |
7.81%
|
| Additional Fund Statistics [Text Block] |
| Key
Fund Statistics |
| Dollar
values in thousands |
| Net
Assets |
$2,528,553 |
| Number
of Portfolio Holdings |
41 |
| Total
Investment Advisory Fees (net of waivers and reimbursements) |
$12,193 |
| Portfolio
Turnover Rate |
7.81% |
|
| Holdings [Text Block] |
REGION
ALLOCATION
(As
a Percentage of Total Net Assets)
| REGION ALLOCATION |
|
| Region |
|
| Americas |
52.0% |
| Europe |
36.4% |
| Emerging Markets |
5.2% |
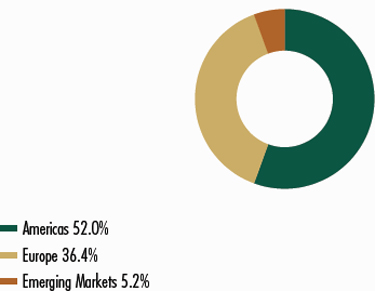
| TRADING
CURRENCIES | |
| | |
| | |
| | |
| Currency | |
| Percentage of
Total Investments |
| British pound | |
| 14.3 | % |
| Euro | |
| 20.4 | |
| Hong Kong dollar | |
| 1.9 | |
| Korean won | |
| 3.4 | |
| Swiss franc | |
| 9.0 | |
| U.S. dollar | |
| 51.0 | |
| Total
investments | |
| 100.0 | % |
PORTFOLIO
DIVERSIFICATION
(As
a Percentage of Total Investments)
| Sector |
|
| Communication Services |
9.1% |
| Consumer Discretionary |
9.0% |
| Consumer Staples |
9.1% |
| Energy |
5.1% |
| Financials |
34.4% |
| Health Care |
13.7% |
| Industrials |
5.3% |
| Information Technology |
4.6% |
| Materials |
4.5% |
| Short-Term Investment |
5.2% |
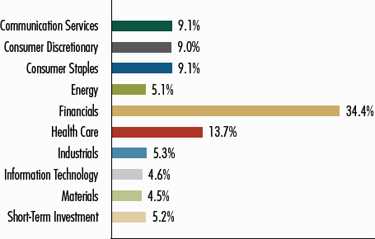
|
| Largest Holdings [Text Block] |
| TOP
TEN HOLDINGS* | |
|
| |
| | |
|
| |
| Company
Name | |
Country |
Percentage of
Total Net Assets |
| Elevance
Health, Inc. | |
United
States |
4.8 | % |
| Charles
Schwab Corp. (The) | |
United
States |
4.6 | |
| Heidelberg
Materials AG | |
Germany |
4.5 | |
| Danone
SA | |
France |
4.4 | |
| Bank
of New York Mellon Corp. (The) | |
United
States |
4.3 | |
| Berkshire
Hathaway, Inc. | |
United
States |
4.3 | |
| Novartis
AG | |
United
States |
4.0 | |
| American
Express Co. | |
United
States |
3.9 | |
| Alphabet,
Inc. | |
United
States |
3.8 | |
| Meta
Platforms, Inc. | |
United
States |
3.7 | |
| Total | |
|
42.3 | % |
| * | Excludes
short-term investments. |
|
| Artisan Global Value Fund - Institutional Shares |
|
| Shareholder Report [Line Items] |
|
| Fund Name |
Artisan
Global Value Fund
|
| Class Name |
Institutional Shares
|
| Trading Symbol |
APHGX
|
| Annual or Semi-Annual Statement [Text Block] |
This semi-annual shareholder report contains important information about Artisan Global Value Fund for the period of October
1, 2024 to March 31, 2025.
|
| Shareholder Report Annual or Semi-Annual |
Semi-Annual
Shareholder Report
|
| Additional Information [Text Block] |
This semi-annual shareholder report contains important information about Artisan Global Value Fund for the period of October
1, 2024 to March 31, 2025. You can find additional information about the Fund at www.artisanpartners.com/prospectus. You can
also request this information by contacting us at 800.344.1770.
|
| Additional Information Phone Number |
800.344.1770
|
| Additional Information Website |
www.artisanpartners.com/prospectus
|
| Expenses [Text Block] |
What
were the Fund costs for the last six months?
(based on a hypothetical $10,000 investment)
| Class
Name |
Costs
of a $10,000 investment |
Costs
paid as a percentage of a $10,000 investment |
| Institutional |
$52 |
1.01% |
| |
|
|
|
| Expenses Paid, Amount |
$ 52
|
| Expense Ratio, Percent |
1.01%
|
| Net Assets |
$ 2,528,553,000
|
| Holdings Count | Holdings |
41
|
| Advisory Fees Paid, Amount |
$ 12,193,000
|
| Investment Company, Portfolio Turnover |
7.81%
|
| Additional Fund Statistics [Text Block] |
| Key
Fund Statistics |
| Dollar
values in thousands |
| Net
Assets |
$2,528,553 |
| Number
of Portfolio Holdings |
41 |
| Total
Investment Advisory Fees (net of waivers and reimbursements) |
$12,193 |
| Portfolio
Turnover Rate |
7.81% |
|
| Holdings [Text Block] |
REGION
ALLOCATION
(As
a Percentage of Total Net Assets)
| REGION ALLOCATION |
|
| Region |
|
| Americas |
52.0% |
| Europe |
36.4% |
| Emerging Markets |
5.2% |

| TRADING
CURRENCIES | |
| | |
| | |
| | |
| Currency | |
| Percentage of
Total Investments |
| British pound | |
| 14.3 | % |
| Euro | |
| 20.4 | |
| Hong Kong dollar | |
| 1.9 | |
| Korean won | |
| 3.4 | |
| Swiss franc | |
| 9.0 | |
| U.S. dollar | |
| 51.0 | |
| Total
investments | |
| 100.0 | % |
PORTFOLIO
DIVERSIFICATION
(As
a Percentage of Total Investments)
| Sector |
|
| Communication Services |
9.1% |
| Consumer Discretionary |
9.0% |
| Consumer Staples |
9.1% |
| Energy |
5.1% |
| Financials |
34.4% |
| Health Care |
13.7% |
| Industrials |
5.3% |
| Information Technology |
4.6% |
| Materials |
4.5% |
| Short-Term Investment |
5.2% |

|
| Largest Holdings [Text Block] |
| TOP
TEN HOLDINGS* | |
|
| |
| | |
|
| |
| Company
Name | |
Country |
Percentage of
Total Net Assets |
| Elevance
Health, Inc. | |
United
States |
4.8 | % |
| Charles
Schwab Corp. (The) | |
United
States |
4.6 | |
| Heidelberg
Materials AG | |
Germany |
4.5 | |
| Danone
SA | |
France |
4.4 | |
| Bank
of New York Mellon Corp. (The) | |
United
States |
4.3 | |
| Berkshire
Hathaway, Inc. | |
United
States |
4.3 | |
| Novartis
AG | |
United
States |
4.0 | |
| American
Express Co. | |
United
States |
3.9 | |
| Alphabet,
Inc. | |
United
States |
3.8 | |
| Meta
Platforms, Inc. | |
United
States |
3.7 | |
| Total | |
|
42.3 | % |
| * | Excludes
short-term investments. |
|
| Artisan Global Value Fund - Investor Shares |
|
| Shareholder Report [Line Items] |
|
| Fund Name |
Artisan
Global Value Fund
|
| Class Name |
Investor Shares
|
| Trading Symbol |
ARTGX
|
| Annual or Semi-Annual Statement [Text Block] |
This semi-annual shareholder report contains important information about Artisan Global Value Fund for the period of October
1, 2024 to March 31, 2025
|
| Shareholder Report Annual or Semi-Annual |
Semi-Annual
Shareholder Report
|
| Additional Information [Text Block] |
This semi-annual shareholder report contains important information about Artisan Global Value Fund for the period of October
1, 2024 to March 31, 2025. You can find additional information about the Fund at www.artisanpartners.com/prospectus. You can
also request this information by contacting us at 800.344.1770.
|
| Additional Information Phone Number |
800.344.1770
|
| Additional Information Website |
www.artisanpartners.com/prospectus
|
| Expenses [Text Block] |
What
were the Fund costs for the last six months?
(based on a hypothetical $10,000 investment)
| Class
Name |
Costs
of a $10,000 investment |
Costs
paid as a percentage of a $10,000 investment |
| Investor |
$64 |
1.26% |
| |
|
|
|
| Expenses Paid, Amount |
$ 64
|
| Expense Ratio, Percent |
1.26%
|
| Net Assets |
$ 2,528,553,000
|
| Holdings Count | Holdings |
41
|
| Advisory Fees Paid, Amount |
$ 12,193,000
|
| Investment Company, Portfolio Turnover |
7.81%
|
| Additional Fund Statistics [Text Block] |
| Key
Fund Statistics |
| Dollar
values in thousands |
| Net
Assets |
$2,528,553 |
| Number
of Portfolio Holdings |
41 |
| Total
Investment Advisory Fees (net of waivers and reimbursements) |
$12,193 |
| Portfolio
Turnover Rate |
7.81% |
|
| Holdings [Text Block] |
REGION
ALLOCATION
(As
a Percentage of Total Net Assets)
| REGION ALLOCATION |
|
| Region |
|
| Americas |
52.0% |
| Europe |
36.4% |
| Emerging Markets |
5.2% |

| TRADING
CURRENCIES | |
| | |
| | |
| | |
| Currency | |
| Percentage of
Total Investments |
| British pound | |
| 14.3 | % |
| Euro | |
| 20.4 | |
| Hong Kong dollar | |
| 1.9 | |
| Korean won | |
| 3.4 | |
| Swiss franc | |
| 9.0 | |
| U.S. dollar | |
| 51.0 | |
| Total
investments | |
| 100.0 | % |
PORTFOLIO
DIVERSIFICATION
(As
a Percentage of Total Investments)
| Sector |
|
| Communication Services |
9.1% |
| Consumer Discretionary |
9.0% |
| Consumer Staples |
9.1% |
| Energy |
5.1% |
| Financials |
34.4% |
| Health Care |
13.7% |
| Industrials |
5.3% |
| Information Technology |
4.6% |
| Materials |
4.5% |
| Short-Term Investment |
5.2% |

|
| Largest Holdings [Text Block] |
| TOP
TEN HOLDINGS* | |
|
| |
| | |
|
| |
| Company
Name | |
Country |
Percentage of
Total Net Assets |
| Elevance
Health, Inc. | |
United
States |
4.8 | % |
| Charles
Schwab Corp. (The) | |
United
States |
4.6 | |
| Heidelberg
Materials AG | |
Germany |
4.5 | |
| Danone
SA | |
France |
4.4 | |
| Bank
of New York Mellon Corp. (The) | |
United
States |
4.3 | |
| Berkshire
Hathaway, Inc. | |
United
States |
4.3 | |
| Novartis
AG | |
United
States |
4.0 | |
| American
Express Co. | |
United
States |
3.9 | |
| Alphabet,
Inc. | |
United
States |
3.8 | |
| Meta
Platforms, Inc. | |
United
States |
3.7 | |
| Total | |
|
42.3 | % |
| * | Excludes
short-term investments. |
|
| Artisan High Income Fund - Advisor Shares |
|
| Shareholder Report [Line Items] |
|
| Fund Name |
Artisan
High Income Fund
|
| Class Name |
Advisor Shares
|
| Trading Symbol |
APDFX
|
| Annual or Semi-Annual Statement [Text Block] |
This semi-annual shareholder report contains important information about Artisan High Income Fund for the period of October
1, 2024 to March 31, 2025
|
| Shareholder Report Annual or Semi-Annual |
Semi-Annual
Shareholder Report
|
| Additional Information [Text Block] |
This semi-annual shareholder report contains important information about Artisan High Income Fund for the period of October
1, 2024 to March 31, 2025. You can find additional information about the Fund at www.artisanpartners.com/prospectus. You can
also request this information by contacting us at 800.344.1770.
|
| Additional Information Phone Number |
800.344.1770
|
| Additional Information Website |
www.artisanpartners.com/prospectus.
|
| Expenses [Text Block] |
What
were the Fund costs for the last six months?
(based on a hypothetical $10,000 investment)
| Class
Name |
Costs
of a $10,000 investment |
Costs
paid as a percentage of a $10,000 investment |
| Advisor |
$40 |
0.79% |
| |
|
|
|
| Expenses Paid, Amount |
$ 40
|
| Expense Ratio, Percent |
0.79%
|
| Net Assets |
$ 9,303,798,000
|
| Holdings Count | Holdings |
237
|
| Advisory Fees Paid, Amount |
$ 30,349,000
|
| Investment Company, Portfolio Turnover |
12.97%
|
| Additional Fund Statistics [Text Block] |
| Key
Fund Statistics |
| Dollar
values in thousands |
| Net
Assets |
$9,303,798 |
| Number
of Portfolio Holdings |
237 |
| Total
Investment Advisory Fees (net of waivers and reimbursements) |
$30,349 |
| Portfolio
Turnover Rate |
12.97% |
|
| Holdings [Text Block] |
PORTFOLIO
COMPOSITION
(As
a Percentage of Total Net Assets)
| PORTFOLIO COMPOSITION |
|
| Type |
|
| Corporate Bonds |
71.4% |
| Bank Loans |
21.3% |
| Common Stocks |
0.4% |
| Warrant |
0% |
| Preferred Stock |
0% |
| Other assets less liabilities |
6.9% |
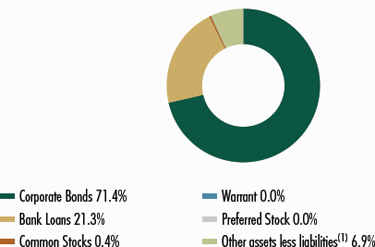
| (1) | Includes any short-term investments
and net other assets (liabilities). |
| TRADING
CURRENCIES | |
| | |
| | |
| | |
| Currency | |
| Percentage of
Total Investments |
| Euro | |
| 0.1 | % |
| U.S. dollar | |
| 99.9 | |
| Total
investments | |
| 100.0 | % |
PORTFOLIO
DIVERSIFICATION
(As
a Percentage of Total Investments)
| Sector |
|
| Communication Services |
15.7% |
| Consumer Discretionary |
24.1% |
| Consumer Staples |
4.0% |
| Energy |
1.7% |
| Financials |
17.3% |
| Health Care |
3.2% |
| Industrials |
10.8% |
| Information Technology |
7.7% |
| Materials |
6.4% |
| Real Estate |
2.3% |
| Short-Term Investment |
6.8% |

|
| Largest Holdings [Text Block] |
| TOP
TEN HOLDINGS* | |
|
| |
| | |
|
| |
| Company
Name | |
Country |
Percentage of
Total Net Assets |
| CCO Holdings LLC | |
United
States |
4.1 | % |
| Carnival Corp. | |
United
States |
4.0 | |
| VistaJet Malta Finance plc | |
Switzerland |
3.4 | |
| Ardonagh Group Finance Ltd. | |
United Kingdom |
3.1 | |
| Medline Borrower LP | |
United
States |
2.7 | |
| X Corp. First Lien Term Loan B3 | |
United
States |
2.6 | |
| Acrisure LLC | |
United
States |
2.6 | |
| Alliant Holdings Intermediate LLC | |
United
States |
2.4 | |
| TKC Holdings, Inc. | |
United
States |
1.9 | |
| CSC Holdings LLC | |
United
States |
1.8 | |
| Total | |
|
28.6 | % |
| * | Excludes
short-term investments. |
|
| Artisan High Income Fund - Institutional Shares |
|
| Shareholder Report [Line Items] |
|
| Fund Name |
Artisan
High Income Fund
|
| Class Name |
Institutional Shares
|
| Trading Symbol |
APHFX
|
| Annual or Semi-Annual Statement [Text Block] |
This semi-annual shareholder report contains important information about Artisan High Income Fund for the period of October
1, 2024 to March 31, 2025.
|
| Shareholder Report Annual or Semi-Annual |
Semi-Annual
Shareholder Report
|
| Additional Information [Text Block] |
This semi-annual shareholder report contains important information about Artisan High Income Fund for the period of October
1, 2024 to March 31, 2025. You can find additional information about the Fund at www.artisanpartners.com/prospectus. You can
also request this information by contacting us at 800.344.1770.
|
| Additional Information Phone Number |
800.344.1770.
|
| Additional Information Website |
www.artisanpartners.com/prospectus.
|
| Expenses [Text Block] |
What
were the Fund costs for the last six months?
(based on a hypothetical $10,000 investment)
| Class
Name |
Costs
of a $10,000 investment |
Costs
paid as a percentage of a $10,000 investment |
| Institutional |
$35 |
0.69% |
| |
|
|
|
| Expenses Paid, Amount |
$ 35
|
| Expense Ratio, Percent |
0.69%
|
| Net Assets |
$ 9,303,798,000
|
| Holdings Count | Holdings |
237
|
| Advisory Fees Paid, Amount |
$ 30,349,000
|
| Investment Company, Portfolio Turnover |
12.97%
|
| Additional Fund Statistics [Text Block] |
| Key
Fund Statistics |
| Dollar
values in thousands |
| Net
Assets |
$9,303,798 |
| Number
of Portfolio Holdings |
237 |
| Total
Investment Advisory Fees (net of waivers and reimbursements) |
$30,349 |
| Portfolio
Turnover Rate |
12.97% |
|
| Holdings [Text Block] |
PORTFOLIO
COMPOSITION
(As
a Percentage of Total Net Assets)
| PORTFOLIO COMPOSITION |
|
| Type |
|
| Corporate Bonds |
71.4% |
| Bank Loans |
21.3% |
| Common Stocks |
0.4% |
| Warrant |
0% |
| Preferred Stock |
0% |
| Other assets less liabilities |
6.9% |

| (1) | Includes any short-term investments
and net other assets (liabilities). |
| TRADING
CURRENCIES | |
| | |
| | |
| | |
| Currency | |
| Percentage of
Total Investments |
| Euro | |
| 0.1 | % |
| U.S. dollar | |
| 99.9 | |
| Total
investments | |
| 100.0 | % |
PORTFOLIO
DIVERSIFICATION
(As
a Percentage of Total Investments)
| Sector |
|
| Communication Services |
15.7% |
| Consumer Discretionary |
24.1% |
| Consumer Staples |
4.0% |
| Energy |
1.7% |
| Financials |
17.3% |
| Health Care |
3.2% |
| Industrials |
10.8% |
| Information Technology |
7.7% |
| Materials |
6.4% |
| Real Estate |
2.3% |
| Short-Term Investment |
6.8% |
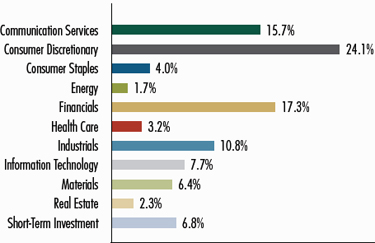
|
| Largest Holdings [Text Block] |
| TOP
TEN HOLDINGS* | |
|
| |
| | |
|
| |
| Company
Name | |
Country |
Percentage of
Total Net Assets |
| CCO Holdings LLC | |
United
States |
4.1 | % |
| Carnival Corp. | |
United
States |
4.0 | |
| VistaJet Malta Finance plc | |
Switzerland |
3.4 | |
| Ardonagh Group Finance Ltd. | |
United Kingdom |
3.1 | |
| Medline Borrower LP | |
United
States |
2.7 | |
| X Corp. First Lien Term Loan B3 | |
United
States |
2.6 | |
| Acrisure LLC | |
United
States |
2.6 | |
| Alliant Holdings Intermediate LLC | |
United
States |
2.4 | |
| TKC Holdings, Inc. | |
United
States |
1.9 | |
| CSC Holdings LLC | |
United
States |
1.8 | |
| Total | |
|
28.6 | % |
| * | Excludes
short-term investments. |
|
| Artisan High Income Fund - Investor Shares |
|
| Shareholder Report [Line Items] |
|
| Fund Name |
Artisan
High Income Fund
|
| Class Name |
Investor Shares
|
| Trading Symbol |
ARTFX
|
| Annual or Semi-Annual Statement [Text Block] |
This semi-annual shareholder report contains important information about Artisan High Income Fund for the period of October
1, 2024 to March 31, 2025
|
| Shareholder Report Annual or Semi-Annual |
Semi-Annual
Shareholder Report
|
| Additional Information [Text Block] |
This semi-annual shareholder report contains important information about Artisan High Income Fund for the period of October
1, 2024 to March 31, 2025. You can find additional information about the Fund at www.artisanpartners.com/prospectus. You can
also request this information by contacting us at 800.344.1770.
|
| Additional Information Phone Number |
800.344.1770
|
| Additional Information Website |
www.artisanpartners.com/prospectus.
|
| Expenses [Text Block] |
What
were the Fund costs for the last six months?
(based on a hypothetical $10,000 investment)
| Class
Name |
Costs
of a $10,000 investment |
Costs
paid as a percentage of a $10,000 investment |
| Investor |
$48 |
0.94% |
| |
|
|
|
| Expenses Paid, Amount |
$ 48
|
| Expense Ratio, Percent |
0.94%
|
| Net Assets |
$ 9,303,798,000
|
| Holdings Count | Holdings |
237
|
| Advisory Fees Paid, Amount |
$ 30,349,000
|
| Investment Company, Portfolio Turnover |
12.97%
|
| Additional Fund Statistics [Text Block] |
| Key
Fund Statistics |
| Dollar
values in thousands |
| Net
Assets |
$9,303,798 |
| Number
of Portfolio Holdings |
237 |
| Total
Investment Advisory Fees (net of waivers and reimbursements) |
$30,349 |
| Portfolio
Turnover Rate |
12.97% |
|
| Holdings [Text Block] |
PORTFOLIO
COMPOSITION
(As
a Percentage of Total Net Assets)
| PORTFOLIO COMPOSITION |
|
| Type |
|
| Corporate Bonds |
71.4% |
| Bank Loans |
21.3% |
| Common Stocks |
0.4% |
| Warrant |
0% |
| Preferred Stock |
0% |
| Other assets less liabilities |
6.9% |

| (1) | Includes any short-term investments
and net other assets (liabilities). |
| TRADING
CURRENCIES | |
| | |
| | |
| | |
| Currency | |
| Percentage of
Total Investments |
| Euro | |
| 0.1 | % |
| U.S. dollar | |
| 99.9 | |
| Total
investments | |
| 100.0 | % |
PORTFOLIO
DIVERSIFICATION
(As
a Percentage of Total Investments)
| Sector |
|
| Communication Services |
15.7% |
| Consumer Discretionary |
24.1% |
| Consumer Staples |
4.0% |
| Energy |
1.7% |
| Financials |
17.3% |
| Health Care |
3.2% |
| Industrials |
10.8% |
| Information Technology |
7.7% |
| Materials |
6.4% |
| Real Estate |
2.3% |
| Short-Term Investment |
6.8% |
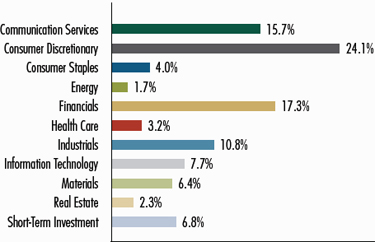
|
| Largest Holdings [Text Block] |
| TOP
TEN HOLDINGS* | |
|
| |
| | |
|
| |
| Company
Name | |
Country |
Percentage of
Total Net Assets |
| CCO Holdings LLC | |
United
States |
4.1 | % |
| Carnival Corp. | |
United
States |
4.0 | |
| VistaJet Malta Finance plc | |
Switzerland |
3.4 | |
| Ardonagh Group Finance Ltd. | |
United Kingdom |
3.1 | |
| Medline Borrower LP | |
United
States |
2.7 | |
| X Corp. First Lien Term Loan B3 | |
United
States |
2.6 | |
| Acrisure LLC | |
United
States |
2.6 | |
| Alliant Holdings Intermediate LLC | |
United
States |
2.4 | |
| TKC Holdings, Inc. | |
United
States |
1.9 | |
| CSC Holdings LLC | |
United
States |
1.8 | |
| Total | |
|
28.6 | % |
| * | Excludes
short-term investments. |
|
| Artisan International Fund - Advisor Shares |
|
| Shareholder Report [Line Items] |
|
| Fund Name |
Artisan
International Fund
|
| Class Name |
Advisor Shares
|
| Trading Symbol |
APDIX
|
| Annual or Semi-Annual Statement [Text Block] |
This semi-annual shareholder report contains important information about Artisan International Fund for the period of October
1, 2024 to March 31, 2025.
|
| Shareholder Report Annual or Semi-Annual |
Semi-Annual
Shareholder Report
|
| Additional Information [Text Block] |
This semi-annual shareholder report contains important information about Artisan International Fund for the period of October
1, 2024 to March 31, 2025. You can find additional information about the Fund at www.artisanpartners.com/prospectus. You can
also request this information by contacting us at 800.344.1770.
|
| Additional Information Phone Number |
800.344.1770
|
| Additional Information Website |
www.artisanpartners.com/prospectus
|
| Expenses [Text Block] |
What
were the Fund costs for the last six months?
(based on a hypothetical $10,000 investment)
| Class
Name |
Costs
of a $10,000 investment |
Costs
paid as a percentage of a $10,000 investment |
| Advisor |
$54 |
1.06% |
| |
|
|
|
| Expenses Paid, Amount |
$ 54
|
| Expense Ratio, Percent |
1.06%
|
| Net Assets |
$ 5,029,754,000
|
| Holdings Count | Holdings |
69
|
| Advisory Fees Paid, Amount |
$ 24,035,000
|
| Investment Company, Portfolio Turnover |
60.76%
|
| Additional Fund Statistics [Text Block] |
| Key
Fund Statistics |
| Dollar
values in thousands |
| Net
Assets |
$5,029,754 |
| Number
of Portfolio Holdings |
69 |
| Total
Investment Advisory Fees (net of waivers and reimbursements) |
$24,035 |
| Portfolio
Turnover Rate |
60.76% |
|
| Holdings [Text Block] |
REGION
ALLOCATION
(As
a Percentage of Total Net Assets)
| REGION ALLOCATION |
|
| Region |
|
| Europe |
64.9% |
| Americas |
4.9% |
| Emerging Markets |
17.3% |
| Pacific Basin |
8.9% |
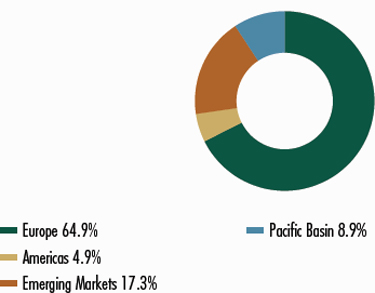
| TRADING
CURRENCIES | |
| | |
| | |
| | |
| Currency | |
| Percentage of
Total Investments |
| British pound | |
| 19.0 | % |
| Chinese yuan renminbi offshore | |
| 1.0 | |
| Danish krone | |
| 3.6 | |
| Euro | |
| 32.1 | |
| Hong Kong dollar | |
| 4.1 | |
| Japanese yen | |
| 7.2 | |
| Korean won | |
| 4.6 | |
| Mexican peso | |
| 0.7 | |
| Swiss franc | |
| 9.1 | |
| U.S. dollar | |
| 17.9 | |
| Other | |
| 0.7 | |
| Total
investments | |
| 100.0 | % |
PORTFOLIO
DIVERSIFICATION
(As
a Percentage of Total Investments)
| Sector |
|
| Communication Services |
6.3% |
| Consumer Discretionary |
7.0% |
| Consumer Staples |
9.7% |
| Energy |
0.2% |
| Financials |
31.7% |
| Health Care |
5.8% |
| Industrials |
21.8% |
| Materials |
5.3% |
| Real Estate |
2.0% |
| Utilities |
6.7% |
| Short-Term Investment |
3.5% |

|
| Largest Holdings [Text Block] |
| TOP
TEN HOLDINGS* | |
|
| |
| | |
|
| |
| Company
Name | |
Country |
Percentage of
Total Net Assets |
| National Grid plc | |
United Kingdom |
4.9 | % |
| UBS Group AG | |
Switzerland |
4.7 | |
| Alibaba Group Holding Ltd. | |
China |
3.3 | |
| BNP Paribas SA | |
France |
3.0 | |
| Aon plc | |
United
States |
3.0 | |
| Air Liquide SA | |
France |
2.9 | |
| Deutsche Boerse AG | |
Germany |
2.7 | |
| Argenx SE | |
Netherlands |
2.5 | |
| Deutsche Telekom AG | |
Germany |
2.4 | |
| Hanwha Aerospace Co. Ltd. | |
South Korea |
2.3 | |
| Total | |
|
31.7 | % |
| * | Excludes
short-term investments. |
|
| Artisan International Fund - Institutional Shares |
|
| Shareholder Report [Line Items] |
|
| Fund Name |
Artisan
International Fund
|
| Class Name |
Institutional Shares
|
| Trading Symbol |
APHIX
|
| Annual or Semi-Annual Statement [Text Block] |
This semi-annual shareholder report contains important information about Artisan International Fund for the period of October
1, 2024 to March 31, 2025.
|
| Shareholder Report Annual or Semi-Annual |
Semi-Annual
Shareholder Report
|
| Additional Information [Text Block] |
This semi-annual shareholder report contains important information about Artisan International Fund for the period of October
1, 2024 to March 31, 2025. You can find additional information about the Fund at www.artisanpartners.com/prospectus. You can
also request this information by contacting us at 800.344.1770.
|
| Additional Information Phone Number |
800.344.1770
|
| Additional Information Website |
www.artisanpartners.com/prospectus
|
| Expenses [Text Block] |
What
were the Fund costs for the last six months?
(based on a hypothetical $10,000 investment)
| Class
Name |
Costs
of a $10,000 investment |
Costs
paid as a percentage of a $10,000 investment |
| Institutional |
$49 |
0.96% |
| |
|
|
|
| Expenses Paid, Amount |
$ 49
|
| Expense Ratio, Percent |
0.96%
|
| Net Assets |
$ 5,029,754,000
|
| Holdings Count | Holdings |
69
|
| Advisory Fees Paid, Amount |
$ 24,035,000
|
| Investment Company, Portfolio Turnover |
60.76%
|
| Additional Fund Statistics [Text Block] |
| Key
Fund Statistics |
| Dollar
values in thousands |
| Net
Assets |
$5,029,754 |
| Number
of Portfolio Holdings |
69 |
| Total
Investment Advisory Fees (net of waivers and reimbursements) |
$24,035 |
| Portfolio
Turnover Rate |
60.76% |
|
| Holdings [Text Block] |
REGION
ALLOCATION
(As
a Percentage of Total Net Assets)
| REGION ALLOCATION |
|
| Region |
|
| Europe |
64.9% |
| Americas |
4.9% |
| Emerging Markets |
17.3% |
| Pacific Basin |
8.9% |
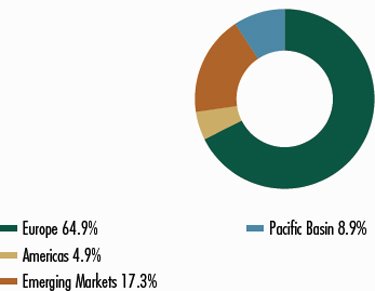
| TRADING
CURRENCIES | |
| | |
| | |
| | |
| Currency | |
| Percentage of
Total Investments |
| British pound | |
| 19.0 | % |
| Chinese yuan renminbi offshore | |
| 1.0 | |
| Danish krone | |
| 3.6 | |
| Euro | |
| 32.1 | |
| Hong Kong dollar | |
| 4.1 | |
| Japanese yen | |
| 7.2 | |
| Korean won | |
| 4.6 | |
| Mexican peso | |
| 0.7 | |
| Swiss franc | |
| 9.1 | |
| U.S. dollar | |
| 17.9 | |
| Other | |
| 0.7 | |
| Total
investments | |
| 100.0 | % |
PORTFOLIO
DIVERSIFICATION
(As
a Percentage of Total Investments)
| Sector |
|
| Communication Services |
6.3% |
| Consumer Discretionary |
7.0% |
| Consumer Staples |
9.7% |
| Energy |
0.2% |
| Financials |
31.7% |
| Health Care |
5.8% |
| Industrials |
21.8% |
| Materials |
5.3% |
| Real Estate |
2.0% |
| Utilities |
6.7% |
| Short-Term Investment |
3.5% |

|
| Largest Holdings [Text Block] |
| TOP
TEN HOLDINGS* | |
|
| |
| | |
|
| |
| Company
Name | |
Country |
Percentage of
Total Net Assets |
| National Grid plc | |
United Kingdom |
4.9 | % |
| UBS Group AG | |
Switzerland |
4.7 | |
| Alibaba Group Holding Ltd. | |
China |
3.3 | |
| BNP Paribas SA | |
France |
3.0 | |
| Aon plc | |
United
States |
3.0 | |
| Air Liquide SA | |
France |
2.9 | |
| Deutsche Boerse AG | |
Germany |
2.7 | |
| Argenx SE | |
Netherlands |
2.5 | |
| Deutsche Telekom AG | |
Germany |
2.4 | |
| Hanwha Aerospace Co. Ltd. | |
South Korea |
2.3 | |
| Total | |
|
31.7 | % |
| * | Excludes
short-term investments. |
|
| Artisan International Fund - Investor Shares |
|
| Shareholder Report [Line Items] |
|
| Fund Name |
Artisan
International Fund
|
| Class Name |
Investor Shares
|
| Trading Symbol |
ARTIX
|
| Annual or Semi-Annual Statement [Text Block] |
This semi-annual shareholder report contains important information about Artisan International Fund for the period of October
1, 2024 to March 31, 2025.
|
| Shareholder Report Annual or Semi-Annual |
Semi-Annual
Shareholder Report
|
| Additional Information [Text Block] |
This semi-annual shareholder report contains important information about Artisan International Fund for the period of October
1, 2024 to March 31, 2025. You can find additional information about the Fund at www.artisanpartners.com/prospectus. You can
also request this information by contacting us at 800.344.1770.
|
| Additional Information Phone Number |
800.344.1770
|
| Additional Information Website |
www.artisanpartners.com/prospectus
|
| Expenses [Text Block] |
What
were the Fund costs for the last six months?
(based on a hypothetical $10,000 investment)
| Class
Name |
Costs
of a $10,000 investment |
Costs
paid as a percentage of a $10,000 investment |
| Investor |
$61 |
1.19% |
| |
|
|
|
| Expenses Paid, Amount |
$ 61
|
| Expense Ratio, Percent |
1.19%
|
| Net Assets |
$ 5,029,754,000
|
| Holdings Count | Holdings |
69
|
| Advisory Fees Paid, Amount |
$ 24,035,000
|
| Investment Company, Portfolio Turnover |
60.76%
|
| Additional Fund Statistics [Text Block] |
| Key
Fund Statistics |
| Dollar
values in thousands |
| Net
Assets |
$5,029,754 |
| Number
of Portfolio Holdings |
69 |
| Total
Investment Advisory Fees (net of waivers and reimbursements) |
$24,035 |
| Portfolio
Turnover Rate |
60.76% |
|
| Holdings [Text Block] |
REGION
ALLOCATION
(As
a Percentage of Total Net Assets)
| REGION ALLOCATION |
|
| Region |
|
| Europe |
64.9% |
| Americas |
4.9% |
| Emerging Markets |
17.3% |
| Pacific Basin |
8.9% |

| TRADING
CURRENCIES | |
| | |
| | |
| | |
| Currency | |
| Percentage of
Total Investments |
| British pound | |
| 19.0 | % |
| Chinese yuan renminbi offshore | |
| 1.0 | |
| Danish krone | |
| 3.6 | |
| Euro | |
| 32.1 | |
| Hong Kong dollar | |
| 4.1 | |
| Japanese yen | |
| 7.2 | |
| Korean won | |
| 4.6 | |
| Mexican peso | |
| 0.7 | |
| Swiss franc | |
| 9.1 | |
| U.S. dollar | |
| 17.9 | |
| Other | |
| 0.7 | |
| Total
investments | |
| 100.0 | % |
PORTFOLIO
DIVERSIFICATION
(As
a Percentage of Total Investments)
| Sector |
|
| Communication Services |
6.3% |
| Consumer Discretionary |
7.0% |
| Consumer Staples |
9.7% |
| Energy |
0.2% |
| Financials |
31.7% |
| Health Care |
5.8% |
| Industrials |
21.8% |
| Materials |
5.3% |
| Real Estate |
2.0% |
| Utilities |
6.7% |
| Short-Term Investment |
3.5% |
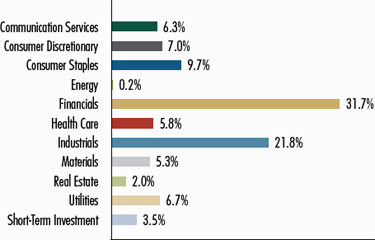
|
| Largest Holdings [Text Block] |
| TOP
TEN HOLDINGS* | |
|
| |
| | |
|
| |
| Company
Name | |
Country |
Percentage of
Total Net Assets |
| National Grid plc | |
United Kingdom |
4.9 | % |
| UBS Group AG | |
Switzerland |
4.7 | |
| Alibaba Group Holding Ltd. | |
China |
3.3 | |
| BNP Paribas SA | |
France |
3.0 | |
| Aon plc | |
United
States |
3.0 | |
| Air Liquide SA | |
France |
2.9 | |
| Deutsche Boerse AG | |
Germany |
2.7 | |
| Argenx SE | |
Netherlands |
2.5 | |
| Deutsche Telekom AG | |
Germany |
2.4 | |
| Hanwha Aerospace Co. Ltd. | |
South Korea |
2.3 | |
| Total | |
|
31.7 | % |
| * | Excludes
short-term investments. |
|
| Artisan International Explorer Fund - Advisor Shares |
|
| Shareholder Report [Line Items] |
|
| Fund Name |
Artisan
International Explorer Fund
|
| Class Name |
Advisor Shares
|
| Trading Symbol |
ARDBX
|
| Annual or Semi-Annual Statement [Text Block] |
This semi-annual shareholder report contains important information about Artisan International Explorer Fund for the period
of October 1, 2024 to March 31, 2025.
|
| Shareholder Report Annual or Semi-Annual |
Semi-Annual
Shareholder Report
|
| Additional Information [Text Block] |
This semi-annual shareholder report contains important information about Artisan International Explorer Fund for the period
of October 1, 2024 to March 31, 2025. You can find additional information about the Fund at www.artisanpartners.com/prospectus.
You can also request this information by contacting us at 800.344.1770.
|
| Additional Information Phone Number |
800.344.1770
|
| Additional Information Website |
www.artisanpartners.com/prospectus
|
| Expenses [Text Block] |
What
were the Fund costs for the last six months?
(based on a hypothetical $10,000 investment)
| Class
Name |
Costs
of a $10,000 investment |
Costs
paid as a percentage of a $10,000 investment |
| Advisor |
$63 |
1.25% |
| |
|
|
|
| Expenses Paid, Amount |
$ 63
|
| Expense Ratio, Percent |
1.25%
|
| Net Assets |
$ 263,189,000
|
| Holdings Count | Holdings |
36
|
| Advisory Fees Paid, Amount |
$ 1,127,000
|
| Investment Company, Portfolio Turnover |
22.74%
|
| Additional Fund Statistics [Text Block] |
| Key
Fund Statistics |
| Dollar
values in thousands |
| Net
Assets |
$263,189 |
| Number
of Portfolio Holdings |
36 |
| Total
Investment Advisory Fees (net of waivers and reimbursements) |
$1,127 |
| Portfolio
Turnover Rate |
22.74% |
|
| Holdings [Text Block] |
REGION
ALLOCATION
(As
a Percentage of Total Net Assets)
| REGION ALLOCATION |
|
| Region |
|
| Europe |
48.8% |
| Americas |
9.6% |
| Emerging Markets |
9.9% |
| Pacific Basin |
17.1% |
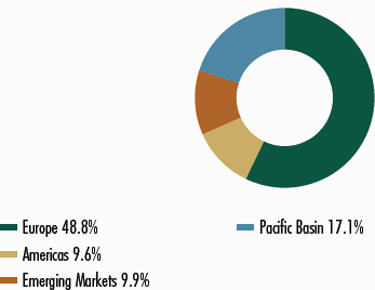
| TRADING
CURRENCIES | |
| | |
| | |
| | |
| Currency | |
| Percentage of
Total Investments |
| Australian dollar | |
| 3.2 | % |
| British pound | |
| 23.2 | |
| Canadian dollar | |
| 2.3 | |
| Euro | |
| 23.8 | |
| Hong Kong dollar | |
| 3.4 | |
| Indonesian rupiah | |
| 1.8 | |
| Japanese yen | |
| 14.0 | |
| Korean won | |
| 2.0 | |
| Swiss franc | |
| 3.7 | |
| U.S. dollar | |
| 19.4 | |
| Other | |
| 3.2 | |
| Total
investments | |
| 100.0 | % |
PORTFOLIO
DIVERSIFICATION
(As
a Percentage of Total Investments)
| Sector |
|
| Communication Services |
4.2% |
| Consumer Discretionary |
17.9% |
| Financials |
8.9% |
| Health Care |
2.9% |
| Industrials |
16.0% |
| Information Technology |
27.4% |
| Materials |
7.0% |
| Real Estate |
1.6% |
| Short-Term Investment |
14.1% |
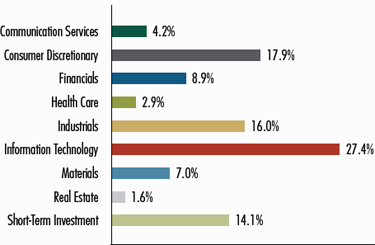
|
| Largest Holdings [Text Block] |
| TOP
TEN HOLDINGS* | |
|
| |
| | |
|
| |
| Company
Name | |
Country |
Percentage of
Total Net Assets |
| Glenveagh Properties plc | |
Ireland |
9.6 | % |
| Zuken, Inc. | |
Japan |
6.7 | |
| Alten SA | |
France |
5.8 | |
| M&C Saatchi plc | |
United Kingdom |
4.2 | |
| Signify NV | |
United
States |
3.9 | |
| Kansai Paint Co. Ltd. | |
Japan |
3.7 | |
| Sato Holdings Corp. | |
Japan |
3.5 | |
| Impro Precision Industries Ltd. | |
United States |
3.4 | |
| Steadfast Group Ltd. | |
Australia |
3.2 | |
| FDM Group Holdings plc | |
United Kingdom |
3.2 | |
| Total | |
|
47.2 | % |
| * | Excludes
short-term investments. |
|
| Artisan International Explorer Fund - Institutional Shares |
|
| Shareholder Report [Line Items] |
|
| Fund Name |
Artisan
International Explorer Fund
|
| Class Name |
Institutional Shares
|
| Trading Symbol |
ARHBX
|
| Annual or Semi-Annual Statement [Text Block] |
This semi-annual shareholder report contains important information about Artisan International Explorer Fund for the period
of October 1, 2024 to March 31, 2025.
|
| Shareholder Report Annual or Semi-Annual |
Semi-Annual
Shareholder Report
|
| Additional Information [Text Block] |
This semi-annual shareholder report contains important information about Artisan International Explorer Fund for the period
of October 1, 2024 to March 31, 2025. You can find additional information about the Fund at www.artisanpartners.com/prospectus.
You can also request this information by contacting us at 800.344.1770.
|
| Additional Information Phone Number |
800.344.1770
|
| Additional Information Website |
www.artisanpartners.com/prospectus
|
| Expenses [Text Block] |
What
were the Fund costs for the last six months?
(based on a hypothetical $10,000 investment)
| Class
Name |
Costs
of a $10,000 investment |
Costs
paid as a percentage of a $10,000 investment |
| Institutional |
$61 |
1.22% |
| |
|
|
|
| Expenses Paid, Amount |
$ 61
|
| Expense Ratio, Percent |
1.22%
|
| Net Assets |
$ 263,189,000
|
| Holdings Count | Holdings |
36
|
| Advisory Fees Paid, Amount |
$ 1,127,000
|
| Investment Company, Portfolio Turnover |
22.74%
|
| Additional Fund Statistics [Text Block] |
| Key
Fund Statistics |
| Dollar
values in thousands |
| Net
Assets |
$263,189 |
| Number
of Portfolio Holdings |
36 |
| Total
Investment Advisory Fees (net of waivers and reimbursements) |
$1,127 |
| Portfolio
Turnover Rate |
22.74% |
|
| Holdings [Text Block] |
REGION
ALLOCATION
(As
a Percentage of Total Net Assets)
| REGION ALLOCATION |
|
| Region |
|
| Europe |
48.8% |
| Americas |
9.6% |
| Emerging Markets |
9.9% |
| Pacific Basin |
17.1% |

| TRADING
CURRENCIES | |
| | |
| | |
| | |
| Currency | |
| Percentage of
Total Investments |
| Australian dollar | |
| 3.2 | % |
| British pound | |
| 23.2 | |
| Canadian dollar | |
| 2.3 | |
| Euro | |
| 23.8 | |
| Hong Kong dollar | |
| 3.4 | |
| Indonesian rupiah | |
| 1.8 | |
| Japanese yen | |
| 14.0 | |
| Korean won | |
| 2.0 | |
| Swiss franc | |
| 3.7 | |
| U.S. dollar | |
| 19.4 | |
| Other | |
| 3.2 | |
| Total
investments | |
| 100.0 | % |
PORTFOLIO
DIVERSIFICATION
(As
a Percentage of Total Investments)
| Sector |
|
| Communication Services |
4.2% |
| Consumer Discretionary |
17.9% |
| Financials |
8.9% |
| Health Care |
2.9% |
| Industrials |
16.0% |
| Information Technology |
27.4% |
| Materials |
7.0% |
| Real Estate |
1.6% |
| Short-Term Investment |
14.1% |
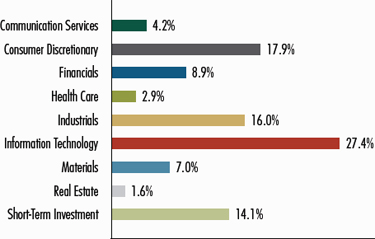
|
| Largest Holdings [Text Block] |
| TOP
TEN HOLDINGS* | |
|
| |
| | |
|
| |
| Company
Name | |
Country |
Percentage of
Total Net Assets |
| Glenveagh Properties plc | |
Ireland |
9.6 | % |
| Zuken, Inc. | |
Japan |
6.7 | |
| Alten SA | |
France |
5.8 | |
| M&C Saatchi plc | |
United Kingdom |
4.2 | |
| Signify NV | |
United
States |
3.9 | |
| Kansai Paint Co. Ltd. | |
Japan |
3.7 | |
| Sato Holdings Corp. | |
Japan |
3.5 | |
| Impro Precision Industries Ltd. | |
United States |
3.4 | |
| Steadfast Group Ltd. | |
Australia |
3.2 | |
| FDM Group Holdings plc | |
United Kingdom |
3.2 | |
| Total | |
|
47.2 | % |
| * | Excludes
short-term investments. |
|
| Artisan International Small-Mid Fund - Advisor Shares |
|
| Shareholder Report [Line Items] |
|
| Fund Name |
Artisan
International Small-Mid Fund
|
| Class Name |
Advisor Shares
|
| Trading Symbol |
APDJX
|
| Annual or Semi-Annual Statement [Text Block] |
This semi-annual shareholder report contains important information about Artisan International Small-Mid Fund for the period
of October 1, 2024 to March 31, 2025
|
| Shareholder Report Annual or Semi-Annual |
Semi-Annual
Shareholder Report
|
| Additional Information [Text Block] |
This semi-annual shareholder report contains important information about Artisan International Small-Mid Fund for the period
of October 1, 2024 to March 31, 2025. You can find additional information about the Fund at www.artisanpartners.com/prospectus.
You can also request this information by contacting us at 800.344.1770.
|
| Additional Information Phone Number |
800.344.1770
|
| Additional Information Website |
www.artisanpartners.com/prospectus
|
| Expenses [Text Block] |
What
were the Fund costs for the last six months?
(based on a hypothetical $10,000 investment)
| Class
Name |
Costs
of a $10,000 investment |
Costs
paid as a percentage of a $10,000 investment |
| Advisor |
$55 |
1.16% |
| |
|
|
|
| Expenses Paid, Amount |
$ 55
|
| Expense Ratio, Percent |
1.16%
|
| Net Assets |
$ 3,667,060,000
|
| Holdings Count | Holdings |
132
|
| Advisory Fees Paid, Amount |
$ 22,231,000
|
| Investment Company, Portfolio Turnover |
17.20%
|
| Additional Fund Statistics [Text Block] |
| Key
Fund Statistics |
| Dollar
values in thousands |
| Net
Assets |
$3,667,060 |
| Number
of Portfolio Holdings |
132 |
| Total
Investment Advisory Fees (net of waivers and reimbursements) |
$22,231 |
| Portfolio
Turnover Rate |
17.20% |
|
| Holdings [Text Block] |
REGION
ALLOCATION
(As
a Percentage of Total Net Assets)
| Region |
|
| Europe |
44.6% |
| Americas |
19.9% |
| Emerging Markets |
7.3% |
| Middle East |
5.9% |
| Pacific Basin |
18.3% |
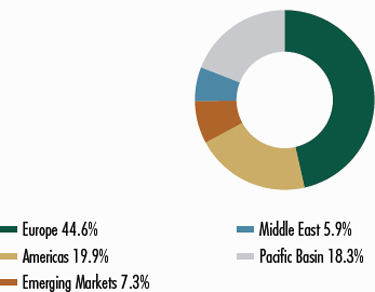
| TRADING
CURRENCIES | |
| | |
| | |
| | |
| Currency | |
| Percentage of
Total Investments |
| Brazilian real | |
| 1.2 | % |
| British pound | |
| 20.8 | |
| Canadian dollar | |
| 5.2 | |
| Danish krone | |
| 6.5 | |
| Euro | |
| 11.4 | |
| Israel new shekel | |
| 1.0 | |
| Japanese yen | |
| 19.0 | |
| Swedish krona | |
| 3.8 | |
| Swiss franc | |
| 3.7 | |
| U.S. dollar | |
| 25.3 | |
| Other | |
| 2.1 | |
| Total
investments | |
| 100.0 | % |
PORTFOLIO
DIVERSIFICATION
(As
a Percentage of Total Investments)
| Sector |
|
| Consumer Discretionary |
5.3% |
| Consumer Staples |
7.5% |
| Energy |
0.6% |
| Financials |
7.2% |
| Health Care |
26.7% |
| Industrials |
30.3% |
| Information Technology |
18.7% |
| Materials |
2.1% |
| Real Estate |
1.0% |
| Utilities |
0.6% |
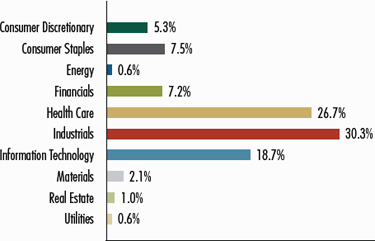
|
| Largest Holdings [Text Block] |
| TOP
TEN HOLDINGS* | |
|
| |
| | |
|
| |
| Company
Name | |
Country |
Percentage of
Total Net Assets |
| ConvaTec Group plc | |
United Kingdom |
3.5 | % |
| Nice Ltd. | |
Israel |
3.0 | |
| Ambu A/S | |
Denmark |
2.4 | |
| Metso Oyj | |
Finland |
2.2 | |
| Swedish Orphan Biovitrum AB | |
Sweden |
2.2 | |
| JET2 plc | |
United Kingdom |
2.0 | |
| WNS Holdings Ltd. | |
India |
1.9 | |
| CAE, Inc. | |
Canada |
1.7 | |
| Azbil Corp. | |
Japan |
1.7 | |
| Rotork plc | |
United Kingdom |
1.7 | |
| Total | |
|
22.3 | % |
| * | | Excludes short-term
investments. |
|
| Artisan International Small-Mid Fund - Institutional Shares |
|
| Shareholder Report [Line Items] |
|
| Fund Name |
Artisan
International Small-Mid Fund
|
| Class Name |
Institutional Shares
|
| Trading Symbol |
APHJX
|
| Annual or Semi-Annual Statement [Text Block] |
This semi-annual shareholder report contains important information about Artisan International Small-Mid Fund for the period
of October 1, 2024 to March 31, 2025
|
| Shareholder Report Annual or Semi-Annual |
Semi-Annual
Shareholder Report
|
| Additional Information [Text Block] |
This semi-annual shareholder report contains important information about Artisan International Small-Mid Fund for the period
of October 1, 2024 to March 31, 2025. You can find additional information about the Fund at www.artisanpartners.com/prospectus.
You can also request this information by contacting us at 800.344.1770.
|
| Additional Information Phone Number |
800.344.1770
|
| Additional Information Website |
www.artisanpartners.com/prospectus
|
| Expenses [Text Block] |
What
were the Fund costs for the last six months?
(based on a hypothetical $10,000 investment)
| Class
Name |
Costs
of a $10,000 investment |
Costs
paid as a percentage of a $10,000 investment |
| Institutional |
$51 |
1.07% |
| |
|
|
|
| Expenses Paid, Amount |
$ 51
|
| Expense Ratio, Percent |
1.07%
|
| Net Assets |
$ 3,667,060,000
|
| Holdings Count | Holdings |
132
|
| Advisory Fees Paid, Amount |
$ 22,231,000
|
| Investment Company, Portfolio Turnover |
17.20%
|
| Additional Fund Statistics [Text Block] |
| Key
Fund Statistics |
| Dollar
values in thousands |
| Net
Assets |
$3,667,060 |
| Number
of Portfolio Holdings |
132 |
| Total
Investment Advisory Fees (net of waivers and reimbursements) |
| Portfolio
Turnover Rate |
17.20% |
|
| Holdings [Text Block] |
REGION
ALLOCATION
(As
a Percentage of Total Net Assets)
| Region |
|
| Europe |
44.6% |
| Americas |
19.9% |
| Emerging Markets |
7.3% |
| Middle East |
5.9% |
| Pacific Basin |
18.3% |

| TRADING
CURRENCIES | |
| | |
| | |
| | |
| Currency | |
| Percentage of
Total Investments |
| Brazilian real | |
| 1.2 | % |
| British pound | |
| 20.8 | |
| Canadian dollar | |
| 5.2 | |
| Danish krone | |
| 6.5 | |
| Euro | |
| 11.4 | |
| Israel new shekel | |
| 1.0 | |
| Japanese yen | |
| 19.0 | |
| Swedish krona | |
| 3.8 | |
| Swiss franc | |
| 3.7 | |
| U.S. dollar | |
| 25.3 | |
| Other | |
| 2.1 | |
| Total
investments | |
| 100.0 | % |
PORTFOLIO
DIVERSIFICATION
(As
a Percentage of Total Investments)
| Sector |
|
| Consumer Discretionary |
5.3% |
| Consumer Staples |
7.5% |
| Energy |
0.6% |
| Financials |
7.2% |
| Health Care |
26.7% |
| Industrials |
30.3% |
| Information Technology |
18.7% |
| Materials |
2.1% |
| Real Estate |
1.0% |
| Utilities |
0.6% |
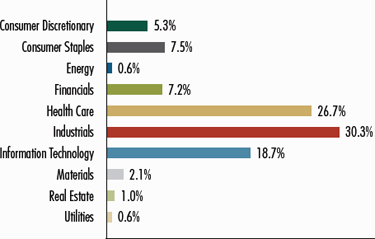
|
| Largest Holdings [Text Block] |
| TOP
TEN HOLDINGS* | |
|
| |
| | |
|
| |
| Company
Name | |
Country |
Percentage of
Total Net Assets |
| ConvaTec Group plc | |
United Kingdom |
3.5 | % |
| Nice Ltd. | |
Israel |
3.0 | |
| Ambu A/S | |
Denmark |
2.4 | |
| Metso Oyj | |
Finland |
2.2 | |
| Swedish Orphan Biovitrum AB | |
Sweden |
2.2 | |
| JET2 plc | |
United Kingdom |
2.0 | |
| WNS Holdings Ltd. | |
India |
1.9 | |
| CAE, Inc. | |
Canada |
1.7 | |
| Azbil Corp. | |
Japan |
1.7 | |
| Rotork plc | |
United Kingdom |
1.7 | |
| Total | |
|
22.3 | % |
| * | | Excludes short-term
investments. |
|
| Artisan International Small-Mid Fund - Investor Shares |
|
| Shareholder Report [Line Items] |
|
| Fund Name |
Artisan
International Small-Mid Fund
|
| Class Name |
Investor Shares
|
| Trading Symbol |
ARTJX
|
| Annual or Semi-Annual Statement [Text Block] |
This semi-annual shareholder report contains important information about Artisan International Small-Mid Fund for the period
of October 1, 2024 to March 31, 2025
|
| Shareholder Report Annual or Semi-Annual |
Semi-Annual
Shareholder Report
|
| Additional Information [Text Block] |
This semi-annual shareholder report contains important information about Artisan International Small-Mid Fund for the period
of October 1, 2024 to March 31, 2025. You can find additional information about the Fund at www.artisanpartners.com/prospectus.
You can also request this information by contacting us at 800.344.1770.
|
| Additional Information Phone Number |
800.344.1770
|
| Additional Information Website |
www.artisanpartners.com/prospectus
|
| Expenses [Text Block] |
What
were the Fund costs for the last six months?
(based on a hypothetical $10,000 investment)
| Class
Name |
Costs
of a $10,000 investment |
Costs
paid as a percentage of a $10,000 investment |
| Investor |
$63 |
1.32% |
| |
|
|
|
| Expenses Paid, Amount |
$ 63
|
| Expense Ratio, Percent |
1.32%
|
| Net Assets |
$ 3,667,060,000
|
| Holdings Count | Holdings |
132
|
| Advisory Fees Paid, Amount |
$ 22,231,000
|
| Investment Company, Portfolio Turnover |
17.20%
|
| Additional Fund Statistics [Text Block] |
| Key
Fund Statistics |
| Dollar
values in thousands |
| Net
Assets |
$3,667,060 |
| Number
of Portfolio Holdings |
132 |
| Total
Investment Advisory Fees (net of waivers and reimbursements) |
$22,231 |
| Portfolio
Turnover Rate |
17.20% |
|
| Holdings [Text Block] |
REGION
ALLOCATION
(As
a Percentage of Total Net Assets)
| Region |
|
| Europe |
44.6% |
| Americas |
19.9% |
| Emerging Markets |
7.3% |
| Middle East |
5.9% |
| Pacific Basin |
18.3% |
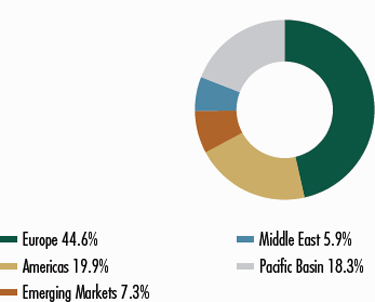
| TRADING
CURRENCIES | |
| | |
| | |
| | |
| Currency | |
| Percentage of
Total Investments |
| Brazilian real | |
| 1.2 | % |
| British pound | |
| 20.8 | |
| Canadian dollar | |
| 5.2 | |
| Danish krone | |
| 6.5 | |
| Euro | |
| 11.4 | |
| Israel new shekel | |
| 1.0 | |
| Japanese yen | |
| 19.0 | |
| Swedish krona | |
| 3.8 | |
| Swiss franc | |
| 3.7 | |
| U.S. dollar | |
| 25.3 | |
| Other | |
| 2.1 | |
| Total
investments | |
| 100.0 | % |
PORTFOLIO
DIVERSIFICATION
(As
a Percentage of Total Investments)
| Sector |
|
| Consumer Discretionary |
5.3% |
| Consumer Staples |
7.5% |
| Energy |
0.6% |
| Financials |
7.2% |
| Health Care |
26.7% |
| Industrials |
30.3% |
| Information Technology |
18.7% |
| Materials |
2.1% |
| Real Estate |
1.0% |
| Utilities |
0.6% |

|
| Largest Holdings [Text Block] |
| TOP
TEN HOLDINGS* | |
|
| |
| | |
|
| |
| Company
Name | |
Country |
Percentage of
Total Net Assets |
| ConvaTec Group plc | |
United Kingdom |
3.5 | % |
| Nice Ltd. | |
Israel |
3.0 | |
| Ambu A/S | |
Denmark |
2.4 | |
| Metso Oyj | |
Finland |
2.2 | |
| Swedish Orphan Biovitrum AB | |
Sweden |
2.2 | |
| JET2 plc | |
United Kingdom |
2.0 | |
| WNS Holdings Ltd. | |
India |
1.9 | |
| CAE, Inc. | |
Canada |
1.7 | |
| Azbil Corp. | |
Japan |
1.7 | |
| Rotork plc | |
United Kingdom |
1.7 | |
| Total | |
|
22.3 | % |
| * | | Excludes short-term
investments. |
|
| Artisan International Value Fund - Advisor Shares |
|
| Shareholder Report [Line Items] |
|
| Fund Name |
Artisan
International Value Fund
|
| Class Name |
Advisor Shares
|
| Trading Symbol |
APDKX
|
| Annual or Semi-Annual Statement [Text Block] |
This semi-annual shareholder report contains important information about Artisan International Value Fund for the period of
October 1, 2024 to March 31, 2025
|
| Shareholder Report Annual or Semi-Annual |
Semi-Annual
Shareholder Report
|
| Additional Information [Text Block] |
This semi-annual shareholder report contains important information about Artisan International Value Fund for the period of
October 1, 2024 to March 31, 2025. You can find additional information about the Fund at www.artisanpartners.com/prospectus.
You can also request this information by contacting us at 800.344.1770.
|
| Additional Information Phone Number |
800.344.1770
|
| Additional Information Website |
www.artisanpartners.com/prospectus
|
| Expenses [Text Block] |
What
were the Fund costs for the last six months?
(based on a hypothetical $10,000 investment)
| Class
Name |
Costs
of a $10,000 investment |
Costs
paid as a percentage of a $10,000 investment |
| Advisor |
$52 |
1.05% |
| |
|
|
|
| Expenses Paid, Amount |
$ 52
|
| Expense Ratio, Percent |
1.05%
|
| Net Assets |
$ 37,064,929,000
|
| Holdings Count | Holdings |
61
|
| Advisory Fees Paid, Amount |
$ 165,177,000
|
| Investment Company, Portfolio Turnover |
7.68%
|
| Additional Fund Statistics [Text Block] |
| Key
Fund Statistics |
| Dollar
values in thousands |
| Net
Assets |
$37,064,929 |
| Number
of Portfolio Holdings |
61 |
| Total
Investment Advisory Fees (net of waivers and reimbursements) |
$165,177 |
| Portfolio
Turnover Rate |
7.68% |
|
| Holdings [Text Block] |
REGION
ALLOCATION
(As
a Percentage of Total Net Assets)
| Region |
|
| Europe |
49.4% |
| Americas |
22.1% |
| Emerging Markets |
13.3% |
| Pacific Basin |
1.3% |
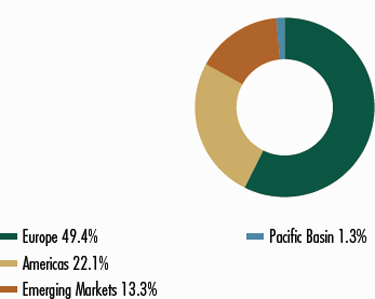
| TRADING
CURRENCIES | |
| | |
| | |
| | |
| Currency | |
| Percentage of
Total Investments |
| British pound | |
| 17.0 | % |
| Canadian dollar | |
| 3.5 | |
| Euro | |
| 20.3 | |
| Hong Kong dollar | |
| 3.4 | |
| Indian rupee | |
| 3.0 | |
| Japanese yen | |
| 1.2 | |
| Korean won | |
| 5.2 | |
| Mexican peso | |
| 0.5 | |
| Swiss franc | |
| 16.5 | |
| U.S. dollar | |
| 29.4 | |
| Total
investments | |
| 100.0 | % |
PORTFOLIO
DIVERSIFICATION
(As
a Percentage of Total Investments)
| Sector |
|
| Communication Services |
2.7% |
| Consumer Discretionary |
13.3% |
| Consumer Staples |
16.4% |
| Energy |
2.0% |
| Financials |
14.4% |
| Health Care |
9.6% |
| Industrials |
15.0% |
| Information Technology |
9.9% |
| Materials |
3.4% |
| Miscellaneous |
0.2% |
| Short-Term Investment |
13.1% |
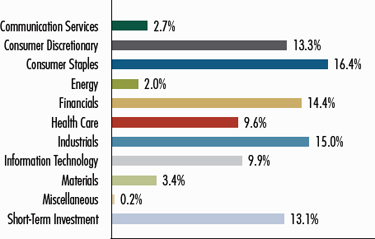
|
| Largest Holdings [Text Block] |
| TOP
TEN HOLDINGS* | |
|
| |
| | |
|
| |
| Company
Name | |
Country |
Percentage of
Total Net Assets |
| Arch Capital Group Ltd. | |
United States |
4.5 | % |
| Unilever plc | |
United Kingdom |
4.2 | |
| ABB Ltd. | |
Switzerland |
3.8 | |
| Novartis AG | |
United States |
3.8 | |
| Koninklijke Philips NV | |
Netherlands |
3.4 | |
| Danone SA (Registered shares) | |
France |
3.4 | |
| Samsung Electronics Co. Ltd. | |
South Korea |
3.0 | |
| HCL Technologies Ltd. | |
India |
2.9 | |
| Safran SA | |
France |
2.9 | |
| Alibaba Group Holding Ltd. | |
China |
2.9 | |
| Total | |
|
34.8 | % |
| * | | Excludes short-term
investments. |
|
| Artisan International Value Fund - Institutional Shares |
|
| Shareholder Report [Line Items] |
|
| Fund Name |
Artisan
International Value Fund
|
| Class Name |
Institutional Shares
|
| Trading Symbol |
APHKX
|
| Annual or Semi-Annual Statement [Text Block] |
This semi-annual shareholder report contains important information about Artisan International Value Fund for the period of
October 1, 2024 to March 31, 2025.
|
| Shareholder Report Annual or Semi-Annual |
Semi-Annual
Shareholder Report
|
| Additional Information [Text Block] |
This semi-annual shareholder report contains important information about Artisan International Value Fund for the period of
October 1, 2024 to March 31, 2025. You can find additional information about the Fund at www.artisanpartners.com/prospectus.
You can also request this information by contacting us at 800.344.1770.
|
| Additional Information Phone Number |
800.344.1770
|
| Additional Information Website |
www.artisanpartners.com/prospectus
|
| Expenses [Text Block] |
What
were the Fund costs for the last six months?
(based on a hypothetical $10,000 investment)
| Class
Name |
Costs
of a $10,000 investment |
Costs
paid as a percentage of a $10,000 investment |
| Institutional |
$47 |
0.95% |
| |
|
|
|
| Expenses Paid, Amount |
$ 47
|
| Expense Ratio, Percent |
0.95%
|
| Net Assets |
$ 37,064,929,000
|
| Holdings Count | Holdings |
61
|
| Advisory Fees Paid, Amount |
$ 165,177,000
|
| Investment Company, Portfolio Turnover |
7.68%
|
| Additional Fund Statistics [Text Block] |
| Key
Fund Statistics |
| Dollar
values in thousands |
| Net
Assets |
$37,064,929 |
| Number
of Portfolio Holdings |
61 |
| Total
Investment Advisory Fees (net of waivers and reimbursements) |
$165,177 |
| Portfolio
Turnover Rate |
7.68% |
|
| Holdings [Text Block] |
REGION
ALLOCATION
(As
a Percentage of Total Net Assets)
| Region |
|
| Europe |
49.4% |
| Americas |
22.1% |
| Emerging Markets |
13.3% |
| Pacific Basin |
1.3% |
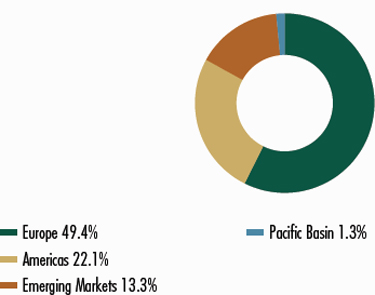
| TRADING
CURRENCIES | |
| | |
| | |
| | |
| Currency | |
| Percentage of
Total Investments |
| British pound | |
| 17.0 | % |
| Canadian dollar | |
| 3.5 | |
| Euro | |
| 20.3 | |
| Hong Kong dollar | |
| 3.4 | |
| Indian rupee | |
| 3.0 | |
| Japanese yen | |
| 1.2 | |
| Korean won | |
| 5.2 | |
| Mexican peso | |
| 0.5 | |
| Swiss franc | |
| 16.5 | |
| U.S. dollar | |
| 29.4 | |
| Total
investments | |
| 100.0 | % |
PORTFOLIO
DIVERSIFICATION
(As
a Percentage of Total Investments)
| Sector |
|
| Communication Services |
2.7% |
| Consumer Discretionary |
13.3% |
| Consumer Staples |
16.4% |
| Energy |
2.0% |
| Financials |
14.4% |
| Health Care |
9.6% |
| Industrials |
15.0% |
| Information Technology |
9.9% |
| Materials |
3.4% |
| Miscellaneous |
0.2% |
| Short-Term Investment |
13.1% |
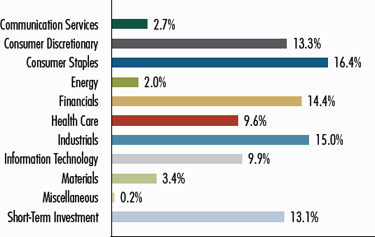
|
| Largest Holdings [Text Block] |
| TOP
TEN HOLDINGS* | |
|
| |
| | |
|
| |
| Company
Name | |
Country |
Percentage of
Total Net Assets |
| Arch Capital Group Ltd. | |
United States |
4.5 | % |
| Unilever plc | |
United Kingdom |
4.2 | |
| ABB Ltd. | |
Switzerland |
3.8 | |
| Novartis AG | |
United States |
3.8 | |
| Koninklijke Philips NV | |
Netherlands |
3.4 | |
| Danone SA (Registered shares) | |
France |
3.4 | |
| Samsung Electronics Co. Ltd. | |
South Korea |
3.0 | |
| HCL Technologies Ltd. | |
India |
2.9 | |
| Safran SA | |
France |
2.9 | |
| Alibaba Group Holding Ltd. | |
China |
2.9 | |
| Total | |
|
34.8 | % |
| * | | Excludes short-term
investments. |
|
| Artisan International Value Fund - Investor Shares |
|
| Shareholder Report [Line Items] |
|
| Fund Name |
Artisan International Value Fund
|
| Class Name |
Investor Shares
|
| Trading Symbol |
ARTKX
|
| Annual or Semi-Annual Statement [Text Block] |
This semi-annual shareholder report contains important information
about Artisan International Value Fund for the period of October 1,
2024 to March 31, 2025.
|
| Shareholder Report Annual or Semi-Annual |
Semi-Annual
Shareholder Report
|
| Additional Information [Text Block] |
This semi-annual shareholder report contains important information
about Artisan International Value Fund for the period of October 1,
2024 to March 31, 2025. You can find additional information about
the Fund at www.artisanpartners.com/prospectus. You can also request
Artisan International Value Fund this information by contacting us at 800.344.1770.
|
| Additional Information Phone Number |
800.344.1770
|
| Additional Information Website |
www.artisanpartners.com/prospectus
|
| Expenses [Text Block] |
What
were the Fund costs for the last six months?
(based
on a hypothetical $10,000 investment)
| Class
Name |
Costs
of a $10,000 investment |
Costs
paid as a percentage of a $10,000 investment |
| Investor |
$59 |
1.18% |
| |
|
|
|
| Expenses Paid, Amount |
$ 59
|
| Expense Ratio, Percent |
1.18%
|
| Net Assets |
$ 37,064,929,000
|
| Holdings Count | Holdings |
61
|
| Advisory Fees Paid, Amount |
$ 165,177,000
|
| Investment Company, Portfolio Turnover |
7.68%
|
| Additional Fund Statistics [Text Block] |
| Key
Fund Statistics |
| Dollar
values in thousands |
| Net
Assets |
$37,064,929 |
| Number
of Portfolio Holdings |
61 |
| Total
Investment Advisory Fees (net of waivers and reimbursements) |
$165,177 |
| Portfolio
Turnover Rate |
7.68% |
|
| Holdings [Text Block] |
REGION
ALLOCATION
(As
a Percentage of Total Net Assets)
| Region |
|
| Europe |
49.4% |
| Americas |
22.1% |
| Emerging Markets |
13.3% |
| Pacific Basin |
1.3% |
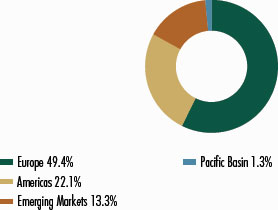
| TRADING
CURRENCIES | |
| | |
| | |
| | |
| Currency | |
Percentage of
Total Investments
|
| British
pound | |
| 17.0 | % |
| Canadian
dollar | |
| 3.5 | |
| Euro | |
| 20.3 | |
| Hong
Kong dollar | |
| 3.4 | |
| Indian
rupee | |
| 3.0 | |
| Japanese
yen | |
| 1.2 | |
| Korean
won | |
| 5.2 | |
| Mexican
peso | |
| 0.5 | |
| Swiss
franc | |
| 16.5 | |
| U.S.
dollar | |
| 29.4 | |
| Total
investments | |
| 100.0 | % |
PORTFOLIO
DIVERSIFICATION
(As
a Percentage of Total Investments)
| Sector |
|
| Communication Services |
2.7% |
| Consumer Discretionary |
13.3% |
| Consumer Staples |
16.4% |
| Energy |
2.0% |
| Financials |
14.4% |
| Health Care |
9.6% |
| Industrials |
15.0% |
| Information Technology |
9.9% |
| Materials |
3.4% |
| Miscellaneous |
0.2% |
| Short-Term Investment |
13.1% |

|
| Largest Holdings [Text Block] |
| TOP
TEN HOLDINGS* | |
|
| |
| | |
|
| |
| Company
Name | |
Country |
Percentage of
Total Net Assets |
| Arch
Capital Group Ltd. | |
United
States |
4.5 | % |
| Unilever
plc | |
United Kingdom |
4.2 | |
| ABB
Ltd. | |
Switzerland |
3.8 | |
| Novartis
AG | |
United
States |
3.8 | |
| Koninklijke
Philips NV | |
Netherlands |
3.4 | |
| Danone
SA (Registered shares) | |
France |
3.4 | |
| Samsung
Electronics Co. Ltd. | |
South
Korea |
3.0 | |
| HCL
Technologies Ltd. | |
India |
2.9 | |
| Safran
SA | |
France |
2.9 | |
| Alibaba
Group Holding Ltd. | |
China |
2.9 | |
| Total | |
|
34.8 | % |
| * | | Excludes short-term
investments. |
|
| Artisan Mid Cap Fund - Advisor Shares |
|
| Shareholder Report [Line Items] |
|
| Fund Name |
Artisan
Mid Cap Fund
|
| Class Name |
Advisor Shares
|
| Trading Symbol |
APDMX
|
| Annual or Semi-Annual Statement [Text Block] |
This
semi-annual shareholder report contains important information about Artisan Mid Cap Fund
for the period of October 1, 2024 to March 31, 2025.
|
| Shareholder Report Annual or Semi-Annual |
Semi-Annual
Shareholder Report
|
| Additional Information [Text Block] |
This
semi-annual shareholder report contains important information about Artisan Mid Cap Fund
for the period of October 1, 2024 to March 31, 2025. You can find additional information
about the Fund at www.artisanpartners.com/prospectus . You can also request this information
by contacting us at 800.344.1770 . This report describes changes to the Fund that
occurred during the reporting period.
|
| Material Fund Change Notice [Text Block] |
This report describes changes to the Fund that
occurred during the reporting period.
|
| Additional Information Phone Number |
800.344.1770
|
| Additional Information Website |
www.artisanpartners.com/prospectus
|
| Expenses [Text Block] |
What
were the Fund costs for the last six months?
(based
on a hypothetical $10,000 investment)
| Class
Name |
Costs
of a $10,000 investment |
Costs
paid as a percentage of a $10,000 investment |
| Advisor |
$52 |
1.06% |
| |
|
|
|
| Expenses Paid, Amount |
$ 52
|
| Expense Ratio, Percent |
1.06%
|
| Net Assets |
$ 3,585,511,000
|
| Holdings Count | Holdings |
64
|
| Advisory Fees Paid, Amount |
$ 19,643,000
|
| Investment Company, Portfolio Turnover |
31.29%
|
| Additional Fund Statistics [Text Block] |
| Key
Fund Statistics |
| Dollar
values in thousands |
| Net
Assets |
$3,585,511 |
| Number
of Portfolio Holdings |
64 |
| Total
Investment Advisory Fees (net of waivers and reimbursements) |
$19,643 |
| Portfolio
Turnover Rate |
31.29% |
|
| Holdings [Text Block] |
REGION
ALLOCATION 87.4% 9.2%
(As
a Percentage of Total Net Assets)
| Region |
|
| Americas |
87.4% |
| Europe |
9.2% |

| TRADING
CURRENCIES | |
| | |
| | |
| | |
| Currency | |
Percentage of
Total Investments
|
| U.S. dollar | |
| 100.0 | % |
| Total
investments | |
| 100.0 | % |
PORTFOLIO
DIVERSIFICATION
(As
a Percentage of Total Investments)
| Sector |
|
| Communication Services |
10.4% |
| Consumer Discretionary |
11.8% |
| Consumer Staples |
1.6% |
| Energy |
2.5% |
| Financials |
6.6% |
| Health Care |
22.5% |
| Industrials |
10.0% |
| Information Technology |
31.5% |
| Real Estate |
1.5% |
| Short-Term Investment |
1.6% |
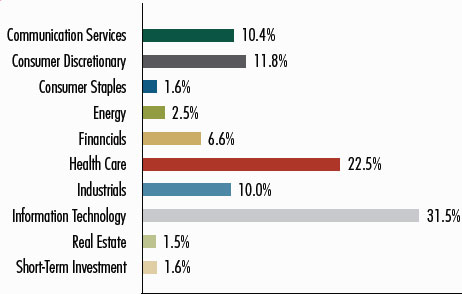
|
| Largest Holdings [Text Block] |
| TOP
TEN HOLDINGS* | |
|
| |
| | |
|
| |
| Company
Name | |
Country |
Percentage of
Total Net Assets |
| Argenx SE | |
Netherlands |
5.1 | % |
| Ascendis Pharma A/S | |
Denmark |
4.1 | |
| Tyler Technologies, Inc. | |
United States |
3.7 | |
| Spotify Technology SA | |
United
States |
3.4 | |
| West Pharmaceutical Services, Inc. | |
United States |
2.8 | |
| Lattice Semiconductor Corp. | |
United States |
2.5 | |
| Live Nation Entertainment, Inc. | |
United States |
2.5 | |
| Baker Hughes Co. | |
United States |
2.5 | |
| Atlassian Corp. | |
United States |
2.4 | |
| DoorDash, Inc. | |
United States |
2.3 | |
| Total | |
|
31.3 | % |
| * | | Excludes short-term
investments. |
|
| Material Fund Change [Text Block] |
This
is a summary of certain changes of the Fund since September 30, 2024. Effective December
31, 2024, Craigh Cepukenas stepped down as portfolio manager of the Fund. Mr. Cepukenas
will remain an active member of the Artisan Partners Growth Team in an advisory capacity
as a managing director. Effective January 1, 2025, Matthew Kamm and Jason White became
co-lead portfolio managers of the Fund. For more information, you may review the Fund’s
current prospectus, which is available at www.artisanpartners.com/prospectus or upon
request by calling 800.344.1770.
|
| Summary of Change Legend [Text Block] |
This
is a summary of certain changes of the Fund since September 30, 2024. Effective December
31, 2024, Craigh Cepukenas stepped down as portfolio manager of the Fund. Mr. Cepukenas
will remain an active member of the Artisan Partners Growth Team in an advisory capacity
as a managing director. Effective January 1, 2025, Matthew Kamm and Jason White became
co-lead portfolio managers of the Fund.
|
| Updated Prospectus Phone Number |
800.344.1770
|
| Updated Prospectus Web Address |
www.artisanpartners.com/prospectus
|
| Artisan Mid Cap Fund - Institutional Shares |
|
| Shareholder Report [Line Items] |
|
| Fund Name |
Artisan
Mid Cap Fund
|
| Class Name |
Institutional Shares
|
| Trading Symbol |
APHMX
|
| Annual or Semi-Annual Statement [Text Block] |
This
semi-annual shareholder report contains important information about Artisan Mid Cap Fund
for the period of October 1, 2024 to March 31, 2025.
|
| Shareholder Report Annual or Semi-Annual |
Semi-Annual
Shareholder Report
|
| Additional Information [Text Block] |
This
semi-annual shareholder report contains important information about Artisan Mid Cap Fund
for the period of October 1, 2024 to March 31, 2025. You can find additional information
about the Fund at www.artisanpartners.com/prospectus . You can also request this information
by contacting us at 800.344.1770 . This report describes changes to the Fund that
occurred during the reporting period.
|
| Material Fund Change Notice [Text Block] |
This report describes changes to the Fund that
occurred during the reporting period.
|
| Additional Information Phone Number |
800.344.1770
|
| Additional Information Website |
www.artisanpartners.com/prospectus
|
| Expenses [Text Block] |
What
were the Fund costs for the last six months?
(based
on a hypothetical $10,000 investment)
| Class
Name |
Costs
of a $10,000 investment |
Costs
paid as a percentage of a $10,000 investment |
| Institutional |
$47 |
0.96% |
| |
|
|
|
| Expenses Paid, Amount |
$ 47
|
| Expense Ratio, Percent |
0.96%
|
| Net Assets |
$ 3,585,511,000
|
| Holdings Count | Holdings |
64
|
| Advisory Fees Paid, Amount |
$ 19,643,000
|
| Investment Company, Portfolio Turnover |
31.29%
|
| Additional Fund Statistics [Text Block] |
| Key
Fund Statistics |
| Dollar
values in thousands |
| Net
Assets |
$3,585,511 |
| Number
of Portfolio Holdings |
64 |
| Total
Investment Advisory Fees (net of waivers and reimbursements) |
$19,643 |
| Portfolio
Turnover Rate |
31.29% |
|
| Holdings [Text Block] |
REGION
ALLOCATION
(As
a Percentage of Total Net Assets)
| Region |
|
| Americas |
87.4% |
| Europe |
9.2% |

| TRADING
CURRENCIES | |
| | |
| | |
| | |
| Currency | |
Percentage of
Total Investments
|
| U.S. dollar | |
| 100.0 | % |
| Total
investments | |
| 100.0 | % |
PORTFOLIO
DIVERSIFICATION
(As
a Percentage of Total Investments)
| Sector |
|
| Communication Services |
10.4% |
| Consumer Discretionary |
11.8% |
| Consumer Staples |
1.6% |
| Energy |
2.5% |
| Financials |
6.6% |
| Health Care |
22.5% |
| Industrials |
10.0% |
| Information Technology |
31.5% |
| Real Estate |
1.5% |
| Short-Term Investment |
1.6% |
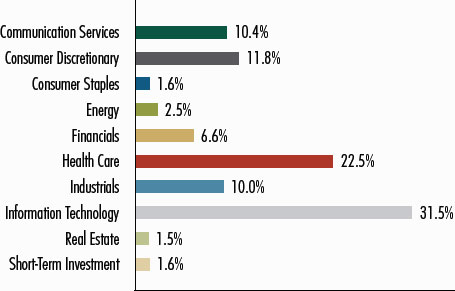
|
| Largest Holdings [Text Block] |
| TOP
TEN HOLDINGS* | |
|
| |
| | |
|
| |
| Company
Name | |
Country |
Percentage of
Total Net Assets |
| Argenx SE | |
Netherlands |
5.1 | % |
| Ascendis Pharma A/S | |
Denmark |
4.1 | |
| Tyler Technologies, Inc. | |
United States |
3.7 | |
| Spotify Technology SA | |
United
States |
3.4 | |
| West Pharmaceutical Services, Inc. | |
United States |
2.8 | |
| Lattice Semiconductor Corp. | |
United States |
2.5 | |
| Live Nation Entertainment, Inc. | |
United States |
2.5 | |
| Baker Hughes Co. | |
United States |
2.5 | |
| Atlassian Corp. | |
United States |
2.4 | |
| DoorDash, Inc. | |
United States |
2.3 | |
| Total | |
|
31.3 | % |
| * | | Excludes short-term
investments. |
|
| Material Fund Change [Text Block] |
This
is a summary of certain changes of the Fund since September 30, 2024. Effective December
31, 2024, Craigh Cepukenas stepped down as portfolio manager of the Fund. Mr. Cepukenas
will remain an active member of the Artisan Partners Growth Team in an advisory capacity
as a managing director. Effective January 1, 2025, Matthew Kamm and Jason White became
co-lead portfolio managers of the Fund. For more information, you may review the Fund’s
current prospectus, which is available at www.artisanpartners.com/prospectus or upon
request by calling 800.344.1770.
|
| Summary of Change Legend [Text Block] |
This
is a summary of certain changes of the Fund since September 30, 2024. Effective December
31, 2024, Craigh Cepukenas stepped down as portfolio manager of the Fund. Mr. Cepukenas
will remain an active member of the Artisan Partners Growth Team in an advisory capacity
as a managing director. Effective January 1, 2025, Matthew Kamm and Jason White became
co-lead portfolio managers of the Fund.
|
| Updated Prospectus Phone Number |
800.344.1770
|
| Updated Prospectus Web Address |
www.artisanpartners.com/prospectus
|
| Artisan Mid Cap Fund - Investor Shares |
|
| Shareholder Report [Line Items] |
|
| Fund Name |
Artisan
Mid Cap Fund
|
| Class Name |
Investor Shares
|
| Trading Symbol |
ARTMX
|
| Annual or Semi-Annual Statement [Text Block] |
This
semi-annual shareholder report contains important information about Artisan Mid Cap Fund
for the period of October 1, 2024 to March 31, 2025.
|
| Shareholder Report Annual or Semi-Annual |
Semi-Annual
Shareholder Report
|
| Additional Information [Text Block] |
This
semi-annual shareholder report contains important information about Artisan Mid Cap Fund
for the period of October 1, 2024 to March 31, 2025. You can find additional information
about the Fund at www.artisanpartners.com/prospectus . You can also request this information
by contacting us at 800.344.1770 . This report describes changes to the Fund that
occurred during the reporting period.
|
| Material Fund Change Notice [Text Block] |
This report describes changes to the Fund that
occurred during the reporting period.
|
| Additional Information Phone Number |
800.344.1770
|
| Additional Information Website |
www.artisanpartners.com/prospectus
|
| Expenses [Text Block] |
What
were the Fund costs for the last six months?
(based
on a hypothetical $10,000 investment)
| Class
Name |
Costs
of a $10,000 investment |
Costs
paid as a percentage of a $10,000 investment |
| Investor |
$59 |
1.20% |
| |
|
|
|
| Expenses Paid, Amount |
$ 59
|
| Expense Ratio, Percent |
1.20%
|
| Net Assets |
$ 3,585,511,000
|
| Holdings Count | Holdings |
64
|
| Advisory Fees Paid, Amount |
$ 19,643,000
|
| Investment Company, Portfolio Turnover |
31.29%
|
| Additional Fund Statistics [Text Block] |
| Key
Fund Statistics |
| Dollar
values in thousands |
| Net
Assets |
$3,585,511 |
| Number
of Portfolio Holdings |
64 |
| Total
Investment Advisory Fees (net of waivers and reimbursements) |
$19,643 |
| Portfolio
Turnover Rate |
31.29% |
|
| Holdings [Text Block] |
REGION
ALLOCATION
(As
a Percentage of Total Net Assets)
| Region |
|
| Americas |
87.4% |
| Europe |
9.2% |
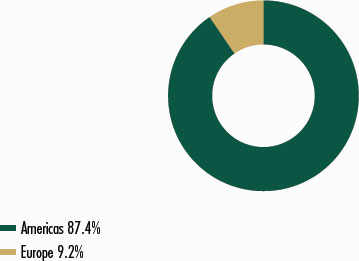
| TRADING
CURRENCIES | |
| | |
| | |
| | |
| Currency | |
Percentage of
Total Investments
|
| U.S. dollar | |
| 100.0 | % |
| Total
investments | |
| 100.0 | % |
PORTFOLIO
DIVERSIFICATION
(As
a Percentage of Total Investments)
| Sector |
|
| Communication Services |
10.4% |
| Consumer Discretionary |
11.8% |
| Consumer Staples |
1.6% |
| Energy |
2.5% |
| Financials |
6.6% |
| Health Care |
22.5% |
| Industrials |
10.0% |
| Information Technology |
31.5% |
| Real Estate |
1.5% |
| Short-Term Investment |
1.6% |
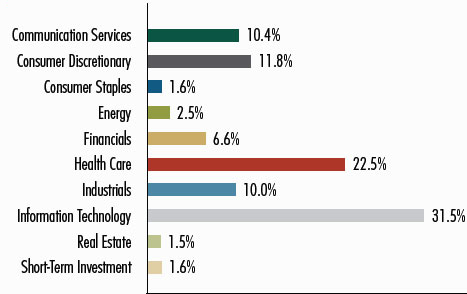
|
| Largest Holdings [Text Block] |
| TOP
TEN HOLDINGS* | |
|
| |
| | |
|
| |
| Company
Name | |
Country |
Percentage of
Total Net Assets |
| Argenx SE | |
Netherlands |
5.1 | % |
| Ascendis Pharma A/S | |
Denmark |
4.1 | |
| Tyler Technologies, Inc. | |
United States |
3.7 | |
| Spotify Technology SA | |
United
States |
3.4 | |
| West Pharmaceutical Services, Inc. | |
United States |
2.8 | |
| Lattice Semiconductor Corp. | |
United States |
2.5 | |
| Live Nation Entertainment, Inc. | |
United States |
2.5 | |
| Baker Hughes Co. | |
United States |
2.5 | |
| Atlassian Corp. | |
United States |
2.4 | |
| DoorDash, Inc. | |
United States |
2.3 | |
| Total | |
|
31.3 | % |
| * | | Excludes short-term
investments. |
|
| Material Fund Change [Text Block] |
This
is a summary of certain changes of the Fund since September 30, 2024. Effective December
31, 2024, Craigh Cepukenas stepped down as portfolio manager of the Fund. Mr. Cepukenas
will remain an active member of the Artisan Partners Growth Team in an advisory capacity
as a managing director. Effective January 1, 2025, Matthew Kamm and Jason White became
co-lead portfolio managers of the Fund. For more information, you may review the Fund’s
current prospectus, which is available at www.artisanpartners.com/prospectus or upon
request by calling 800.344.1770.
|
| Summary of Change Legend [Text Block] |
This
is a summary of certain changes of the Fund since September 30, 2024. Effective December
31, 2024, Craigh Cepukenas stepped down as portfolio manager of the Fund. Mr. Cepukenas
will remain an active member of the Artisan Partners Growth Team in an advisory capacity
as a managing director. Effective January 1, 2025, Matthew Kamm and Jason White became
co-lead portfolio managers of the Fund.
|
| Updated Prospectus Phone Number |
800.344.1770
|
| Updated Prospectus Web Address |
www.artisanpartners.com/prospectus
|
| Artisan Mid Cap Value Fund - Advisor Shares |
|
| Shareholder Report [Line Items] |
|
| Fund Name |
Artisan
Mid Cap Value Fund
|
| Class Name |
Advisor Shares
|
| Trading Symbol |
APDQX
|
| Annual or Semi-Annual Statement [Text Block] |
This
semi-annual shareholder report contains important information about Artisan Mid Cap Value Fund for the period of October 1, 2024
to March 31, 2025.
|
| Shareholder Report Annual or Semi-Annual |
Semi-Annual
Shareholder Report
|
| Additional Information [Text Block] |
This
semi-annual shareholder report contains important information about Artisan Mid Cap Value Fund for the period of October 1, 2024
to March 31, 2025. You can find additional information about the Fund at www.artisanpartners.com/prospectus . You can also request
this information by contacting us at 800.344.1770.
|
| Additional Information Phone Number |
800.344.1770
|
| Additional Information Website |
www.artisanpartners.com/prospectus
|
| Expenses [Text Block] |
What
were the Fund costs for the last six months?
(based
on a hypothetical $10,000 investment)
| Class
Name |
Costs
of a $10,000 investment |
Costs
paid as a percentage of a $10,000 investment |
| Advisor |
$52 |
1.07% |
| |
|
|
|
| Expenses Paid, Amount |
$ 52
|
| Expense Ratio, Percent |
1.07%
|
| Net Assets |
$ 1,049,411,000
|
| Holdings Count | Holdings |
50
|
| Advisory Fees Paid, Amount |
$ 4,996,000
|
| Investment Company, Portfolio Turnover |
18.18%
|
| Additional Fund Statistics [Text Block] |
| Key
Fund Statistics |
| Dollar
values in thousands |
| Net
Assets |
$1,049,411 |
| Number
of Portfolio Holdings |
50 |
| Total
Investment Advisory Fees (net of waivers and reimbursements) |
$4,996 |
| Portfolio
Turnover Rate |
18.18% |
|
| Holdings [Text Block] |
PORTFOLIO COMPOSITION
(As
a Percentage of Total Net Assets)
| Type |
|
| Common Stocks |
98.1% |
| Other assets less liabilities |
1.9% |
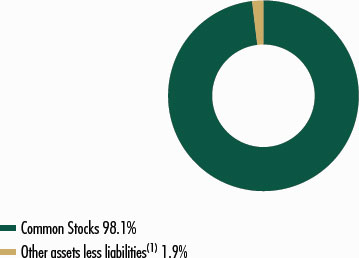
| (1) | Includes
any short-term investments and net other assets (liabilities). |
| TRADING
CURRENCIES | |
| | |
| | |
| | |
| Currency | |
Percentage of
Total Investments
|
| U.S. dollar | |
| 100.0 | % |
| Total
investments | |
| 100.0 | % |
PORTFOLIO
DIVERSIFICATION
(As
a Percentage of Total Investments)
| Sector |
|
| Communication Services |
10.4% |
| Consumer Discretionary |
14.1% |
| Consumer Staples |
8.9% |
| Energy |
4.4% |
| Financials |
14.4% |
| Health Care |
12.5% |
| Industrials |
12.6% |
| Information Technology |
8.0% |
| Real Estate |
8.1% |
| Utilities |
5.6% |
| Short-Term Investment |
1.0% |
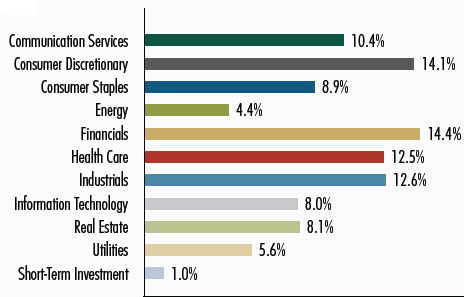
|
| Largest Holdings [Text Block] |
| TOP
TEN HOLDINGS* | |
|
| |
| | |
|
| |
| Company
Name | |
Country |
Percentage of
Total Net Assets |
| Genpact Ltd. | |
United States |
3.4 | % |
| First Citizens BancShares, Inc. | |
United States |
3.2 | |
| U-Haul Holding Co. | |
United States |
3.1 | |
| OGE Energy Corp. | |
United
States |
3.0 | |
| Lamar Advertising Co. | |
United States |
3.0 | |
| Kroger Co. (The) | |
United States |
2.9 | |
| Vontier Corp. | |
United States |
2.9 | |
| Expedia Group, Inc. | |
United States |
2.8 | |
| Globe Life, Inc. | |
United States |
2.7 | |
| Alliant Energy Corp. | |
United States |
2.5 | |
| Total | |
|
29.5 | % |
| * | | Excludes short-term
investments. |
|
| Artisan Mid Cap Value Fund - Institutional Shares |
|
| Shareholder Report [Line Items] |
|
| Fund Name |
Artisan
Mid Cap Value Fund
|
| Class Name |
Institutional Shares
|
| Trading Symbol |
APHQX
|
| Annual or Semi-Annual Statement [Text Block] |
This
semi-annual shareholder report contains important information about Artisan Mid Cap Value Fund for the period of October 1, 2024
to March 31, 2025.
|
| Shareholder Report Annual or Semi-Annual |
Semi-Annual
Shareholder Report
|
| Additional Information [Text Block] |
This
semi-annual shareholder report contains important information about Artisan Mid Cap Value Fund for the period of October 1, 2024
to March 31, 2025. You can find additional information about the Fund at www.artisanpartners.com/prospectus . You can also request
this information by contacting us at 800.344.1770.
|
| Additional Information Phone Number |
800.344.1770
|
| Additional Information Website |
www.artisanpartners.com/prospectus
|
| Expenses [Text Block] |
What
were the Fund costs for the last six months?
(based
on a hypothetical $10,000 investment)
| Class
Name |
Costs
of a $10,000 investment |
Costs
paid as a percentage of a $10,000 investment |
| Institutional |
$46 |
0.95% |
| |
|
|
|
| Expenses Paid, Amount |
$ 46
|
| Expense Ratio, Percent |
0.95%
|
| Net Assets |
$ 1,049,411,000
|
| Holdings Count | Holdings |
50
|
| Advisory Fees Paid, Amount |
$ 4,996,000
|
| Investment Company, Portfolio Turnover |
18.18%
|
| Additional Fund Statistics [Text Block] |
| Key
Fund Statistics |
| Dollar
values in thousands |
| Net
Assets |
$1,049,411 |
| Number
of Portfolio Holdings |
50 |
| Total
Investment Advisory Fees (net of waivers and reimbursements) |
$4,996 |
| Portfolio
Turnover Rate |
18.18% |
|
| Holdings [Text Block] |
PORTFOLIO COMPOSITION 98.1% 1.9%
(As
a Percentage of Total Net Assets)
| Type |
|
| Common Stocks |
98.1% |
| Other assets less liabilities |
1.9% |

| (1) | Includes
any short-term investments and net other assets (liabilities). |
| TRADING
CURRENCIES | |
| | |
| | |
| | |
| Currency | |
Percentage of
Total Investments
|
| U.S. dollar | |
| 100.0 | % |
| Total
investments | |
| 100.0 | % |
PORTFOLIO
DIVERSIFICATION
(As
a Percentage of Total Investments)
| Sector |
|
| Communication Services |
10.4% |
| Consumer Discretionary |
14.1% |
| Consumer Staples |
8.9% |
| Energy |
4.4% |
| Financials |
14.4% |
| Health Care |
12.5% |
| Industrials |
12.6% |
| Information Technology |
8.0% |
| Real Estate |
8.1% |
| Utilities |
5.6% |
| Short-Term Investment |
1.0% |
| |
investments |
| |
10.4% |
| |
14.1% |
| |
8.9% |
| |
4.4% |
| |
14.4% |
| |
12.5% |
| |
12.6% |
| |
8.0% |
| |
8.1% |
| 1.0% |
5.6% |
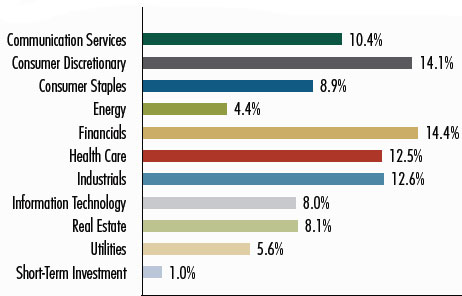
|
| Largest Holdings [Text Block] |
| TOP
TEN HOLDINGS* | |
|
| |
| | |
|
| |
| Company
Name | |
Country |
Percentage of
Total Net Assets |
| Genpact Ltd. | |
United States |
3.4 | % |
| First Citizens BancShares, Inc. | |
United States |
3.2 | |
| U-Haul Holding Co. | |
United States |
3.1 | |
| OGE Energy Corp. | |
United
States |
3.0 | |
| Lamar Advertising Co. | |
United States |
3.0 | |
| Kroger Co. (The) | |
United States |
2.9 | |
| Vontier Corp. | |
United States |
2.9 | |
| Expedia Group, Inc. | |
United States |
2.8 | |
| Globe Life, Inc. | |
United States |
2.7 | |
| Alliant Energy Corp. | |
United States |
2.5 | |
| Total | |
|
29.5 | % |
| * | | Excludes short-term
investments. |
|
| Artisan Mid Cap Value Fund - Investor Shares |
|
| Shareholder Report [Line Items] |
|
| Fund Name |
Artisan
Mid Cap Value Fund
|
| Class Name |
Investor Shares
|
| Trading Symbol |
ARTQX
|
| Annual or Semi-Annual Statement [Text Block] |
This
semi-annual shareholder report contains important information about Artisan Mid Cap Value Fund for the period of October 1, 2024
to March 31, 2025.
|
| Shareholder Report Annual or Semi-Annual |
Semi-Annual
Shareholder Report
|
| Additional Information [Text Block] |
This
semi-annual shareholder report contains important information about Artisan Mid Cap Value Fund for the period of October 1, 2024
to March 31, 2025. You can find additional information about the Fund at www.artisanpartners.com/prospectus . You can also request
this information by contacting us at 800.344.1770.
|
| Additional Information Phone Number |
800.344.1770
|
| Additional Information Website |
www.artisanpartners.com/prospectus
|
| Expenses [Text Block] |
What
were the Fund costs for the last six months?
(based
on a hypothetical $10,000 investment)
| Class
Name |
Costs
of a $10,000 investment |
Costs
paid as a percentage of a $10,000 investment |
| Investor |
$57 |
1.18% |
| |
|
|
|
| Expenses Paid, Amount |
$ 57
|
| Expense Ratio, Percent |
1.18%
|
| Net Assets |
$ 1,049,411,000
|
| Holdings Count | Holdings |
50
|
| Advisory Fees Paid, Amount |
$ 4,996,000
|
| Investment Company, Portfolio Turnover |
18.18%
|
| Additional Fund Statistics [Text Block] |
| Key
Fund Statistics |
| Dollar
values in thousands |
| Net
Assets |
$1,049,411 |
| Number
of Portfolio Holdings |
50 |
| Total
Investment Advisory Fees (net of waivers and reimbursements) |
$4,996 |
| Portfolio
Turnover Rate |
18.18% |
|
| Holdings [Text Block] |
PORTFOLIO COMPOSITION 98.1% 1.9%
(As
a Percentage of Total Net Assets)
| Type |
|
| Common Stocks |
98.1% |
| Other assets less liabilities |
1.9% |

| (1) | Includes
any short-term investments and net other assets (liabilities). |
| TRADING
CURRENCIES | |
| | |
| | |
| | |
| Currency | |
Percentage of
Total Investments
|
| U.S. dollar | |
| 100.0 | % |
| Total
investments | |
| 100.0 | % |
PORTFOLIO
DIVERSIFICATION
(As
a Percentage of Total Investments)
| Sector |
|
| Communication Services |
10.4% |
| Consumer Discretionary |
14.1% |
| Consumer Staples |
8.9% |
| Energy |
4.4% |
| Financials |
14.4% |
| Health Care |
12.5% |
| Industrials |
12.6% |
| Information Technology |
8.0% |
| Real Estate |
8.1% |
| Utilities |
5.6% |
| Short-Term Investment |
1.0% |
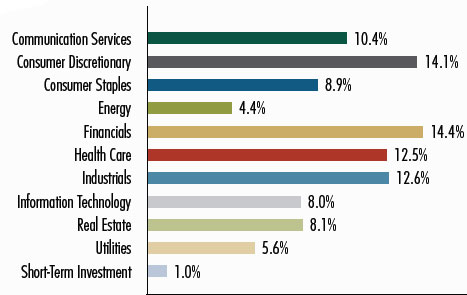
|
| Largest Holdings [Text Block] |
| TOP
TEN HOLDINGS* | |
|
| |
| | |
|
| |
| Company
Name | |
Country |
Percentage of
Total Net Assets |
| Genpact Ltd. | |
United States |
3.4 | % |
| First Citizens BancShares, Inc. | |
United States |
3.2 | |
| U-Haul Holding Co. | |
United States |
3.1 | |
| OGE Energy Corp. | |
United
States |
3.0 | |
| Lamar Advertising Co. | |
United States |
3.0 | |
| Kroger Co. (The) | |
United States |
2.9 | |
| Vontier Corp. | |
United States |
2.9 | |
| Expedia Group, Inc. | |
United States |
2.8 | |
| Globe Life, Inc. | |
United States |
2.7 | |
| Alliant Energy Corp. | |
United States |
2.5 | |
| Total | |
|
29.5 | % |
| * | | Excludes short-term
investments. |
|
| Artisan Select Equity Fund - Advisor Shares |
|
| Shareholder Report [Line Items] |
|
| Fund Name |
Artisan
Select Equity Fund
|
| Class Name |
Advisor Shares
|
| Trading Symbol |
APDNX
|
| Annual or Semi-Annual Statement [Text Block] |
This
semi-annual shareholder report contains important information about Artisan Select Equity Fund for the period of October 1, 2024
to March 31, 2025.
|
| Shareholder Report Annual or Semi-Annual |
Semi-Annual
Shareholder Report
|
| Additional Information [Text Block] |
This
semi-annual shareholder report contains important information about Artisan Select Equity Fund for the period of October 1, 2024
to March 31, 2025. You can find additional information about the Fund at www.artisanpartners.com/prospectus . You can also request
this information by contacting us at 800.344.1770.
|
| Additional Information Phone Number |
800.344.1770
|
| Additional Information Website |
www.artisanpartners.com/prospectus
|
| Expenses [Text Block] |
What
were the Fund costs for the last six months?
(based
on a hypothetical $10,000 investment)
| Class
Name |
Costs
of a $10,000 investment |
Costs
paid as a percentage of a $10,000 investment |
| Advisor |
$59 |
1.15% |
| |
|
|
|
| Expenses Paid, Amount |
$ 59
|
| Expense Ratio, Percent |
1.15%
|
| Net Assets |
$ 58,663,000
|
| Holdings Count | Holdings |
29
|
| Advisory Fees Paid, Amount |
$ 150,000
|
| Investment Company, Portfolio Turnover |
16.24%
|
| Additional Fund Statistics [Text Block] |
| Key
Fund Statistics |
| Dollar
values in thousands |
| Net
Assets |
$58,663 |
| Number
of Portfolio Holdings |
29 |
| Total
Investment Advisory Fees (net of waivers and reimbursements) |
$150 |
| Portfolio
Turnover Rate |
16.24% |
|
| Holdings [Text Block] |
REGION
ALLOCATION
(As
a Percentage of Total Net Assets)
| Region |
|
| Americas |
80.6% |
| Europe |
4.4% |
| Emerging Markets |
5.2% |
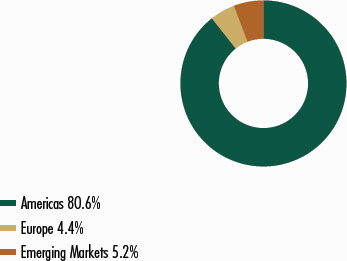
| TRADING
CURRENCIES | |
| | |
| | |
| | |
| Currency | |
Percentage of
Total Investments
|
| British
pound | |
| 5.6 | % |
| Euro | |
| 4.4 | |
| Korean
won | |
| 3.4 | |
| U.S.
dollar | |
| 86.6 | |
| Total
investments | |
| 100.0 | % |
PORTFOLIO
DIVERSIFICATION
(As
a Percentage of Total Investments)
| Sector |
|
| Communication Services |
9.1% |
| Consumer Discretionary |
7.7% |
| Energy |
5.6% |
| Financials |
39.4% |
| Health Care |
10.3% |
| Industrials |
4.7% |
| Information Technology |
5.6% |
| Materials |
8.4% |
| Short-Term Investment |
9.2% |
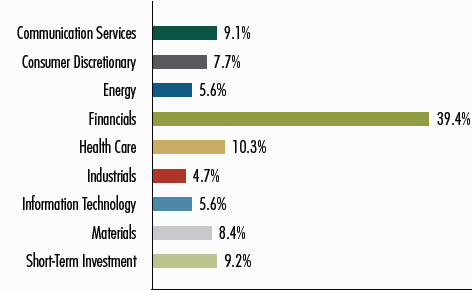
|
| Largest Holdings [Text Block] |
| TOP
TEN HOLDINGS* | |
|
| |
| | |
|
| |
| Company
Name | |
Country |
Percentage of
Total Net Assets |
| Berkshire Hathaway, Inc. | |
United States |
6.1 | % |
| Elevance Health, Inc. | |
United States |
5.8 | |
| Shell plc | |
United States |
5.6 | |
| Charles Schwab Corp. (The) | |
United
States |
5.2 | |
| Bank of New York Mellon Corp. (The) | |
United States |
4.9 | |
| American Express Co. | |
United States |
4.8 | |
| Alphabet, Inc. | |
United States |
4.7 | |
| Progressive Corp. (The) | |
United States |
4.7 | |
| Henry Schein, Inc. | |
United States |
4.5 | |
| Aramark | |
United States |
4.5 | |
| Total | |
|
50.8 | % |
| * | | Excludes short-term
investments. |
|
| Artisan Select Equity Fund - Institutional Shares |
|
| Shareholder Report [Line Items] |
|
| Fund Name |
Artisan
Select Equity Fund
|
| Class Name |
Institutional Shares
|
| Trading Symbol |
APHNX
|
| Annual or Semi-Annual Statement [Text Block] |
This
semi-annual shareholder report contains important information about Artisan Select Equity Fund for the period of October 1, 2024
to March 31, 2025.
|
| Shareholder Report Annual or Semi-Annual |
Semi-Annual
Shareholder Report
|
| Additional Information [Text Block] |
This
semi-annual shareholder report contains important information about Artisan Select Equity Fund for the period of October 1, 2024
to March 31, 2025. You can find additional information about the Fund at www.artisanpartners.com/prospectus . You can also request
this information by contacting us at 800.344.1770.
|
| Additional Information Phone Number |
800.344.1770
|
| Additional Information Website |
www.artisanpartners.com/prospectus
|
| Expenses [Text Block] |
What
were the Fund costs for the last six months?
(based
on a hypothetical $10,000 investment)
| Class
Name |
Costs
of a $10,000 investment |
Costs
paid as a percentage of a $10,000 investment |
| Institutional |
$56 |
1.10% |
| |
|
|
|
| Expenses Paid, Amount |
$ 56
|
| Expense Ratio, Percent |
1.10%
|
| Net Assets |
$ 58,663,000
|
| Holdings Count | Holdings |
29
|
| Advisory Fees Paid, Amount |
$ 150,000
|
| Investment Company, Portfolio Turnover |
16.24%
|
| Additional Fund Statistics [Text Block] |
| Key
Fund Statistics |
| Dollar
values in thousands |
| Net
Assets |
$58,663 |
| Number
of Portfolio Holdings |
29 |
| Total
Investment Advisory Fees (net of waivers and reimbursements) |
$150 |
| Portfolio
Turnover Rate |
16.24% |
|
| Holdings [Text Block] |
REGION
ALLOCATION
(As
a Percentage of Total Net Assets)
| Region |
|
| Americas |
80.6% |
| Europe |
4.4% |
| Emerging Markets |
5.2% |

| TRADING
CURRENCIES | |
| | |
| | |
| | |
| Currency | |
Percentage of
Total Investments
|
| British
pound | |
| 5.6 | % |
| Euro | |
| 4.4 | |
| Korean
won | |
| 3.4 | |
| U.S.
dollar | |
| 86.6 | |
| Total
investments | |
| 100.0 | % |
PORTFOLIO
DIVERSIFICATION
(As
a Percentage of Total Investments)
| Sector |
|
| Communication Services |
9.1% |
| Consumer Discretionary |
7.7% |
| Energy |
5.6% |
| Financials |
39.4% |
| Health Care |
10.3% |
| Industrials |
4.7% |
| Information Technology |
5.6% |
| Materials |
8.4% |
| Short-Term Investment |
9.2% |
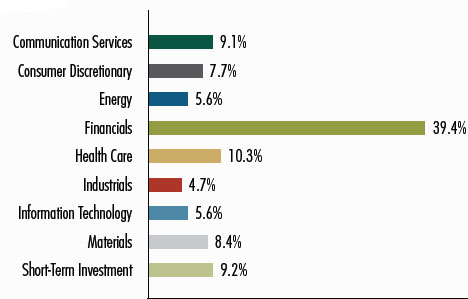
|
| Largest Holdings [Text Block] |
| TOP
TEN HOLDINGS* | |
|
| |
| Company
Name | |
Country |
Percentage of
Total Net Assets |
| Berkshire Hathaway, Inc. | |
United States |
6.1 | % |
| Elevance Health, Inc. | |
United States |
5.8 | |
| Shell plc | |
United States |
5.6 | |
| Charles Schwab Corp. (The) | |
United
States |
5.2 | |
| Bank of New York Mellon Corp. (The) | |
United States |
4.9 | |
| American Express Co. | |
United States |
4.8 | |
| Alphabet, Inc. | |
United States |
4.7 | |
| Progressive Corp. (The) | |
United States |
4.7 | |
| Henry Schein, Inc. | |
United States |
4.5 | |
| Aramark | |
United States |
4.5 | |
| Total | |
|
50.8 | % |
| * | | Excludes short-term
investments. |
|
| Artisan Select Equity Fund - Investor Shares |
|
| Shareholder Report [Line Items] |
|
| Fund Name |
Artisan
Select Equity Fund
|
| Class Name |
Investor Shares
|
| Trading Symbol |
ARTNX
|
| Annual or Semi-Annual Statement [Text Block] |
This semi-annual shareholder report contains important information about Artisan Select Equity Fund for the period of October
1, 2024 to March 31, 2025.
|
| Shareholder Report Annual or Semi-Annual |
Semi-Annual
Shareholder Report
|
| Additional Information [Text Block] |
This semi-annual shareholder report contains important information about Artisan Select Equity Fund for the period of October
1, 2024 to March 31, 2025. You can find additional information about the Fund at www.artisanpartners.com/prospectus . You
can also request this information by contacting us at 800.344.1770.
|
| Additional Information Phone Number |
800.344.1770
|
| Additional Information Website |
www.artisanpartners.com/prospectus
|
| Expenses [Text Block] |
What
were the Fund costs for the last six months?
(based
on a hypothetical $10,000 investment)
| Class
Name |
Costs
of a $10,000 investment |
Costs
paid as a percentage of a $10,000 investment |
| Investor |
$64 |
1.25% |
| |
|
|
|
| Expenses Paid, Amount |
$ 64
|
| Expense Ratio, Percent |
1.25%
|
| Net Assets |
$ 58,663,000
|
| Holdings Count | Holdings |
29
|
| Advisory Fees Paid, Amount |
$ 150,000
|
| Investment Company, Portfolio Turnover |
16.24%
|
| Additional Fund Statistics [Text Block] |
| Key
Fund Statistics |
| Dollar
values in thousands |
| Net
Assets |
$58,663 |
| Number
of Portfolio Holdings |
29 |
| Total
Investment Advisory Fees (net of waivers and reimbursements) |
$150 |
| Portfolio
Turnover Rate |
16.24% |
|
| Holdings [Text Block] |
REGION
ALLOCATION
(As
a Percentage of Total Net Assets)
| Region |
|
| Americas |
80.6% |
| Europe |
4.4% |
| Emerging Markets |
5.2% |

| TRADING
CURRENCIES | |
| | |
| | |
| | |
| Currency | |
Percentage of
Total Investments
|
| British
pound | |
| 5.6 | % |
| Euro | |
| 4.4 | |
| Korean
won | |
| 3.4 | |
| U.S.
dollar | |
| 86.6 | |
| Total
investments | |
| 100.0 | % |
PORTFOLIO
DIVERSIFICATION
(As
a Percentage of Total Investments)
| Sector |
|
| Communication Services |
9.1% |
| Consumer Discretionary |
7.7% |
| Energy |
5.6% |
| Financials |
39.4% |
| Health Care |
10.3% |
| Industrials |
4.7% |
| Information Technology |
5.6% |
| Materials |
8.4% |
| Short-Term Investment |
9.2% |
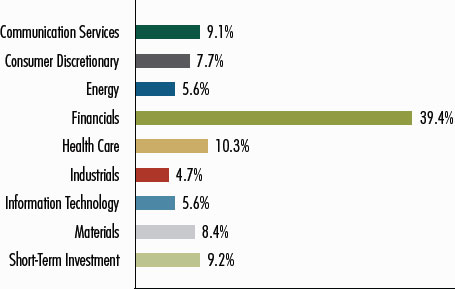
|
| Largest Holdings [Text Block] |
| TOP
TEN HOLDINGS* | |
|
| |
| | |
|
| |
| Company
Name | |
Country |
Percentage of
Total Net Assets |
| Berkshire Hathaway, Inc. | |
United States |
6.1 | % |
| Elevance Health, Inc. | |
United States |
5.8 | |
| Shell plc | |
United States |
5.6 | |
| Charles Schwab Corp. (The) | |
United
States |
5.2 | |
| Bank of New York Mellon Corp. (The) | |
United States |
4.9 | |
| American Express Co. | |
United States |
4.8 | |
| Alphabet, Inc. | |
United States |
4.7 | |
| Progressive Corp. (The) | |
United States |
4.7 | |
| Henry Schein, Inc. | |
United States |
4.5 | |
| Aramark | |
United States |
4.5 | |
| Total | |
|
50.8 | % |
| * | Excludes
short-term investments. |
|
| Artisan Small Cap Fund - Advisor Shares |
|
| Shareholder Report [Line Items] |
|
| Fund Name |
Artisan
Small Cap Fund
|
| Class Name |
Advisor Shares
|
| Trading Symbol |
APDSX
|
| Annual or Semi-Annual Statement [Text Block] |
This
semi-annual shareholder report contains important information about Artisan Small Cap
Fund for the period of October 1, 2024 to March 31, 2025
|
| Shareholder Report Annual or Semi-Annual |
Semi-Annual
Shareholder Report
|
| Additional Information [Text Block] |
This
semi-annual shareholder report contains important information about Artisan Small Cap
Fund for the period of October 1, 2024 to March 31, 2025. You can find additional information
about the Fund at www.artisanpartners.com/prospectus. You can also request this information
by contacting us at 800.344.1770. This report describes changes to the Fund that occurred
during the reporting period.
|
| Material Fund Change Notice [Text Block] |
This report describes changes to the Fund that occurred
during the reporting period.
|
| Additional Information Phone Number |
800.344.1770
|
| Additional Information Website |
www.artisanpartners.com/prospectus
|
| Expenses [Text Block] |
What
were the Fund costs for the last six months?
(based
on a hypothetical $10,000 investment)
| Class
Name |
Costs
of a $10,000 investment |
Costs
paid as a percentage of a $10,000 investment |
| Advisor |
$52 |
1.10% |
| |
|
|
|
| Expenses Paid, Amount |
$ 52
|
| Expense Ratio, Percent |
1.10%
|
| Net Assets |
$ 1,094,307,000
|
| Holdings Count | Holdings |
58
|
| Advisory Fees Paid, Amount |
$ 6,354,000
|
| Investment Company, Portfolio Turnover |
30.56%
|
| Additional Fund Statistics [Text Block] |
| Key
Fund Statistics |
| Dollar
values in thousands |
| Net
Assets |
$1,094,307 |
| Number
of Portfolio Holdings |
58 |
| Total
Investment Advisory Fees (net of waivers and reimbursements) |
$6,354 |
| Portfolio
Turnover Rate |
30.56% |
|
| Holdings [Text Block] |
PORTFOLIO
COMPOSITION
(As
a Percentage of Total Net Assets)
| PORTFOLIO COMPOSITION |
|
| Type |
|
| Common Stocks |
95.7% |
| Other assets less liabilities |
4.3% |

| (1) | Includes
any short-term investments and net other assets (liabilities). |
| TRADING
CURRENCIES | |
| | |
| | |
| | |
| Currency | |
| Percentage of
Total Investments |
| U.S.
dollar | |
| 100.0 | % |
| Total
investments | |
| 100.0 | % |
PORTFOLIO
DIVERSIFICATION
(As
a Percentage of Total Investments)
| Sector |
|
| Consumer Discretionary |
9.4% |
| Consumer Staples |
2.1% |
| Energy |
1.1% |
| Financials |
1.4% |
| Health Care |
30.2% |
| Industrials |
17.6% |
| Information Technology |
34.1% |
| Real Estate |
1.4% |
| Short-Term Investment |
2.7% |
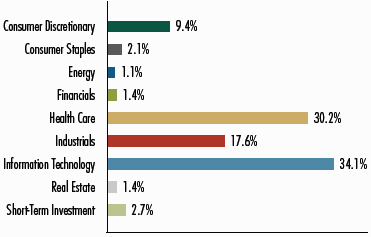
|
| Largest Holdings [Text Block] |
| TOP
TEN HOLDINGS* | |
|
| |
| | |
|
| |
| Company
Name | |
Country |
Percentage of
Total Net Assets |
| Ascendis Pharma A/S | |
Denmark |
5.7 | % |
| Guidewire Software, Inc. | |
United States |
4.5 | |
| Lattice Semiconductor Corp. | |
United
States |
3.5 | |
| MACOM Technology Solutions Holdings, Inc. | |
United States |
2.9 | |
| Halozyme Therapeutics, Inc. | |
United States |
2.7 | |
| Twist Bioscience Corp. | |
United States |
2.6 | |
| SPX Technologies, Inc. | |
United States |
2.6 | |
| Flex Ltd. | |
United States |
2.4 | |
| Applied Industrial Technologies, Inc. | |
United
States |
2.3 | |
| Veracyte, Inc. | |
United States |
2.3 | |
| Total | |
|
31.5 | % |
| * | | Excludes short-term
investments. |
|
| Material Fund Change [Text Block] |
This is a summary of certain changes of the Fund since September 30, 2024. Effective December 31, 2024,
Craigh Cepukenas stepped down as portfolio manager of the Fund. Mr. Cepukenas will remain an active member
of the Artisan Partners Growth Team in an advisory capacity as a managing director. For more information, you may review the Fund's
current prospectus, which is available at www.artisanpartners.com/prospectus or
upon request by calling 800.344.1770.
|
| Summary of Change Legend [Text Block] |
This is a summary of certain changes of the Fund since September 30, 2024. Effective December 31, 2024,
Craigh Cepukenas stepped down as portfolio manager of the Fund. Mr. Cepukenas will remain an active member
of the Artisan Partners Growth Team in an advisory capacity as a managing director.
|
| Updated Prospectus Phone Number |
800.344.1770
|
| Updated Prospectus Web Address |
www.artisanpartners.com/prospectus
|
| Artisan Small Cap Fund - Institutional Shares |
|
| Shareholder Report [Line Items] |
|
| Fund Name |
Artisan
Small Cap Fund
|
| Class Name |
Institutional Shares
|
| Trading Symbol |
APHSX
|
| Annual or Semi-Annual Statement [Text Block] |
This
semi-annual shareholder report contains important information about Artisan Small Cap
Fund for the period of October 1, 2024 to March 31, 2025.
|
| Shareholder Report Annual or Semi-Annual |
Semi-Annual
Shareholder Report
|
| Additional Information [Text Block] |
This
semi-annual shareholder report contains important information about Artisan Small Cap
Fund for the period of October 1, 2024 to March 31, 2025. You can find additional information
about the Fund at www.artisanpartners.com/prospectus. You can also request this information
by contacting us at 800.344.1770. This report describes changes to the Fund that occurred
during the reporting period.
|
| Material Fund Change Notice [Text Block] |
This report describes changes to the Fund that occurred
during the reporting period.
|
| Additional Information Phone Number |
800.344.1770
|
| Additional Information Website |
www.artisanpartners.com/prospectus
|
| Expenses [Text Block] |
What
were the Fund costs for the last six months?
(based
on a hypothetical $10,000 investment)
| Class
Name |
Costs
of a $10,000 investment |
Costs
paid as a percentage of a $10,000 investment |
| Institutional |
$48 |
1.01% |
| |
|
|
|
| Expenses Paid, Amount |
$ 48
|
| Expense Ratio, Percent |
1.01%
|
| Net Assets |
$ 1,094,307,000
|
| Holdings Count | Holdings |
58
|
| Advisory Fees Paid, Amount |
$ 6,354,000
|
| Investment Company, Portfolio Turnover |
30.56%
|
| Additional Fund Statistics [Text Block] |
| Key
Fund Statistics |
| Dollar
values in thousands |
| Net
Assets |
$1,094,307 |
| Number
of Portfolio Holdings |
58 |
| Total
Investment Advisory Fees (net of waivers and reimbursements) |
$6,354 |
| Portfolio
Turnover Rate |
30.56% |
|
| Holdings [Text Block] |
PORTFOLIO
COMPOSITION
(As
a Percentage of Total Net Assets)
| PORTFOLIO COMPOSITION |
|
| Type |
|
| Common Stocks |
95.7% |
| Other assets less liabilities |
4.3% |
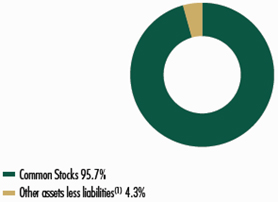
| (1) | Includes
any short-term investments and net other assets (liabilities). |
| TRADING
CURRENCIES | |
| | |
| | |
| | |
| Currency | |
| Percentage of
Total Investments |
| U.S.
dollar | |
| 100.0 | % |
| Total
investments | |
| 100.0 | % |
PORTFOLIO
DIVERSIFICATION
(As
a Percentage of Total Investments)
| Sector |
|
| Consumer Discretionary |
9.4% |
| Consumer Staples |
2.1% |
| Energy |
1.1% |
| Financials |
1.4% |
| Health Care |
30.2% |
| Industrials |
17.6% |
| Information Technology |
34.1% |
| Real Estate |
1.4% |
| Short-Term Investment |
2.7% |

|
| Largest Holdings [Text Block] |
| TOP
TEN HOLDINGS* | |
|
| |
| | |
|
| |
| Company
Name | |
Country |
Percentage of
Total Net Assets |
| Ascendis Pharma A/S | |
Denmark |
5.7 | % |
| Guidewire Software, Inc. | |
United States |
4.5 | |
| Lattice Semiconductor Corp. | |
United
States |
3.5 | |
| MACOM Technology Solutions Holdings, Inc. | |
United States |
2.9 | |
| Halozyme Therapeutics, Inc. | |
United States |
2.7 | |
| Twist Bioscience Corp. | |
United States |
2.6 | |
| SPX Technologies, Inc. | |
United States |
2.6 | |
| Flex Ltd. | |
United States |
2.4 | |
| Applied Industrial Technologies, Inc. | |
United
States |
2.3 | |
| Veracyte, Inc. | |
United States |
2.3 | |
| Total | |
|
31.5 | % |
| * | Excludes
short-term investments. |
|
| Material Fund Change [Text Block] |
This is a summary of certain changes of the Fund since September 30, 2024. Effective December 31, 2024,
Craigh Cepukenas stepped down as portfolio manager of the Fund. Mr. Cepukenas will remain an active member
of the Artisan Partners Growth Team in an advisory capacity as a managing director. For more information, you may review the Fund's
current prospectus, which is available at www.artisanpartners.com/prospectus or
upon request by calling 800.344.1770.
|
| Summary of Change Legend [Text Block] |
This is a summary of certain changes of the Fund since September 30, 2024. Effective December 31, 2024,
Craigh Cepukenas stepped down as portfolio manager of the Fund. Mr. Cepukenas will remain an active member
of the Artisan Partners Growth Team in an advisory capacity as a managing director.
|
| Updated Prospectus Phone Number |
800.344.1770
|
| Updated Prospectus Web Address |
www.artisanpartners.com/prospectus
|
| Artisan Small Cap Fund - Investor Shares |
|
| Shareholder Report [Line Items] |
|
| Fund Name |
Artisan
Small Cap Fund
|
| Class Name |
Investor Shares
|
| Trading Symbol |
ARTSX
|
| Annual or Semi-Annual Statement [Text Block] |
This
semi-annual shareholder report contains important information about Artisan Small Cap
Fund for the period of October 1, 2024 to March 31, 2025.
|
| Shareholder Report Annual or Semi-Annual |
Semi-Annual
Shareholder Report
|
| Additional Information [Text Block] |
This
semi-annual shareholder report contains important information about Artisan Small Cap
Fund for the period of October 1, 2024 to March 31, 2025. You can find additional information
about the Fund at www.artisanpartners.com/prospectus. You can also request this information
by contacting us at 800.344.1770. This report describes changes to the Fund that occurred
during the reporting period.
|
| Material Fund Change Notice [Text Block] |
This report describes changes to the Fund that occurred
during the reporting period.
|
| Additional Information Phone Number |
800.344.1770
|
| Additional Information Website |
www.artisanpartners.com/prospectus
|
| Expenses [Text Block] |
What
were the Fund costs for the last six months?
(based
on a hypothetical $10,000 investment)
| Class
Name |
Costs
of a $10,000 investment |
Costs
paid as a percentage of a $10,000 investment |
| Investor |
$59 |
1.24% |
| |
|
|
|
| Expenses Paid, Amount |
$ 59
|
| Expense Ratio, Percent |
1.24%
|
| Net Assets |
$ 1,094,307,000
|
| Holdings Count | Holdings |
58
|
| Advisory Fees Paid, Amount |
$ 6,354,000
|
| Investment Company, Portfolio Turnover |
30.56%
|
| Additional Fund Statistics [Text Block] |
| Key
Fund Statistics |
| Dollar
values in thousands |
| Net
Assets |
$1,094,307 |
| Number
of Portfolio Holdings |
58 |
| Total
Investment Advisory Fees (net of waivers and reimbursements) |
$6,354 |
| Portfolio
Turnover Rate |
30.56% |
|
| Holdings [Text Block] |
PORTFOLIO
COMPOSITION
(As
a Percentage of Total Net Assets)
| PORTFOLIO COMPOSITION |
|
| Type |
|
| Common Stocks |
95.7% |
| Other assets less liabilities |
4.3% |
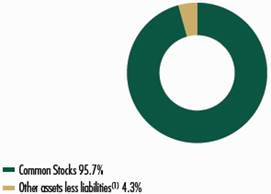
| (1) | Includes
any short-term investments and net other assets (liabilities). |
| TRADING
CURRENCIES | |
| | |
| | |
| | |
| Currency | |
| Percentage of
Total Investments |
| U.S.
dollar | |
| 100.0 | % |
| Total
investments | |
| 100.0 | % |
PORTFOLIO
DIVERSIFICATION
(As
a Percentage of Total Investments)
| Sector |
|
| Consumer Discretionary |
9.4% |
| Consumer Staples |
2.1% |
| Energy |
1.1% |
| Financials |
1.4% |
| Health Care |
30.2% |
| Industrials |
17.6% |
| Information Technology |
34.1% |
| Real Estate |
1.4% |
| Short-Term Investment |
2.7% |
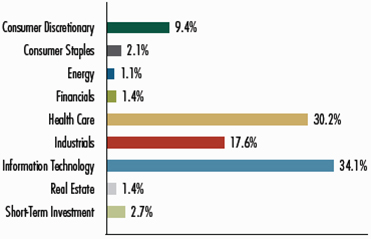
|
| Largest Holdings [Text Block] |
| TOP
TEN HOLDINGS* | |
|
| |
| | |
|
| |
| Company
Name | |
Country |
Percentage of
Total Net Assets |
| Ascendis Pharma A/S | |
Denmark |
5.7 | % |
| Guidewire Software, Inc. | |
United States |
4.5 | |
| Lattice Semiconductor Corp. | |
United
States |
3.5 | |
| MACOM Technology Solutions Holdings, Inc. | |
United States |
2.9 | |
| Halozyme Therapeutics, Inc. | |
United States |
2.7 | |
| Twist Bioscience Corp. | |
United States |
2.6 | |
| SPX Technologies, Inc. | |
United States |
2.6 | |
| Flex Ltd. | |
United States |
2.4 | |
| Applied Industrial Technologies, Inc. | |
United
States |
2.3 | |
| Veracyte, Inc. | |
United States |
2.3 | |
| Total | |
|
31.5 | % |
| * | Excludes
short-term investments. |
|
| Material Fund Change [Text Block] |
This is a summary of certain changes of the Fund since September 30, 2024. Effective December 31, 2024,
Craigh Cepukenas stepped down as portfolio manager of the Fund. Mr. Cepukenas will remain an active member
of the Artisan Partners Growth Team in an advisory capacity as a managing director. For more information, you may review the Fund's
current prospectus, which is available at www.artisanpartners.com/prospectus or
upon request by calling 800.344.1770.
|
| Summary of Change Legend [Text Block] |
This is a summary of certain changes of the Fund since September 30, 2024. Effective December 31, 2024,
Craigh Cepukenas stepped down as portfolio manager of the Fund. Mr. Cepukenas will remain an active member
of the Artisan Partners Growth Team in an advisory capacity as a managing director.
|
| Updated Prospectus Phone Number |
800.344.177
|
| Updated Prospectus Web Address |
www.artisanpartners.com/prospectus
|
| Artisan Sustainable Emerging Markets Fund - Advisor Shares |
|
| Shareholder Report [Line Items] |
|
| Fund Name |
Artisan
Sustainable Emerging Markets Fund
|
| Class Name |
Advisor Shares
|
| Trading Symbol |
APDEX
|
| Annual or Semi-Annual Statement [Text Block] |
This semi-annual shareholder report contains important information about Artisan Sustainable Emerging Markets Fund for the period of October 1, 2024 to March 31, 2025
|
| Shareholder Report Annual or Semi-Annual |
Semi-Annual
Shareholder Report
|
| Additional Information [Text Block] |
This semi-annual shareholder report contains important information about Artisan Sustainable Emerging Markets Fund for the period of October 1, 2024 to March 31, 2025. You can find additional information about the Fund at www.artisanpartners.com/prospectus. You can also request this information by contacting us at 800.344.1770.
|
| Additional Information Phone Number |
800.344.1770
|
| Additional Information Website |
www.artisanpartners.com/prospectus
|
| Expenses [Text Block] |
What
were the Fund costs for the last six months?
(based
on a hypothetical $10,000 investment)
| Class
Name |
Costs
of a $10,000 investment |
Costs
paid as a percentage of a $10,000 investment |
| Advisor |
$52 |
1.05% |
| |
|
|
|
| Expenses Paid, Amount |
$ 52
|
| Expense Ratio, Percent |
1.05%
|
| Net Assets |
$ 225,690,000
|
| Holdings Count | Holdings |
61
|
| Advisory Fees Paid, Amount |
$ 661,000
|
| Investment Company, Portfolio Turnover |
12.67%
|
| Additional Fund Statistics [Text Block] |
| Key
Fund Statistics |
| Dollar
values in thousands |
| Net
Assets |
$225,690 |
| Number
of Portfolio Holdings |
61 |
| Total
Investment Advisory Fees (net of waivers and reimbursements) |
$661 |
| Portfolio
Turnover Rate |
12.67% |
|
| Holdings [Text Block] |
REGION
ALLOCATION
(As
a Percentage of Total Net Assets)
| Region |
|
| Europe |
1.9% |
| Americas |
0.8% |
| Emerging Markets |
89.3% |
| Pacific Basin |
2.1% |
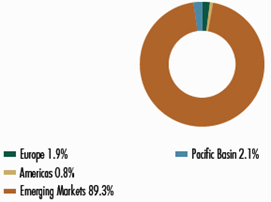
| TRADING
CURRENCIES | |
| | |
| | |
| | |
| Currency | |
| Percentage of
Total Investments |
| Brazilian real | |
| 4.6 | % |
| Euro | |
| 7.0 | |
| Hong Kong dollar | |
| 14.3 | |
| Indian rupee | |
| 10.2 | |
| Korean won | |
| 9.5 | |
| Mexican peso | |
| 3.6 | |
| New Taiwan dollar | |
| 18.4 | |
| South African rand | |
| 3.0 | |
| U.S. dollar | |
| 21.5 | |
| Vietnamese dong | |
| 2.1 | |
| Other | |
| 5.8 | |
| Total
investments | |
| 100.0 | % |
PORTFOLIO
DIVERSIFICATION
(As
a Percentage of Total Investments)
| Sector |
|
| Communication Services |
3.5% |
| Consumer Discretionary |
16.6% |
| Consumer Staples |
3.2% |
| Energy |
4.6% |
| Financials |
21.5% |
| Health Care |
4.8% |
| Industrials |
11.1% |
| Information Technology |
22.5% |
| Materials |
5.4% |
| Real Estate |
0.7% |
| Short-Term Investment |
6.1% |
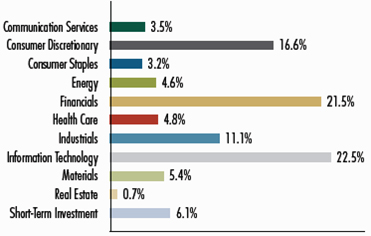
|
| Largest Holdings [Text Block] |
| TOP
TEN HOLDINGS* | |
|
| |
| | |
|
| |
| Company
Name | |
Country |
Percentage of
Total Net Assets |
| Taiwan Semiconductor Manufacturing Co. Ltd. | |
Taiwan |
11.8 | % |
| Alibaba Group Holding Ltd. | |
China |
4.8 | |
| ICICI Bank Ltd. | |
India |
4.1 | |
| Prosus NV | |
China |
3.7 | |
| MercadoLibre, Inc. | |
Brazil |
3.6 | |
| MediaTek, Inc. | |
Taiwan |
3.4 | |
| E Ink Holdings, Inc. | |
Taiwan |
3.3 | |
| Zhuzhou CRRC Times Electric Co. Ltd. | |
China |
2.7 | |
| Reliance Industries Ltd. | |
India |
2.4 | |
| Wuxi Biologics Cayman, Inc. | |
China |
2.1 | |
| Total | |
|
41.9 | % |
| * | | Excludes short-term
investments. |
|
| Artisan Sustainable Emerging Markets Fund - Institutional Shares |
|
| Shareholder Report [Line Items] |
|
| Fund Name |
Artisan
Sustainable Emerging Markets Fund
|
| Class Name |
Institutional Shares
|
| Trading Symbol |
APHEX
|
| Annual or Semi-Annual Statement [Text Block] |
This semi-annual shareholder report contains important information about Artisan Sustainable Emerging Markets Fund for the period of October 1, 2024 to March 31, 2025
|
| Shareholder Report Annual or Semi-Annual |
Semi-Annual
Shareholder Report
|
| Additional Information [Text Block] |
This semi-annual shareholder report contains important information about Artisan Sustainable Emerging Markets Fund for the period of October 1, 2024 to March 31, 2025. You can find additional information about the Fund at www.artisanpartners.com/prospectus. You can also request this information by contacting us at 800.344.1770.
|
| Additional Information Phone Number |
800.344.1770
|
| Additional Information Website |
www.artisanpartners.com/prospectus
|
| Expenses [Text Block] |
What
were the Fund costs for the last six months?
(based
on a hypothetical $10,000 investment)
| Class
Name |
Costs
of a $10,000 investment |
Costs
paid as a percentage of a $10,000 investment |
| Institutional |
$49 |
1.00% |
| |
|
|
|
| Expenses Paid, Amount |
$ 49
|
| Expense Ratio, Percent |
1.00%
|
| Net Assets |
$ 225,690,000
|
| Holdings Count | Holdings |
61
|
| Advisory Fees Paid, Amount |
$ 661,000
|
| Investment Company, Portfolio Turnover |
12.67%
|
| Additional Fund Statistics [Text Block] |
| Key
Fund Statistics |
| Dollar
values in thousands |
| Net
Assets |
$225,690 |
| Number
of Portfolio Holdings |
61 |
| Total
Investment Advisory Fees (net of waivers and reimbursements) |
$661 |
| Portfolio
Turnover Rate |
12.67% |
|
| Holdings [Text Block] |
REGION
ALLOCATION
(As
a Percentage of Total Net Assets)
| Region |
|
| Europe |
1.9% |
| Americas |
0.8% |
| Emerging Markets |
89.3% |
| Pacific Basin |
2.1% |
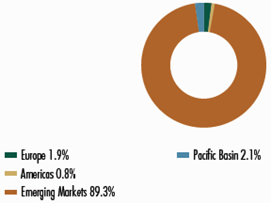
| TRADING
CURRENCIES | |
| | |
| | |
| | |
| Currency | |
| Percentage of
Total Investments |
| Brazilian real | |
| 4.6 | % |
| Euro | |
| 7.0 | |
| Hong Kong dollar | |
| 14.3 | |
| Indian rupee | |
| 10.2 | |
| Korean won | |
| 9.5 | |
| Mexican peso | |
| 3.6 | |
| New Taiwan dollar | |
| 18.4 | |
| South African rand | |
| 3.0 | |
| U.S. dollar | |
| 21.5 | |
| Vietnamese dong | |
| 2.1 | |
| Other | |
| 5.8 | |
| Total
investments | |
| 100.0 | % |
PORTFOLIO
DIVERSIFICATION
(As
a Percentage of Total Investments)
| Sector |
|
| Communication Services |
3.5% |
| Consumer Discretionary |
16.6% |
| Consumer Staples |
3.2% |
| Energy |
4.6% |
| Financials |
21.5% |
| Health Care |
4.8% |
| Industrials |
11.1% |
| Information Technology |
22.5% |
| Materials |
5.4% |
| Real Estate |
0.7% |
| Short-Term Investment |
6.1% |
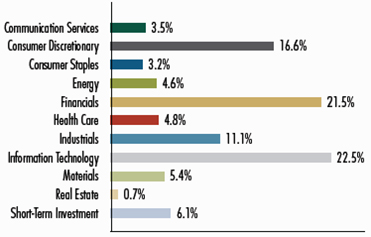
|
| Largest Holdings [Text Block] |
| TOP
TEN HOLDINGS* | |
|
| |
| | |
|
| |
| Company
Name | |
Country |
Percentage of
Total Net Assets |
| Taiwan Semiconductor Manufacturing Co. Ltd. | |
Taiwan |
11.8 | % |
| Alibaba Group Holding Ltd. | |
China |
4.8 | |
| ICICI Bank Ltd. | |
India |
4.1 | |
| Prosus NV | |
China |
3.7 | |
| MercadoLibre, Inc. | |
Brazil |
3.6 | |
| MediaTek, Inc. | |
Taiwan |
3.4 | |
| E Ink Holdings, Inc. | |
Taiwan |
3.3 | |
| Zhuzhou CRRC Times Electric Co. Ltd. | |
China |
2.7 | |
| Reliance Industries Ltd. | |
India |
2.4 | |
| Wuxi Biologics Cayman, Inc. | |
China |
2.1 | |
| Total | |
|
41.9 | % |
| * | | Excludes short-term
investments. |
|
| Artisan Sustainable Emerging Markets Fund - Investor Shares |
|
| Shareholder Report [Line Items] |
|
| Fund Name |
Artisan
Sustainable Emerging Markets Fund
|
| Class Name |
Investor Shares
|
| Trading Symbol |
ARTZX
|
| Annual or Semi-Annual Statement [Text Block] |
This semi-annual shareholder report contains important information about Artisan Sustainable Emerging Markets Fund for the period of October 1, 2024 to March 31, 2025
|
| Shareholder Report Annual or Semi-Annual |
Semi-Annual
Shareholder Report
|
| Additional Information [Text Block] |
This semi-annual shareholder report contains important information about Artisan Sustainable Emerging Markets Fund for the period of October 1, 2024 to March 31, 2025. You can find additional information about the Fund at www.artisanpartners.com/prospectus. You can also request this information by contacting us at 800.344.1770.
|
| Additional Information Phone Number |
800.344.1770
|
| Additional Information Website |
www.artisanpartners.com/prospectus
|
| Expenses [Text Block] |
What
were the Fund costs for the last six months?
(based
on a hypothetical $10,000 investment)
| Class
Name |
Costs
of a $10,000 investment |
Costs
paid as a percentage of a $10,000 investment |
| Investor |
$57 |
1.15% |
| |
|
|
|
| Expenses Paid, Amount |
$ 57
|
| Expense Ratio, Percent |
1.15%
|
| Net Assets |
$ 225,690,000
|
| Holdings Count | Holdings |
61
|
| Advisory Fees Paid, Amount |
$ 661,000
|
| Investment Company, Portfolio Turnover |
12.67%
|
| Additional Fund Statistics [Text Block] |
| Key
Fund Statistics |
| Dollar
values in thousands |
| Net
Assets |
$225,690 |
| Number
of Portfolio Holdings |
61 |
| Total
Investment Advisory Fees (net of waivers and reimbursements) |
$661 |
| Portfolio
Turnover Rate |
12.67% |
|
| Holdings [Text Block] |
REGION
ALLOCATION
(As
a Percentage of Total Net Assets)
| Region |
|
| Europe |
1.9% |
| Americas |
0.8% |
| Emerging Markets |
89.3% |
| Pacific Basin |
2.1% |

| TRADING
CURRENCIES | |
| | |
| | |
| | |
| Currency | |
| Percentage of
Total Investments |
| Brazilian real | |
| 4.6 | % |
| Euro | |
| 7.0 | |
| Hong Kong dollar | |
| 14.3 | |
| Indian rupee | |
| 10.2 | |
| Korean won | |
| 9.5 | |
| Mexican peso | |
| 3.6 | |
| New Taiwan dollar | |
| 18.4 | |
| South African rand | |
| 3.0 | |
| U.S. dollar | |
| 21.5 | |
| Vietnamese dong | |
| 2.1 | |
| Other | |
| 5.8 | |
| Total
investments | |
| 100.0 | % |
PORTFOLIO
DIVERSIFICATION
(As
a Percentage of Total Investments)
| Sector |
|
| Communication Services |
3.5% |
| Consumer Discretionary |
16.6% |
| Consumer Staples |
3.2% |
| Energy |
4.6% |
| Financials |
21.5% |
| Health Care |
4.8% |
| Industrials |
11.1% |
| Information Technology |
22.5% |
| Materials |
5.4% |
| Real Estate |
0.7% |
| Short-Term Investment |
6.1% |

|
| Largest Holdings [Text Block] |
| TOP
TEN HOLDINGS* | |
|
| |
| | |
|
| |
| Company
Name | |
Country |
Percentage of
Total Net Assets |
| Taiwan Semiconductor Manufacturing Co. Ltd. | |
Taiwan |
11.8 | % |
| Alibaba Group Holding Ltd. | |
China |
4.8 | |
| ICICI Bank Ltd. | |
India |
4.1 | |
| Prosus NV | |
China |
3.7 | |
| MercadoLibre, Inc. | |
Brazil |
3.6 | |
| MediaTek, Inc. | |
Taiwan |
3.4 | |
| E Ink Holdings, Inc. | |
Taiwan |
3.3 | |
| Zhuzhou CRRC Times Electric Co. Ltd. | |
China |
2.7 | |
| Reliance Industries Ltd. | |
India |
2.4 | |
| Wuxi Biologics Cayman, Inc. | |
China |
2.1 | |
| Total | |
|
41.9 | % |
| * | | Excludes short-term
investments. |
|
| Artisan Value Fund - Advisor Shares |
|
| Shareholder Report [Line Items] |
|
| Fund Name |
Artisan
Value Fund
|
| Class Name |
Advisor Shares
|
| Trading Symbol |
APDLX
|
| Annual or Semi-Annual Statement [Text Block] |
This semi-annual shareholder report contains important information about Artisan Value Fund for the period of October 1, 2024 to March 31, 2025
|
| Shareholder Report Annual or Semi-Annual |
Semi-Annual
Shareholder Report
|
| Additional Information [Text Block] |
This semi-annual shareholder report contains important information about Artisan Value Fund for the period of October 1, 2024 to March 31, 2025. You can find additional information about the Fund at www.artisanpartners.com/prospectus. You can also request this information by contacting us at 800.344.1770.
|
| Additional Information Phone Number |
800.344.1770
|
| Additional Information Website |
www.artisanpartners.com/prospectus
|
| Expenses [Text Block] |
What
were the Fund costs for the last six months?
(based
on a hypothetical $10,000 investment)
| Class
Name |
Costs
of a $10,000 investment |
Costs
paid as a percentage of a $10,000 investment |
| Advisor |
$44 |
0.88% |
| |
|
|
|
| Expenses Paid, Amount |
$ 44
|
| Expense Ratio, Percent |
0.88%
|
| Net Assets |
$ 310,041,000
|
| Holdings Count | Holdings |
41
|
| Advisory Fees Paid, Amount |
$ 1,117,000
|
| Investment Company, Portfolio Turnover |
14.91%
|
| Additional Fund Statistics [Text Block] |
| Key
Fund Statistics |
| Dollar
values in thousands |
| Net
Assets |
$310,041 |
| Number
of Portfolio Holdings |
41 |
| Total
Investment Advisory Fees (net of waivers and reimbursements) |
$1,117 |
| Portfolio
Turnover Rate |
14.91% |
|
| Holdings [Text Block] |
REGION
ALLOCATION
(As
a Percentage of Total Net Assets)
| Region |
|
| Americas |
77.2% |
| Europe |
18.2% |
| Emerging Markets |
2.0% |
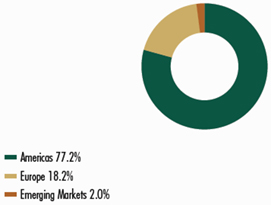
| TRADING
CURRENCIES | |
| | |
| | |
| | |
| Currency | |
| Percentage of
Total Investments |
| British pound | |
| 3.5 | % |
| Euro | |
| 14.8 | |
| Swiss franc | |
| 1.7 | |
| U.S. dollar | |
| 80.0 | |
| Total
investments | |
| 100.0 | % |
PORTFOLIO
DIVERSIFICATION
(As
a Percentage of Total Investments)
| Sector |
|
| Communication Services |
10.4% |
| Consumer Discretionary |
3.4% |
| Consumer Staples |
18.1% |
| Energy |
8.5% |
| Financials |
30.0% |
| Health Care |
14.3% |
| Industrials |
9.2% |
| Information Technology |
4.4% |
| Short-Term Investment |
1.7% |
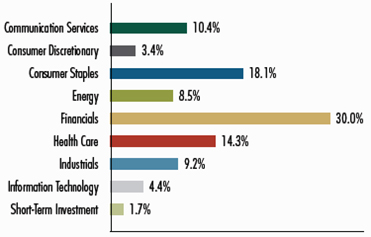
|
| Largest Holdings [Text Block] |
| TOP
TEN HOLDINGS* | |
|
| |
| | |
|
| |
| Company
Name | |
Country |
Percentage of
Total Net Assets |
| Philip Morris International, Inc. | |
United States |
4.0 | % |
| Heineken Holding NV | |
Netherlands |
3.7 | |
| United Parcel Service, Inc. | |
United States |
3.6 | |
| Wells Fargo & Co. | |
United States |
3.3 | |
| Kerry Group plc | |
Ireland |
3.3 | |
| EOG Resources, Inc. | |
United States |
3.2 | |
| PayPal Holdings, Inc. | |
United States |
3.2 | |
| Comcast Corp. | |
United States |
3.1 | |
| Safran SA | |
France |
3.0 | |
| Fiserv, Inc. | |
United States |
2.8 | |
| Total | |
|
33.2 | % |
| * | | Excludes short-term
investments. |
|
| Artisan Value Fund - Institutional Shares |
|
| Shareholder Report [Line Items] |
|
| Fund Name |
Artisan
Value Fund
|
| Class Name |
Institutional Shares
|
| Trading Symbol |
APHLX
|
| Annual or Semi-Annual Statement [Text Block] |
This semi-annual shareholder report contains important information
about Artisan Value Fund for the period of October 1, 2024 to March
31, 2025
|
| Shareholder Report Annual or Semi-Annual |
Semi-Annual
Shareholder Report
|
| Additional Information [Text Block] |
This semi-annual shareholder report contains important information
about Artisan Value Fund for the period of October 1, 2024 to March
31, 2025. You can find additional information about the Fund at
www.artisanpartners.com/prospectus. You can also
request this information by contacting us at 800.344.1770.
|
| Additional Information Phone Number |
800.344.1770
|
| Additional Information Website |
www.artisanpartners.com/prospectus
|
| Expenses [Text Block] |
What
were the Fund costs for the last six months?
(based
on a hypothetical $10,000 investment)
| Class
Name |
Costs
of a $10,000 investment |
Costs
paid as a percentage of a $10,000 investment |
| Institutional |
$42 |
0.83% |
| |
|
|
|
| Expenses Paid, Amount |
$ 42
|
| Expense Ratio, Percent |
0.83%
|
| Net Assets |
$ 310,041,000
|
| Holdings Count | Holdings |
41
|
| Advisory Fees Paid, Amount |
$ 1,117,000
|
| Investment Company, Portfolio Turnover |
14.91%
|
| Additional Fund Statistics [Text Block] |
| Key
Fund Statistics |
| Dollar
values in thousands |
| Net
Assets |
$310,041 |
| Number
of Portfolio Holdings |
41 |
| Total
Investment Advisory Fees (net of waivers and reimbursements) |
$1,117 |
| Portfolio
Turnover Rate |
14.91% |
|
| Holdings [Text Block] |
REGION
ALLOCATION
(As
a Percentage of Total Net Assets)
| Region |
|
| Americas |
77.2% |
| Europe |
18.2% |
| Emerging Markets |
2.0% |
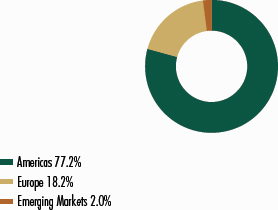
| TRADING
CURRENCIES | |
| | |
| | |
| | |
| Currency | |
| Percentage of
Total Investments |
| British
pound | |
| 3.5 | % |
| Euro | |
| 14.8 | |
| Swiss
franc | |
| 1.7 | |
| U.S.
dollar | |
| 80.0 | |
| Total
investments | |
| 100.0 | % |
PORTFOLIO
DIVERSIFICATION
(As
a Percentage of Total Investments)
| Sector |
|
| Communication Services |
10.4% |
| Consumer Discretionary |
3.4% |
| Consumer Staples |
18.1% |
| Energy |
8.5% |
| Financials |
30.0% |
| Health Care |
14.3% |
| Industrials |
9.2% |
| Information Technology |
4.4% |
| Short-Term Investment |
1.7% |
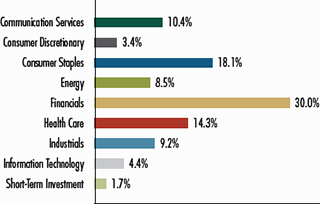
|
| Largest Holdings [Text Block] |
| TOP TEN HOLDINGS* | |
|
|
| | |
|
|
| Company Name | |
Country |
Percentage
of Total
Net Assets |
| Philip Morris
International, Inc. | |
United States |
4.0 | % |
| Heineken Holding NV | |
Netherlands |
3.7 | |
| United Parcel Service, Inc. | |
United States |
3.6 | |
| Wells Fargo & Co. | |
United States |
3.3 | |
| Kerry Group plc | |
Ireland |
3.3 | |
| EOG Resources, Inc. | |
United States |
3.2 | |
| PayPal Holdings, Inc. | |
United States |
3.2 | |
| Comcast Corp. | |
United States |
3.1 | |
| Safran SA | |
France |
3.0 | |
| Fiserv, Inc. | |
United States |
2.8 | |
| Total | |
|
33.2 | % |
| | |
|
| |
| * | | Excludes short-term
investments. |
|
| Artisan Value Fund - Investor Shares |
|
| Shareholder Report [Line Items] |
|
| Fund Name |
Artisan
Value Fund
|
| Class Name |
Investor Shares
|
| Trading Symbol |
ARTLX
|
| Annual or Semi-Annual Statement [Text Block] |
This semi-annual shareholder report contains important information
about Artisan Value Fund for the period of October 1, 2024 to March
31, 2025
|
| Shareholder Report Annual or Semi-Annual |
Semi-Annual
Shareholder Report
|
| Additional Information [Text Block] |
This semi-annual shareholder report contains important information
about Artisan Value Fund for the period of October 1, 2024 to March
31, 2025. You can find additional information about the Fund at
www.artisanpartners.com/prospectus. You can also
request this information by contacting us at 800.344.1770.
|
| Additional Information Phone Number |
800.344.1770
|
| Additional Information Website |
www.artisanpartners.com/prospectus
|
| Expenses [Text Block] |
What
were the Fund costs for the last six months?
(based
on a hypothetical $10,000 investment)
| Class
Name |
Costs
of a $10,000 investment |
Costs
paid as a percentage of a $10,000 investment |
| Investor |
$49 |
0.98% |
| |
|
|
|
| Expenses Paid, Amount |
$ 49
|
| Expense Ratio, Percent |
0.98%
|
| Net Assets |
$ 310,041,000
|
| Holdings Count | Holdings |
41
|
| Advisory Fees Paid, Amount |
$ 1,117,000
|
| Investment Company, Portfolio Turnover |
14.91%
|
| Additional Fund Statistics [Text Block] |
| Key
Fund Statistics |
| Dollar
values in thousands |
| Net
Assets |
$310,041 |
| Number
of Portfolio Holdings |
41 |
| Total
Investment Advisory Fees (net of waivers and reimbursements) |
$1,117 |
| Portfolio
Turnover Rate |
14.91% |
|
| Holdings [Text Block] |
REGION
ALLOCATION
(As
a Percentage of Total Net Assets)
| Region |
|
| Americas |
77.2% |
| Europe |
18.2% |
| Emerging Markets |
2.0% |

| TRADING
CURRENCIES | |
| | |
| | |
| | |
| Currency | |
| Percentage of
Total Investments |
| British
pound | |
| 3.5 | % |
| Euro | |
| 14.8 | |
| Swiss
franc | |
| 1.7 | |
| U.S.
dollar | |
| 80.0 | |
| Total
investments | |
| 100.0 | % |
PORTFOLIO
DIVERSIFICATION
(As
a Percentage of Total Investments)
| Sector |
|
| Communication Services |
10.4% |
| Consumer Discretionary |
3.4% |
| Consumer Staples |
18.1% |
| Energy |
8.5% |
| Financials |
30.0% |
| Health Care |
14.3% |
| Industrials |
9.2% |
| Information Technology |
4.4% |
| Short-Term Investment |
1.7% |

|
| Largest Holdings [Text Block] |
| TOP TEN HOLDINGS* | |
|
|
| | |
|
|
| Company Name | |
Country |
Percentage
of Total
Net Assets |
| Philip Morris
International, Inc. | |
United States |
4.0 | % |
| Heineken Holding NV | |
Netherlands |
3.7 | |
| United Parcel Service, Inc. | |
United States |
3.6 | |
| Wells Fargo & Co. | |
United States |
3.3 | |
| Kerry Group plc | |
Ireland |
3.3 | |
| EOG Resources, Inc. | |
United States |
3.2 | |
| PayPal Holdings, Inc. | |
United States |
3.2 | |
| Comcast Corp. | |
United States |
3.1 | |
| Safran SA | |
France |
3.0 | |
| Fiserv, Inc. | |
United States |
2.8 | |
| Total | |
|
33.2 | % |
| | |
|
| |
| * | | Excludes short-term
investments. |
|
| Artisan Value Income Fund - Advisor Shares |
|
| Shareholder Report [Line Items] |
|
| Fund Name |
Artisan
Value Income Fund
|
| Class Name |
Advisor Shares
|
| Trading Symbol |
APDWX
|
| Annual or Semi-Annual Statement [Text Block] |
This semi-annual shareholder report contains important information
about Artisan Value Income Fund for the period of October 1, 2024
to March 31, 2025
|
| Shareholder Report Annual or Semi-Annual |
Semi-Annual
Shareholder Report
|
| Additional Information [Text Block] |
This semi-annual shareholder report contains important information
about Artisan Value Income Fund for the period of October 1, 2024
to March 31, 2025. You can find additional information about the Fund
at www.artisanpartners.com/prospectus. You can also
request this information by contacting us at 800.344.1770.
|
| Additional Information Phone Number |
800.344.1770
|
| Additional Information Website |
www.artisanpartners.com/prospectus
|
| Expenses [Text Block] |
What
were the Fund costs for the last six months?
(based
on a hypothetical $10,000 investment)
| Class
Name |
Costs
of a $10,000 investment |
Costs
paid as a percentage of a $10,000 investment |
| Advisor |
$55 |
1.10% |
| |
|
|
|
| Expenses Paid, Amount |
$ 55
|
| Expense Ratio, Percent |
1.10%
|
| Net Assets |
$ 16,268,000
|
| Holdings Count | Holdings |
76
|
| Advisory Fees Paid, Amount |
$ 0
|
| Investment Company, Portfolio Turnover |
14.73%
|
| Additional Fund Statistics [Text Block] |
| Key
Fund Statistics |
| Dollar
values in thousands |
| Net
Assets |
$16,268 |
| Number
of Portfolio Holdings |
76 |
| Total
Investment Advisory Fees (net of waivers and reimbursements) |
$– |
| Portfolio
Turnover Rate |
14.73% |
|
| Holdings [Text Block] |
REGION
ALLOCATION
(As
a Percentage of Total Net Assets)
| Region |
|
| Americas |
86.1% |
| Europe |
9.8% |
| Emerging Markets |
2.8% |
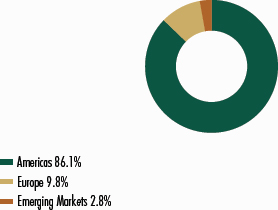
| TRADING
CURRENCIES | |
| | |
| | |
| | |
| Currency | |
| Percentage of
Total Investments |
| British pound | |
| 2.1 | % |
| Euro | |
| 5.6 | |
| Hong
Kong dollar | |
| 1.4 | |
| Swiss franc | |
| 1.0 | |
| U.S.
dollar | |
| 89.9 | |
| Total
investments | |
| 100.0 | % |
PORTFOLIO
DIVERSIFICATION
(As
a Percentage of Total Investments)
| Sector |
|
| Communication Services |
8.7% |
| Consumer Discretionary |
9.2% |
| Consumer Staples |
16.7% |
| Energy |
7.4% |
| Financials |
18.7% |
| Health Care |
7.0% |
| Industrials |
8.2% |
| Information Technology |
2.9% |
| Real Estate |
9.5% |
| Utilities |
10.5% |
| Short-Term Investment |
1.2% |
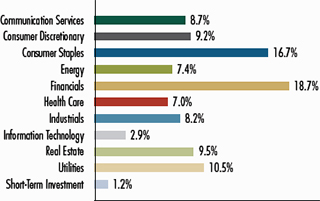
|
| Largest Holdings [Text Block] |
| Company Name | |
Country |
Percentage
of Total
Net Assets |
| Philip Morris
International, Inc. | |
United States |
4.1 | % |
| Lamar Advertising Co. | |
United States |
3.3 | |
| Cable One, Inc. | |
United States |
3.1 | |
| EOG Resources, Inc. | |
United States |
2.6 | |
| PPL Corp. | |
United States |
2.6 | |
| Heineken Holding NV | |
Netherlands |
2.6 | |
| Comcast Corp. | |
United States |
2.5 | |
| OGE Energy Corp. | |
United States |
2.4 | |
| Otis Worldwide Corp. | |
United States |
2.3 | |
| Wells
Fargo & Co. | |
United
States |
2.2 | |
| Total | |
|
27.7 | % |
| * | | Excludes short-term
investments. |
|
| Artisan Value Income Fund - Institutional Shares |
|
| Shareholder Report [Line Items] |
|
| Fund Name |
Artisan
Value Income Fund
|
| Class Name |
Institutional Shares
|
| Trading Symbol |
APHWX
|
| Annual or Semi-Annual Statement [Text Block] |
This semi-annual shareholder report contains important information
about Artisan Value Income Fund for the period of October 1, 2024
to March 31, 2025
|
| Shareholder Report Annual or Semi-Annual |
Semi-Annual
Shareholder Report
|
| Additional Information [Text Block] |
This semi-annual shareholder report contains important information
about Artisan Value Income Fund for the period of October 1, 2024
to March 31, 2025. You can find additional information about the Fund
at www.artisanpartners.com/prospectus. You can also
request this information by contacting us at 800.344.1770.
|
| Additional Information Phone Number |
800.344.1770
|
| Additional Information Website |
www.artisanpartners.com/prospectus
|
| Expenses [Text Block] |
What
were the Fund costs for the last six months?
(based
on a hypothetical $10,000 investment)
| Class
Name |
Costs
of a $10,000 investment |
Costs
paid as a percentage of a $10,000 investment |
| Institutional |
$52 |
1.05% |
| |
|
|
|
| Expenses Paid, Amount |
$ 52
|
| Expense Ratio, Percent |
1.05%
|
| Net Assets |
$ 16,268,000
|
| Holdings Count | Holdings |
76
|
| Advisory Fees Paid, Amount |
$ 0
|
| Investment Company, Portfolio Turnover |
14.73%
|
| Additional Fund Statistics [Text Block] |
| Key
Fund Statistics |
| Dollar
values in thousands |
| Net
Assets |
$16,268 |
| Number
of Portfolio Holdings |
76 |
| Total
Investment Advisory Fees (net of waivers and reimbursements) |
$– |
| Portfolio
Turnover Rate |
14.73% |
|
| Holdings [Text Block] |
REGION
ALLOCATION
(As
a Percentage of Total Net Assets)
| Region |
|
| Americas |
86.1% |
| Europe |
9.8% |
| Emerging Markets |
2.8% |

| TRADING
CURRENCIES | |
| | |
| | |
| | |
| Currency | |
| Percentage of
Total Investments |
| British pound | |
| 2.1 | % |
| Euro | |
| 5.6 | |
| Hong
Kong dollar | |
| 1.4 | |
| Swiss franc | |
| 1.0 | |
| U.S.
dollar | |
| 89.9 | |
| Total
investments | |
| 100.0 | % |
PORTFOLIO
DIVERSIFICATION
(As
a Percentage of Total Investments)
| Sector |
|
| Communication Services |
8.7% |
| Consumer Discretionary |
9.2% |
| Consumer Staples |
16.7% |
| Energy |
7.4% |
| Financials |
18.7% |
| Health Care |
7.0% |
| Industrials |
8.2% |
| Information Technology |
2.9% |
| Real Estate |
9.5% |
| Utilities |
10.5% |
| Short-Term Investment |
1.2% |
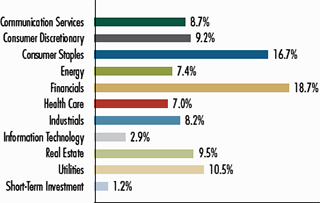
|
| Largest Holdings [Text Block] |
| Company Name | |
Country |
Percentage
of Total
Net Assets |
| Philip Morris
International, Inc. | |
United States |
4.1 | % |
| Lamar Advertising Co. | |
United States |
3.3 | |
| Cable One, Inc. | |
United States |
3.1 | |
| EOG Resources, Inc. | |
United States |
2.6 | |
| PPL Corp. | |
United States |
2.6 | |
| Heineken Holding NV | |
Netherlands |
2.6 | |
| Comcast Corp. | |
United States |
2.5 | |
| OGE Energy Corp. | |
United States |
2.4 | |
| Otis Worldwide Corp. | |
United States |
2.3 | |
| Wells
Fargo & Co. | |
United
States |
2.2 | |
| Total | |
|
27.7 | % |
| * | | Excludes short-term
investments. |
|
| Artisan Value Income Fund - Investor Shares |
|
| Shareholder Report [Line Items] |
|
| Fund Name |
Artisan
Value Income Fund
|
| Class Name |
Investor Shares
|
| Trading Symbol |
APFWX
|
| Annual or Semi-Annual Statement [Text Block] |
This semi-annual shareholder report contains important information
about Artisan Value Income Fund for the period of October 1, 2024
to March 31, 2025
|
| Shareholder Report Annual or Semi-Annual |
Semi-Annual
Shareholder Report
|
| Additional Information [Text Block] |
This semi-annual shareholder report contains important information
about Artisan Value Income Fund for the period of October 1, 2024
to March 31, 2025. You can find additional information about the Fund
at www.artisanpartners.com/prospectus. You can also
request this information by contacting us at 800.344.1770.
|
| Additional Information Phone Number |
800.344.1770
|
| Additional Information Website |
www.artisanpartners.com/prospectus
|
| Expenses [Text Block] |
What
were the Fund costs for the last six months?
(based
on a hypothetical $10,000 investment)
| Class
Name |
Costs
of a $10,000 investment |
Costs
paid as a percentage of a $10,000 investment |
| Investor |
$60 |
1.20% |
| |
|
|
|
| Expenses Paid, Amount |
$ 60
|
| Expense Ratio, Percent |
1.20%
|
| Net Assets |
$ 16,268,000
|
| Holdings Count | Holdings |
76
|
| Advisory Fees Paid, Amount |
$ 0
|
| Investment Company, Portfolio Turnover |
14.73%
|
| Additional Fund Statistics [Text Block] |
| Key
Fund Statistics |
| Dollar
values in thousands |
| Net
Assets |
$16,268 |
| Number
of Portfolio Holdings |
76 |
| Total
Investment Advisory Fees (net of waivers and reimbursements) |
$– |
| Portfolio
Turnover Rate |
14.73% |
|
| Holdings [Text Block] |
REGION
ALLOCATION
(As
a Percentage of Total Net Assets)
| Region |
|
| Americas |
86.1% |
| Europe |
9.8% |
| Emerging Markets |
2.8% |

| TRADING
CURRENCIES | |
| | |
| | |
| | |
| Currency | |
| Percentage of
Total Investments |
| British pound | |
| 2.1 | % |
| Euro | |
| 5.6 | |
| Hong
Kong dollar | |
| 1.4 | |
| Swiss franc | |
| 1.0 | |
| U.S.
dollar | |
| 89.9 | |
| Total
investments | |
| 100.0 | % |
PORTFOLIO
DIVERSIFICATION
(As
a Percentage of Total Investments)
| Sector |
|
| Communication Services |
8.7% |
| Consumer Discretionary |
9.2% |
| Consumer Staples |
16.7% |
| Energy |
7.4% |
| Financials |
18.7% |
| Health Care |
7.0% |
| Industrials |
8.2% |
| Information Technology |
2.9% |
| Real Estate |
9.5% |
| Utilities |
10.5% |
| Short-Term Investment |
1.2% |
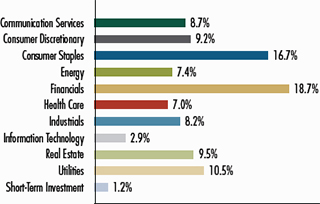
|
| Largest Holdings [Text Block] |
| Company Name | |
Country |
Percentage
of Total
Net Assets |
| Philip Morris
International, Inc. | |
United States |
4.1 | % |
| Lamar Advertising Co. | |
United States |
3.3 | |
| Cable One, Inc. | |
United States |
3.1 | |
| EOG Resources, Inc. | |
United States |
2.6 | |
| PPL Corp. | |
United States |
2.6 | |
| Heineken Holding NV | |
Netherlands |
2.6 | |
| Comcast Corp. | |
United States |
2.5 | |
| OGE Energy Corp. | |
United States |
2.4 | |
| Otis Worldwide Corp. | |
United States |
2.3 | |
| Wells
Fargo & Co. | |
United
States |
2.2 | |
| Total | |
|
27.7 | % |
| * | | Excludes short-term
investments. |
|