Pay vs Performance Disclosure - USD ($)
|
12 Months Ended |
Dec. 31, 2024 |
Dec. 31, 2023 |
Dec. 31, 2022 |
Dec. 31, 2021 |
Dec. 31, 2020 |
| Pay vs Performance Disclosure |
|
|
|
|
|
| Pay vs Performance Disclosure, Table |
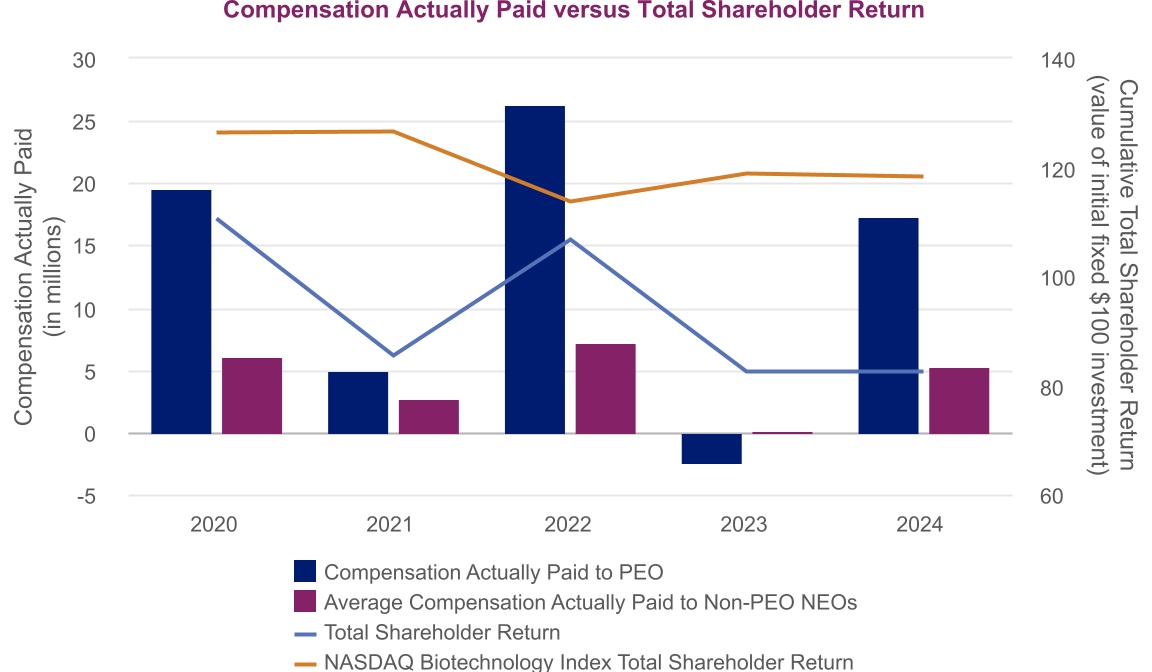
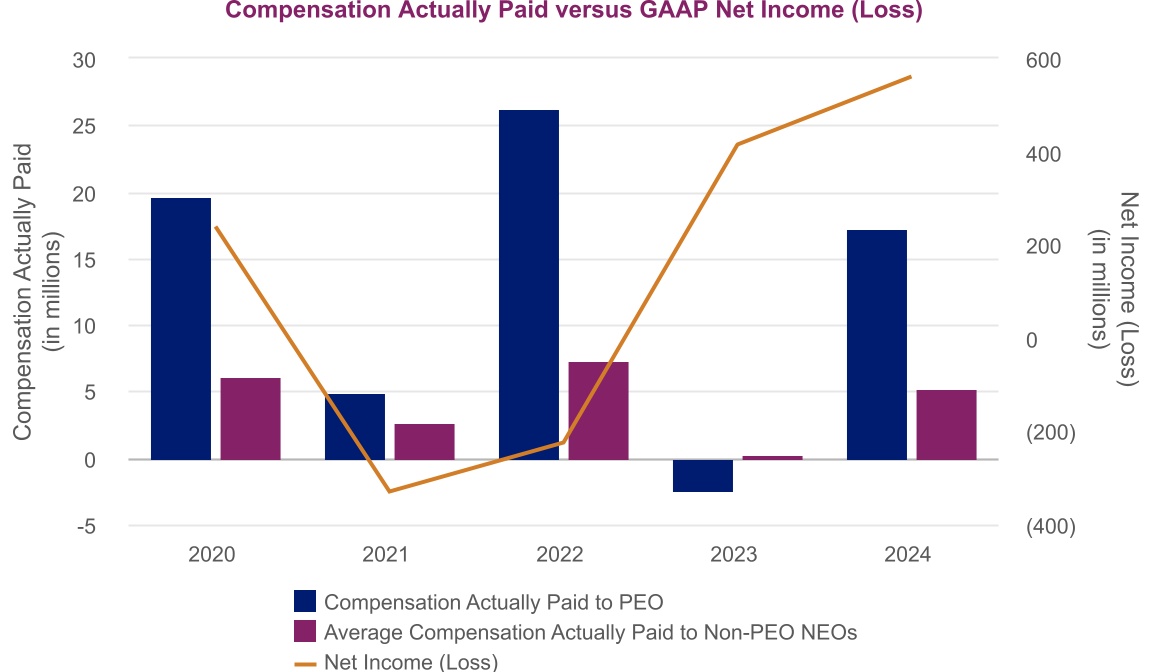
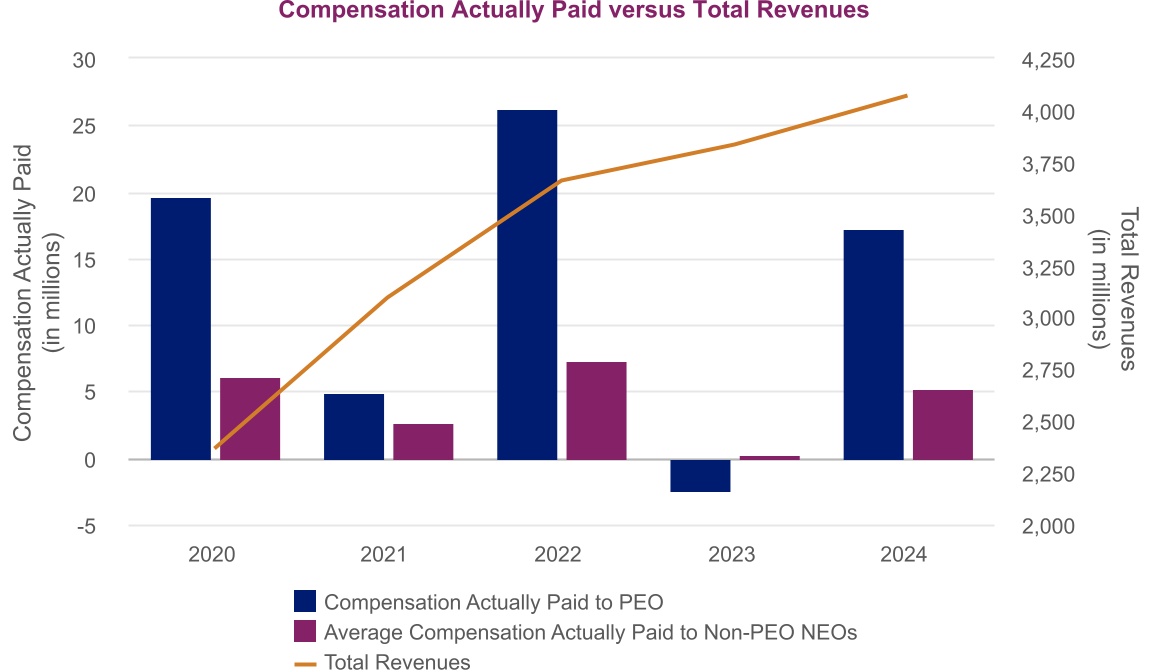
| | | | | | | | | | | | | | | | | | | | | | | | | | | | | | | | | | | | | | Summary Compensation Table Total for PEO ($)(1) | Compensation Actually Paid to PEO ($)(2) | Average Summary Compensation Table Total for Non-PEO NEOs ($)(1) | Average Compensation Actually Paid to Non-PEO NEOs ($)(2) | | Value of Initial Fixed $100 Investment Based On: | Net Income (Loss) ($ in thousands)(4) | Total Revenues ($ in thousands)(5) | | | Year | | TSR ($)(3) | Peer Group TSR ($)(3) | | | | | | | | | | | | | | | 2024 | 15,527,464 | 17,262,015 | 4,695,635 | 5,200,146 | | 82.50 | 118.20 | 560,120 | 4,068,950 | | | 2023 | 15,341,235 | (2,503,427) | 4,231,034 | 208,193 | | 82.40 | 118.87 | 414,832 | 3,834,204 | | | 2022 | 17,325,618 | 26,315,005 | 5,035,509 | 7,254,180 | | 106.72 | 113.65 | (224,060) | 3,659,374 | | | 2021 | 15,679,311 | 4,921,238 | 4,544,613 | 2,655,063 | | 85.34 | 126.45 | (329,668) | 3,094,238 | | | 2020 | 12,573,300 | 19,597,659 | 4,091,303 | 6,154,655 | | 110.56 | 126.42 | 238,616 | 2,363,567 | |
|
|
|
|
|
| Company Selected Measure Name |
total revenues
|
|
|
|
|
| Named Executive Officers, Footnote |
For each FY, represents amount reported for our PEO and average amount reported for our non-PEO NEOs, in each case in the Total column of the Summary Compensation Table. Our PEO and our non-PEO NEOs for each of the applicable years were as follows: | | | | | | | | | | | | | | | | Year | PEO | Non-PEO NEOs | | | | | | | | 2024 | Bruce C. Cozadd | Renee Gala, Patricia Carr, Robert Iannone, Philip Johnson and Samantha Pearce | | | 2023 | Bruce C. Cozadd | Renee Gala, Patricia Carr, Robert Iannone, Neena Patil, Daniel N. Swisher, Jr. and Kim Sablich | | | 2022 | Bruce C. Cozadd | Daniel N. Swisher, Jr., Renee Gala, Robert Iannone and Kim Sablich | | | 2021 | Bruce C. Cozadd | Daniel N. Swisher, Jr., Renee Gala, Robert Iannone and Chris Tovey | | | 2020 | Bruce C. Cozadd | Daniel N. Swisher, Jr., Renee Gala, Robert Iannone and Kim Sablich | |
|
|
|
|
|
| Peer Group Issuers, Footnote |
For the relevant fiscal year, represents the cumulative TSR of our ordinary shares and the NASDAQ Biotechnology Index at the end of each fiscal year. In each case, assume an initial investment of $100 on December 31, 2019, and reinvestment of dividends, if any.
|
|
|
|
|
| PEO Total Compensation Amount |
$ 15,527,464
|
$ 15,341,235
|
$ 17,325,618
|
$ 15,679,311
|
$ 12,573,300
|
| PEO Actually Paid Compensation Amount |
$ 17,262,015
|
(2,503,427)
|
26,315,005
|
4,921,238
|
19,597,659
|
| Adjustment To PEO Compensation, Footnote |
Amounts represent Compensation Actually Paid to our PEO and the average Compensation Actually Paid to our non-PEO NEOs for the relevant fiscal year. Compensation Actually Paid represents the amount reported in the Total column of the Summary Compensation Table for the applicable FY, adjusted as shown below. For the purposes of the below adjustments, the fair value of equity awards on the applicable date were determined in accordance with FASB ASC 718, using valuation methodologies that are generally consistent with those used to determine the grant-date fair value for accounting purposes. Fair value or change in fair value, as applicable, of equity awards in the Compensation Actually Paid columns was determined as follows: (i) for RSUs, the closing price of our ordinary shares on the applicable fiscal year-end date, or, in the case of vesting RSUs, the closing price of our ordinary shares on the applicable vesting date; (ii) for PSUs, the closing fair value of the awards using a Monte-Carlo simulation method, multiplied by a factor reflecting achievement of the probable outcome of the cumulative performance objective as of the measurement date; and (iii) for stock options, the closing fair value of the stock options based on a Black-Scholes option pricing model on the applicable fiscal year-end date, or, in the case of vesting stock options, the closing fair value on the applicable vesting date. Details of the adjustments made to the Summary Compensation Table are as follows: | | | | | | | | | | | | | | | | | | | | | | | | | | 2024 | | | | | | | | | Adjustments | PEO
($) | Average Non-PEO NEOs
($) | | | | | | | | | | | | | | | | | | | | | | | | | | Total compensation as reported in the Summary Compensation Table | 15,527,464 | 4,695,635 | | | | | | | | | | | | (Deduct): Grant date fair value of awards as reported in the Stock Awards column in the Summary Compensation Table for current FY | (12,799,687) | (3,439,493) | | | | | | | | | | | | Add: ASC 718 fair value of awards granted during applicable fiscal year that remain unvested as of current fiscal year-end, determined as of applicable fiscal year-end | 14,526,756 | 3,926,373 | | | | | | | | | | | | Add: Change in ASC 718 fair value from prior fiscal year-end to current fiscal year-end of awards granted during prior FYs that were outstanding and unvested as of applicable fiscal year-end | 331,883 | 64,690 | | | | | | | | | | | | Add: Change in ASC 718 fair value from prior fiscal year-end to vesting date of awards granted during prior fiscal years that vested during current fiscal year | (324,401) | (47,059) | | | | | | | | | | | | Total Adjustments | 1,734,551 | 504,511 | | | | | | | | | | | | Compensation Actually Paid | 17,262,015 | 5,200,146 | | | | | | | | | | |
|
|
|
|
|
| Non-PEO NEO Average Total Compensation Amount |
$ 4,695,635
|
4,231,034
|
5,035,509
|
4,544,613
|
4,091,303
|
| Non-PEO NEO Average Compensation Actually Paid Amount |
$ 5,200,146
|
208,193
|
7,254,180
|
2,655,063
|
6,154,655
|
| Adjustment to Non-PEO NEO Compensation Footnote |
Amounts represent Compensation Actually Paid to our PEO and the average Compensation Actually Paid to our non-PEO NEOs for the relevant fiscal year. Compensation Actually Paid represents the amount reported in the Total column of the Summary Compensation Table for the applicable FY, adjusted as shown below. For the purposes of the below adjustments, the fair value of equity awards on the applicable date were determined in accordance with FASB ASC 718, using valuation methodologies that are generally consistent with those used to determine the grant-date fair value for accounting purposes. Fair value or change in fair value, as applicable, of equity awards in the Compensation Actually Paid columns was determined as follows: (i) for RSUs, the closing price of our ordinary shares on the applicable fiscal year-end date, or, in the case of vesting RSUs, the closing price of our ordinary shares on the applicable vesting date; (ii) for PSUs, the closing fair value of the awards using a Monte-Carlo simulation method, multiplied by a factor reflecting achievement of the probable outcome of the cumulative performance objective as of the measurement date; and (iii) for stock options, the closing fair value of the stock options based on a Black-Scholes option pricing model on the applicable fiscal year-end date, or, in the case of vesting stock options, the closing fair value on the applicable vesting date. Details of the adjustments made to the Summary Compensation Table are as follows: | | | | | | | | | | | | | | | | | | | | | | | | | | 2024 | | | | | | | | | Adjustments | PEO
($) | Average Non-PEO NEOs
($) | | | | | | | | | | | | | | | | | | | | | | | | | | Total compensation as reported in the Summary Compensation Table | 15,527,464 | 4,695,635 | | | | | | | | | | | | (Deduct): Grant date fair value of awards as reported in the Stock Awards column in the Summary Compensation Table for current FY | (12,799,687) | (3,439,493) | | | | | | | | | | | | Add: ASC 718 fair value of awards granted during applicable fiscal year that remain unvested as of current fiscal year-end, determined as of applicable fiscal year-end | 14,526,756 | 3,926,373 | | | | | | | | | | | | Add: Change in ASC 718 fair value from prior fiscal year-end to current fiscal year-end of awards granted during prior FYs that were outstanding and unvested as of applicable fiscal year-end | 331,883 | 64,690 | | | | | | | | | | | | Add: Change in ASC 718 fair value from prior fiscal year-end to vesting date of awards granted during prior fiscal years that vested during current fiscal year | (324,401) | (47,059) | | | | | | | | | | | | Total Adjustments | 1,734,551 | 504,511 | | | | | | | | | | | | Compensation Actually Paid | 17,262,015 | 5,200,146 | | | | | | | | | | |
|
|
|
|
|
| Compensation Actually Paid vs. Total Shareholder Return |
|
|
|
|
|
| Compensation Actually Paid vs. Net Income |
|
|
|
|
|
| Compensation Actually Paid vs. Company Selected Measure |
|
|
|
|
|
| Total Shareholder Return Vs Peer Group |
|
|
|
|
|
| Tabular List, Table |
Total Revenues •Revenue (product- / therapeutic area-specific) •Non-GAAP Adjusted Operating Margin •Relative TSR •Pipeline Progression •Regulatory Advancement
|
|
|
|
|
| Total Shareholder Return Amount |
$ 82.50
|
82.40
|
106.72
|
85.34
|
110.56
|
| Peer Group Total Shareholder Return Amount |
118.20
|
118.87
|
113.65
|
126.45
|
126.42
|
| Net Income (Loss) |
$ 560,120,000
|
$ 414,832,000
|
$ (224,060,000)
|
$ (329,668,000)
|
$ 238,616,000
|
| Company Selected Measure Amount |
4,068,950,000
|
3,834,204,000
|
3,659,374,000
|
3,094,238,000
|
2,363,567,000
|
| PEO Name |
Bruce C. Cozadd
|
Bruce C. Cozadd
|
Bruce C. Cozadd
|
Bruce C. Cozadd
|
Bruce C. Cozadd
|
| Additional 402(v) Disclosure |
The disclosure included in this section is prescribed by SEC rules and does not necessarily align with how we or our Compensation Committee view the link between our performance and NEO pay. For additional information about our pay-for-performance philosophy and how we align executive compensation our Company performance, refer to the “Executive Compensation—Compensation Discussion and Analysis” section above. Required Tabular Disclosure of Pay Versus Performance The table below reflects information regarding the compensation of our NEOs for fiscal years 2024, 2023, 2022, 2021 and 2020, as well as our financial performance for each of these FYs in accordance with SEC rules. The amounts set forth below under the headings “Compensation Actually Paid to PEO” and “Average Compensation Actually Paid to Non-PEO NEOs” have been calculated in a manner consistent with Item 402(v) of Regulation S-K. Use of the term “compensation actually paid” is required by the SEC’s rules and as a result of the calculation methodology required by the SEC, such amounts differ from compensation actually received by the individuals and the compensation decisions described in the “Executive Compensation—Compensation Discussion and Analysis” section above. The amounts represent the net income (loss) as reported in our audited financial statements for the applicable fiscal year.As required by Item 402(v) of Regulation S-K, we have determined that the Company-Selected Measure is total revenues as reported in our audited financial statements for the applicable fiscal year.The most important financial and non-financial performance measures used by us to link compensation actually paid to our NEOs for the most recently completed fiscal year to our performance are set forth below. For further information regarding these performance metrics and their function in our executive compensation program, please see “Executive Compensation—Compensation Discussion and Analysis” above. As required by Item 402(v) of Regulation S-K, we are providing the following graphs to illustrate the relationship between the pay and performance figures that are included in the pay versus performance tabular disclosure above. In addition, the first graph below further illustrates the relationship between company TSR and that of the NASDAQ Biotechnology Index. As noted above, compensation actually paid for purposes of the tabular disclosure and the following graphs were calculated in accordance with SEC rules and do not fully represent the actual final amount of compensation earned by or actually paid to our NEOs during the applicable years. All information provided above under the “Item 402(v) Pay Versus Performance” heading will not be deemed to be incorporated by reference into any filing by us under the Securities Act of 1933, as amended, or the Securities Exchange Act of 1934, as amended, whether made before or after the date hereof and irrespective of any general incorporation language in any such filing, except to the extent we specifically incorporate such information by reference.
|
|
|
|
|
| Measure:: 1 |
|
|
|
|
|
| Pay vs Performance Disclosure |
|
|
|
|
|
| Name |
Total Revenues
|
|
|
|
|
| Measure:: 2 |
|
|
|
|
|
| Pay vs Performance Disclosure |
|
|
|
|
|
| Name |
Revenue (product- / therapeutic area-specific)
|
|
|
|
|
| Measure:: 3 |
|
|
|
|
|
| Pay vs Performance Disclosure |
|
|
|
|
|
| Name |
Non-GAAP Adjusted Operating Margin
|
|
|
|
|
| Measure:: 4 |
|
|
|
|
|
| Pay vs Performance Disclosure |
|
|
|
|
|
| Name |
Relative TSR
|
|
|
|
|
| Measure:: 5 |
|
|
|
|
|
| Pay vs Performance Disclosure |
|
|
|
|
|
| Name |
Pipeline Progression
|
|
|
|
|
| Measure:: 6 |
|
|
|
|
|
| Pay vs Performance Disclosure |
|
|
|
|
|
| Name |
Regulatory Advancement
|
|
|
|
|
| PEO [Member] | Equity Awards Adjustments |
|
|
|
|
|
| Pay vs Performance Disclosure |
|
|
|
|
|
| Adjustment to Compensation, Amount |
$ 1,734,551
|
|
|
|
|
| PEO [Member] | Aggregate Grant Date Fair Value of Equity Award Amounts Reported in Summary Compensation Table |
|
|
|
|
|
| Pay vs Performance Disclosure |
|
|
|
|
|
| Adjustment to Compensation, Amount |
(12,799,687)
|
|
|
|
|
| PEO [Member] | Year-end Fair Value of Equity Awards Granted in Covered Year that are Outstanding and Unvested |
|
|
|
|
|
| Pay vs Performance Disclosure |
|
|
|
|
|
| Adjustment to Compensation, Amount |
14,526,756
|
|
|
|
|
| PEO [Member] | Change in Fair Value as of Vesting Date of Prior Year Equity Awards Vested in Covered Year |
|
|
|
|
|
| Pay vs Performance Disclosure |
|
|
|
|
|
| Adjustment to Compensation, Amount |
(324,401)
|
|
|
|
|
| PEO [Member] | Prior Year End Fair Value of Equity Awards Granted in Any Prior Year that Fail to Meet Applicable Vesting Conditions During Covered Year |
|
|
|
|
|
| Pay vs Performance Disclosure |
|
|
|
|
|
| Adjustment to Compensation, Amount |
331,883
|
|
|
|
|
| Non-PEO NEO [Member] | Equity Awards Adjustments |
|
|
|
|
|
| Pay vs Performance Disclosure |
|
|
|
|
|
| Adjustment to Compensation, Amount |
504,511
|
|
|
|
|
| Non-PEO NEO [Member] | Aggregate Grant Date Fair Value of Equity Award Amounts Reported in Summary Compensation Table |
|
|
|
|
|
| Pay vs Performance Disclosure |
|
|
|
|
|
| Adjustment to Compensation, Amount |
(3,439,493)
|
|
|
|
|
| Non-PEO NEO [Member] | Year-end Fair Value of Equity Awards Granted in Covered Year that are Outstanding and Unvested |
|
|
|
|
|
| Pay vs Performance Disclosure |
|
|
|
|
|
| Adjustment to Compensation, Amount |
3,926,373
|
|
|
|
|
| Non-PEO NEO [Member] | Change in Fair Value as of Vesting Date of Prior Year Equity Awards Vested in Covered Year |
|
|
|
|
|
| Pay vs Performance Disclosure |
|
|
|
|
|
| Adjustment to Compensation, Amount |
(47,059)
|
|
|
|
|
| Non-PEO NEO [Member] | Prior Year End Fair Value of Equity Awards Granted in Any Prior Year that Fail to Meet Applicable Vesting Conditions During Covered Year |
|
|
|
|
|
| Pay vs Performance Disclosure |
|
|
|
|
|
| Adjustment to Compensation, Amount |
$ 64,690
|
|
|
|
|