Shareholder Report
|
12 Months Ended |
|
Mar. 31, 2025
USD ($)
Holding
|
|---|
| Shareholder Report [Line Items] |
|
| Document Type |
N-CSR
|
| Amendment Flag |
false
|
| Registrant Name |
Krane Shares Trust
|
| Entity Central Index Key |
0001547576
|
| Entity Investment Company Type |
N-1A
|
| Document Period End Date |
Mar. 31, 2025
|
| C000211437 |
|
| Shareholder Report [Line Items] |
|
| Fund Name |
Quadratic Interest Rate Volatility and Inflation Hedge ETF
|
| Class Name |
Quadratic Interest Rate Volatility and Inflation Hedge ETF
|
| Trading Symbol |
IVOL
|
| Security Exchange Name |
NYSEArca
|
| Annual or Semi-Annual Statement [Text Block] |
This annual shareholder report contains important information about the Quadratic Interest Rate Volatility and Inflation Hedge ETF (the "Fund") for the period from April 1, 2024 to March 31, 2025.
|
| Shareholder Report Annual or Semi-Annual |
Annual Shareholder Report
|
| Additional Information [Text Block] |
You can find additional information about the Fund at https://kfafunds.com/ivol/. You can also request this information by contacting us at 1-833-IVOL-ETF (1-833-486-5383).
|
| Additional Information Phone Number |
1-833-IVOL-ETF (1-833-486-5383)
|
| Additional Information Website |
https://kfafunds.com/ivol/
|
| Expenses [Text Block] |
What were the Fund costs for the last year?(based on a hypothetical $10,000 investment) Fund Name | Costs of a $10,000 investment | Costs paid as a percentage of a $10,000 investment |
|---|
Quadratic Interest Rate Volatility and Inflation Hedge ETF | $101 | 1.00% |
|---|
|
| Expenses Paid, Amount |
$ 101
|
| Expense Ratio, Percent |
1.00%
|
| Factors Affecting Performance [Text Block] |
How did the Fund perform in the last year?During the Funds’ fiscal year ended March 31, 2025 (“the period”), the macro environment was challenging. At the beginning of 2024, 150 bps of Fed cuts were priced in, but the Fed ultimately delivered only 100 bps of cuts. Major central banks across the world tried to balance the risk of persistently high inflation with the risk of keeping interest rates too high and pushing economies into recession. As the year passed, investors grew less concerned with inflation and more concerned about a potential recession. There remains a persistent concern with the high U.S. Federal deficit and its impact on the government’s overall debt servicing costs. More recently in 2025, the headlines have been focused on the new administration as it imposes new tariffs and negotiates trade deals with other countries. It is still unclear how this process will play out and how it will impact the economy. A significant amount of uncertainty remains, and markets are likely still not pricing in the vast array of outcomes. IVOL is a fixed income ETF that seeks to hedge relative interest rate movements, whether these movements arise from falling short-term interest rates or rising long-term interest rates, and to benefit from market stress when fixed income volatility increases, while providing the potential for enhanced inflation-protected income. During the period, IVOL underperformed an index of TIPS alone. (Please note that this passive bond index is provided for comparative purposes only, as the fund’s strategy is benchmark agnostic.) This was a result of IVOL’s options positions losing value. Specifically, implied volatility fell, and the spot curve did not meet where the forward curve was priced. Instead, the curve steepened far less than expected and flattened the forwards as a result of fewer Fed cuts than were expected. The spot curve only reverted to a positive slope in early 2025, after having been inverted since mid-2022. This was the longest period of inversion since 1978, when the data became available, and this multi-year inversion negatively impacted IVOL's performance. |
| Performance Past Does Not Indicate Future [Text] |
Past performance is not indicative of future performance.
|
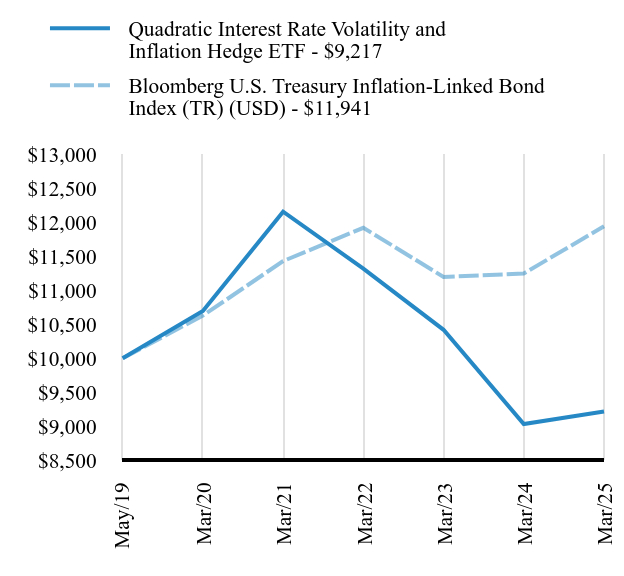
| Line Graph [Table Text Block] |
| Quadratic Interest Rate Volatility and Inflation Hedge ETF - $9217 | Bloomberg U.S. Treasury Inflation-Linked Bond Index (TR) (USD) - $11941 |
|---|
May/19 | $10000 | $10000 |
|---|
Mar/20 | $10695 | $10628 |
|---|
Mar/21 | $12155 | $11429 |
|---|
Mar/22 | $11319 | $11919 |
|---|
Mar/23 | $10419 | $11196 |
|---|
Mar/24 | $9033 | $11247 |
|---|
Mar/25 | $9217 | $11941 |
|---|
|
| Average Annual Return [Table Text Block] |
Fund/Index Name | 1 Year | 5 Years |
Since
Inception |
|---|
Quadratic Interest Rate Volatility and Inflation Hedge ETF | 2.03% | -2.93% | -1.38% |
|---|
Bloomberg U.S. Treasury Inflation-Linked Bond Index (TR) (USD) | 6.17% | 2.36% | 3.06% |
|---|
|
| No Deduction of Taxes [Text Block] |
The table and graph presented above do not reflect the deduction of taxes a shareholder would pay on Fund distributions or the redemption of Fund shares.
|
| AssetsNet |
$ 477,783,321
|
| Holdings Count | Holding |
8
|
| Advisory Fees Paid, Amount |
$ 6,028,220
|
| InvestmentCompanyPortfolioTurnover |
0.00%
|
| Additional Fund Statistics [Text Block] |
Key Fund Statistics as of March 31, 2025 | Total Net Assets | Number of Holdings | Total Advisory Fees Paid | Portfolio Turnover Rate |
|---|
| $477,783,321 | 8 | $6,028,220 | 0% |
|---|
|
| Holdings [Text Block] |
Asset WeightingsFootnote Reference*Footnote Reference^ Value | Value |
|---|
Purchased OptionsFootnote Reference(1) | 13.7% | Exchange Traded Funds | 79.8% |
| Footnote | Description | Footnote* | Percentages are calculated based on total net assets. | Footnote^ | Investments as a percentage of total net assets will not add up to 100% because this chart does not include cash and other assets and liabilities. The difference between 100% and the sum of the percentages above is mostly cash held by the fund. | Footnote(1) | At market value. |
|
| Largest Holdings [Text Block] |
Holding Name | | | Percentage of
Total Net Assets |
|---|
Schwab US TIPS ETF | | | 79.8% | Purchased Option - CMS 10Y - 2Y, 0.05%, 04/08/26, Footnote Reference(1) | | | 4.1% | Purchased Option - CMS 10Y - 2Y, 0.10%, 07/15/26, Footnote Reference(1) | | | 2.5% | Purchased Option - CMS 10Y - 2Y, 0.20%, 04/14/27, Footnote Reference(1) | | | 2.4% | Purchased Option - CMS 10Y - 2Y, 0.03%, 01/28/26, Footnote Reference(1) | | | 1.9% | Purchased Option - CMS 10Y - 2Y, 0.28%, 12/09/26, Footnote Reference(1) | | | 1.4% | Purchased Option - CMS 10Y - 2Y, 0.08%, 09/17/25, Footnote Reference(1) | | | 0.9% | Purchased Option - CMS 10Y - 2Y, 0.13%, 06/25/25, Footnote Reference(1) | | | 0.5% |
| Footnote | Description | Footnote(1) | At market value. |
|
| Material Fund Change [Text Block] |
There were no material changes during the reporting period. |
| Updated Prospectus Web Address |
https://kfafunds.com/ivol/
|
| C000225265 |
|
| Shareholder Report [Line Items] |
|
| Fund Name |
Quadratic Deflation ETF
|
| Class Name |
Quadratic Deflation ETF
|
| Trading Symbol |
BNDD
|
| Security Exchange Name |
NYSEArca
|
| Annual or Semi-Annual Statement [Text Block] |
This annual shareholder report contains important information about the Quadratic Deflation ETF (the "Fund") for the period from April 1, 2024 to March 31, 2025.
|
| Shareholder Report Annual or Semi-Annual |
Annual Shareholder Report
|
| Additional Information [Text Block] |
You can find additional information about the Fund at https://kfafunds.com/bndd/. You can also request this information by contacting us at 1-888-BNDD-007 (1-888-263-3007).
|
| Additional Information Phone Number |
1-888-BNDD-007 (1-888-263-3007)
|
| Additional Information Website |
https://kfafunds.com/bndd/
|
| Expenses [Text Block] |
What were the Fund costs for the last year?(based on a hypothetical $10,000 investment) Fund Name | Costs of a $10,000 investment | Costs paid as a percentage of a $10,000 investment |
|---|
Quadratic Deflation ETF | $96 | 1.00% |
|---|
|
| Expenses Paid, Amount |
$ 96
|
| Expense Ratio, Percent |
1.00%
|
| Factors Affecting Performance [Text Block] |
How did the Fund perform in the last year?During the Funds’ fiscal year ended March 31, 2025 (“the period”), the macro environment was challenging. At the beginning of 2024, 150 bps of Fed cuts were priced in, but the Fed ultimately delivered only 100 bps of cuts. Major central banks across the world tried to balance the risk of persistently high inflation with the risk of keeping interest rates too high and pushing economies into recession. As the year passed, investors grew less concerned with inflation and more concerned about a potential recession. There remains a persistent concern with the high U.S. Federal deficit and its impact on the government’s overall debt servicing costs. More recently in 2025, the headlines have been focused on the new administration as it imposes new tariffs and negotiates trade deals with other countries. It is still unclear how this process will play out and how it will impact the economy. A significant amount of uncertainty remains, and markets are likely still not pricing in the vast array of outcomes. BNDD is a fixed income ETF that seeks to benefit from lower growth, deflation, lower or negative long-term interest rates, and/or a reduction in the spread between shorter and longer term interest rates by investing in U.S. Treasuries and options. BNDD significantly underperformed an index composed entirely of long-dated Treasury bonds during the period. (Please note that this passive bond index is provided for comparative purposes only, as the fund’s strategy is benchmark agnostic.) This was largely due to BNDD’s options exposure, which lost value as front-end rates declined and long-end rates rose. BNDD owns options related to the spread between shorter and longer term interest rates. Its options are designed to increase in value in times of lower growth, deflation, and lower or negative long-term interest rates. During the period, the options owned by BNDD decreased in value. It was this dynamic which caused it to underperform a portfolio of only long-dated Treasuries. |
| Performance Past Does Not Indicate Future [Text] |
Past performance is not indicative of future performance.
|
| No Deduction of Taxes [Text Block] |
The table and graph presented above do not reflect the deduction of taxes a shareholder would pay on Fund distributions or the redemption of Fund shares.
|
| AssetsNet |
$ 10,362,952
|
| Holdings Count | Holding |
3
|
| Advisory Fees Paid, Amount |
$ 196,661
|
| InvestmentCompanyPortfolioTurnover |
0.00%
|
| Additional Fund Statistics [Text Block] |
Key Fund Statistics as of March 31, 2025 | Total Net Assets | Number of Holdings | Total Advisory Fees Paid | Portfolio Turnover Rate |
|---|
| $10,362,952 | 3 | $196,661 | 0% |
|---|
|
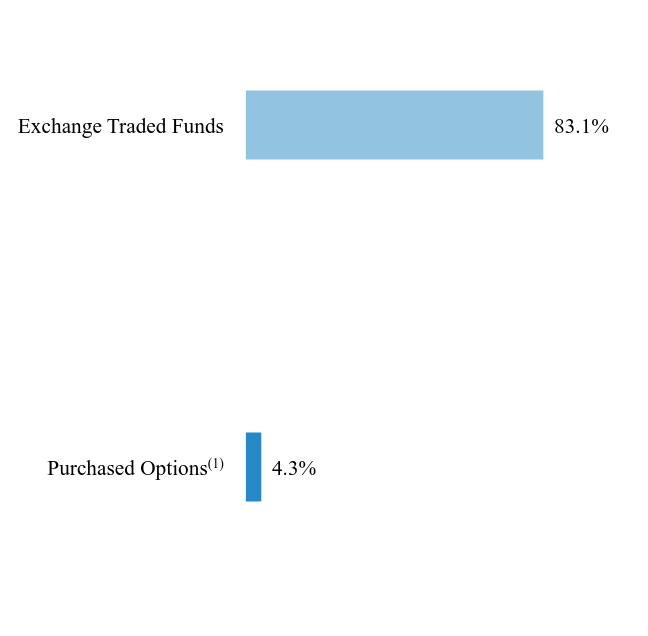
| Holdings [Text Block] |
Asset WeightingsFootnote Reference*Footnote Reference^ Value | Value |
|---|
Purchased OptionsFootnote Reference(1) | 4.3% | Exchange Traded Funds | 83.1% |
| Footnote | Description | Footnote* | Percentages are calculated based on total net assets. | Footnote^ | Investments as a percentage of total net assets will not add up to 100% because this chart does not include cash and other assets and liabilities. The difference between 100% and the sum of the percentages above is mostly cash held by the fund. | Footnote(1) | At market value. |
|
| Largest Holdings [Text Block] |
Holding Name | | | Percentage of
Total Net Assets |
|---|
Vanguard Long-Term Treasury ETF | | | 83.1% | Purchased Option - CMS 30Y – 2Y, 0.25%, 08/12/26, Footnote Reference(1) | | | 2.2% | Purchased Option - CMS 30Y – 2Y, 0.33%, 09/24/25, Footnote Reference(1) | | | 2.1% |
| Footnote | Description | Footnote(1) | At market value. |
|
| Material Fund Change [Text Block] |
There were no material changes during the reporting period. |
| Updated Prospectus Web Address |
https://kfafunds.com/bndd/
|