Shareholder Report
|
6 Months Ended |
12 Months Ended |
|
Mar. 31, 2025
USD ($)
Holding
|
Mar. 31, 2025
USD ($)
Holding
|
| Shareholder Report [Line Items] |
|
|
| Document Type |
|
N-CSR
|
| Amendment Flag |
|
false
|
| Registrant Name |
|
Krane Shares Trust
|
| Entity Central Index Key |
|
0001547576
|
| Entity Investment Company Type |
|
N-1A
|
| Document Period End Date |
Mar. 31, 2025
|
Mar. 31, 2025
|
| C000129136 |
|
|
| Shareholder Report [Line Items] |
|
|
| Fund Name |
|
KraneShares CSI China Internet ETF
|
| Class Name |
|
KraneShares CSI China Internet ETF
|
| Trading Symbol |
|
KWEB
|
| Security Exchange Name |
|
NYSEArca
|
| Annual or Semi-Annual Statement [Text Block] |
|
This annual shareholder report contains important information about the KraneShares CSI China Internet ETF (the "Fund") for the period from April 1, 2024 to March 31, 2025.
|
| Shareholder Report Annual or Semi-Annual |
|
Annual Shareholder Report
|
| Additional Information [Text Block] |
|
You can find additional information about the Fund at https://kraneshares.com/kweb/. You can also request this information by contacting us at 1-855-857-2638.
|
| Additional Information Phone Number |
|
1-855-857-2638
|
| Additional Information Website |
|
https://kraneshares.com/kweb/
|
| Expenses [Text Block] |
|
What were the Fund costs for the last year?(based on a hypothetical $10,000 investment) Fund Name | Costs of a $10,000 investment | Costs paid as a percentage of a $10,000 investment |
|---|
KraneShares CSI China Internet ETF | $83 | 0.70% |
|---|
|
| Expenses Paid, Amount |
|
$ 83
|
| Expense Ratio, Percent |
|
0.70%
|
| Factors Affecting Performance [Text Block] |
|
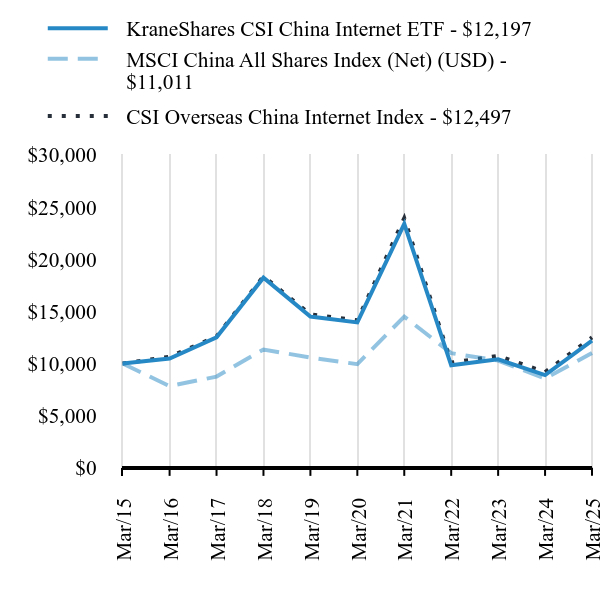
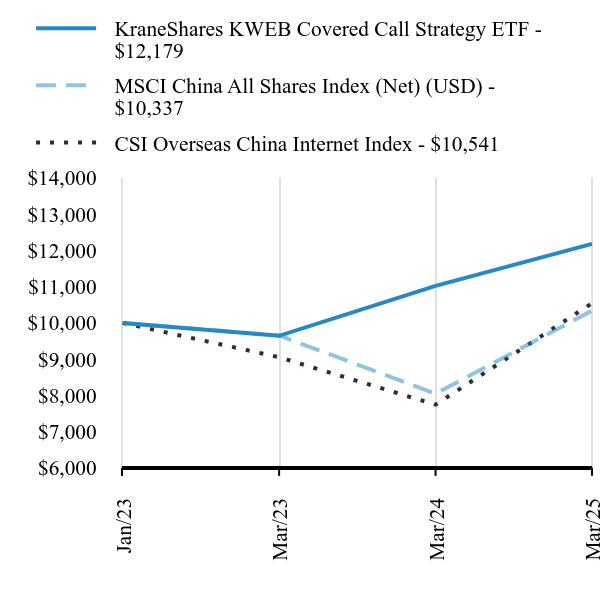
(a) CSI Overseas China Internet Index (b) The Fund is in the Morningstar U.S. ETF China Region Category The KraneShares CSI China Internet ETF seeks to provide investment results that, before expenses and fees, correspond generally to the price and yield performance of the CSI Overseas China Internet Index (the "Underlying Index"), which is designed to measure the performance of the investable universe of publicly traded China-based companies whose primary business or businesses are in the Internet and Internet-related sectors, as defined by the index sponsor, China Securities Index Co., Ltd. China's internet equities outperformed China's equity market more broadly and global equities, broadly defined, due to several positive catalysts for China's internet equities during the Period, including stimulus measures announced by China's government in September, which included a stock market stabilization fund, consumer subsidies, and rate cuts. In addition, DeepSeek, China's answer to OpenAI's ChatGPT, was reported to operate at a higher level of efficiency and demand fewer chips to train than expected, potentially eliminating concerns over chip shortages for China's internet giants. Earnings reported by China internet companies were also strong during the Period. |
| Performance Past Does Not Indicate Future [Text] |
|
Past performance is not indicative of future performance.
|
| Line Graph [Table Text Block] |
|
| KraneShares CSI China Internet ETF - $12197 | MSCI China All Shares Index (Net) (USD) - $11011 | CSI Overseas China Internet Index - $12497 |
|---|
Mar/15 | $10000 | $10000 | $10000 |
|---|
Mar/16 | $10471 | $7833 | $10645 |
|---|
Mar/17 | $12514 | $8746 | $12588 |
|---|
Mar/18 | $18223 | $11342 | $18353 |
|---|
Mar/19 | $14498 | $10569 | $14704 |
|---|
Mar/20 | $13940 | $9941 | $14139 |
|---|
Mar/21 | $23387 | $14496 | $23932 |
|---|
Mar/22 | $9824 | $10988 | $10090 |
|---|
Mar/23 | $10400 | $10281 | $10731 |
|---|
Mar/24 | $8894 | $8571 | $9181 |
|---|
Mar/25 | $12197 | $11011 | $12497 |
|---|
|
| Average Annual Return [Table Text Block] |
|
Fund/Index Name | 1 Year | 5 Years | 10 Years |
|---|
KraneShares CSI China Internet ETF | 37.13% | -2.64% | 2.01% |
|---|
MSCI China All Shares Index (Net) (USD) | 28.47% | 2.07% | 0.97% |
|---|
CSI Overseas China Internet Index | 36.11% | -2.44% | 2.25% |
|---|
|
| No Deduction of Taxes [Text Block] |
|
The table and graph presented above do not reflect the deduction of taxes a shareholder would pay on Fund distributions or the redemption of Fund shares.
|
| AssetsNet |
$ 8,047,217,081
|
$ 8,047,217,081
|
| Holdings Count | Holding |
30
|
30
|
| Advisory Fees Paid, Amount |
|
$ 40,786,079
|
| InvestmentCompanyPortfolioTurnover |
|
54.00%
|
| Additional Fund Statistics [Text Block] |
|
Key Fund Statistics as of March 31, 2025 | Total Net Assets | Number of Holdings | Total Advisory Fees Paid | Portfolio Turnover Rate |
|---|
| $8,047,217,081 | 30 | $40,786,079 | 54% |
|---|
|
| Holdings [Text Block] |
|
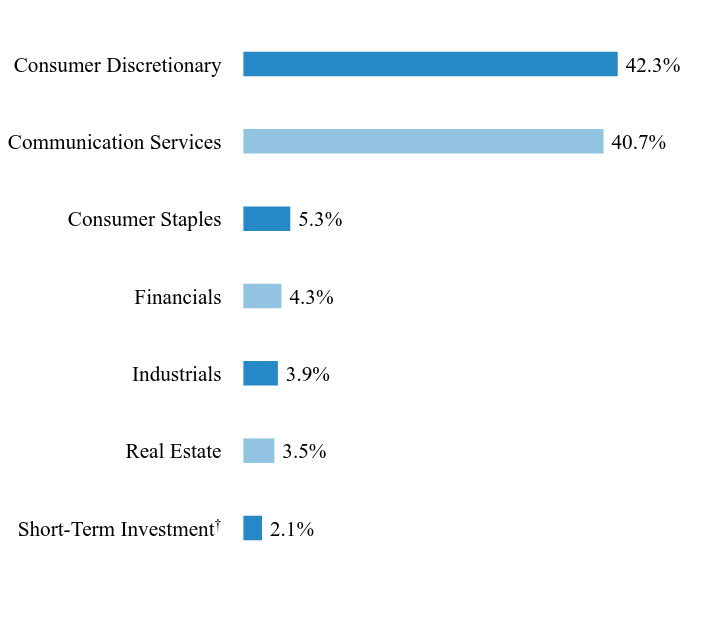
Sector WeightingsFootnote Reference*Value | Value |
|---|
Short-Term InvestmentFootnote Reference† | 2.1% | Real Estate | 3.5% | Industrials | 3.9% | Financials | 4.3% | Consumer Staples | 5.3% | Communication Services | 40.7% | Consumer Discretionary | 42.3% |
| Footnote | Description | Footnote* | Percentages are calculated based on total net assets. | Footnote† | This security, or a portion thereof, was purchased with cash collateral held from securities on loan. |
|
| Largest Holdings [Text Block] |
|
Holding Name | | | Percentage of
Total Net AssetsFootnote Reference(A) |
|---|
Alibaba Group Holding | | | 12.2% | Tencent Holdings | | | 10.8% | PDD Holdings ADR | | | 6.9% | Meituan, Cl B | | | 6.6% | Trip.com Group | | | 4.7% | Kanzhun ADR | | | 4.5% | Kuaishou Technology, Cl B | | | 4.1% | Tencent Music Entertainment Group ADR | | | 4.0% | JD.com, Cl A | | | 3.9% | Full Truck Alliance ADR | | | 3.9% |
| Footnote | Description | Footnote(A) | Short-Term Investments are not shown in the top ten chart. |
|
| Material Fund Change [Text Block] |
|
There were no material changes during the reporting period. |
| Updated Prospectus Web Address |
|
https://kraneshares.com/kweb/
|
| C000129571 |
|
|
| Shareholder Report [Line Items] |
|
|
| Fund Name |
|
KraneShares Bosera MSCI China A 50 Connect Index ETF
|
| Class Name |
|
KraneShares Bosera MSCI China A 50 Connect Index ETF
|
| Trading Symbol |
|
KBA
|
| Security Exchange Name |
|
NYSEArca
|
| Annual or Semi-Annual Statement [Text Block] |
|
This annual shareholder report contains important information about the KraneShares Bosera MSCI China A 50 Connect Index ETF (the "Fund") for the period from April 1, 2024 to March 31, 2025.
|
| Shareholder Report Annual or Semi-Annual |
|
Annual Shareholder Report
|
| Additional Information [Text Block] |
|
You can find additional information about the Fund at https://kraneshares.com/kba/. You can also request this information by contacting us at 1-855-857-2638.
|
| Additional Information Phone Number |
|
1-855-857-2638
|
| Additional Information Website |
|
https://kraneshares.com/kba/
|
| Expenses [Text Block] |
|
What were the Fund costs for the last year?(based on a hypothetical $10,000 investment) Fund Name | Costs of a $10,000 investment | Costs paid as a percentage of a $10,000 investment |
|---|
KraneShares Bosera MSCI China A 50 Connect Index ETF | $60 | 0.56% |
|---|
|
| Expenses Paid, Amount |
|
$ 60
|
| Expense Ratio, Percent |
|
0.56%
|
| Factors Affecting Performance [Text Block] |
|
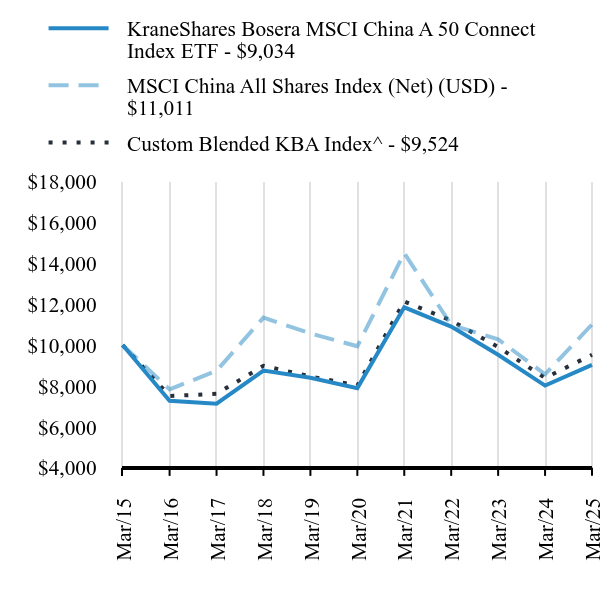
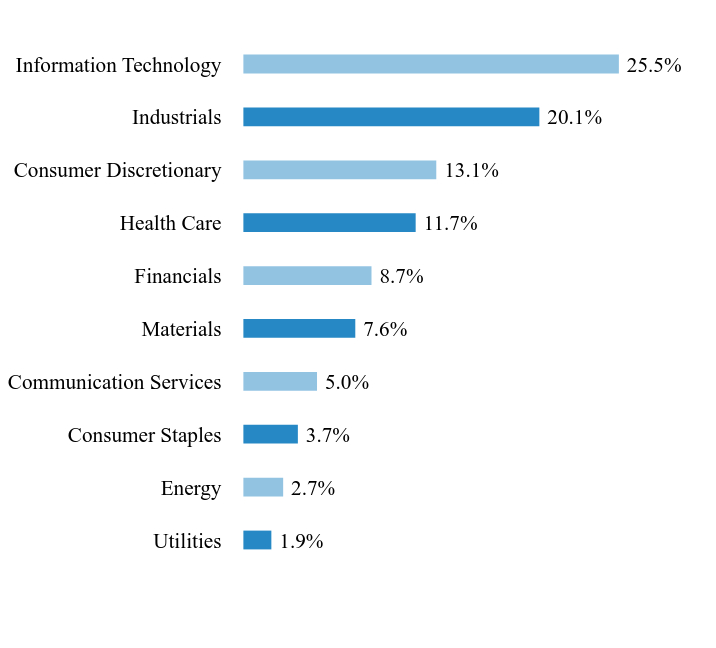
(a) MSCI China A 50 Connect Index (b) The Fund is in the Morningstar U.S. ETF China Region Category The KraneShares Bosera MSCI China A 50 Connect Index ETF seeks to provide investment results that, before fees and expenses, correspond generally to the price and yield performance of the MSCI China A 50 Connect Index (the "Underlying Index"). The Underlying Index is constructed from the MSCI China A Index (the "Parent Index"), a broad-based benchmark index, which captures large and mid-capitalization China A-shares listed on the Shanghai Stock Exchange and/or the Shenzhen Stock Exchange and accessible through the Northbound Stock Connect program. The Underlying Index is designed to reflect the performance of the 50 largest securities representing each Global Industry Classification Standard (GICS) sector at the sector weight allocation of the Parent Index. China's A-share market outpaced global equity markets during the Period, as measured by the MSCI All Country World Index (ACWI). China's A-share market benefited from the stimulus measures announced by China's government in September, which included a stock market stabilization fund, consumer subsidies, and rate cuts. Within the Fund, the best-performing sectors were Consumer Discretionary and Financials, while the worst-performing sectors were Real Estate and Energy. The deviation between the Fund's performance and that of the Underlying Index can be mainly attributed to management fees paid by the Fund. |
| Performance Past Does Not Indicate Future [Text] |
|
Past performance is not indicative of future performance.
|
| Line Graph [Table Text Block] |
|
| KraneShares Bosera MSCI China A 50 Connect Index ETF - $9034 | MSCI China All Shares Index (Net) (USD) - $11011 | Custom Blended KBA Index^ - $9524 |
|---|
Mar/15 | $10000 | $10000 | $10000 |
|---|
Mar/16 | $7282 | $7833 | $7512 |
|---|
Mar/17 | $7133 | $8746 | $7617 |
|---|
Mar/18 | $8751 | $11342 | $8987 |
|---|
Mar/19 | $8400 | $10569 | $8469 |
|---|
Mar/20 | $7897 | $9941 | $8030 |
|---|
Mar/21 | $11846 | $14496 | $12133 |
|---|
Mar/22 | $10903 | $10988 | $11201 |
|---|
Mar/23 | $9526 | $10281 | $9905 |
|---|
Mar/24 | $8022 | $8571 | $8396 |
|---|
Mar/25 | $9034 | $11011 | $9524 |
|---|
|
| Average Annual Return [Table Text Block] |
|
Fund/Index Name | 1 Year | 5 Years | 10 Years |
|---|
KraneShares Bosera MSCI China A 50 Connect Index ETF | 12.61% | 2.73% | -1.01% |
|---|
MSCI China All Shares Index (Net) (USD) | 28.47% | 2.07% | 0.97% |
|---|
Custom Blended KBA Index^ | 13.44% | 3.47% | -0.49% |
|---|
|
| No Deduction of Taxes [Text Block] |
|
The table and graph presented above do not reflect the deduction of taxes a shareholder would pay on Fund distributions or the redemption of Fund shares.
|
| AssetsNet |
$ 189,121,002
|
$ 189,121,002
|
| Holdings Count | Holding |
85
|
85
|
| Advisory Fees Paid, Amount |
|
$ 1,004,622
|
| InvestmentCompanyPortfolioTurnover |
|
77.00%
|
| Additional Fund Statistics [Text Block] |
|
Key Fund Statistics as of March 31, 2025 | Total Net Assets | Number of Holdings | Total Advisory Fees Paid | Portfolio Turnover Rate |
|---|
| $189,121,002 | 85 | $1,004,622 | 77% |
|---|
|
| Holdings [Text Block] |
|
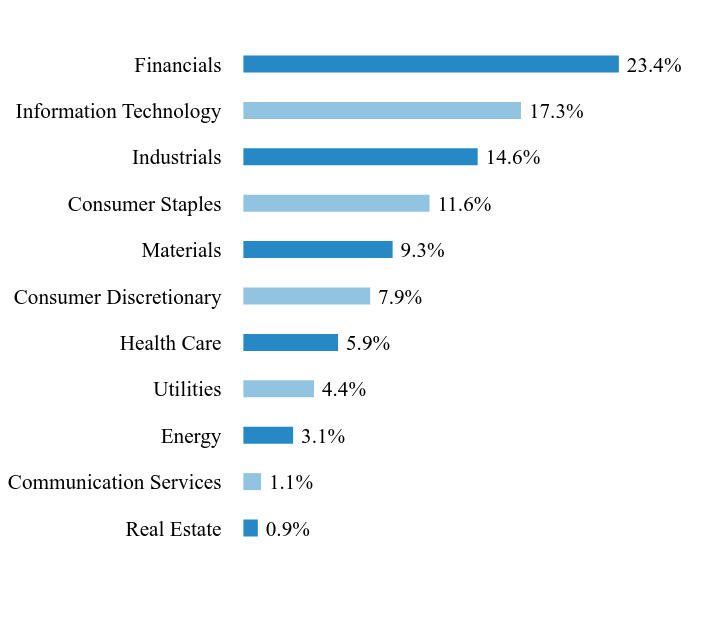
Sector WeightingsFootnote Reference*Value | Value |
|---|
Real Estate | 0.9% | Communication Services | 1.1% | Energy | 3.1% | Utilities | 4.4% | Health Care | 5.9% | Consumer Discretionary | 7.9% | Materials | 9.3% | Consumer Staples | 11.6% | Industrials | 14.6% | Information Technology | 17.3% | Financials | 23.4% |
| Footnote | Description | Footnote* | Percentages are calculated based on total net assets. |
|
| Largest Holdings [Text Block] |
|
Holding Name | | | Percentage of
Total Net Assets |
|---|
Contemporary Amperex Technology, Cl A | | | 6.6% | Kweichow Moutai, Cl A | | | 6.3% | Zijin Mining Group, Cl A | | | 5.8% | BYD, Cl A | | | 5.4% | China Merchants Bank, Cl A | | | 4.0% | Hygon Information Technology, Cl A | | | 3.7% | China Yangtze Power, Cl A | | | 3.4% | Wanhua Chemical Group, Cl A | | | 3.4% | Luxshare Precision Industry, Cl A | | | 3.3% | Jiangsu Hengrui Pharmaceuticals, Cl A | | | 3.1% |
|
| Material Fund Change [Text Block] |
|
There were no material changes during the reporting period. |
| Updated Prospectus Web Address |
|
https://kraneshares.com/kba/
|
| C000141213 |
|
|
| Shareholder Report [Line Items] |
|
|
| Fund Name |
|
KraneShares MSCI All China Index ETF
|
| Class Name |
|
KraneShares MSCI All China Index ETF
|
| Trading Symbol |
|
KALL
|
| Security Exchange Name |
|
NYSEArca
|
| Annual or Semi-Annual Statement [Text Block] |
|
This annual shareholder report contains important information about the KraneShares MSCI All China Index ETF (the "Fund") for the period from April 1, 2024 to March 31, 2025.
|
| Shareholder Report Annual or Semi-Annual |
|
Annual Shareholder Report
|
| Additional Information [Text Block] |
|
You can find additional information about the Fund at https://kraneshares.com/kall/. You can also request this information by contacting us at 1-855-857-2638.
|
| Additional Information Phone Number |
|
1-855-857-2638
|
| Additional Information Website |
|
https://kraneshares.com/kall/
|
| Expenses [Text Block] |
|
What were the Fund costs for the last year?(based on a hypothetical $10,000 investment) Fund Name | Costs of a $10,000 investment | Costs paid as a percentage of a $10,000 investment |
|---|
KraneShares MSCI All China Index ETF | $56 | 0.49% |
|---|
|
| Expenses Paid, Amount |
|
$ 56
|
| Expense Ratio, Percent |
|
0.49%
|
| Factors Affecting Performance [Text Block] |
|
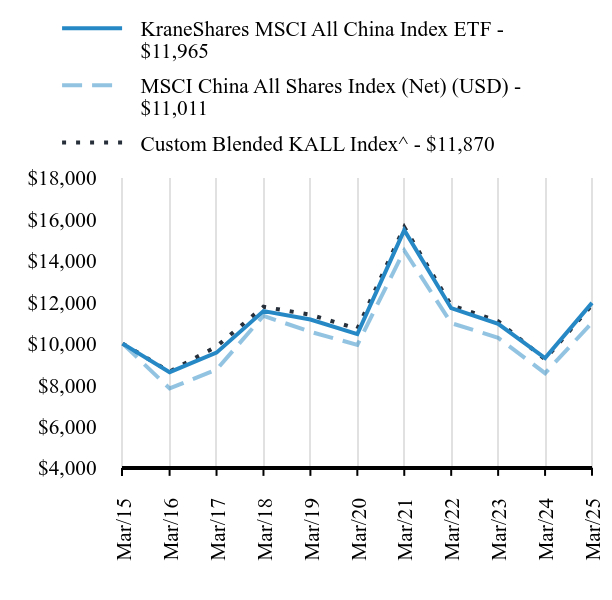
(a) MSCI China All Shares Index (b) The Fund is in the Morningstar U.S. ETF China Region Category. The KraneShares MSCI All China Index ETF seeks to provide investment results that, before fees and expenses, correspond generally to the price and yield performance of the MSCI China All Shares Index (the "Underlying Index"). The Underlying Index seeks to track the equity market performance of companies based in China and listed in Mainland China, Hong Kong and the United States. Companies available for inclusion must be headquartered in China and meet the market capitalization minimums required by the MSCI Global Investable Market Indexes Methodology. The Fund outperformed global equities, as measured by the MSCI ACWI, significantly during the Period. Offshore listings in Hong Kong and the United States contributed the most to performance. Unprecedented stimulus measures announced by China's government in September, which included a stock market stabilization fund, consumer subsidies, and rate cuts, were a key catalyst for the Fund during the Period. Offshore-listed internet and technology stocks were top performers within the Fund during the Period, as DeepSeek, China's answer to OpenAI's ChatGPT, was reported to operate at a higher level of efficiency and demand fewer chips to train, potentially eliminating concerns over chip shortages for many of China's internet and technology companies. The deviation between the Fund's performance and that of the Underlying Index can be mainly attributed to management fees paid by the Fund. |
| Performance Past Does Not Indicate Future [Text] |
|
Past performance is not indicative of future performance.
|
| Line Graph [Table Text Block] |
|
| KraneShares MSCI All China Index ETF - $11965 | MSCI China All Shares Index (Net) (USD) - $11011 | Custom Blended KALL Index^ - $11870 |
|---|
Mar/15 | $10000 | $10000 | $10000 |
|---|
Mar/16 | $8619 | $7833 | $8647 |
|---|
Mar/17 | $9564 | $8746 | $9860 |
|---|
Mar/18 | $11571 | $11342 | $11779 |
|---|
Mar/19 | $11164 | $10569 | $11394 |
|---|
Mar/20 | $10461 | $9941 | $10717 |
|---|
Mar/21 | $15479 | $14496 | $15628 |
|---|
Mar/22 | $11711 | $10988 | $11846 |
|---|
Mar/23 | $10957 | $10281 | $11083 |
|---|
Mar/24 | $9303 | $8571 | $9240 |
|---|
Mar/25 | $11965 | $11011 | $11870 |
|---|
|
| Average Annual Return [Table Text Block] |
|
Fund/Index Name | 1 Year | 5 Years | 10 Years |
|---|
KraneShares MSCI All China Index ETF | 28.62% | 2.72% | 1.81% |
|---|
MSCI China All Shares Index (Net) (USD) | 28.47% | 2.07% | 0.97% |
|---|
Custom Blended KALL Index^ | 28.47% | 2.07% | 1.73% |
|---|
|
| No Deduction of Taxes [Text Block] |
|
The table and graph presented above do not reflect the deduction of taxes a shareholder would pay on Fund distributions or the redemption of Fund shares.
|
| AssetsNet |
$ 10,209,728
|
$ 10,209,728
|
| Holdings Count | Holding |
201
|
201
|
| Advisory Fees Paid, Amount |
|
$ 39,611
|
| InvestmentCompanyPortfolioTurnover |
|
17.00%
|
| Additional Fund Statistics [Text Block] |
|
Key Fund Statistics as of March 31, 2025 | Total Net Assets | Number of Holdings | Total Advisory Fees Paid | Portfolio Turnover Rate |
|---|
| $10,209,728 | 201 | $39,611 | 17% |
|---|
|
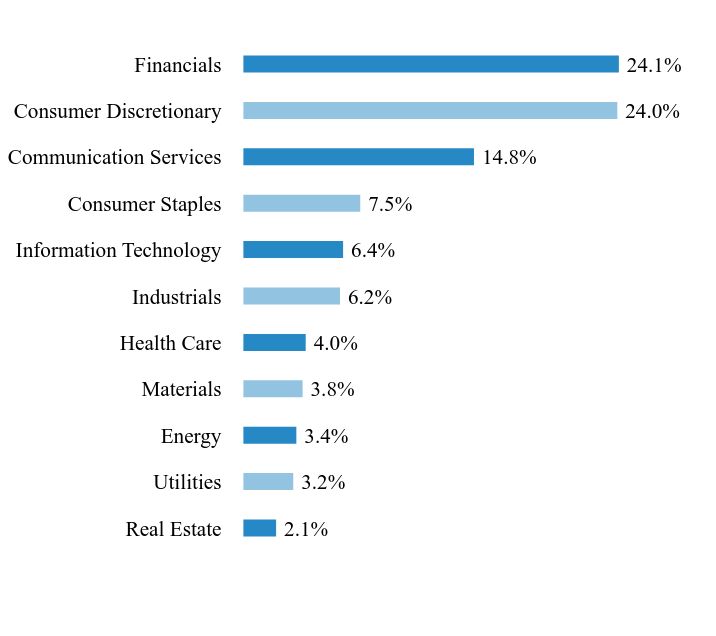
| Holdings [Text Block] |
|
Sector WeightingsFootnote Reference*Value | Value |
|---|
Real Estate | 2.1% | Utilities | 3.2% | Energy | 3.4% | Materials | 3.8% | Health Care | 4.0% | Industrials | 6.2% | Information Technology | 6.4% | Consumer Staples | 7.5% | Communication Services | 14.8% | Consumer Discretionary | 24.0% | Financials | 24.1% |
| Footnote | Description | Footnote* | Percentages are calculated based on total net assets. |
|
| Largest Holdings [Text Block] |
|
Holding Name | | | Percentage of
Total Net Assets |
|---|
Tencent Holdings | | | 10.2% | Alibaba Group Holding | | | 6.9% | Xiaomi, Cl B | | | 3.0% | Meituan, Cl B | | | 2.8% | China Construction Bank, Cl H | | | 2.3% | Kweichow Moutai, Cl A | | | 2.1% | PDD Holdings ADR | | | 2.0% | BYD, Cl H | | | 1.7% | JD.com, Cl A | | | 1.5% | Bank of China, Cl H | | | 1.4% |
|
| Material Fund Change [Text Block] |
|
This is a summary of certain changes to the Fund since April 1, 2024. For more complete information, you may review the Fund’s prospectus, which is available at https://kraneshares.com/kall/#documents or upon request at 1-855-857-2638. Upon the recommendation of Krane Funds Advisors, LLC, the adviser to the Fund, the Board of Trustees of KraneShares Trust has approved the liquidation and termination of the Fund. Accordingly the Fund ceased operations and liquidated on May 27, 2025. |
| Updated Prospectus Web Address |
|
https://kraneshares.com/kall/
|
| C000180685 |
|
|
| Shareholder Report [Line Items] |
|
|
| Fund Name |
|
KraneShares MSCI One Belt One Road Index ETF
|
| Class Name |
|
KraneShares MSCI One Belt One Road Index ETF
|
| Trading Symbol |
|
OBOR
|
| Security Exchange Name |
|
NYSEArca
|
| Annual or Semi-Annual Statement [Text Block] |
|
This annual shareholder report contains important information about the KraneShares MSCI One Belt One Road Index ETF (the "Fund") for the period from April 1, 2024 to March 31, 2025.
|
| Shareholder Report Annual or Semi-Annual |
|
Annual Shareholder Report
|
| Additional Information [Text Block] |
|
You can find additional information about the Fund at https://kraneshares.com/obor/. You can also request this information by contacting us at 1-855-857-2638.
|
| Additional Information Phone Number |
|
1-855-857-2638
|
| Additional Information Website |
|
https://kraneshares.com/obor/
|
| Expenses [Text Block] |
|
What were the Fund costs for the last year?(based on a hypothetical $10,000 investment) Fund Name | Costs of a $10,000 investment | Costs paid as a percentage of a $10,000 investment |
|---|
KraneShares MSCI One Belt One Road Index ETF | $82 | 0.79% |
|---|
|
| Expenses Paid, Amount |
|
$ 82
|
| Expense Ratio, Percent |
|
0.79%
|
| Factors Affecting Performance [Text Block] |
|
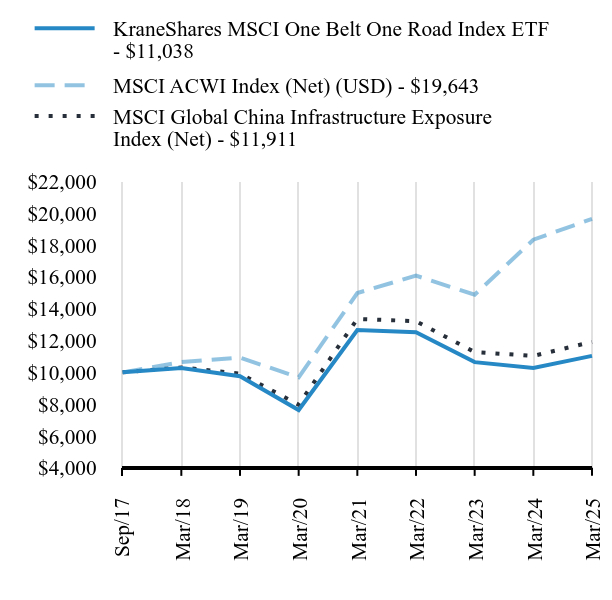
(a) MSCI Global China Infrastructure Exposure Index (b) The Fund is in the Morningstar U.S. ETF Infrastructure Category The KraneShares MSCI One Belt One Road Index ETF seeks to provide investment results that, before fees and expenses, correspond generally to the price and yield performance of the MSCI Global China Infrastructure Exposure Index (the Underlying Index). The Underlying Index aims to identify potential beneficiaries of the "Belt & Road" or "One Belt One Road" initiative by the central government in China based on how their geography, revenue, and sector attributes align with the broad theme. The Fund seeks to capture potential upside for the companies involved in China's Belt & Road Initiative. The shares in the companies involved in or related to China's outbound infrastructure investment initiatives slightly underperformed Emerging Markets equities, as measured by the MSCI Emerging Markets Index, and global equities, as measured by the MSCI ACWI. These companies tend to be concentrated in the Industrial and Financial sectors, which underperformed more growth-oriented sectors, such as Communication Services and Consumer Discretionary, across Emerging Markets, leading the Fund to underperform. Within the Fund, the top-performing countries were South Africa and Israel, while the worst-performing countries were the Philippines and Malaysia. Within the Fund, the top-performing sectors were Financials and Utilities, while the worst-performing sectors were Communication Services and Industrials. The deviation between the Fund's performance and that of the Underlying Index can be mainly attributed to management fees paid by the Fund. |
| Performance Past Does Not Indicate Future [Text] |
|
Past performance is not indicative of future performance.
|
| Line Graph [Table Text Block] |
|
| KraneShares MSCI One Belt One Road Index ETF - $11038 | MSCI ACWI Index (Net) (USD) - $19643 | MSCI Global China Infrastructure Exposure Index (Net) - $11911 |
|---|
Sep/17 | $10000 | $10000 | $10000 |
|---|
Mar/18 | $10267 | $10644 | $10309 |
|---|
Mar/19 | $9759 | $10921 | $9922 |
|---|
Mar/20 | $7634 | $9692 | $7971 |
|---|
Mar/21 | $12659 | $14983 | $13358 |
|---|
Mar/22 | $12519 | $16074 | $13216 |
|---|
Mar/23 | $10643 | $14878 | $11274 |
|---|
Mar/24 | $10281 | $18333 | $11035 |
|---|
Mar/25 | $11038 | $19643 | $11911 |
|---|
|
| Average Annual Return [Table Text Block] |
|
Fund/Index Name | 1 Year | 5 Years |
Since
Inception |
|---|
KraneShares MSCI One Belt One Road Index ETF | 7.37% | 7.65% | 1.31% |
|---|
MSCI ACWI Index (Net) (USD) | 7.15% | 15.18% | 9.33% |
|---|
MSCI Global China Infrastructure Exposure Index (Net) | 7.93% | 8.36% | 2.34% |
|---|
|
| No Deduction of Taxes [Text Block] |
|
The table and graph presented above do not reflect the deduction of taxes a shareholder would pay on Fund distributions or the redemption of Fund shares.
|
| AssetsNet |
$ 3,249,166
|
$ 3,249,166
|
| Holdings Count | Holding |
118
|
118
|
| Advisory Fees Paid, Amount |
|
$ 27,280
|
| InvestmentCompanyPortfolioTurnover |
|
19.00%
|
| Additional Fund Statistics [Text Block] |
|
Key Fund Statistics as of March 31, 2025 | Total Net Assets | Number of Holdings | Total Advisory Fees Paid | Portfolio Turnover Rate |
|---|
| $3,249,166 | 118 | $27,280 | 19% |
|---|
|
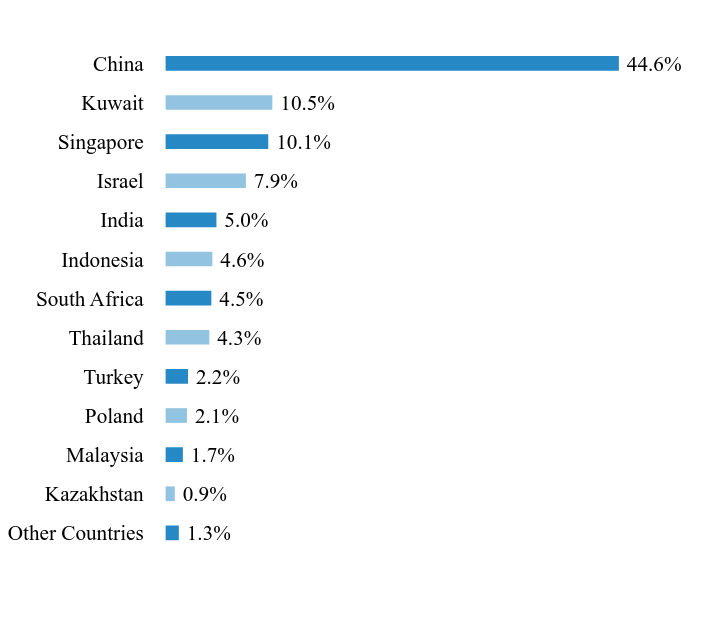
| Holdings [Text Block] |
|
Country WeightingsFootnote Reference*Value | Value |
|---|
Other Countries | 1.3% | Kazakhstan | 0.9% | Malaysia | 1.7% | Poland | 2.1% | Turkey | 2.2% | Thailand | 4.3% | South Africa | 4.5% | Indonesia | 4.6% | India | 5.0% | Israel | 7.9% | Singapore | 10.1% | Kuwait | 10.5% | China | 44.6% |
| Footnote | Description | Footnote* | Percentages are calculated based on total net assets. |
|
| Largest Holdings [Text Block] |
|
Holding Name | | | Percentage of
Total Net Assets |
|---|
Kuwait Finance House | | | 10.3% | Oversea-Chinese Banking | | | 7.4% | China Yangtze Power, Cl A | | | 4.9% | Elbit Systems | | | 4.7% | PTT | | | 4.3% | Impala Platinum Holdings | | | 2.8% | China Petroleum & Chemical, Cl H | | | 2.2% | KGHM Polska Miedz | | | 2.1% | Beijing-Shanghai High Speed Railway, Cl A | | | 2.0% | Turk Hava Yollari AO | | | 2.0% |
|
| Material Fund Change [Text Block] |
|
There were no material changes during the reporting period. |
| Updated Prospectus Web Address |
|
https://kraneshares.com/obor/
|
| C000176655 |
|
|
| Shareholder Report [Line Items] |
|
|
| Fund Name |
|
KraneShares Emerging Markets Consumer Technology Index ETF
|
| Class Name |
|
KraneShares Emerging Markets Consumer Technology Index ETF
|
| Trading Symbol |
|
KEMQ
|
| Security Exchange Name |
|
NYSEArca
|
| Annual or Semi-Annual Statement [Text Block] |
|
This annual shareholder report contains important information about the KraneShares Emerging Markets Consumer Technology Index ETF (the "Fund") for the period from April 1, 2024 to March 31, 2025.
|
| Shareholder Report Annual or Semi-Annual |
|
Annual Shareholder Report
|
| Additional Information [Text Block] |
|
You can find additional information about the Fund at https://kraneshares.com/kemq/. You can also request this information by contacting us at 1-855-857-2638.
|
| Additional Information Phone Number |
|
1-855-857-2638
|
| Additional Information Website |
|
https://kraneshares.com/kemq/
|
| Expenses [Text Block] |
|
What were the Fund costs for the last year?(based on a hypothetical $10,000 investment) Fund Name | Costs of a $10,000 investment | Costs paid as a percentage of a $10,000 investment |
|---|
KraneShares Emerging Markets Consumer Technology Index ETF | $62 | 0.55% |
|---|
|
| Expenses Paid, Amount |
|
$ 62
|
| Expense Ratio, Percent |
|
0.55%
|
| Factors Affecting Performance [Text Block] |
|
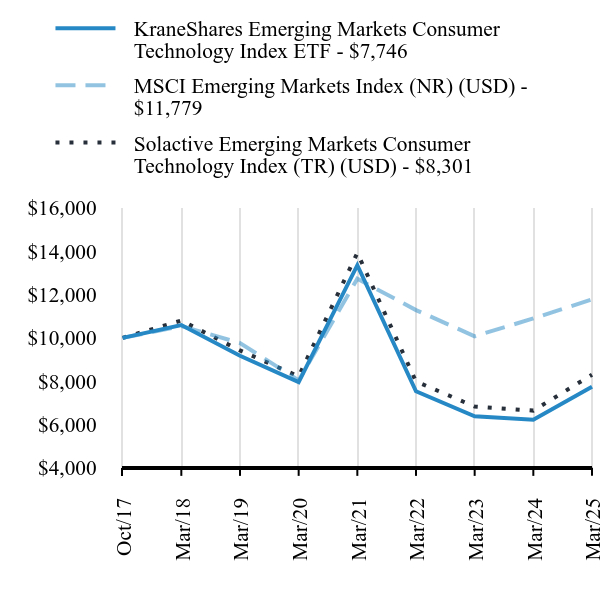
(a) Solactive Emerging Markets Consumer Technology Index (b) The Fund is in the Morningstar U.S. ETF Diversified Emerging Markets Category The KraneShares Emerging Markets Consumer Technology Index ETF seeks to provide investment results that, before fees and expenses, correspond generally to the price and yield performance of the Solactive Emerging Markets Consumer Technology Index (the "Underlying Index"). The Underlying Index selects companies from 26 eligible countries within emerging markets whose primary business or businesses are internet retail, internet software/services, purchase, payment processing, semiconductor production, or software for internet and e-commerce transactions. Emerging Markets consumer technology equities outperformed global equities, as measured by the MSCI ACWI, during the Period. These stocks benefited from stimulus and AI innovation in China, and strong economic growth in Latin America and Southeast Asia. Within the Fund, the best-performing stocks included financial technology companies and online health care platforms. In contrast, the worst-performing stocks included chipmakers, which came off record-high valuations, and payments processors. Within the Fund, the best-performing countries were Singapore and China, while the worst-performing countries were Taiwan and Brazil. The deviation between the Fund's performance and that of the Underlying Index can be mainly attributed to management fees paid by the Fund. |
| Performance Past Does Not Indicate Future [Text] |
|
Past performance is not indicative of future performance.
|
| Line Graph [Table Text Block] |
|
| KraneShares Emerging Markets Consumer Technology Index ETF - $7746 | MSCI Emerging Markets Index (NR) (USD) - $11779 | Solactive Emerging Markets Consumer Technology Index (TR) (USD) - $8301 |
|---|
Oct/17 | $10000 | $10000 | $10000 |
|---|
Mar/18 | $10592 | $10546 | $10802 |
|---|
Mar/19 | $9176 | $9765 | $9421 |
|---|
Mar/20 | $7957 | $8038 | $8225 |
|---|
Mar/21 | $13355 | $12731 | $13922 |
|---|
Mar/22 | $7537 | $11284 | $7987 |
|---|
Mar/23 | $6384 | $10076 | $6831 |
|---|
Mar/24 | $6226 | $10898 | $6643 |
|---|
Mar/25 | $7746 | $11779 | $8301 |
|---|
|
| Average Annual Return [Table Text Block] |
|
Fund/Index Name | 1 Year | 5 Years |
Since
Inception |
|---|
KraneShares Emerging Markets Consumer Technology Index ETF | 24.41% | -0.54% | -3.36% |
|---|
MSCI Emerging Markets Index (NR) (USD) | 8.09% | 7.94% | 2.22% |
|---|
Solactive Emerging Markets Consumer Technology Index (TR) (USD) | 24.96% | 0.18% | -2.46% |
|---|
|
| No Deduction of Taxes [Text Block] |
|
The table and graph presented above do not reflect the deduction of taxes a shareholder would pay on Fund distributions or the redemption of Fund shares.
|
| AssetsNet |
$ 20,197,851
|
$ 20,197,851
|
| Holdings Count | Holding |
53
|
53
|
| Advisory Fees Paid, Amount |
|
$ 89,103
|
| InvestmentCompanyPortfolioTurnover |
|
63.00%
|
| Additional Fund Statistics [Text Block] |
|
Key Fund Statistics as of March 31, 2025 | Total Net Assets | Number of Holdings | Total Advisory Fees Paid | Portfolio Turnover Rate |
|---|
| $20,197,851 | 53 | $89,103 | 63% |
|---|
|
| Holdings [Text Block] |
|
Country/Asset WeightingsFootnote Reference*Value | Value |
|---|
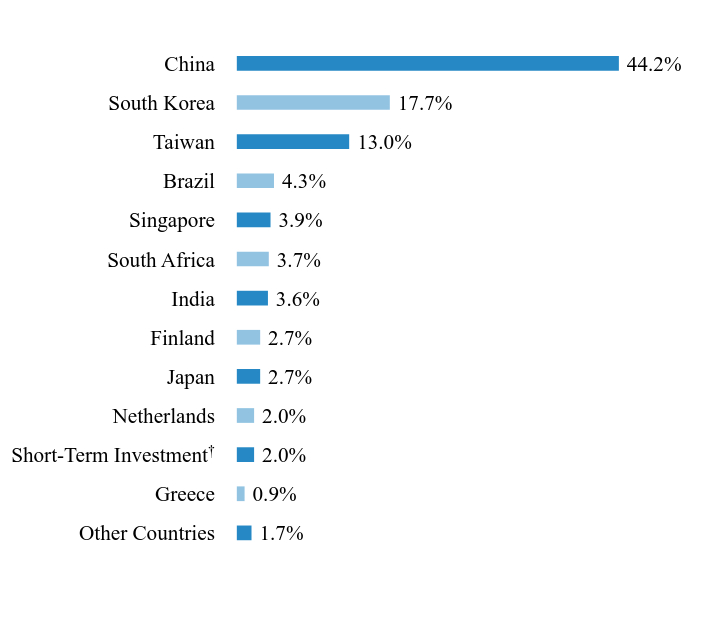
Other Countries | 1.7% | Greece | 0.9% | Short-Term InvestmentFootnote Reference† | 2.0% | Netherlands | 2.0% | Japan | 2.7% | Finland | 2.7% | India | 3.6% | South Africa | 3.7% | Singapore | 3.9% | Brazil | 4.3% | Taiwan | 13.0% | South Korea | 17.7% | China | 44.2% |
| Footnote | Description | Footnote* | Percentages are calculated based on total net assets. | Footnote† | This security, or a portion thereof, was purchased with cash collateral held from securities on loan. |
|
| Largest Holdings [Text Block] |
|
Holding Name | | | Percentage of
Total Net AssetsFootnote Reference(A) |
|---|
Sea ADR | | | 3.9% | JD.com, Cl A | | | 3.8% | PDD Holdings ADR | | | 3.8% | NetEase | | | 3.7% | SK Hynix | | | 3.7% | Naspers, Cl N | | | 3.7% | Alibaba Group Holding | | | 3.6% | Tencent Holdings | | | 3.6% | Meituan, Cl B | | | 3.5% | Taiwan Semiconductor Manufacturing | | | 3.4% |
| Footnote | Description | Footnote(A) | Short-Term Investments are not shown in the top ten chart. |
|
| Material Fund Change [Text Block] |
|
This is a summary of certain changes to the Fund since April 1, 2024. For more complete information, you may review the Fund’s prospectus, which is available at https://kraneshares.com/kemq/#documents or upon request at 1-855-857-2638. Effective November 1, 2024, Krane has contractually agreed to waive its management fee by 0.30% of the average daily net assets of the Fund. This contractual fee waiver will continue until August 1, 2025, and may only be terminated prior thereto by the Board. Prior to November 1, 2024, Krane had contractually agreed to waive its management fee by 0.20% of the average daily net assets of the Fund. |
| Updated Prospectus Web Address |
|
https://kraneshares.com/kemq/
|
| C000157444 |
|
|
| Shareholder Report [Line Items] |
|
|
| Fund Name |
|
KraneShares MSCI China Clean Technology Index ETF
|
| Class Name |
|
KraneShares MSCI China Clean Technology Index ETF
|
| Trading Symbol |
|
KGRN
|
| Security Exchange Name |
|
NYSEArca
|
| Annual or Semi-Annual Statement [Text Block] |
|
This annual shareholder report contains important information about the KraneShares MSCI China Clean Technology Index ETF (the "Fund") for the period from April 1, 2024 to March 31, 2025.
|
| Shareholder Report Annual or Semi-Annual |
|
Annual Shareholder Report
|
| Additional Information [Text Block] |
|
You can find additional information about the Fund at https://kraneshares.com/kgrn/. You can also request this information by contacting us at 1-855-857-2638.
|
| Additional Information Phone Number |
|
1-855-857-2638
|
| Additional Information Website |
|
https://kraneshares.com/kgrn/
|
| Expenses [Text Block] |
|
What were the Fund costs for the last year?(based on a hypothetical $10,000 investment) Fund Name | Costs of a $10,000 investment | Costs paid as a percentage of a $10,000 investment |
|---|
KraneShares MSCI China Clean Technology Index ETF | $90 | 0.79% |
|---|
|
| Expenses Paid, Amount |
|
$ 90
|
| Expense Ratio, Percent |
|
0.79%
|
| Factors Affecting Performance [Text Block] |
|
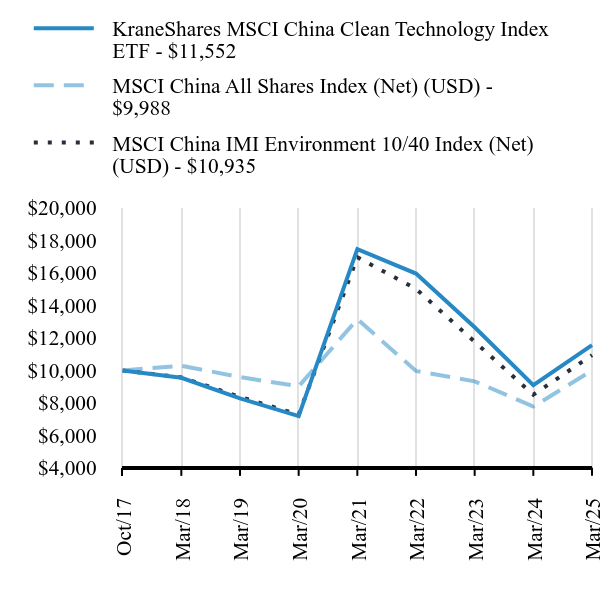
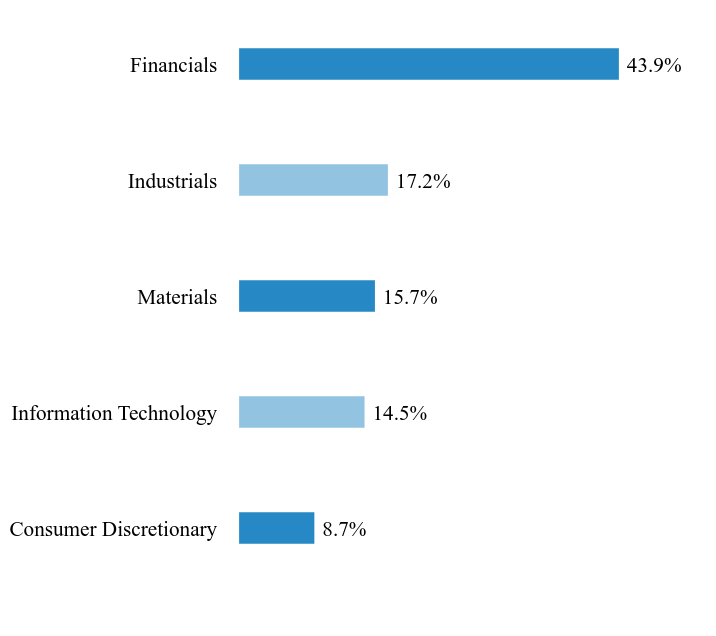
(a) MSCI China IMI Environment 10/40 Index (b) The Fund is in the Morningstar U.S. ETF China Region Category The KraneShares MSCI China Clean Technology Index ETF seeks to provide investment results that, before fees and expenses, correspond generally to the price and yield performance of the MSCI China IMI Environment 10/40 Index (the "Underlying Index"). The Underlying Index comprises securities that derive at least 50% of their revenues from environmentally beneficial products and services. The Underlying Index is based on four key clean technology themes: (1) Alternative Energy, (2) Sustainable Water, (3) Pollution Prevention and (4) Energy Efficiency. The Underlying Index is designed to measure the performance of Chinese companies that focus on contributing to a more environmentally sustainable economy by making efficient use of scarce natural resources or by mitigating the impact of environmental degradation. China's clean technology equities outperformed global equities, as represented by the MSCI ACWI, and China equities more broadly, as represented by the MSCI China All Shares Index, during the Period. Within the Fund, electric vehicle (EV) manufacturers, supported by consumer subsidies targeting the automotive industry, outperformed new energy system component suppliers, which were challenged by the potential for increased trade protectionism abroad, including in the U.S., among other factors. Xpeng, an EV manufacturer and top Fund holding, beat earnings per share (EPS) estimates for the fourth quarter of 2024. Meanwhile, Xinyi Solar, a manufacturer of solar panels and equipment, fell short of expectations for its EPS for the second half of 2024, posting a loss for the year after three years of net profits. The deviation between the Fund's performance and that of the Underlying Index can be mainly attributed to management fees paid by the Fund. |
| Performance Past Does Not Indicate Future [Text] |
|
Past performance is not indicative of future performance.
|
| Line Graph [Table Text Block] |
|
| KraneShares MSCI China Clean Technology Index ETF - $11552 | MSCI China All Shares Index (Net) (USD) - $9988 | MSCI China IMI Environment 10/40 Index (Net) (USD) - $10935 |
|---|
Oct/17 | $10000 | $10000 | $10000 |
|---|
Mar/18 | $9544 | $10289 | $9569 |
|---|
Mar/19 | $8277 | $9588 | $8373 |
|---|
Mar/20 | $7187 | $9018 | $7274 |
|---|
Mar/21 | $17466 | $13150 | $16965 |
|---|
Mar/22 | $15962 | $9968 | $15018 |
|---|
Mar/23 | $12656 | $9326 | $11762 |
|---|
Mar/24 | $9091 | $7775 | $8505 |
|---|
Mar/25 | $11552 | $9988 | $10935 |
|---|
|
| Average Annual Return [Table Text Block] |
|
Fund/Index Name | 1 Year | 5 Years |
Since
Inception |
|---|
KraneShares MSCI China Clean Technology Index ETF | 27.07% | 9.96% | 1.95% |
|---|
MSCI China All Shares Index (Net) (USD) | 28.47% | 2.07% | -0.02% |
|---|
MSCI China IMI Environment 10/40 Index (Net) (USD) | 28.58% | 8.50% | 1.20% |
|---|
|
| No Deduction of Taxes [Text Block] |
|
The table and graph presented above do not reflect the deduction of taxes a shareholder would pay on Fund distributions or the redemption of Fund shares.
|
| AssetsNet |
$ 48,392,215
|
$ 48,392,215
|
| Holdings Count | Holding |
47
|
47
|
| Advisory Fees Paid, Amount |
|
$ 404,836
|
| InvestmentCompanyPortfolioTurnover |
|
36.00%
|
| Additional Fund Statistics [Text Block] |
|
Key Fund Statistics as of March 31, 2025 | Total Net Assets | Number of Holdings | Total Advisory Fees Paid | Portfolio Turnover Rate |
|---|
| $48,392,215 | 47 | $404,836 | 36% |
|---|
|
| Holdings [Text Block] |
|
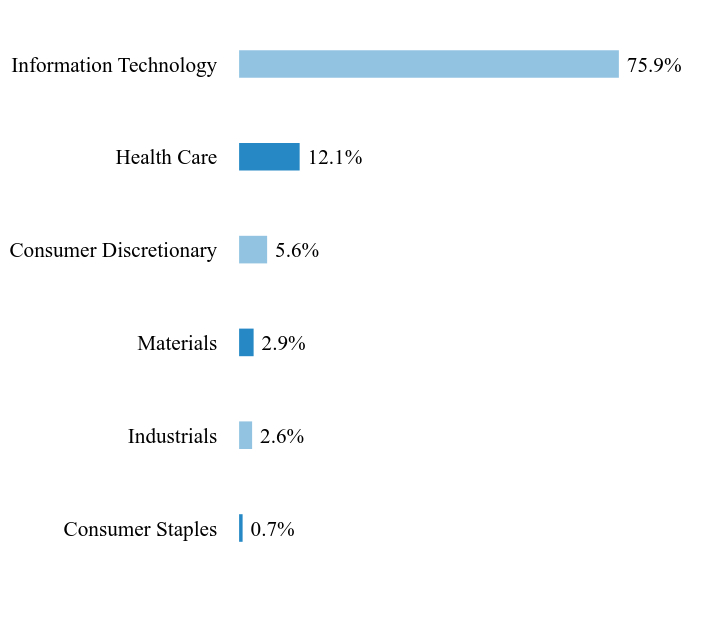
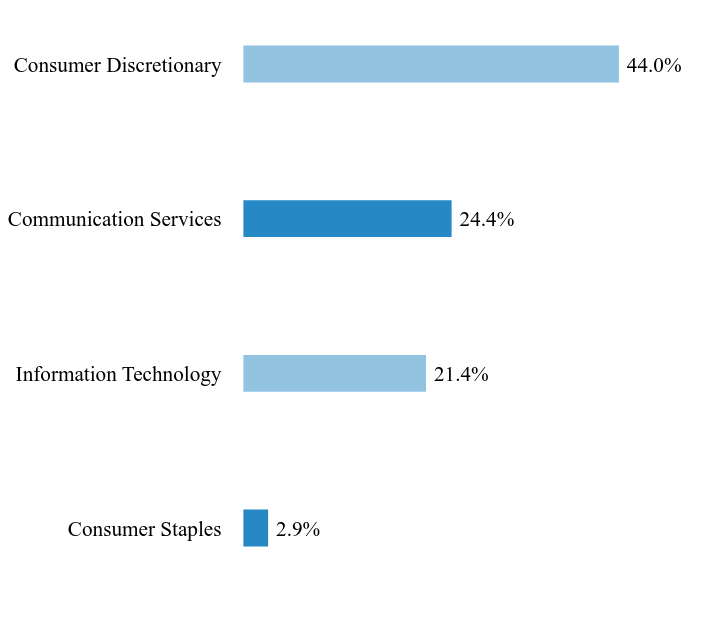
Sector WeightingsFootnote Reference*Value | Value |
|---|
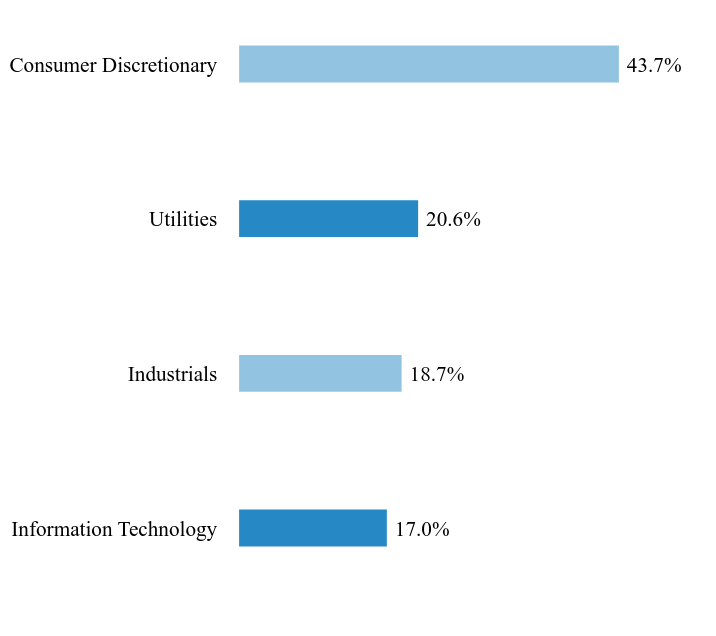
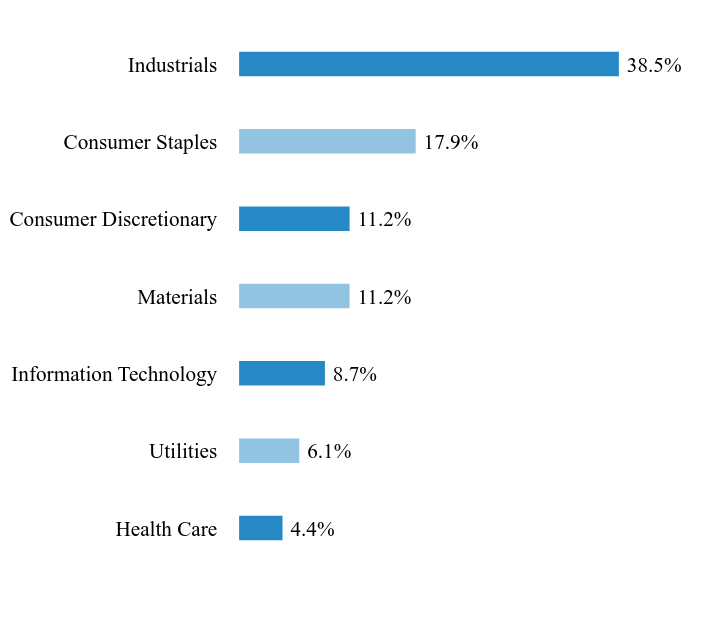
Information Technology | 17.0% | Industrials | 18.7% | Utilities | 20.6% | Consumer Discretionary | 43.7% |
| Footnote | Description | Footnote* | Percentages are calculated based on total net assets. |
|
| Largest Holdings [Text Block] |
|
Holding Name | | | Percentage of
Total Net Assets |
|---|
XPeng, Cl A | | | 10.6% | BYD, Cl H | | | 9.6% | Li Auto, Cl A | | | 8.7% | Contemporary Amperex Technology, Cl A | | | 8.4% | China Yangtze Power, Cl A | | | 4.5% | Kingdee International Software Group | | | 4.1% | Zhejiang Leapmotor Technology | | | 4.0% | CGN Power, Cl H | | | 3.8% | NIO, Cl A | | | 3.7% | China Longyuan Power Group, Cl H | | | 3.0% |
|
| Material Fund Change [Text Block] |
|
There were no material changes during the reporting period. |
| Updated Prospectus Web Address |
|
https://kraneshares.com/kgrn/
|
| C000198139 |
|
|
| Shareholder Report [Line Items] |
|
|
| Fund Name |
|
KraneShares Electric Vehicles and Future Mobility Index ETF
|
| Class Name |
|
KraneShares Electric Vehicles and Future Mobility Index ETF
|
| Trading Symbol |
|
KARS
|
| Security Exchange Name |
|
NYSEArca
|
| Annual or Semi-Annual Statement [Text Block] |
|
This annual shareholder report contains important information about the KraneShares Electric Vehicles and Future Mobility Index ETF (the "Fund") for the period from April 1, 2024 to March 31, 2025.
|
| Shareholder Report Annual or Semi-Annual |
|
Annual Shareholder Report
|
| Additional Information [Text Block] |
|
You can find additional information about the Fund at https://kraneshares.com/kars/. You can also request this information by contacting us at 1-855-857-2638.
|
| Additional Information Phone Number |
|
1-855-857-2638
|
| Additional Information Website |
|
https://kraneshares.com/kars/
|
| Expenses [Text Block] |
|
What were the Fund costs for the last year?(based on a hypothetical $10,000 investment) Fund Name | Costs of a $10,000 investment | Costs paid as a percentage of a $10,000 investment |
|---|
KraneShares Electric Vehicles and Future Mobility Index ETF | $70 | 0.72% |
|---|
|
| Expenses Paid, Amount |
|
$ 70
|
| Expense Ratio, Percent |
|
0.72%
|
| Factors Affecting Performance [Text Block] |
|
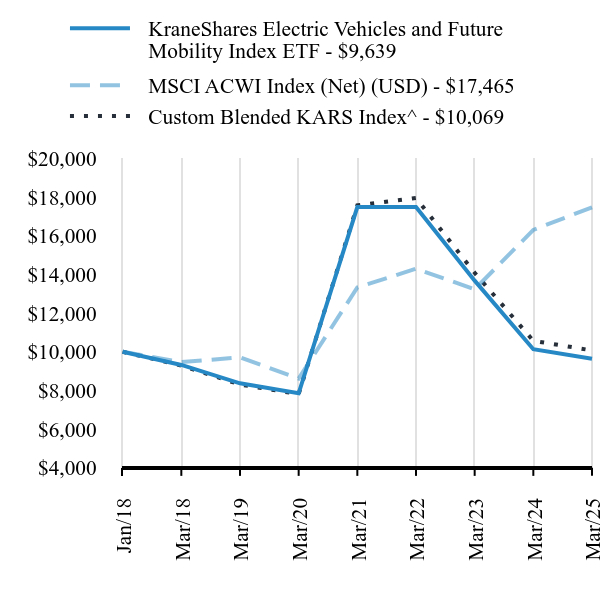
(a) Bloomberg Electric Vehicles Index (b) The Fund is in the Morningstar U.S. ETF Industrials Category The KraneShares Electric Vehicle & Future Mobility Index ETF seeks to provide investment results that, before fees and expenses, correspond generally to the price and yield performance of the Bloomberg Electric Vehicles Index (the "Underlying Index"). The Underlying Index seeks to measure the performance of companies that are engaged in the production of electric vehicles, their components, or other initiatives that may change the future of mobility. This includes electric vehicles, autonomous driving, lithium and/or copper production, lithium-ion/lead acid battery production, hydrogen fuel cell manufacturing, and/or electric infrastructure businesses. The global electric vehicle (“EV”) and future mobility ecosystem was challenged by waning support for the electrification of transport from the U.S. government following a surge in support with the Biden Administration's 2023 Inflation Reduction Act. Nonetheless, global electric vehicle sales reached another record high of over 17 million units in 2024. Electric vehicle manufacturers in China outperformed those in other regions. Within the Fund, the best-performing industries were vehicle manufacturers and EV components, while the worst-performing industries were hydrogen engines, fuel cells, and EV charging infrastructure. The deviation between the Fund's performance and that of the Underlying Index can be mainly attributed to management fees paid by the Fund. |
| Performance Past Does Not Indicate Future [Text] |
|
Past performance is not indicative of future performance.
|
| Line Graph [Table Text Block] |
|
| KraneShares Electric Vehicles and Future Mobility Index ETF - $9639 | MSCI ACWI Index (Net) (USD) - $17465 | Custom Blended KARS Index^ - $10069 |
|---|
Jan/18 | $10000 | $10000 | $10000 |
|---|
Mar/18 | $9320 | $9464 | $9287 |
|---|
Mar/19 | $8370 | $9710 | $8307 |
|---|
Mar/20 | $7856 | $8617 | $7812 |
|---|
Mar/21 | $17476 | $13322 | $17567 |
|---|
Mar/22 | $17484 | $14291 | $17951 |
|---|
Mar/23 | $13676 | $13228 | $14081 |
|---|
Mar/24 | $10132 | $16299 | $10567 |
|---|
Mar/25 | $9639 | $17465 | $10069 |
|---|
|
| Average Annual Return [Table Text Block] |
|
Fund/Index Name | 1 Year | 5 Years |
Since
Inception |
|---|
KraneShares Electric Vehicles and Future Mobility Index ETF | -4.86% | 4.18% | -0.51% |
|---|
MSCI ACWI Index (Net) (USD) | 7.15% | 15.18% | 8.05% |
|---|
Custom Blended KARS Index^ | -4.71% | 5.21% | 0.10% |
|---|
|
| No Deduction of Taxes [Text Block] |
|
The table and graph presented above do not reflect the deduction of taxes a shareholder would pay on Fund distributions or the redemption of Fund shares.
|
| AssetsNet |
$ 63,659,698
|
$ 63,659,698
|
| Holdings Count | Holding |
53
|
53
|
| Advisory Fees Paid, Amount |
|
$ 544,206
|
| InvestmentCompanyPortfolioTurnover |
|
39.00%
|
| Additional Fund Statistics [Text Block] |
|
Key Fund Statistics as of March 31, 2025 | Total Net Assets | Number of Holdings | Total Advisory Fees Paid | Portfolio Turnover Rate |
|---|
| $63,659,698 | 53 | $544,206 | 39% |
|---|
|
| Holdings [Text Block] |
|
Country/Asset WeightingsFootnote Reference*Value | Value |
|---|
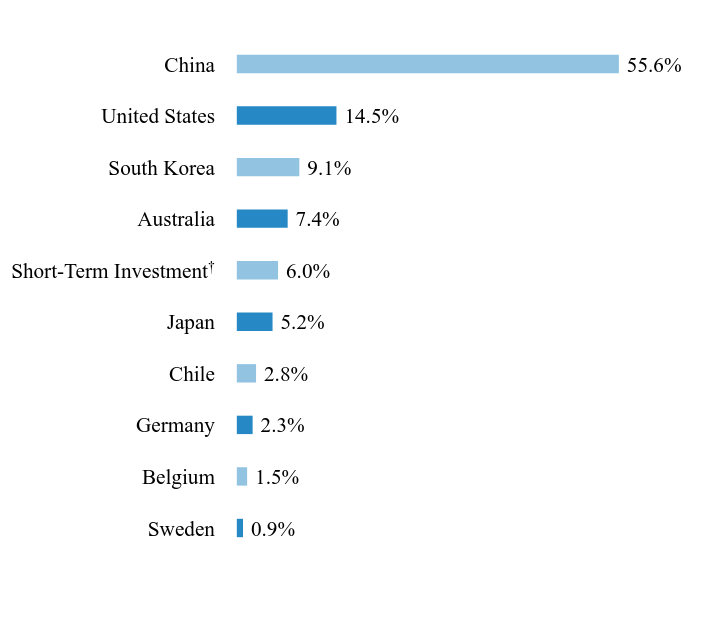
Sweden | 0.9% | Belgium | 1.5% | Germany | 2.3% | Chile | 2.8% | Japan | 5.2% | Short-Term InvestmentFootnote Reference† | 6.0% | Australia | 7.4% | South Korea | 9.1% | United States | 14.5% | China | 55.6% |
| Footnote | Description | Footnote* | Percentages are calculated based on total net assets. | Footnote† | This security, or a portion thereof, was purchased with cash collateral held from securities on loan. |
|
| Largest Holdings [Text Block] |
|
Holding Name | | | Percentage of
Total Net AssetsFootnote Reference(A) |
|---|
BYD, Cl A | | | 4.6% | XPeng, Cl A | | | 4.4% | Panasonic Holdings | | | 4.2% | Li Auto, Cl A | | | 4.1% | Contemporary Amperex Technology, Cl A | | | 4.0% | Geely Automobile Holdings | | | 4.0% | Rivian Automotive, Cl A | | | 4.0% | Zhejiang Leapmotor Technology | | | 3.5% | CMOC Group, Cl A | | | 3.0% | Tesla | | | 3.0% |
| Footnote | Description | Footnote(A) | Short-Term Investments are not shown in the top ten chart. |
|
| Material Fund Change [Text Block] |
|
There were no material changes during the reporting period. |
| Updated Prospectus Web Address |
|
https://kraneshares.com/kars/
|
| C000195635 |
|
|
| Shareholder Report [Line Items] |
|
|
| Fund Name |
|
KraneShares MSCI All China Health Care Index ETF
|
| Class Name |
|
KraneShares MSCI All China Health Care Index ETF
|
| Trading Symbol |
|
KURE
|
| Security Exchange Name |
|
NYSEArca
|
| Annual or Semi-Annual Statement [Text Block] |
|
This annual shareholder report contains important information about the KraneShares MSCI All China Health Care Index ETF (the "Fund") for the period from April 1, 2024 to March 31, 2025.
|
| Shareholder Report Annual or Semi-Annual |
|
Annual Shareholder Report
|
| Additional Information [Text Block] |
|
You can find additional information about the Fund at https://kraneshares.com/kure/. You can also request this information by contacting us at 1-855-857-2638.
|
| Additional Information Phone Number |
|
1-855-857-2638
|
| Additional Information Website |
|
https://kraneshares.com/kure/
|
| Expenses [Text Block] |
|
What were the Fund costs for the last year?(based on a hypothetical $10,000 investment) Fund Name | Costs of a $10,000 investment | Costs paid as a percentage of a $10,000 investment |
|---|
KraneShares MSCI All China Health Care Index ETF | $68 | 0.65% |
|---|
|
| Expenses Paid, Amount |
|
$ 68
|
| Expense Ratio, Percent |
|
0.65%
|
| Factors Affecting Performance [Text Block] |
|
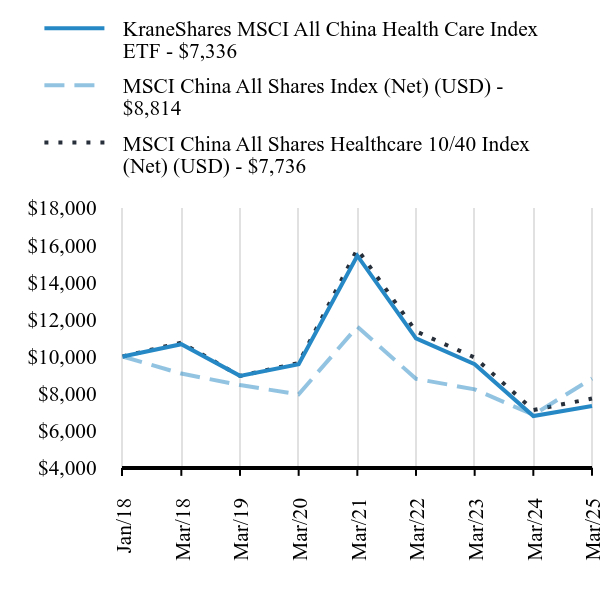
(a) MSCI China All Shares Health Care 10/40 Index (b) The Fund is in the Morningstar U.S. ETF China Region Category The KraneShares MSCI All China Health Care Index ETF seeks to provide investment results that, before fees and expenses, track the price and yield performance of the MSCI China All Shares Health Care 10/40 Index (the "Underlying Index"). The Underlying Index captures large and mid-cap representation across China A‐shares, B‐shares, H‐shares, Red‐chips, P‐chips, and foreign listings (e.g. American depositary receipts). The Underlying Index is designed to reflect the various China equity share classes, including those listed in Hong Kong, Shanghai, Shenzhen, and outside of China. China's health care equities outperformed global equities, as measured by the MSCI ACWI, during the Period. China's health care equities benefited from the stimulus measures announced by China's government in September, which included a stock market stabilization fund, consumer subsidies, and rate cuts. China's regulators also adopted a more supportive approach to the sector than in the past, releasing plans to induce more private investments in innovative medicine and expand insurance programs to cover the costs of new drug development. In addition, Fund holding Akeso developed a new lung cancer treatment during the Period that could be twice as effective as the current global best-in-class treatments, based on initial clinical trial data driving positive performance for the Fund. The deviation between the Fund's performance and that of the Underlying Index can be mainly attributed to management fees paid by the Fund. |
| Performance Past Does Not Indicate Future [Text] |
|
Past performance is not indicative of future performance.
|
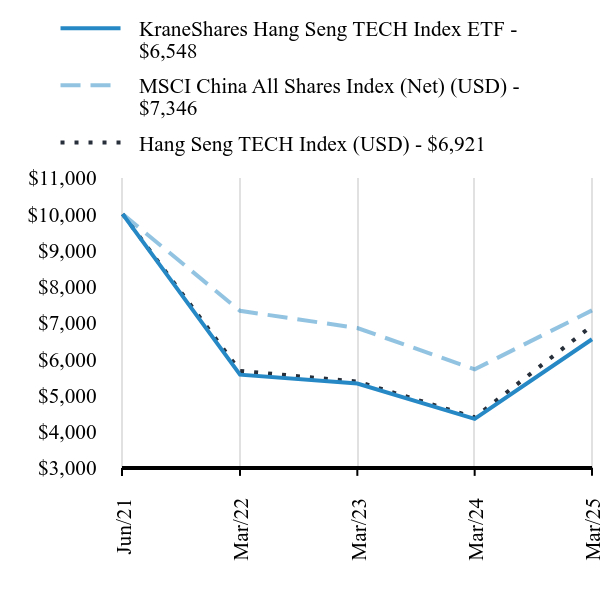
| Line Graph [Table Text Block] |
|
| KraneShares MSCI All China Health Care Index ETF - $7336 | MSCI China All Shares Index (Net) (USD) - $8814 | MSCI China All Shares Healthcare 10/40 Index (Net) (USD) - $7736 |
|---|
Jan/18 | $10000 | $10000 | $10000 |
|---|
Mar/18 | $10660 | $9079 | $10746 |
|---|
Mar/19 | $8955 | $8460 | $8951 |
|---|
Mar/20 | $9578 | $7958 | $9649 |
|---|
Mar/21 | $15426 | $11604 | $15776 |
|---|
Mar/22 | $10971 | $8796 | $11353 |
|---|
Mar/23 | $9583 | $8230 | $9942 |
|---|
Mar/24 | $6794 | $6861 | $7116 |
|---|
Mar/25 | $7336 | $8814 | $7736 |
|---|
|
| Average Annual Return [Table Text Block] |
|
Fund/Index Name | 1 Year | 5 Years |
Since
Inception |
|---|
KraneShares MSCI All China Health Care Index ETF | 7.98% | -5.19% | -4.23% |
|---|
MSCI China All Shares Index (Net) (USD) | 28.47% | 2.07% | -1.75% |
|---|
MSCI China All Shares Healthcare 10/40 Index (Net) (USD) | 8.72% | -4.32% | -3.52% |
|---|
|
| No Deduction of Taxes [Text Block] |
|
The table and graph presented above do not reflect the deduction of taxes a shareholder would pay on Fund distributions or the redemption of Fund shares.
|
| AssetsNet |
$ 86,599,232
|
$ 86,599,232
|
| Holdings Count | Holding |
51
|
51
|
| Advisory Fees Paid, Amount |
|
$ 301,369
|
| InvestmentCompanyPortfolioTurnover |
|
77.00%
|
| Additional Fund Statistics [Text Block] |
|
Key Fund Statistics as of March 31, 2025 | Total Net Assets | Number of Holdings | Total Advisory Fees Paid | Portfolio Turnover Rate |
|---|
| $86,599,232 | 51 | $301,369 | 77% |
|---|
|
| Holdings [Text Block] |
|
Industry WeightingsFootnote Reference*Value | Value |
|---|
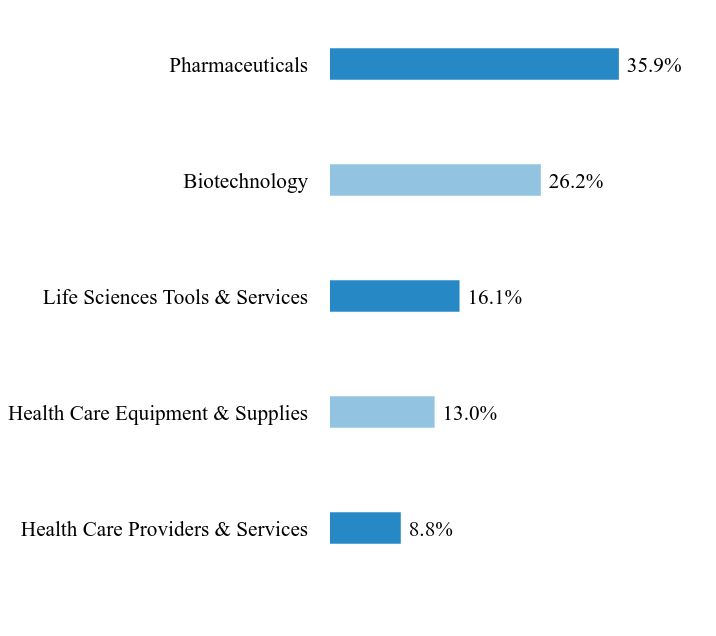
Health Care Providers & Services | 8.8% | Health Care Equipment & Supplies | 13.0% | Life Sciences Tools & Services | 16.1% | Biotechnology | 26.2% | Pharmaceuticals | 35.9% |
| Footnote | Description | Footnote* | Percentages are calculated based on total net assets. |
|
| Largest Holdings [Text Block] |
|
Holding Name | | | Percentage of
Total Net Assets |
|---|
BeiGene | | | 8.6% | Jiangsu Hengrui Pharmaceuticals, Cl A | | | 8.0% | Wuxi Biologics Cayman | | | 7.5% | Shenzhen Mindray Bio-Medical Electronics, Cl A | | | 7.2% | Innovent Biologics | | | 4.7% | WuXi AppTec, Cl A | | | 4.3% | Akeso | | | 3.9% | Aier Eye Hospital Group, Cl A | | | 3.2% | CSPC Pharmaceutical Group | | | 3.2% | Sino Biopharmaceutical | | | 3.2% |
|
| Material Fund Change [Text Block] |
|
There were no material changes during the reporting period. |
| Updated Prospectus Web Address |
|
https://kraneshares.com/kure/
|
| C000195632 |
|
|
| Shareholder Report [Line Items] |
|
|
| Fund Name |
|
KraneShares Asia Pacific High Income USD Bond ETF
|
| Class Name |
|
KraneShares Asia Pacific High Income USD Bond ETF
|
| Trading Symbol |
|
KHYB
|
| Security Exchange Name |
|
NYSEArca
|
| Annual or Semi-Annual Statement [Text Block] |
|
This annual shareholder report contains important information about the KraneShares Asia Pacific High Income USD Bond ETF (the "Fund") for the period from April 1, 2024 to March 31, 2025.
|
| Shareholder Report Annual or Semi-Annual |
|
Annual Shareholder Report
|
| Additional Information [Text Block] |
|
You can find additional information about the Fund at https://kraneshares.com/khyb/. You can also request this information by contacting us at 1-855-857-2638.
|
| Additional Information Phone Number |
|
1-855-857-2638
|
| Additional Information Website |
|
https://kraneshares.com/khyb/
|
| Expenses [Text Block] |
|
What were the Fund costs for the last year?(based on a hypothetical $10,000 investment) Fund Name | Costs of a $10,000 investment | Costs paid as a percentage of a $10,000 investment |
|---|
KraneShares Asia Pacific High Income USD Bond ETF | $72 | 0.69% |
|---|
|
| Expenses Paid, Amount |
|
$ 72
|
| Expense Ratio, Percent |
|
0.69%
|
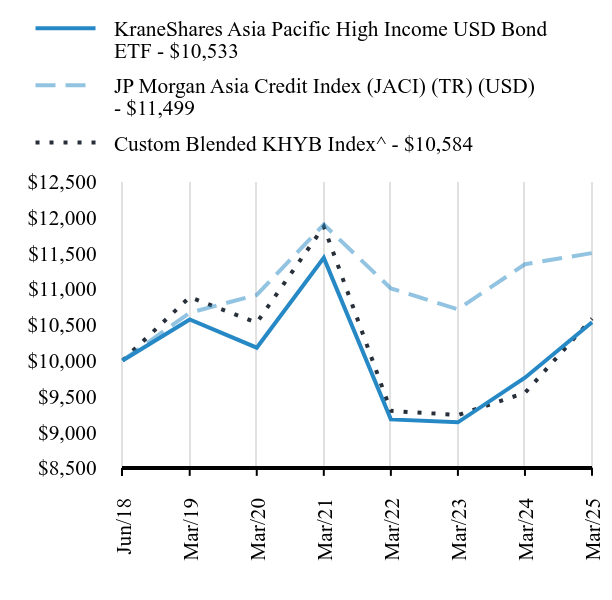
| Factors Affecting Performance [Text Block] |
|
^ Fund is actively managed and does not track an Underlying Index (1) The Fund is in the Morningstar U.S. ETF Emerging Markets Bond Category The KraneShares Asia Pacific High Income U.S.D. Bond ETF seeks to provide a total return that, before fees and expenses, exceeds that of the JP Morgan Asia Credit Index (JACI) Non-Investment Grade Corporate (the "Benchmark Index") over a complete market cycle. The Benchmark Index is comprised of liquid U.S. dollar-denominated debt instruments issued out of Asia ex-Japan and is market capitalization weighted. The Underlying Index is limited to issuers classified as noninvestment grade based on the middle rating between Moody's, Fitch, and S&P. The Asia ex Japan high yield bond market slightly underperformed the global high yield bond market, as measured by the Bloomberg Global High Yield Index, during the Period. China real estate developers' bonds continued to recover on strong government support and backstop measures, contributing positively to the Fund's performance and resulting in real estate issuers doubling as a percentage of the total portfolio. Meanwhile, trade-related uncertainties led to a slight widening of high-yield spreads in Asia. However, relatively benign inflation in local economies and rate cut cycles initiated by multiple regional central banks during the Period supported bond prices, mitigating losses by the Fund. |
| Performance Past Does Not Indicate Future [Text] |
|
Past performance is not indicative of future performance.
|
| Line Graph [Table Text Block] |
|
| KraneShares Asia Pacific High Income USD Bond ETF - $10533 | JP Morgan Asia Credit Index (JACI) (TR) (USD) - $11499 | Custom Blended KHYB Index^ - $10584 |
|---|
Jun/18 | $10000 | $10000 | $10000 |
|---|
Mar/19 | $10572 | $10665 | $10884 |
|---|
Mar/20 | $10178 | $10915 | $10527 |
|---|
Mar/21 | $11432 | $11897 | $11869 |
|---|
Mar/22 | $9177 | $11006 | $9296 |
|---|
Mar/23 | $9136 | $10714 | $9238 |
|---|
Mar/24 | $9759 | $11343 | $9547 |
|---|
Mar/25 | $10533 | $11499 | $10584 |
|---|
|
| Average Annual Return [Table Text Block] |
|
Fund/Index Name | 1 Year | 5 Years |
Since
Inception |
|---|
KraneShares Asia Pacific High Income USD Bond ETF | 7.93% | 0.69% | 0.77% |
|---|
JP Morgan Asia Credit Index (JACI) (TR) (USD) | 6.63% | 2.07% | 2.85% |
|---|
Custom Blended KHYB Index^ | 10.87% | 0.11% | 0.84% |
|---|
|
| No Deduction of Taxes [Text Block] |
|
The table and graph presented above do not reflect the deduction of taxes a shareholder would pay on Fund distributions or the redemption of Fund shares.
|
| AssetsNet |
$ 25,273,651
|
$ 25,273,651
|
| Holdings Count | Holding |
80
|
80
|
| Advisory Fees Paid, Amount |
|
$ 121,225
|
| InvestmentCompanyPortfolioTurnover |
|
158.00%
|
| Additional Fund Statistics [Text Block] |
|
Key Fund Statistics as of March 31, 2025 | Total Net Assets | Number of Holdings | Total Advisory Fees Paid | Portfolio Turnover Rate |
|---|
| $25,273,651 | 80 | $121,225 | 158% |
|---|
|
| Holdings [Text Block] |
|
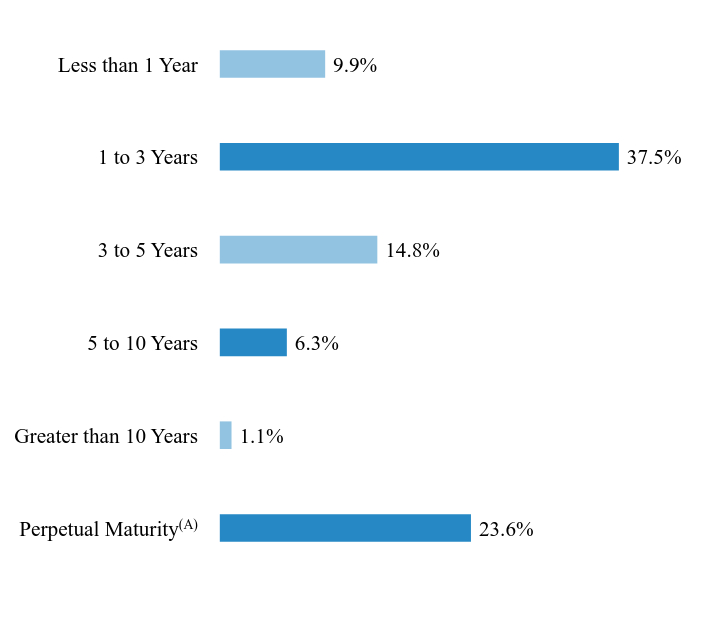
Maturity WeightingsFootnote Reference*Footnote Reference^Value | Value |
|---|
Perpetual MaturityFootnote Reference(A) | 23.6% | Greater than 10 Years | 1.1% | 5 to 10 Years | 6.3% | 3 to 5 Years | 14.8% | 1 to 3 Years | 37.5% | Less than 1 Year | 9.9% |
| Footnote | Description | Footnote* | Percentages are calculated based on total net assets. | Footnote^ | This chart does not include cash, and therefore, the investments as a percentage to total net assets (which includes cash) will not add up to 100%. | Footnote(A) | Perpetual security with no stated maturity date. |
|
| Largest Holdings [Text Block] |
|
Holding Name | Coupon Rate | Maturity Date | Percentage of Total
Net Assets |
|---|
Fuqing Investment Management | 3.250%
| 06/23/25
| 2.4% | Mong Duong Finance Holdings BV | 5.125%
| 05/07/29
| 2.2% | Standard Chartered, H15T5Y + 3.135% | 4.300%
| —Footnote Reference(A) | 2.1% | Greentown China Holdings | 8.450%
| 02/24/28
| 2.0% | Pingan Real Estate Capital | 3.450%
| 07/29/26
| 1.9% | Piramal Finance | 7.800%
| 01/29/28
| 1.8% | Yanlord Land HK | 5.125%
| 05/20/26
| 1.7% | VLL International | 7.250%
| 07/20/27
| 1.7% | Golomt Bank | 11.000%
| 05/20/27
| 1.6% | Vedanta Resources Finance II | 10.875%
| 09/17/29
| 1.6% |
| Footnote | Description | Footnote(A) | Perpetual security with no stated maturity date. |
|
| Material Fund Change [Text Block] |
|
This is a summary of certain changes to the Fund since April 1, 2024. For more complete information, you may review the Fund’s prospectus, which is available at https://kraneshares.com/khyb/#documents or upon request at 1-855-857-2638. Effective August 1, 2024, the name of the Fund changed from the “KraneShares Asia Pacific High Income Bond ETF” to the “KraneShares Asia Pacific High Income USD Bond ETF”. |
| Updated Prospectus Web Address |
|
https://kraneshares.com/khyb/
|
| C000210156 |
|
|
| Shareholder Report [Line Items] |
|
|
| Fund Name |
|
KraneShares MSCI Emerging Markets ex China Index ETF
|
| Class Name |
|
KraneShares MSCI Emerging Markets ex China Index ETF
|
| Trading Symbol |
|
KEMX
|
| Security Exchange Name |
|
NYSEArca
|
| Annual or Semi-Annual Statement [Text Block] |
|
This annual shareholder report contains important information about the KraneShares MSCI Emerging Markets ex China Index ETF (the "Fund") for the period from April 1, 2024 to March 31, 2025.
|
| Shareholder Report Annual or Semi-Annual |
|
Annual Shareholder Report
|
| Additional Information [Text Block] |
|
You can find additional information about the Fund at https://kraneshares.com/kemx/. You can also request this information by contacting us at 1-855-857-2638.
|
| Additional Information Phone Number |
|
1-855-857-2638
|
| Additional Information Website |
|
https://kraneshares.com/kemx/
|
| Expenses [Text Block] |
|
What were the Fund costs for the last year?(based on a hypothetical $10,000 investment) Fund Name | Costs of a $10,000 investment | Costs paid as a percentage of a $10,000 investment |
|---|
KraneShares MSCI Emerging Markets ex China Index ETF | $24 | 0.24% |
|---|
|
| Expenses Paid, Amount |
|
$ 24
|
| Expense Ratio, Percent |
|
0.24%
|
| Factors Affecting Performance [Text Block] |
|
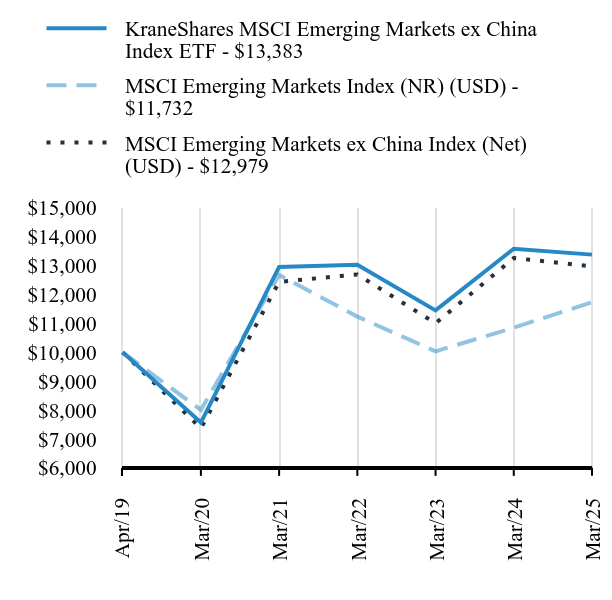
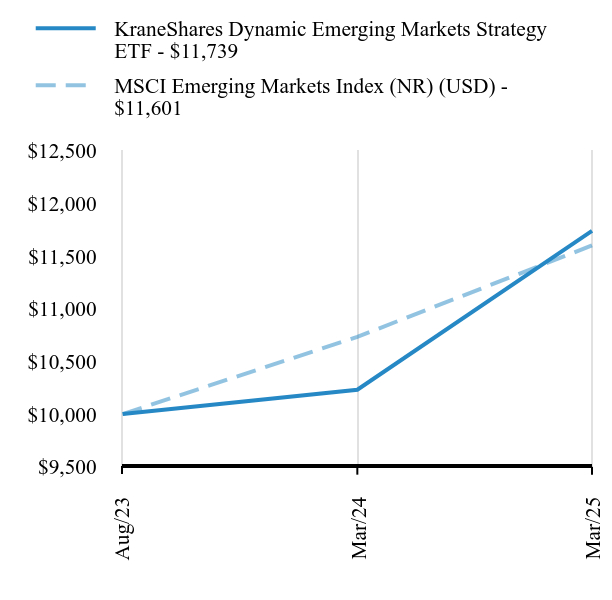
(a) MSCI Emerging Markets ex China Index (b) The Fund is in the Morningstar U.S. ETF Diversified Emerging Markets Category The KraneShares MSCI Emerging Markets ex China Index ETF seeks to provide investment results that, before fees and expenses, correspond generally to the price and yield performance of the MSCI Emerging Markets ex China Index (the "Underlying Index"). The Underlying Index is a free float-adjusted market capitalization-weighted index designed to track the equity market performance of mid- and large-cap companies of emerging market countries, excluding China. Emerging Markets equities, excluding China, underperformed both China, as measured by the MSCI China All Shares Index, and the global equity market, as measured by the MSCI ACWI. U.S. dollar strength and the anticipation of increased U.S. tariffs and protectionism weighed on Emerging Markets during the Period. Meanwhile, a re-rating of semiconductor manufacturers after their valuations reached all-time highs and DeepSeek's demonstration that large language models (LLMs) may require significantly fewer chips to train weighed on key semiconductor-producing countries, Taiwan and South Korea. Within the Fund, the best-performing countries were the Czech Republic and Colombia, while the worst-performing countries were Indonesia and Mexico. Within the Fund, the best-performing sectors were Utilities and Financials, while the worst-performing sectors were Materials and Industrials. The deviation between the Fund's performance and that of the Underlying Index can be mainly attributed to management fees paid by the Fund. |
| Performance Past Does Not Indicate Future [Text] |
|
Past performance is not indicative of future performance.
|
| Line Graph [Table Text Block] |
|
| KraneShares MSCI Emerging Markets ex China Index ETF - $13383 | MSCI Emerging Markets Index (NR) (USD) - $11732 | MSCI Emerging Markets ex China Index (Net) (USD) - $12979 |
|---|
Apr/19 | $10000 | $10000 | $10000 |
|---|
Mar/20 | $7569 | $8005 | $7371 |
|---|
Mar/21 | $12957 | $12679 | $12440 |
|---|
Mar/22 | $13031 | $11238 | $12697 |
|---|
Mar/23 | $11451 | $10036 | $11006 |
|---|
Mar/24 | $13589 | $10854 | $13263 |
|---|
Mar/25 | $13383 | $11732 | $12979 |
|---|
|
| Average Annual Return [Table Text Block] |
|
Fund/Index Name | 1 Year | 5 Years |
Since
Inception |
|---|
KraneShares MSCI Emerging Markets ex China Index ETF | -1.51% | 12.07% | 5.00% |
|---|
MSCI Emerging Markets Index (NR) (USD) | 8.09% | 7.94% | 2.71% |
|---|
MSCI Emerging Markets ex China Index (Net) (USD) | -2.14% | 11.98% | 4.46% |
|---|
|
| No Deduction of Taxes [Text Block] |
|
The table and graph presented above do not reflect the deduction of taxes a shareholder would pay on Fund distributions or the redemption of Fund shares.
|
| AssetsNet |
$ 63,995,861
|
$ 63,995,861
|
| Holdings Count | Holding |
291
|
291
|
| Advisory Fees Paid, Amount |
|
$ 170,053
|
| InvestmentCompanyPortfolioTurnover |
|
3.00%
|
| Additional Fund Statistics [Text Block] |
|
Key Fund Statistics as of March 31, 2025 | Total Net Assets | Number of Holdings | Total Advisory Fees Paid | Portfolio Turnover Rate |
|---|
| $63,995,861 | 291 | $170,053 | 3% |
|---|
|
| Holdings [Text Block] |
|
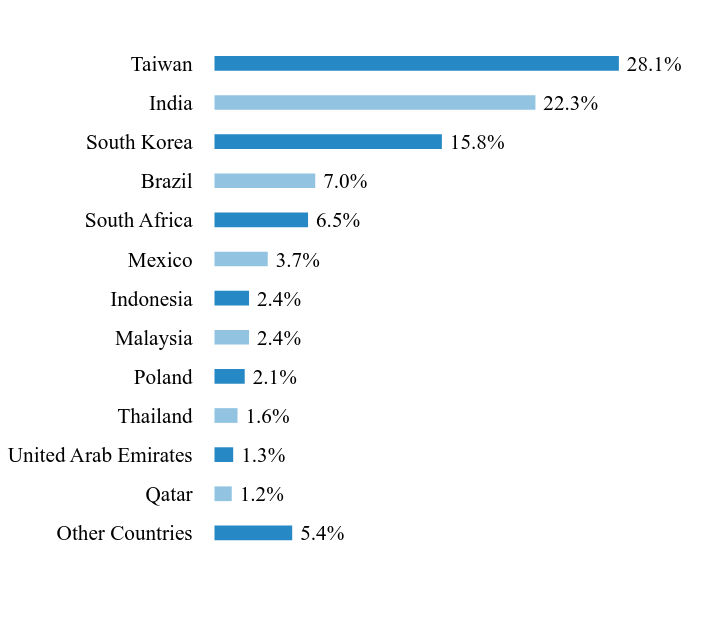
Country WeightingsFootnote Reference*Value | Value |
|---|
Other Countries | 5.4% | Qatar | 1.2% | United Arab Emirates | 1.3% | Thailand | 1.6% | Poland | 2.1% | Malaysia | 2.4% | Indonesia | 2.4% | Mexico | 3.7% | South Africa | 6.5% | Brazil | 7.0% | South Korea | 15.8% | India | 22.3% | Taiwan | 28.1% |
| Footnote | Description | Footnote* | Percentages are calculated based on total net assets. |
|
| Largest Holdings [Text Block] |
|
Holding Name | | | Percentage of
Total Net Assets |
|---|
Taiwan Semiconductor Manufacturing | | | 11.9% | Samsung Electronics | | | 3.7% | ICICI Bank | | | 1.8% | HDFC Bank | | | 1.7% | Infosys ADR | | | 1.7% | SK Hynix | | | 1.5% | MediaTek | | | 1.5% | Bharti Airtel | | | 1.4% | Hon Hai Precision Industry | | | 1.3% | Naspers, Cl N | | | 1.3% |
|
| Material Fund Change [Text Block] |
|
There were no material changes during the reporting period. |
| Updated Prospectus Web Address |
|
https://kraneshares.com/kemx/
|
| C000214065 |
|
|
| Shareholder Report [Line Items] |
|
|
| Fund Name |
|
KraneShares Global Carbon Strategy ETF
|
| Class Name |
|
KraneShares Global Carbon Strategy ETF
|
| Trading Symbol |
|
KRBN
|
| Security Exchange Name |
|
NYSEArca
|
| Annual or Semi-Annual Statement [Text Block] |
|
This annual shareholder report contains important information about the KraneShares Global Carbon Strategy ETF (the "Fund") for the period from April 1, 2024 to March 31, 2025.
|
| Shareholder Report Annual or Semi-Annual |
|
Annual Shareholder Report
|
| Additional Information [Text Block] |
|
You can find additional information about the Fund at https://kraneshares.com/krbn/. You can also request this information by contacting us at 1-855-857-2638.
|
| Additional Information Phone Number |
|
1-855-857-2638
|
| Additional Information Website |
|
https://kraneshares.com/krbn/
|
| Expenses [Text Block] |
|
What were the Fund costs for the last year?(based on a hypothetical $10,000 investment) Fund Name | Costs of a $10,000 investment | Costs paid as a percentage of a $10,000 investment |
|---|
KraneShares Global Carbon Strategy ETF | $78 | 0.79% |
|---|
|
| Expenses Paid, Amount |
|
$ 78
|
| Expense Ratio, Percent |
|
0.79%
|
| Performance Past Does Not Indicate Future [Text] |
|
Past performance is not indicative of future performance.
|
| No Deduction of Taxes [Text Block] |
|
The table and graph presented above do not reflect the deduction of taxes a shareholder would pay on Fund distributions or the redemption of Fund shares.
|
| AssetsNet |
$ 172,178,220
|
$ 172,178,220
|
| Holdings Count | Holding |
9
|
9
|
| Advisory Fees Paid, Amount |
|
$ 2,032,003
|
| InvestmentCompanyPortfolioTurnover |
|
45.00%
|
| Additional Fund Statistics [Text Block] |
|
Key Fund Statistics as of March 31, 2025 | Total Net Assets | Number of Holdings | Total Advisory Fees Paid | Portfolio Turnover Rate |
|---|
| $172,178,220 | 9 | $2,032,003 | 45% |
|---|
|
| Holdings [Text Block] |
|
Market ExposureFootnote Reference*Futures Contracts: | |
|---|
Futures Contract | 103.4% |
|---|
Collateral and Currency Management: | |
|---|
Short-Term Investment, GVMXX | 0.1% |
|---|
Exchange-Traded FundFootnote Reference** | 68.3% |
|---|
| Footnote | Description | Footnote* | Percentages are calculated based on total net assets. All Investments are presented at market value with the exception of future contracts which are presented at the notional amount. | Footnote** | Affiliated Investment |
|
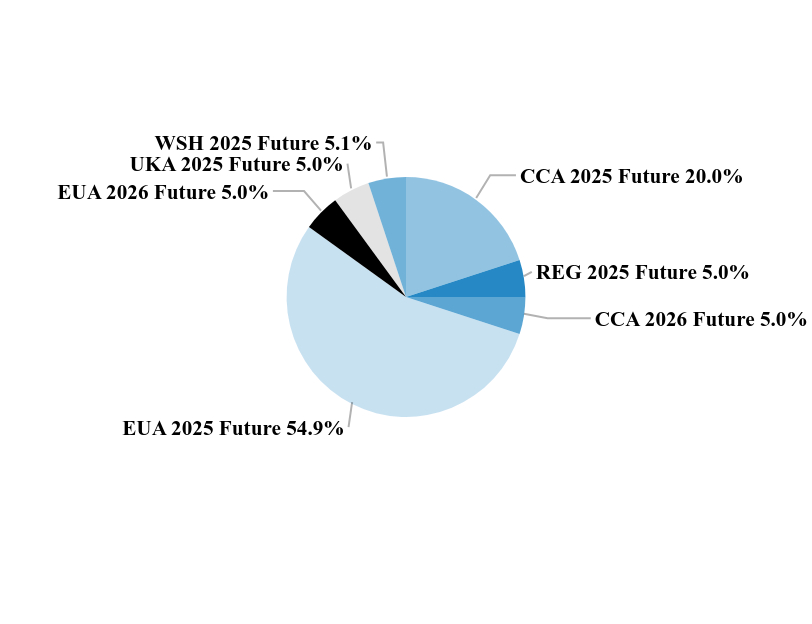
| Largest Holdings [Text Block] |
|
Futures BreakdownFootnote Reference^Value | Value |
|---|
CCA 2025 Future | 20.0% | REG 2025 Future | 5.0% | CCA 2026 Future | 5.0% | EUA 2025 Future | 54.9% | EUA 2026 Future | 5.0% | UKA 2025 Future | 5.0% | WSH 2025 Future | 5.1% |
| Footnote | Description | Footnote^ | Percentages are calculated based on total notional value. Future contracts are presented at the notional value. |
|
| Updated Prospectus Web Address |
|
https://kraneshares.com/krbn/
|
| C000222186 |
|
|
| Shareholder Report [Line Items] |
|
|
| Fund Name |
|
KraneShares Value Line<sup style="box-sizing: border-box; color: rgb(38, 137, 197); display: inline; flex-wrap: nowrap; font-size: 16px; font-weight: 700; grid-area: auto; line-height: 0px; margin: 0px; overflow: visible; position: relative; text-align: left; white-space-collapse: preserve-breaks;">®</sup> Dynamic Dividend Equity Index ETF
|
| Trading Symbol |
|
KVLE
|
| Security Exchange Name |
|
NYSEArca
|
| Annual or Semi-Annual Statement [Text Block] |
|
This annual shareholder report contains important information about the KraneShares Value Line® Dynamic Dividend Equity Index ETF (the "Fund") for the period from April 1, 2024 to March 31, 2025.
|
| Shareholder Report Annual or Semi-Annual |
|
Annual Shareholder Report
|
| Additional Information [Text Block] |
|
You can find additional information about the Fund at https://kraneshares.com/kvle/. You can also request this information by contacting us at 1-855-857-2638.
|
| Additional Information Phone Number |
|
1-855-857-2638
|
| Additional Information Website |
|
https://kraneshares.com/kvle/
|
| Expenses [Text Block] |
|
What were the Fund costs for the last year?(based on a hypothetical $10,000 investment) Fund Name | Costs of a $10,000 investment | Costs paid as a percentage of a $10,000 investment |
|---|
KraneShares Value Line® Dynamic Dividend Equity Index ETF | $59 | 0.56% |
|---|
|
| Expenses Paid, Amount |
|
$ 59
|
| Expense Ratio, Percent |
|
0.56%
|
| Factors Affecting Performance [Text Block] |
|
(a) Value Line® Dynamic Dividend Equity Index (b) The Fund is in the Morningstar U.S. ETF Large Value Category The KraneShares Value Line® Dynamic Dividend Equity Index ETF seeks to provide investment results that correspond generally to the price and yield performance of the Value Line® Dynamic Dividend Equity Index (the "Underlying Index"). The Underlying Index introduces a market-adaptive approach to investing in U.S. large-cap companies. The strategy seeks to identify U.S. companies whose equity securities pay a high dividend yield and are the highest rated by Value Line®'s Safety™ and Timeliness™ Ranking Systems. Careful quantitative modeling, which incorporates a unique set of risk management tools, adjusts the beta of the overall portfolio based on the market environment. The index is rebalanced monthly. During the Period, large-cap, high-dividend, diversified U.S. stocks outperformed global equities, as represented by the MSCI ACWI, and outperformed broad U.S. equities, as measured by the S&P 500 Index. The Fund's sector-neutral approach proved valuable when high concentrations in other U.S. indexes led them to underperform as uncertainties rose in the first quarter of 2025. Within the Fund, the best-performing sectors were Utilities and Energy, while the worst-performing sectors were Materials and Consumer Discretionary. The deviation between the Fund's performance and that of the Underlying Index can be mainly attributed to management fees paid by the Fund. |
| Performance Past Does Not Indicate Future [Text] |
|
Past performance is not indicative of future performance.
|
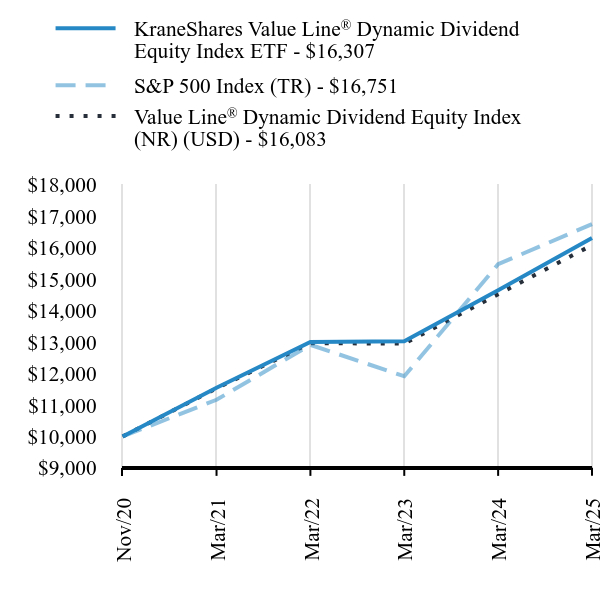
| Line Graph [Table Text Block] |
|
| KraneShares Value Line® Dynamic Dividend Equity Index ETF - $16307 | S&P 500 Index (TR) - $16751 | Value Line® Dynamic Dividend Equity Index (NR) (USD) - $16083 |
|---|
Nov/20 | $10000 | $10000 | $10000 |
|---|
Mar/21 | $11546 | $11165 | $11529 |
|---|
Mar/22 | $13003 | $12912 | $12966 |
|---|
Mar/23 | $13027 | $11914 | $12950 |
|---|
Mar/24 | $14650 | $15474 | $14522 |
|---|
Mar/25 | $16307 | $16751 | $16083 |
|---|
|
| Average Annual Return [Table Text Block] |
|
Fund/Index Name | 1 Year |
Since
Inception |
|---|
KraneShares Value Line® Dynamic Dividend Equity Index ETF | 11.31% | 11.89% |
|---|
S&P 500 Index (TR) | 8.25% | 12.58% |
|---|
Value Line® Dynamic Dividend Equity Index (NR) (USD) | 10.75% | 11.53% |
|---|
|
| No Deduction of Taxes [Text Block] |
|
The table and graph presented above do not reflect the deduction of taxes a shareholder would pay on Fund distributions or the redemption of Fund shares.
|
| AssetsNet |
$ 28,483,315
|
$ 28,483,315
|
| Holdings Count | Holding |
80
|
80
|
| Advisory Fees Paid, Amount |
|
$ 172,898
|
| InvestmentCompanyPortfolioTurnover |
|
80.00%
|
| Additional Fund Statistics [Text Block] |
|
Key Fund Statistics as of March 31, 2025 | Total Net Assets | Number of Holdings | Total Advisory Fees Paid | Portfolio Turnover Rate |
|---|
| $28,483,315 | 80 | $172,898 | 80% |
|---|
|
| Holdings [Text Block] |
|
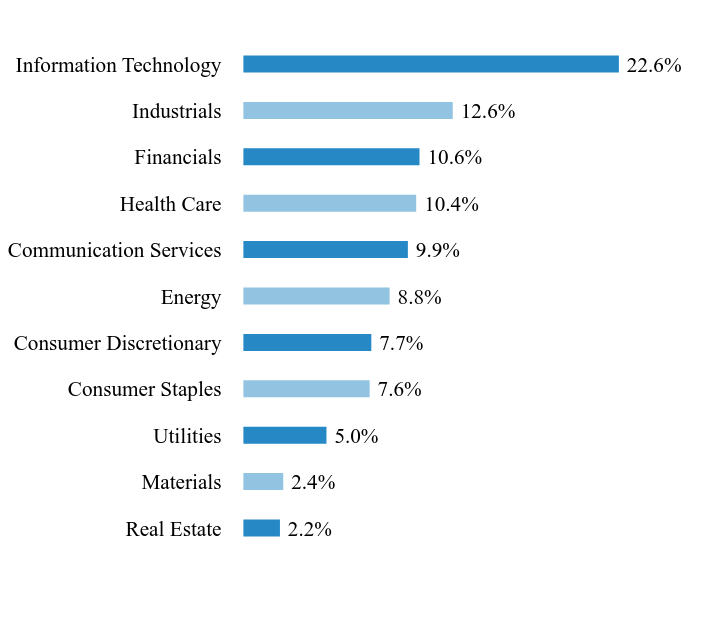
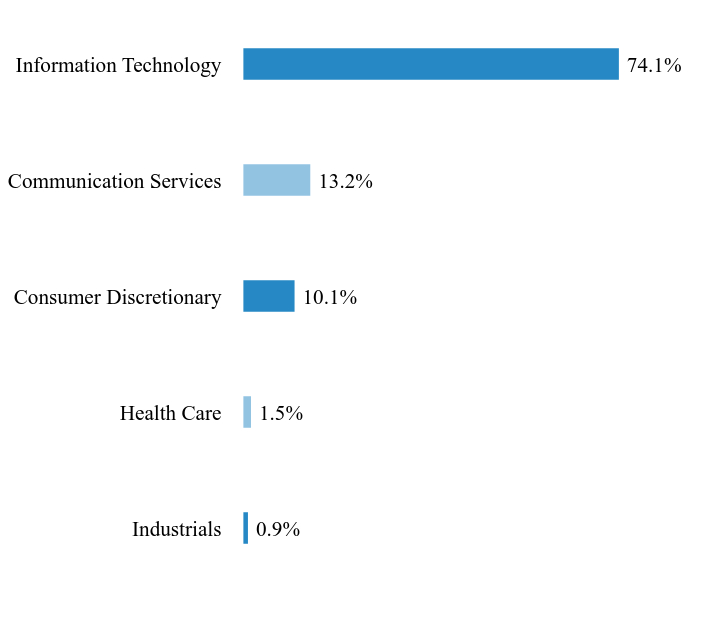
Sector WeightingsFootnote Reference*Value | Value |
|---|
Real Estate | 2.2% | Materials | 2.4% | Utilities | 5.0% | Consumer Staples | 7.6% | Consumer Discretionary | 7.7% | Energy | 8.8% | Communication Services | 9.9% | Health Care | 10.4% | Financials | 10.6% | Industrials | 12.6% | Information Technology | 22.6% |
| Footnote | Description | Footnote* | Percentages are calculated based on total net assets. |
|
| Largest Holdings [Text Block] |
|
Holding Name | | | Percentage of
Total Net Assets |
|---|
Microsoft | | | 5.4% | NVIDIA | | | 5.4% | Apple | | | 5.0% | Alphabet, Cl C | | | 4.4% | Amazon.com | | | 2.4% | Home Depot | | | 2.3% | Visa, Cl A | | | 2.1% | Cisco Systems | | | 1.9% | Comcast, Cl A | | | 1.8% | Goldman Sachs Group | | | 1.8% |
|
| Material Fund Change [Text Block] |
|
There were no material changes during the reporting period. |
| Updated Prospectus Web Address |
|
https://kraneshares.com/kvle/
|
| C000223083 |
|
|
| Shareholder Report [Line Items] |
|
|
| Fund Name |
|
KraneShares Mount Lucas Managed Futures Index Strategy ETF
|
| Class Name |
|
KraneShares Mount Lucas Managed Futures Index Strategy ETF
|
| Trading Symbol |
|
KMLM
|
| Security Exchange Name |
|
NYSEArca
|
| Annual or Semi-Annual Statement [Text Block] |
|
This annual shareholder report contains important information about the KraneShares Mount Lucas Managed Futures Index Strategy ETF (the "Fund") for the period from April 1, 2024 to March 31, 2025.
|
| Shareholder Report Annual or Semi-Annual |
|
Annual Shareholder Report
|
| Additional Information [Text Block] |
|
You can find additional information about the Fund at https://kraneshares.com/kmlm/. You can also request this information by contacting us at 1-855-857-2638.
|
| Additional Information Phone Number |
|
1-855-857-2638
|
| Additional Information Website |
|
https://kraneshares.com/kmlm/
|
| Expenses [Text Block] |
|
What were the Fund costs for the last year?(based on a hypothetical $10,000 investment) Fund Name | Costs of a $10,000 investment | Costs paid as a percentage of a $10,000 investment |
|---|
KraneShares Mount Lucas Managed Futures Index Strategy ETF | $86 | 0.90% |
|---|
|
| Expenses Paid, Amount |
|
$ 86
|
| Expense Ratio, Percent |
|
0.90%
|
| Factors Affecting Performance [Text Block] |
|
(a) KFA MLM Index (b) The Fund is in the Morningstar U.S. ETF Systematic Trend Category The KraneShares Mount Lucas Managed Futures Index Strategy ETF seeks to provide investment results that, before fees and expenses, track the price performance of the KFA MLM Index (the "Underlying Index"). The Index consists of a portfolio of twenty-two liquid futures contracts traded on U.S. and foreign exchanges. The Index includes futures contracts on 11 commodities, six currencies, and five global bond markets. These three baskets are weighted by their relative historical volatility, and within each basket, the constituent markets are equal dollar weighted. The Fund's long position in gold and short positions in natural gas and wheat all contributed positively to performance for the Period. The Fund’s frequent rotation between long and short positions in crude oil, which were triggered by changes in the one-year moving averages that the Underlying Index uses to determine long versus short exposure, detracted from performance. In addition, the Fund charges a management fee, which the Underlying Index does not, which detracted from the Fund’s performance relative to that of the Underlying Index. |
| Performance Past Does Not Indicate Future [Text] |
|
Past performance is not indicative of future performance.
|
| No Deduction of Taxes [Text Block] |
|
The table and graph presented above do not reflect the deduction of taxes a shareholder would pay on Fund distributions or the redemption of Fund shares.
|
| AssetsNet |
$ 221,264,948
|
$ 221,264,948
|
| Holdings Count | Holding |
27
|
27
|
| Advisory Fees Paid, Amount |
|
$ 2,875,942
|
| InvestmentCompanyPortfolioTurnover |
|
0.00%
|
| Additional Fund Statistics [Text Block] |
|
Key Fund Statistics as of March 31, 2025 | Total Net Assets | Number of Holdings | Total Advisory Fees Paid | Portfolio Turnover Rate |
|---|
| $221,264,948 | 27 | $2,875,942 | 0% |
|---|
|
| Holdings [Text Block] |
|
Commodity ExposureFootnote Reference*Footnote Reference^Commodity Exposures as of 3/31/2025 | Identifier | Position | % NAV |
|---|
COPPER FUTURE JUL25 | HGH5 | Long | 7.58% |
|---|
GOLD 100 OZ FUTR JUN25 | GCG5 | Long | 7.55% |
|---|
LIVE CATTLE FUTR JUN25 | LCG5 | Long | 7.40% |
|---|
NATURAL GAS FUTR JUN25 | NGH25 | Long | 7.21% |
|---|
GASOLINE RBOB FUT JUN25 | XBH5 | Short | 7.06% |
|---|
WTI CRUDE FUTURE JUN25 | CLH5 | Short | 7.05% |
|---|
NY HARB ULSD FUT JUN25 | HOH5 | Short | 6.95% |
|---|
SOYBEAN FUTURE MAY25 | S H5 | Short | 6.79% |
|---|
WHEAT FUTURE(CBT) MAY25 | W H5 | Short | 6.63% |
|---|
SUGAR #11 (WORLD) MAY25 | SBH5 | Long | 2.33% |
|---|
CORN FUTURE MAY25 | C H5 | Short | 1.59% |
|---|
| Footnote | Description | Footnote* | Percentages are calculated based on total net assets. | Footnote^ | This chart does not include cash, and therefore, the investments as a percentage to total net assets (which includes cash) will not add up to 100%. |
|
| Largest Holdings [Text Block] |
|
Holding Name | | | Percentage of
Total Net AssetsFootnote Reference(A) |
|---|
Wheat - Futures ContractFootnote Reference(1) | | | 0.9% | Gold - Futures ContractFootnote Reference(1) | | | 0.8% | Copper - Futures ContractFootnote Reference(1) | | | 0.7% | Euro-Bund 10-Year Bond - Futures ContractFootnote Reference(1) | | | 0.5% | Live Cattle - Futures ContractFootnote Reference(1) | | | 0.4% | Long Gilt 10-Year Bond - Futures ContractFootnote Reference(1) | | | 0.4% | Soybean - Futures ContractFootnote Reference(1) | | | 0.2% | AUD Currency - Futures ContractFootnote Reference(1) | | | 0.2% | Japanese Yen - Futures ContractFootnote Reference(1) | | | 0.1% | Swiss Franc - Futures ContractFootnote Reference(1) | | | 0.1% |
| Footnote | Description | Footnote(1) | At market value. | Footnote(A) | Short-Term Investments are not shown in the top ten chart. |
|
| Material Fund Change [Text Block] |
|
This is a summary of certain changes to the Fund since April 1, 2024. For more complete information, you may review the Fund’s prospectus, which is available at https://kraneshares.com/kmlm/#documents or upon request at 1-855-857-2638. Effective August 1, 2024, the name of the Fund changed from the “KFA Mount Lucas Managed Futures Index Strategy ETF” to the “KraneShares Mount Lucas Managed Futures Index Strategy ETF”. |
| Updated Prospectus Web Address |
|
https://kraneshares.com/kmlm/
|
| C000220718 |
|
|
| Shareholder Report [Line Items] |
|
|
| Fund Name |
|
KraneShares SSE STAR Market 50 Index ETF
|
| Class Name |
|
KraneShares SSE STAR Market 50 Index ETF
|
| Trading Symbol |
|
KSTR
|
| Security Exchange Name |
|
NYSEArca
|
| Annual or Semi-Annual Statement [Text Block] |
|
This annual shareholder report contains important information about the KraneShares SSE STAR Market 50 Index ETF (the "Fund") for the period from April 1, 2024 to March 31, 2025.
|
| Shareholder Report Annual or Semi-Annual |
|
Annual Shareholder Report
|
| Additional Information [Text Block] |
|
You can find additional information about the Fund at https://kraneshares.com/kstr/. You can also request this information by contacting us at 1-855-857-2638.
|
| Additional Information Phone Number |
|
1-855-857-2638
|
| Additional Information Website |
|
https://kraneshares.com/kstr/
|
| Expenses [Text Block] |
|
What were the Fund costs for the last year?(based on a hypothetical $10,000 investment) Fund Name | Costs of a $10,000 investment | Costs paid as a percentage of a $10,000 investment |
|---|
KraneShares SSE STAR Market 50 Index ETF | $101 | 0.89% |
|---|
|
| Expenses Paid, Amount |
|
$ 101
|
| Expense Ratio, Percent |
|
0.89%
|
| Factors Affecting Performance [Text Block] |
|
(a) Shanghai Stock Exchange Science and Technology Innovation Board 50 Index (b) The Fund is in the Morningstar U.S. ETF China Region Category The KraneShares SSE STAR Market 50 Index ETF seeks to provide investment results that, before fees and expenses, correspond generally to the price and yield performance of the Shanghai Stock Exchange ("SSE") Science and Technology Innovation Board 50 Index (the "Underlying Index"). The Underlying Index is comprised of the 50 largest companies listed on the SSE Science and Technology Innovation Board ("STAR Market") as determined by market capitalization and liquidity. Equities listed on China's STAR Market Science & Technology Innovation Board, a sub-board of the Shanghai Stock Exchange, outperformed global equities, as measured by the MSCI ACWI. The top-performing sector within the Fund was the Information Technology sector, driven mainly by optimism over DeepSeek's innovation in AI large language models (LLMs). Within the Fund, the top-performing sectors were Information Technology and Materials, while the worst-performing sectors were Consumer Staples and Industrials. The deviation between the Fund's performance and that of the Underlying Index can be mainly attributed to management fees paid by the Fund and the index's inclusion of a name indicated in U.S. Executive Order 13959/14032(1), which was not held in the portfolio during the Period. (1) Executive Order 13959/14032, signed by former President Trump on November 12, 2020, prohibits U.S. investors from purchasing or transacting in securities linked to Chinese companies identified as tied to the Chinese military (CMICs). It became effective on January 11, 2021. Executive Order 14032, signed by President Biden on June 3, 2021, amends Executive Order 13959 by maintaining the investment restrictions while allowing the Treasury Secretary, in coordination with the Secretaries of State and Defense, to update the list of prohibited companies. It also outlines procedures for U.S. persons to divest from such securities. |
| Performance Past Does Not Indicate Future [Text] |
|
Past performance is not indicative of future performance.
|
| Line Graph [Table Text Block] |
|
| KraneShares SSE STAR Market 50 Index ETF - $5532 | MSCI China All Shares Index (Net) (USD) - $6757 | SSE Science and Technology Innovation Board 50 Index (USD, TR) - $6309 |
|---|
Jan/21 | $10000 | $10000 | $10000 |
|---|
Mar/21 | $8424 | $8896 | $8334 |
|---|
Mar/22 | $7504 | $6743 | $7555 |
|---|
Mar/23 | $6756 | $6309 | $6946 |
|---|
Mar/24 | $4360 | $5260 | $4688 |
|---|
Mar/25 | $5532 | $6757 | $6309 |
|---|
|
| Average Annual Return [Table Text Block] |
|
Fund/Index Name | 1 Year |
Since
Inception |
|---|
KraneShares SSE STAR Market 50 Index ETF | 26.88% | -13.21% |
|---|
MSCI China All Shares Index (Net) (USD) | 28.47% | -8.96% |
|---|
SSE Science and Technology Innovation Board 50 Index (USD, TR) | 34.57% | -10.44% |
|---|
|
| No Deduction of Taxes [Text Block] |
|
The table and graph presented above do not reflect the deduction of taxes a shareholder would pay on Fund distributions or the redemption of Fund shares.
|
| AssetsNet |
$ 35,947,595
|
$ 35,947,595
|
| Holdings Count | Holding |
51
|
51
|
| Advisory Fees Paid, Amount |
|
$ 264,084
|
| InvestmentCompanyPortfolioTurnover |
|
57.00%
|
| Additional Fund Statistics [Text Block] |
|
Key Fund Statistics as of March 31, 2025 | Total Net Assets | Number of Holdings | Total Advisory Fees Paid | Portfolio Turnover Rate |
|---|
| $35,947,595 | 51 | $264,084 | 57% |
|---|
|
| Holdings [Text Block] |
|
Sector WeightingsFootnote Reference*Value | Value |
|---|
Consumer Staples | 0.7% | Industrials | 2.6% | Materials | 2.9% | Consumer Discretionary | 5.6% | Health Care | 12.1% | Information Technology | 75.9% |
| Footnote | Description | Footnote* | Percentages are calculated based on total net assets. |
|
| Largest Holdings [Text Block] |
|
Holding Name | | | Percentage of
Total Net Assets |
|---|
Hygon Information Technology, Cl A | | | 9.6% | Cambricon Technologies, Cl A | | | 9.5% | Montage Technology, Cl A | | | 6.5% | Beijing Kingsoft Office Software, Cl A | | | 5.3% | Advanced Micro-Fabrication Equipment China, Cl A | | | 4.0% | Shanghai United Imaging Healthcare, Cl A | | | 3.9% | Shenzhen Transsion Holdings, Cl A | | | 3.2% | Verisilicon Microelectronics Shanghai, Cl A | | | 2.9% | Beijing Roborock Technology, Cl A | | | 2.8% | SUPCON Technology, Cl A | | | 2.6% |
|
| Material Fund Change [Text Block] |
|
There were no material changes during the reporting period. |
| Updated Prospectus Web Address |
|
https://kraneshares.com/kstr/
|
| C000223017 |
|
|
| Shareholder Report [Line Items] |
|
|
| Fund Name |
|
KraneShares Hang Seng TECH Index ETF
|
| Class Name |
|
KraneShares Hang Seng TECH Index ETF
|
| Trading Symbol |
|
KTEC
|
| Security Exchange Name |
|
NYSEArca
|
| Annual or Semi-Annual Statement [Text Block] |
|
This annual shareholder report contains important information about the KraneShares Hang Seng TECH Index ETF (the "Fund") for the period from April 1, 2024 to March 31, 2025.
|
| Shareholder Report Annual or Semi-Annual |
|
Annual Shareholder Report
|
| Additional Information [Text Block] |
|
You can find additional information about the Fund at https://kraneshares.com/ktec/. You can also request this information by contacting us at 1-855-857-2638.
|
| Additional Information Phone Number |
|
1-855-857-2638
|
| Additional Information Website |
|
https://kraneshares.com/ktec/
|
| Expenses [Text Block] |
|
What were the Fund costs for the last year?(based on a hypothetical $10,000 investment) Fund Name | Costs of a $10,000 investment | Costs paid as a percentage of a $10,000 investment |
|---|
KraneShares Hang Seng TECH Index ETF | $86 | 0.69% |
|---|
|
| Expenses Paid, Amount |
|
$ 86
|
| Expense Ratio, Percent |
|
0.69%
|
| Factors Affecting Performance [Text Block] |
|
(a) Hang Seng TECH Index (b) The Fund is in the Morningstar U.S. ETF China Region Category. The KraneShares Hang Seng TECH Index ETF seeks to provide investment results that, before expenses and fees, correspond generally to the price and yield performance of the Hang Seng TECH Index (the "Underlying Index"). The Underlying Index is designed to track the performance of the 30 largest technology companies listed in Hong Kong with significant revenue exposure to technology themes. Internet and technology equities listed on the Hong Kong Stock Exchange significantly outperformed global equities, as represented by the MSCI ACWI, and China's equity markets more broadly, as represented by the MSCI China All Shares Index. Catalysts during the Period included stimulus measures announced by China's government in September, which included a stock market stabilization fund, consumer subsidies, and rate cuts. Meanwhile, DeepSeek, China's answer to OpenAI's ChatGPT, was reported to operate at a higher level of efficiency and demand fewer chips to train, potentially eliminating concerns over chip shortages for China's internet and technology firms. The Fund's inclusion of hardware companies, especially Xiaomi, led to its outperformance over China's internet equities, as hardware names were seen as beneficiaries of AI before internet firms. The deviation between the Fund's performance and that of the Underlying Index can be mainly attributed to management fees and the index's inclusion of a name indicated in U.S. Executive Order 13959/14032(1), which was not held in the portfolio during the Period, and the deduction of management fees. (1) Executive Order 13959/14032, signed by former President Trump on November 12, 2020, prohibits U.S. investors from purchasing or transacting in securities linked to Chinese companies identified as tied to the Chinese military (CMICs). It became effective on January 11, 2021. Executive Order 14032, signed by President Biden on June 3, 2021, amends Executive Order 13959 by maintaining the investment restrictions while allowing the Treasury Secretary, in coordination with the Secretaries of State and Defense, to update the list of prohibited companies. It also outlines procedures for U.S. persons to divest from such securities. |
| Performance Past Does Not Indicate Future [Text] |
|
Past performance is not indicative of future performance.
|
| Line Graph [Table Text Block] |
|
| KraneShares Hang Seng TECH Index ETF - $6548 | MSCI China All Shares Index (Net) (USD) - $7346 | Hang Seng TECH Index (USD) - $6921 |
|---|
Jun/21 | $10000 | $10000 | $10000 |
|---|
Mar/22 | $5572 | $7332 | $5674 |
|---|
Mar/23 | $5328 | $6859 | $5381 |
|---|
Mar/24 | $4354 | $5719 | $4392 |
|---|
Mar/25 | $6548 | $7346 | $6921 |
|---|
|
| Average Annual Return [Table Text Block] |
|
Fund/Index Name | 1 Year |
Since
Inception |
|---|
KraneShares Hang Seng TECH Index ETF | 50.40% | -10.51% |
|---|
MSCI China All Shares Index (Net) (USD) | 28.47% | -7.77% |
|---|
Hang Seng TECH Index (USD) | 57.58% | -9.20% |
|---|
|
| No Deduction of Taxes [Text Block] |
|
The table and graph presented above do not reflect the deduction of taxes a shareholder would pay on Fund distributions or the redemption of Fund shares.
|
| AssetsNet |
$ 46,081,718
|
$ 46,081,718
|
| Holdings Count | Holding |
29
|
29
|
| Advisory Fees Paid, Amount |
|
$ 84,353
|
| InvestmentCompanyPortfolioTurnover |
|
86.00%
|
| Additional Fund Statistics [Text Block] |
|
Key Fund Statistics as of March 31, 2025 | Total Net Assets | Number of Holdings | Total Advisory Fees Paid | Portfolio Turnover Rate |
|---|
| $46,081,718 | 29 | $84,353 | 86% |
|---|
|
| Holdings [Text Block] |
|
Sector WeightingsFootnote Reference*Footnote Reference^Value | Value |
|---|
Consumer Staples | 2.9% | Information Technology | 21.4% | Communication Services | 24.4% | Consumer Discretionary | 44.0% |
| Footnote | Description | Footnote* | Percentages are calculated based on total net assets. | Footnote^ | This chart does not include cash, and therefore, the investments as a percentage to total net assets (which includes cash) will not add up to 100%. |
|
| Largest Holdings [Text Block] |
|
Holding Name | | | Percentage of
Total Net Assets |
|---|
JD.com, Cl A | | | 8.9% | Alibaba Group Holding | | | 8.8% | Tencent Holdings | | | 8.8% | Meituan, Cl B | | | 8.6% | Xiaomi, Cl B | | | 8.6% | NetEase | | | 4.2% | XPeng, Cl A | | | 4.1% | Kuaishou Technology, Cl B | | | 4.0% | Li Auto, Cl A | | | 4.0% | Lenovo Group | | | 3.7% |
|
| Material Fund Change [Text Block] |
|
There were no material changes during the reporting period. |
| Updated Prospectus Web Address |
|
https://kraneshares.com/ktec/
|
| C000229248 |
|
|
| Shareholder Report [Line Items] |
|
|
| Fund Name |
|
KraneShares European Carbon Allowance Strategy ETF
|
| Class Name |
|
KraneShares European Carbon Allowance Strategy ETF
|
| Trading Symbol |
|
KEUA
|
| Security Exchange Name |
|
NYSEArca
|
| Annual or Semi-Annual Statement [Text Block] |
|
This annual shareholder report contains important information about the KraneShares European Carbon Allowance Strategy ETF (the "Fund") for the period from April 1, 2024 to March 31, 2025.
|
| Shareholder Report Annual or Semi-Annual |
|
Annual Shareholder Report
|
| Additional Information [Text Block] |
|
You can find additional information about the Fund at https://kraneshares.com/keua/. You can also request this information by contacting us at 1-855-857-2638.
|
| Additional Information Phone Number |
|
1-855-857-2638
|
| Additional Information Website |
|
https://kraneshares.com/keua/
|
| Expenses [Text Block] |
|
What were the Fund costs for the last year?(based on a hypothetical $10,000 investment) Fund Name | Costs of a $10,000 investment | Costs paid as a percentage of a $10,000 investment |
|---|
KraneShares European Carbon Allowance Strategy ETF | $82 | 0.79% |
|---|
|
| Expenses Paid, Amount |
|
$ 82
|
| Expense Ratio, Percent |
|
0.79%
|
| Performance Past Does Not Indicate Future [Text] |
|
Past performance is not indicative of future performance.
|
| No Deduction of Taxes [Text Block] |
|
The table and graph presented above do not reflect the deduction of taxes a shareholder would pay on Fund distributions or the redemption of Fund shares.
|
| AssetsNet |
$ 7,359,741
|
$ 7,359,741
|
| Holdings Count | Holding |
3
|
3
|
| Advisory Fees Paid, Amount |
|
$ 79,253
|
| InvestmentCompanyPortfolioTurnover |
|
10.00%
|
| Additional Fund Statistics [Text Block] |
|
Key Fund Statistics as of March 31, 2025 | Total Net Assets | Number of Holdings | Total Advisory Fees Paid | Portfolio Turnover Rate |
|---|
| $7,359,741 | 3 | $79,253 | 10% |
|---|
|
| Holdings [Text Block] |
|
Market ExposureFootnote Reference*Futures Contracts: | |
|---|
Futures Contract | 100.9% |
|---|
Collateral and Currency Management: | |
|---|
Short-Term Investment, GVMXX | 2.7% |
|---|
Exchange-Traded FundFootnote Reference** | 48.8% |
|---|
| Footnote | Description | Footnote* | Percentages are calculated based on total net assets. All Investments are presented at market value with the exception of future contracts which are presented at the notional amount. | Footnote** | Affiliated Investment |
|
| Largest Holdings [Text Block] |
|
Futures BreakdownFootnote Reference^Value | Value |
|---|
European Union | 100.0% |
| Footnote | Description | Footnote^ | Percentages are calculated based on total notional value. Future contracts are presented at the notional value. |
|
| Updated Prospectus Web Address |
|
https://kraneshares.com/keua/
|
| C000229247 |
|
|
| Shareholder Report [Line Items] |
|
|
| Fund Name |
|
KraneShares California Carbon Allowance Strategy ETF
|
| Class Name |
|
KraneShares California Carbon Allowance Strategy ETF
|
| Trading Symbol |
|
KCCA
|
| Security Exchange Name |
|
NYSEArca
|
| Annual or Semi-Annual Statement [Text Block] |
|
This annual shareholder report contains important information about the KraneShares California Carbon Allowance Strategy ETF (the "Fund") for the period from April 1, 2024 to March 31, 2025.
|
| Shareholder Report Annual or Semi-Annual |
|
Annual Shareholder Report
|
| Additional Information [Text Block] |
|
You can find additional information about the Fund at https://kraneshares.com/kcca/. You can also request this information by contacting us at 1-855-857-2638.
|
| Additional Information Phone Number |
|
1-855-857-2638
|
| Additional Information Website |
|
https://kraneshares.com/kcca/
|
| Expenses [Text Block] |
|
What were the Fund costs for the last year?(based on a hypothetical $10,000 investment) Fund Name | Costs of a $10,000 investment | Costs paid as a percentage of a $10,000 investment |
|---|
KraneShares California Carbon Allowance Strategy ETF | $69 | 0.79% |
|---|
|
| Expenses Paid, Amount |
|
$ 69
|
| Expense Ratio, Percent |
|
0.79%
|
| Performance Past Does Not Indicate Future [Text] |
|
Past performance is not indicative of future performance.
|
| No Deduction of Taxes [Text Block] |
|
The table and graph presented above do not reflect the deduction of taxes a shareholder would pay on Fund distributions or the redemption of Fund shares.
|
| AssetsNet |
$ 109,082,163
|
$ 109,082,163
|
| Holdings Count | Holding |
3
|
3
|
| Advisory Fees Paid, Amount |
|
$ 1,500,624
|
| InvestmentCompanyPortfolioTurnover |
|
74.00%
|
| Additional Fund Statistics [Text Block] |
|
Key Fund Statistics as of March 31, 2025 | Total Net Assets | Number of Holdings | Total Advisory Fees Paid | Portfolio Turnover Rate |
|---|
| $109,082,163 | 3 | $1,500,624 | 74% |
|---|
|
| Holdings [Text Block] |
|
Market ExposureFootnote Reference*Futures Contracts: | |
|---|
Futures Contract | 115.5% |
|---|
Collateral and Currency Management: | |
|---|
Short-Term Investment, GVMXX | 4.4% |
|---|
Exchange-Traded FundFootnote Reference** | 79.9% |
|---|
| Footnote | Description | Footnote* | Percentages are calculated based on total net assets. All Investments are presented at market value with the exception of future contracts which are presented at the notional amount. | Footnote** | Affiliated Investment |
|
| Largest Holdings [Text Block] |
|
Futures BreakdownFootnote Reference^Value | Value |
|---|
California | 100.0% |
| Footnote | Description | Footnote^ | Percentages are calculated based on total notional value. Future contracts are presented at the notional value. |
|
| Updated Prospectus Web Address |
|
https://kraneshares.com/kcca/
|
| C000240471 |
|
|
| Shareholder Report [Line Items] |
|
|
| Fund Name |
|
KraneShares KWEB Covered Call Strategy ETF
|
| Class Name |
|
KraneShares KWEB Covered Call Strategy ETF
|
| Trading Symbol |
|
KLIP
|
| Security Exchange Name |
|
NYSEArca
|
| Annual or Semi-Annual Statement [Text Block] |
|
This annual shareholder report contains important information about the KraneShares KWEB Covered Call Strategy ETF (the "Fund") for the period from April 1, 2024 to March 31, 2025.
|
| Shareholder Report Annual or Semi-Annual |
|
Annual Shareholder Report
|
| Additional Information [Text Block] |
|
You can find additional information about the Fund at https://kraneshares.com/klip/. You can also request this information by contacting us at 1-855-857-2638.
|
| Additional Information Phone Number |
|
1-855-857-2638
|
| Additional Information Website |
|
https://kraneshares.com/klip/
|
| Expenses [Text Block] |
|
What were the Fund costs for the last year?(based on a hypothetical $10,000 investment) Fund Name | Costs of a $10,000 investment | Costs paid as a percentage of a $10,000 investment |
|---|
KraneShares KWEB Covered Call Strategy ETF | $27 | 0.26% |
|---|
|
| Expenses Paid, Amount |
|
$ 27
|
| Expense Ratio, Percent |
|
0.26%
|
| Factors Affecting Performance [Text Block] |
|
^ Fund is actively managed and does not track an Underlying Index. (1) The Fund is in the Morningstar U.S. ETF China Region Category. The KraneShares KWEB Covered Call Strategy ETF seeks to provide current income. To achieve its investment objective, the Fund employs a covered call strategy. Under normal circumstances, the Fund invests at least 80% of its net assets (plus borrowings for investment purposes) in the component securities of the CSI Overseas China Internet Index or in instruments that have economic characteristics similar to those in the Index and writes (sells) covered call options on the Index or in instruments that have economic characteristics similar to writing covered call options on the Index. Currently, the Fund invests in the KraneShares CSI China Internet ETF (the "Underlying Fund"), which is an exchange-traded fund advised by Krane that seeks to track the Index, and to write (sell) covered call options on the Underlying Fund. Elevated implied volatility in China’s internet equities led to an increase in the options premiums earned by the Fund during the Period. China's internet equities outperformed China's equity market more broadly and global equities, broadly defined, due to several positive catalysts for China's internet equities during the Period, including stimulus measures announced by China's government in September, which included a stock market stabilization fund, consumer subsidies, and rate cuts. |
| Performance Past Does Not Indicate Future [Text] |
|
Past performance is not indicative of future performance.
|
| Line Graph [Table Text Block] |
|
| KraneShares KWEB Covered Call Strategy ETF - $12179 | MSCI China All Shares Index (Net) (USD) - $10337 | CSI Overseas China Internet Index - $10541 |
|---|
Jan/23 | $10000 | $10000 | $10000 |
|---|
Mar/23 | $9644 | $9652 | $9052 |
|---|
Mar/24 | $11021 | $8047 | $7744 |
|---|
Mar/25 | $12179 | $10337 | $10541 |
|---|
|
| Average Annual Return [Table Text Block] |
|
Fund/Index Name | 1 Year |
Since
Inception |
|---|
KraneShares KWEB Covered Call Strategy ETF | 10.51% | 9.29% |
|---|
MSCI China All Shares Index (Net) (USD) | 28.47% | 1.50% |
|---|
CSI Overseas China Internet Index | 36.11% | 2.40% |
|---|
|
| No Deduction of Taxes [Text Block] |
|
The table and graph presented above do not reflect the deduction of taxes a shareholder would pay on Fund distributions or the redemption of Fund shares.
|
| AssetsNet |
$ 104,568,776
|
$ 104,568,776
|
| Holdings Count | Holding |
9
|
9
|
| Advisory Fees Paid, Amount |
|
$ 366,857
|
| InvestmentCompanyPortfolioTurnover |
|
424.00%
|
| Additional Fund Statistics [Text Block] |
|
Key Fund Statistics as of March 31, 2025 | Total Net Assets | Number of Holdings | Total Advisory Fees Paid | Portfolio Turnover Rate |
|---|
| $104,568,776 | 9 | $366,857 | 424% |
|---|
|
| Holdings [Text Block] |
|
(KWEB) Industry WeightingsFootnote Reference*Value | Value |
|---|
Insurance | 0.7% | Media | 0.8% | Short-Term InvestmentFootnote Reference† | 2.1% | Diversified Consumer Services | 3.2% | Real Estate Management & Development | 3.5% | Consumer Finance | 3.6% | Ground Transportation | 3.9% | Consumer Staples Distribution & Retail | 5.3% | Internet & Catalog Retail | 6.6% | Hotels, Restaurants & Leisure | 6.6% | Entertainment | 11.5% | Broadline Retail | 25.9% | Interactive Media & Services | 28.4% |
| Footnote | Description | Footnote* | Percentages are calculated based on total net assets. | Footnote† | This security, or a portion thereof, was purchased with cash collateral held from KWEB securities on loan. |
|
| Largest Holdings [Text Block] |
|
Holding Name | | | Percentage of
Total Net AssetsFootnote Reference(A) |
|---|
KraneShares CSI China Internet ETFFootnote Reference** | | | 102.3% | Written Option - KWEB US, $36.30, 04/25/25Footnote Reference(1) | | | 0.0% | Written Option - KWEB US, $36.17, 05/02/25Footnote Reference(1) | | | 0.0% | Written Option - KWEB US, $36.99, 04/11/25Footnote Reference(1) | | | -0.2% | Written Option - KWEB US, $36.78, 04/17/25Footnote Reference(1) | | | -0.3% | Written Option - KWEB US, $35.58, 04/25/25Footnote Reference(1) | | | -0.7% | Written Option - KWEB US, $33.93, 04/04/25Footnote Reference(1) | | | -0.8% | Written Option - KWEB US, $35.04, 05/02/25Footnote Reference(1) | | | -0.9% |
| Footnote | Description | Footnote** | Affiliated Investment | Footnote(1) | At market value. | Footnote(A) | Short-Term Investments are not shown in the top ten chart. |
|
| Material Fund Change [Text Block] |
|
This is a summary of certain changes to the Fund since April 1, 2024. For more complete information, you may review the Fund’s prospectus, which is available at https://kraneshares.com/klip/#documents or upon request at 1-855-857-2638. The Board of the Trust approved a reverse share split of one to three (1:3) of the issued and outstanding shares of KraneShares KWEB Covered Call Strategy ETF (the "Reverse Split"). The Reverse Split was completed after the close of business on December 31, 2024. The effect of this transaction for the Fund was to reduce the number of outstanding Shares of the Fund by one-third, resulting in a corresponding increase in the NAV per Share. There were no changes in net assets, results of operation or total return as a result of this transaction. Effective January 27, 2025, the KraneShares China Internet and Covered Call Strategy ETF was renamed the KraneShares KWEB Covered Call Strategy ETF. |
| Updated Prospectus Web Address |
|
https://kraneshares.com/klip/
|
| C000244532 |
|
|
| Shareholder Report [Line Items] |
|
|
| Fund Name |
|
KraneShares Dynamic Emerging Markets Strategy ETF
|
| Class Name |
|
KraneShares Dynamic Emerging Markets Strategy ETF
|
| Trading Symbol |
|
KEM
|
| Security Exchange Name |
|
NYSEArca
|
| Annual or Semi-Annual Statement [Text Block] |
|
This annual shareholder report contains important information about the KraneShares Dynamic Emerging Markets Strategy ETF (the "Fund") for the period from April 1, 2024 to March 31, 2025.
|
| Shareholder Report Annual or Semi-Annual |
|
Annual Shareholder Report
|
| Additional Information [Text Block] |
|
You can find additional information about the Fund at https://kraneshares.com/kem/. You can also request this information by contacting us at 1-855-857-2638.
|
| Additional Information Phone Number |
|
1-855-857-2638
|
| Additional Information Website |
|
https://kraneshares.com/kem/
|
| Expenses [Text Block] |
|
What were the Fund costs for the last year?(based on a hypothetical $10,000 investment) Fund Name | Costs of a $10,000 investment | Costs paid as a percentage of a $10,000 investment |
|---|
KraneShares Dynamic Emerging Markets Strategy ETF | $12 | 0.11% |
|---|
|
| Expenses Paid, Amount |
|
$ 12
|
| Expense Ratio, Percent |
|
0.11%
|
| Factors Affecting Performance [Text Block] |
|
^ Fund is actively managed and does not track an Underlying Index. (1) The Fund is in the Morningstar U.S. ETF Diversified Emerging Markets Category. The KraneShares Dynamic Emerging Markets Strategy ETF is an active ETF that invests in other Funds to provide investors with exposure to broad Emerging Market equities while dynamically adjusting the portfolio's China weight based on fundamental, valuation and technical signals. KEM has the potential to mitigate downside risk by dynamically adjusting its allocations between the Underlying ETFs and cash and cash equivalents. By combining a strategic allocation with a systematic valuation overlay between China and the rest of Emerging Markets, KEM seeks to outperform the MSCI Emerging Markets Index ("Benchmark Index"). KEM primarily invests in the following ETFs: • The KraneShares MSCI All China Index ETF • The KraneShares MSCI Emerging Markets ex China Index ETF The Fund outperformed both Emerging Markets equities, as measured by the MSCI Emerging Markets Index, and global equities, as measured by the MSCI ACWI, during the Period. The Fund's consistent overweight to China contributed positively to Fund performance. U.S. dollar strength and the anticipation of increased U.S. tariffs and protectionism weighed on Emerging Markets outside of China during the Period. Meanwhile, a re-rating of semiconductor manufacturers after their valuations reached all-time highs and DeepSeek's demonstration that large language models (LLMs) may require significantly fewer chips to train weighed on key semiconductor-producing countries, Taiwan and South Korea. China's outperformance was driven by stimulus measures announced by China's government in September, which included a stock market stabilization fund, consumer subsidies, and rate cuts, as well as critical advancements in AI technology in the country during the Period. |
| Performance Past Does Not Indicate Future [Text] |
|
Past performance is not indicative of future performance.
|
| Line Graph [Table Text Block] |
|
| KraneShares Dynamic Emerging Markets Strategy ETF - $11739 | MSCI Emerging Markets Index (NR) (USD) - $11601 |
|---|
Aug/23 | $10000 | $10000 |
|---|
Mar/24 | $10231 | $10733 |
|---|
Mar/25 | $11739 | $11601 |
|---|
|
| Average Annual Return [Table Text Block] |
|
Fund/Index Name | 1 Year |
Since
Inception |
|---|
KraneShares Dynamic Emerging Markets Strategy ETF | 14.74% | 10.52% |
|---|
MSCI Emerging Markets Index (NR) (USD) | 8.09% | 9.71% |
|---|
|
| No Deduction of Taxes [Text Block] |
|
The table and graph presented above do not reflect the deduction of taxes a shareholder would pay on Fund distributions or the redemption of Fund shares.
|
| AssetsNet |
$ 4,862,790
|
$ 4,862,790
|
| Holdings Count | Holding |
2
|
2
|
| Advisory Fees Paid, Amount |
|
$ 4,570
|
| InvestmentCompanyPortfolioTurnover |
|
3.00%
|
| Additional Fund Statistics [Text Block] |
|
Key Fund Statistics as of March 31, 2025 | Total Net Assets | Number of Holdings | Total Advisory Fees Paid | Portfolio Turnover Rate |
|---|
| $4,862,790 | 2 | $4,570 | 3% |
|---|
|
| Holdings [Text Block] |
|
Asset WeightingsFootnote Reference*Value | Value |
|---|
Exchange - Traded Fund | 99.1% |
| Footnote | Description | Footnote* | Percentages are calculated based on total net assets. |
|
| Largest Holdings [Text Block] |
|
Holding Name | | | Percentage of
Total Net Assets |
|---|
KraneShares MSCI All China Index ETFFootnote Reference** | | | 60.0% | KraneShares MSCI Emerging Markets ex China Index ETFFootnote Reference** | | | 39.1% |
| Footnote | Description | Footnote** | Affiliated Investment |
|
| Material Fund Change [Text Block] |
|
This is a summary of certain changes to the Fund since April 1, 2024. For more complete information, you may review the Fund’s prospectus, which is available at https://kraneshares.com/kem/#documents or upon request at 1-855-857-2638. Upon the recommendation of Krane Funds Advisors, LLC, the adviser to the Fund, the Board of Trustees of KraneShares Trust has approved the liquidation and termination of the Fund. Accordingly the Fund ceased operations and liquidated on May 27, 2025. |
| Updated Prospectus Web Address |
|
https://kraneshares.com/kem/
|
| C000244621 |
|
|
| Shareholder Report [Line Items] |
|
|
| Fund Name |
|
KraneShares Global Luxury Index ETF
|
| Class Name |
|
KraneShares Global Luxury Index ETF
|
| Trading Symbol |
|
KLXY
|
| Security Exchange Name |
|
NYSEArca
|
| Annual or Semi-Annual Statement [Text Block] |
|
This annual shareholder report contains important information about the KraneShares Global Luxury Index ETF (the "Fund") for the period from April 1, 2024 to March 31, 2025.
|
| Shareholder Report Annual or Semi-Annual |
|
Annual Shareholder Report
|
| Additional Information [Text Block] |
|
You can find additional information about the Fund at https://kraneshares.com/klxy/. You can also request this information by contacting us at 1-855-857-2638.
|
| Additional Information Phone Number |
|
1-855-857-2638
|
| Additional Information Website |
|
https://kraneshares.com/klxy/
|
| Expenses [Text Block] |
|
What were the Fund costs for the last year?(based on a hypothetical $10,000 investment) Fund Name | Costs of a $10,000 investment | Costs paid as a percentage of a $10,000 investment |
|---|
KraneShares Global Luxury Index ETF | $64 | 0.69% |
|---|
|
| Expenses Paid, Amount |
|
$ 64
|
| Expense Ratio, Percent |
|
0.69%
|
| Factors Affecting Performance [Text Block] |
|
(a) Solactive Global Luxury Select Index (b) The Fund is in the Morningstar U.S. ETF Consumer Cyclical Category. The Fund seeks to provide investment results that, before fees and expenses, correspond generally to the price and yield performance of a specific equity securities index. The Fund's current index is the Solactive Global Luxury Select Index (the "Underlying Index"). The Underlying Index is a modified, free float-adjusted market capitalization-weighted index designed to measure the equity performance of companies in developed markets from global luxury-related sectors. The Underlying Index includes companies classified by the FactSet Revere Business Industry Classification system ("RBICS") as being in the travel & leisure, premium ware and apparel, luxury goods, and premium consumer goods industries that include certain luxury-related business descriptions. Solactive AG ("Index Provider") defines developed countries as the following countries: Australia, Austria, Belgium, Canada, Denmark, Finland, France, Germany, Hong Kong, Ireland, Israel, Italy, Japan, Netherlands, New Zealand, Norway, Poland, Portugal, Singapore, Spain, Sweden, Switzerland, United Kingdom, or United States. The KraneShares Global Luxury Index ETF considerably underperformed global markets during the Period. This underperformance can be attributed to lackluster earnings from top luxury names and consumption lulls in key markets like China, the United States, and Europe. Additionally, the potential for increased tariffs and protectionism in the United States is expected to weigh on the sector as macroeconomic uncertainty leads to a cautious consumer. Nonetheless, luxury companies continue to breach new markets with rising incomes in Southeast Asia, India, the Middle East, and South America. The deviation between the Fund's performance and that of the Underlying Index can be mainly attributed to management fees paid by the Fund. |
| Performance Past Does Not Indicate Future [Text] |
|
Past performance is not indicative of future performance.
|
| Line Graph [Table Text Block] |
|
| KraneShares Global Luxury Index ETF - $9269 | MSCI ACWI Index (Net) (USD) - $12450 | Solactive Global Luxury Select Index (NR) (USD)^ - $9347 |
|---|
Sep/23 | $10000 | $10000 | $10000 |
|---|
Mar/24 | $10708 | $11619 | $10782 |
|---|
Mar/25 | $9269 | $12450 | $9347 |
|---|
|
| Average Annual Return [Table Text Block] |
|
Fund/Index Name | 1 Year |
Since
Inception |
|---|
KraneShares Global Luxury Index ETF | -13.44% | -4.73% |
|---|
MSCI ACWI Index (Net) (USD) | 7.15% | 15.01% |
|---|
Solactive Global Luxury Select Index (NR) (USD)^ | -13.30% | -4.22% |
|---|
|
| No Deduction of Taxes [Text Block] |
|
The table and graph presented above do not reflect the deduction of taxes a shareholder would pay on Fund distributions or the redemption of Fund shares.
|
| AssetsNet |
$ 2,870,891
|
$ 2,870,891
|
| Holdings Count | Holding |
28
|
28
|
| Advisory Fees Paid, Amount |
|
$ 21,332
|
| InvestmentCompanyPortfolioTurnover |
|
55.00%
|
| Additional Fund Statistics [Text Block] |
|
Key Fund Statistics as of March 31, 2025 | Total Net Assets | Number of Holdings | Total Advisory Fees Paid | Portfolio Turnover Rate |
|---|
| $2,870,891 | 28 | $21,332 | 55% |
|---|
|
| Holdings [Text Block] |
|
Country WeightingsFootnote Reference*Value | Value |
|---|
China | 0.7% | Germany | 0.8% | United Kingdom | 1.0% | Denmark | 4.6% | Japan | 7.6% | Switzerland | 11.3% | Italy | 11.5% | United States | 23.8% | France | 37.0% |
| Footnote | Description | Footnote* | Percentages are calculated based on total net assets. |
|
| Largest Holdings [Text Block] |
|
Holding Name | | | Percentage of
Total Net Assets |
|---|
Cie Financiere Richemont, Cl A | | | 9.5% | LVMH Moet Hennessy Louis Vuitton | | | 9.3% | L'Oreal | | | 9.0% | Hermes International | | | 8.0% | EssilorLuxottica | | | 7.0% | Estee Lauder, Cl A | | | 4.6% | Pandora | | | 4.6% | Moncler | | | 4.6% | Tapestry | | | 4.5% | Kao | | | 4.5% |
|
| Material Fund Change [Text Block] |
|
There were no material changes during the reporting period. |
| Updated Prospectus Web Address |
|
https://kraneshares.com/klxy/
|
| C000243337 |
|
|
| Shareholder Report [Line Items] |
|
|
| Trading Symbol |
|
KSEA
|
| Security Exchange Name |
|
NYSEArca
|
| Annual or Semi-Annual Statement [Text Block] |
|
This annual shareholder report contains important information about the KraneShares Rockefeller℠ Ocean Engagement ETF (the "Fund") for the period from April 1, 2024 to March 31, 2025.
|
| Shareholder Report Annual or Semi-Annual |
|
Annual Shareholder Report
|
| Additional Information [Text Block] |
|
You can find additional information about the Fund at https://kraneshares.com/ksea/. You can also request this information by contacting us at 1-855-857-2638.
|
| Additional Information Phone Number |
|
1-855-857-2638
|
| Additional Information Website |
|
https://kraneshares.com/ksea/
|
| Expenses [Text Block] |
|
What were the Fund costs for the last year?(based on a hypothetical $10,000 investment) Fund Name | Costs of a $10,000 investment | Costs paid as a percentage of a $10,000 investment |
|---|
KraneShares Rockefeller℠ Ocean Engagement ETF | $86 | 0.86% |
|---|
|
| Expenses Paid, Amount |
|
$ 86
|
| Expense Ratio, Percent |
|
0.86%
|
| Factors Affecting Performance [Text Block] |
|
^ Fund is actively managed and does not track an Underlying Index. (1) The Fund is in the Morningstar U.S. ETF Miscellaneous Sector Category. The KraneShares RockefellerSM Ocean Engagement ETF seeks to provide exposure to the rise of the "blue economy" by allocating to public companies whose business activities are materially based in and actively beneficial for the ocean. The Fund's sub-advisor, Rockefeller Asset Management LLC, proactively engages with companies held by the Fund on ocean-related matters in pursuit of healthier oceans and outperformance versus its benchmark, the MSCI All Country World Index. Holdings include companies from diverse sectors such as aquaculture, commercial fishing, waste management, renewable energy, and logistics, among others. The Fund underperformed global markets during the Period. This underperformance was largely attributable to the energy and healthcare sectors, the worst-performing sectors within the Fund. Industrial and consumer discretionary names did help boost the Fund's overall performance. The waste management space, to which the Fund maintained a meaningful exposure during the Period, experienced solid returns, driven by a focus on technology and automation and multiple mergers and acquisitions to help improve efficiency. |
| Performance Past Does Not Indicate Future [Text] |
|
Past performance is not indicative of future performance.
|
| Line Graph [Table Text Block] |
|
| KraneShares Rockefeller℠ Ocean Engagement ETF - $10786 | MSCI ACWI Index (Net) (USD) - $12401 |
|---|
Sep/23 | $10000 | $10000 |
|---|
Mar/24 | $10739 | $11574 |
|---|
Mar/25 | $10786 | $12401 |
|---|
|
| Average Annual Return [Table Text Block] |
|
Fund/Index Name | 1 Year |
Since
Inception |
|---|
KraneShares Rockefeller℠ Ocean Engagement ETF | 0.44% | 4.99% |
|---|
MSCI ACWI Index (Net) (USD) | 7.15% | 14.86% |
|---|
|
| No Deduction of Taxes [Text Block] |
|
The table and graph presented above do not reflect the deduction of taxes a shareholder would pay on Fund distributions or the redemption of Fund shares.
|
| AssetsNet |
$ 2,646,138
|
$ 2,646,138
|
| Holdings Count | Holding |
41
|
41
|
| Advisory Fees Paid, Amount |
|
$ 23,111
|
| InvestmentCompanyPortfolioTurnover |
|
46.00%
|
| Additional Fund Statistics [Text Block] |
|
Key Fund Statistics as of March 31, 2025 | Total Net Assets | Number of Holdings | Total Advisory Fees Paid | Portfolio Turnover Rate |
|---|
| $2,646,138 | 41 | $23,111 | 46% |
|---|
|
| Holdings [Text Block] |
|
Sector WeightingsFootnote Reference*Footnote Reference^Value | Value |
|---|
Health Care | 4.4% | Utilities | 6.1% | Information Technology | 8.7% | Materials | 11.2% | Consumer Discretionary | 11.2% | Consumer Staples | 17.9% | Industrials | 38.5% |
| Footnote | Description | Footnote* | Percentages are calculated based on total net assets. | Footnote^ | This chart does not include cash, and therefore, the investments as a percentage to total net assets (which includes cash) will not add up to 100%. |
|
| Largest Holdings [Text Block] |
|
Holding Name | | | Percentage of
Total Net Assets |
|---|
Waste Management | | | 4.2% | Crown Holdings | | | 3.9% | Teledyne Technologies | | | 3.7% | Loblaw | | | 3.7% | Republic Services, Cl A | | | 3.5% | Trimble | | | 3.5% | SSE PLC | | | 3.5% | Amazon.com | | | 3.2% | Bureau Veritas | | | 3.2% | Jeronimo Martins | | | 3.2% |
|
| Material Fund Change [Text Block] |
|
This is a summary of certain changes to the Fund since April 1, 2024. For more complete information, you may review the Fund’s prospectus, which is available at https://kraneshares.com/ksea/#documents or upon request at 1-855-857-2638. Upon the recommendation of Krane Funds Advisors, LLC, the adviser to the Fund, the Board of Trustees of KraneShares Trust has approved the liquidation and termination of the Fund. Accordingly the Fund ceased operations and liquidated on May 27, 2025. |
| Updated Prospectus Web Address |
|
https://kraneshares.com/ksea/
|
| C000249202 |
|
|
| Shareholder Report [Line Items] |
|
|
| Fund Name |
|
KraneShares Hedgeye Hedged Equity Index ETF
|
| Class Name |
|
KraneShares Hedgeye Hedged Equity Index ETF
|
| Trading Symbol |
|
KSPY
|
| Security Exchange Name |
|
NYSEArca
|
| Annual or Semi-Annual Statement [Text Block] |
|
This annual shareholder report contains important information about the KraneShares Hedgeye Hedged Equity Index ETF (the "Fund") for the period from July 15, 2024 (commencement of operations) to March 31, 2025.
|
| Shareholder Report Annual or Semi-Annual |
|
Annual Shareholder Report
|
| Additional Information [Text Block] |
|
You can find additional information about the Fund at https://kraneshares.com/kspy/. You can also request this information by contacting us at 1-855-857-2638.
|
| Additional Information Phone Number |
|
1-855-857-2638
|
| Additional Information Website |
|
https://kraneshares.com/kspy/
|
| Expenses [Text Block] |
|
What were the Fund costs for the period?(based on a hypothetical $10,000 investment) Fund Name | Costs of a $10,000 investmentFootnote Reference* | Costs paid as a percentage of a $10,000 investment |
|---|
KraneShares Hedgeye Hedged Equity Index ETF | $50 | 0.69% |
|---|
| Footnote | Description | Footnote* | Costs shown not annualized. If the Fund had been open for the full fiscal year, costs shown would have been higher for the period ended. |
|
| Expenses Paid, Amount |
|
$ 50
|
| Expense Ratio, Percent |
|
0.69%
|
| Factors Affecting Performance [Text Block] |
|
*Return since Fund inception on July 15, 2024 (less than one year) (a) Hedgeye Hedged Equity Index (b) The Fund is in the Morningstar U.S. ETF Equity Hedged Category. The KraneShares Hedgeye Hedged Equity Index ETF seeks to provide investment results that, before fees and expenses, correspond generally to the price and yield performance of the Hedgeye Hedged Equity Index (the "Underlying Index"). The Underlying Index is designed to track the performance of a portfolio of large-cap securities subject to downside hedging and seeking to exhibit less volatility than a portfolio of large-cap securities alone. The Underlying Index models an investment in the S&P 500 Index, the purchase and sale of put options on the S&P 500 Index and Flexible Exchange® Options (“FLEX Options”) on an ETF that tracks the S&P 500 Index or a similar large-cap securities index, and the sale of call options on the S&P 500 Index. Fund assets not invested in options are invested in an ETF that seeks to track the S&P 500 Index. The Fund underperformed the U.S. equity market, as measured by the S&P 500 Index, for most of the Period since its inception. However, the Fund began outperforming the U.S. equity market when U.S. equities entered a downtrend in mid-February 2025. At this point, widespread macroeconomic uncertainty spread among investors regarding tariffs, inflation, and the Federal Reserve's rate cut trajectory due to the Fund's use of a downside hedge against broader market declines. The deviation between the Fund's performance and that of the Underlying Index can be mainly attributed to management fees paid by the Fund. |
| Performance Past Does Not Indicate Future [Text] |
|
Past performance is not indicative of future performance.
|
| Line Graph [Table Text Block] |
|
| KraneShares Hedgeye Hedged Equity Index ETF - $10291 | S&P 500 Index (TR) - $10060 | Hedgeye Hedged Equity Index (PR) (USD) - $10390 |
|---|
Jul/15/24 | $10000 | $10000 | $10000 |
|---|
Jul/24 | $10004 | $9810 | $10010 |
|---|
Aug/24 | $9940 | $10048 | $10001 |
|---|
Sep/24 | $10064 | $10262 | $10102 |
|---|
Oct/24 | $10092 | $10169 | $10114 |
|---|
Nov/24 | $10456 | $10766 | $10514 |
|---|
Dec/24 | $10368 | $10509 | $10446 |
|---|
Jan/25 | $10599 | $10802 | $10692 |
|---|
Feb/25 | $10579 | $10661 | $10673 |
|---|
Mar/25 | $10291 | $10060 | $10390 |
|---|
|
| Average Annual Return [Table Text Block] |
|
Fund/Index Name | Cumulative
Since
Inception |
|---|
KraneShares Hedgeye Hedged Equity Index ETF | 2.91% |
|---|
S&P 500 Index (TR) | 0.60% |
|---|
Hedgeye Hedged Equity Index (PR) (USD) | 3.90% |
|---|
|
| No Deduction of Taxes [Text Block] |
|
The table and graph presented above do not reflect the deduction of taxes a shareholder would pay on Fund distributions or the redemption of Fund shares.
|
| AssetsNet |
$ 13,967,769
|
$ 13,967,769
|
| Holdings Count | Holding |
4
|
4
|
| Advisory Fees Paid, Amount |
|
$ 40,811
|
| InvestmentCompanyPortfolioTurnover |
|
2.00%
|
| Additional Fund Statistics [Text Block] |
|
Key Fund Statistics as of March 31, 2025 | Total Net Assets | Number of Holdings | Total Advisory Fees Paid | Portfolio Turnover Rate |
|---|
| $13,967,769 | 4 | $40,811 | 2% |
|---|
|
| Holdings [Text Block] |
|
S&P 500 Top ConstituentsFootnote Reference*Value | Value |
|---|
UNITEDHEALTH GROUP INC | 1.0% | EXXON MOBIL CORP | 1.1% | VISA INC-CLASS A SHARES | 1.3% | ELI LILLY & CO | 1.4% | JPMORGAN CHASE & CO | 1.4% | TESLA INC | 1.5% | ALPHABET INC-CL C | 1.6% | BROADCOM INC | 1.7% | ALPHABET INC-CL A | 1.9% | BERKSHIRE HATHAWAY INC-CL B | 2.1% | META PLATFORMS INC-CLASS A | 2.7% | AMAZON.COM INC | 3.8% | NVIDIA CORP | 5.6% | MICROSOFT CORP | 5.9% | APPLE INC | 7.0% |
| Footnote | Description | Footnote* | Percentages are calculated based on total net assets. |
|
| Largest Holdings [Text Block] |
|
Holding Name | | | Percentage of
Total Net Assets |
|---|
SPDR S&P 500 ETF Trust | | | 96.1% | Purchased Option - S&P 500 Index, $5,780.00, 04/17/25Footnote Reference(1) | | | 3.3% | Written Option - SPDR S&P 500 Index, $576.67, 04/17/25Footnote Reference(1) | | | -0.4% | Written Option - S&P 500 Index, $5,520.00, 04/17/25Footnote Reference(1) | | | -1.1% |
| Footnote | Description | Footnote(1) | At market value. |
|
| Material Fund Change [Text Block] |
|
There were no material changes during the reporting period. |
| Updated Prospectus Web Address |
|
https://kraneshares.com/kspy/
|
| C000250789 |
|
|
| Shareholder Report [Line Items] |
|
|
| Fund Name |
|
KraneShares Artificial Intelligence and Technology ETF
|
| Class Name |
|
KraneShares Artificial Intelligence and Technology ETF
|
| Trading Symbol |
|
AGIX
|
| Security Exchange Name |
|
NASDAQ
|
| Annual or Semi-Annual Statement [Text Block] |
|
This annual shareholder report contains important information about the KraneShares Artificial Intelligence and Technology ETF (the "Fund") for the period from July 17, 2024 (commencement of operations) to March 31, 2025.
|
| Shareholder Report Annual or Semi-Annual |
|
Annual Shareholder Report
|
| Additional Information [Text Block] |
|
You can find additional information about the Fund at https://kraneshares.com/agix/. You can also request this information by contacting us at 1-855-857-2638.
|
| Additional Information Phone Number |
|
1-855-857-2638
|
| Additional Information Website |
|
https://kraneshares.com/agix/
|
| Expenses [Text Block] |
|
What were the Fund costs for the period?(based on a hypothetical $10,000 investment) Fund Name | Costs of a $10,000 investmentFootnote Reference* | Costs paid as a percentage of a $10,000 investment |
|---|
KraneShares Artificial Intelligence and Technology ETF | $70 | 0.99% |
|---|
| Footnote | Description | Footnote* | Costs shown not annualized. If the Fund had been open for the full fiscal year, costs shown would have been higher for the period ended. |
|
| Expenses Paid, Amount |
|
$ 70
|
| Expense Ratio, Percent |
|
0.99%
|
| Factors Affecting Performance [Text Block] |
|
*Return since Fund inception on July 17, 2024 (less than one year) ^ Fund is actively managed and does not track an Underlying Index (1) The Fund is in the Morningstar U.S. ETF Technology Category. Under normal circumstances, the KraneShares Artificial Intelligence & Technology ETF invests at least 80% of its net assets (plus borrowings for investment purposes) in securities of artificial intelligence (AI) and technology companies and other instruments that have economic characteristics similar to such securities. The Fund considers a company to be an "AI and Technology" company if it is classified in the Technology economy within the FactSet Revere Business Industry Classification system (RBICS), which requires a company to generate at least 50% of its revenue from within the Technology economy, and has an AI Exposure Score greater than zero. An "AI and Technology" company will generally operate in the following industries, as categorized by RBICS: computer peripherals, data processing services, information technology services, internet retail, internet software/services, packaged software, semiconductors, or telecommunications equipment. An AI Exposure Score is a proprietary score used by the Underlying Index (as defined below) that attempts to quantify the exposure of a company with regard to AI. It is measured in a range from 0 (no exposure) to 5 (highest exposure) and is based on the company's public business descriptions, public filings, press releases, and financial disclosures that directly indicate involvement in AI-related business or the incorporation of AI technologies into their key operations, offerings and research and development activities. U.S. AI equities underperformed global equities, as measured by the MSCI ACWI, during the Period. Uncertainty surrounding tariffs, the U.S. Federal Reserve's rate cut trajectory, and inflation weighed on U.S.-listed equities. The Fund's holdings in AI stocks were disproportionately affected due to their elevated valuations at launch. The Fund acquired a position in the privately-held company Anthropic during the Period. |
| Performance Past Does Not Indicate Future [Text] |
|
Past performance is not indicative of future performance.
|
| Line Graph [Table Text Block] |
|
| KraneShares Artificial Intelligence and Technology ETF - $9876 | S&P 500 Index (TR) - $10138 | Solactive Etna Artificial General Intelligence Index (NR) (USD) - $9724 |
|---|
Jul/17/24 | $10000 | $10000 | $10000 |
|---|
Jul/24 | $9748 | $9885 | $9693 |
|---|
Aug/24 | $9832 | $10125 | $9764 |
|---|
Sep/24 | $10164 | $10341 | $10090 |
|---|
Oct/24 | $10284 | $10247 | $10226 |
|---|
Nov/24 | $11272 | $10849 | $11211 |
|---|
Dec/24 | $11389 | $10590 | $11328 |
|---|
Jan/25 | $12056 | $10885 | $12000 |
|---|
Feb/25 | $11285 | $10743 | $11172 |
|---|
Mar/25 | $9876 | $10138 | $9724 |
|---|
|
| Average Annual Return [Table Text Block] |
|
Fund/Index Name | Cumulative
Since
Inception |
|---|
KraneShares Artificial Intelligence and Technology ETF | -1.24% |
|---|
S&P 500 Index (TR) | 1.38% |
|---|
Solactive Etna Artificial General Intelligence Index (NR) (USD) | -2.76% |
|---|
|
| No Deduction of Taxes [Text Block] |
|
The table and graph presented above do not reflect the deduction of taxes a shareholder would pay on Fund distributions or the redemption of Fund shares.
|
| AssetsNet |
$ 22,140,948
|
$ 22,140,948
|
| Holdings Count | Holding |
45
|
45
|
| Advisory Fees Paid, Amount |
|
$ 72,002
|
| InvestmentCompanyPortfolioTurnover |
|
49.00%
|
| Additional Fund Statistics [Text Block] |
|
Key Fund Statistics as of March 31, 2025 | Total Net Assets | Number of Holdings | Total Advisory Fees Paid | Portfolio Turnover Rate |
|---|
| $22,140,948 | 45 | $72,002 | 49% |
|---|
|
| Holdings [Text Block] |
|
Sector WeightingsFootnote Reference*Value | Value |
|---|
Industrials | 0.9% | Health Care | 1.5% | Consumer Discretionary | 10.1% | Communication Services | 13.2% | Information Technology | 74.1% |
| Footnote | Description | Footnote* | Percentages are calculated based on total net assets. |
|
| Largest Holdings [Text Block] |
|
Holding Name | | | Percentage of
Total Net Assets |
|---|
Meta Platforms, Cl A | | | 8.0% | Microsoft | | | 6.0% | Amazon.com | | | 5.2% | Anthropic | | | 4.5% | Apple | | | 4.1% | NVIDIA | | | 4.0% | Alphabet, Cl A | | | 3.5% | Salesforce | | | 3.5% | ServiceNow | | | 3.3% | SAP | | | 3.2% |
|
| Material Fund Change [Text Block] |
|
There were no material changes during the reporting period. |
| Updated Prospectus Web Address |
|
https://kraneshares.com/agix/
|
| C000251229 |
|
|
| Shareholder Report [Line Items] |
|
|
| Fund Name |
|
KraneShares Sustainable Ultra Short Duration Index ETF
|
| Class Name |
|
KraneShares Sustainable Ultra Short Duration Index ETF
|
| Trading Symbol |
|
KCSH
|
| Security Exchange Name |
|
NYSEArca
|
| Annual or Semi-Annual Statement [Text Block] |
|
This annual shareholder report contains important information about the KraneShares Sustainable Ultra Short Duration Index ETF (the "Fund") for the period from July 25, 2024 (commencement of operations) to March 31, 2025.
|
| Shareholder Report Annual or Semi-Annual |
|
Annual Shareholder Report
|
| Additional Information [Text Block] |
|
You can find additional information about the Fund at https://kraneshares.com/kcsh/. You can also request this information by contacting us at 1-855-857-2638.
|
| Additional Information Phone Number |
|
1-855-857-2638
|
| Additional Information Website |
|
https://kraneshares.com/kcsh/
|
| Expenses [Text Block] |
|
What were the Fund costs for the period?(based on a hypothetical $10,000 investment) Fund Name | Costs of a $10,000 investmentFootnote Reference* | Costs paid as a percentage of a $10,000 investment |
|---|
KraneShares Sustainable Ultra Short Duration Index ETF | $14 | 0.20% |
|---|
| Footnote | Description | Footnote* | Costs shown not annualized. If the Fund had been open for the full fiscal year, costs shown would have been higher for the period ended. |
|
| Expenses Paid, Amount |
|
$ 14
|
| Expense Ratio, Percent |
|
0.20%
|
| Factors Affecting Performance [Text Block] |
|
*Return since Fund inception on July 25, 2024 (less than one year) (a) Solactive ISS Sustainable Select 0-1 Year USD Corporate IG Index (b) The Fund is in the Morningstar U.S. ETF Ultrashort Bond Category The KraneShares Sustainable Ultra Short Duration Index ETF seeks to provide investment results that, before fees and expenses, correspond generally to the price and yield performance of the Solactive ISS Sustainable Select 0-1 Year USD Corporate Investment Grade (“IG”) Index (the "Underlying Index"). The Underlying Index is designed to measure the performance of U.S. dollar denominated investment grade corporate debt securities with a maturity of up to one year that are compatible with the principal objective of the Paris Agreement, which seeks to limit temperature increases in this century to well below 2 degrees Celsius, and preferably to 1.5 degrees Celsius, above pre-industrial levels (i.e., carbon reduction target levels). Volatility in global markets led to a shift toward the relative safety of cash-like investments, contributing to the Fund's positive performance for the Period. Furthermore, potential tariffs increased uncertainty around future inflation and interest rate trends, leading to increased demand for ultrashort bonds, which carry less interest rate risk than longer-term fixed income instruments. The deviation between the Fund's performance and that of the Underlying Index can be mainly attributed to management fees paid by the Fund. |
| Performance Past Does Not Indicate Future [Text] |
|
Past performance is not indicative of future performance.
|
| Line Graph [Table Text Block] |
|
| KraneShares Sustainable Ultra Short Duration Index ETF - $10343 | Bloomberg U.S. Aggregate Bond Index (TR) (USD) - $10366 | Solactive ISS Sustainable Select 0-1 Year USD Corporate IG Index (TR) (USD) - $10351 |
|---|
Jul/25/24 | $10000 | $10000 | $10000 |
|---|
Jul/24 | $10012 | $10121 | $10012 |
|---|
Aug/24 | $10065 | $10266 | $10065 |
|---|
Sep/24 | $10112 | $10404 | $10116 |
|---|
Oct/24 | $10148 | $10146 | $10153 |
|---|
Nov/24 | $10185 | $10253 | $10192 |
|---|
Dec/24 | $10226 | $10085 | $10235 |
|---|
Jan/25 | $10272 | $10139 | $10277 |
|---|
Feb/25 | $10304 | $10362 | $10311 |
|---|
Mar/25 | $10343 | $10366 | $10351 |
|---|
|
| Average Annual Return [Table Text Block] |
|
Fund/Index Name | Cumulative
Since
Inception |
|---|
KraneShares Sustainable Ultra Short Duration Index ETF | 3.43% |
|---|
Bloomberg U.S. Aggregate Bond Index (TR) (USD) | 3.66% |
|---|
Solactive ISS Sustainable Select 0-1 Year USD Corporate IG Index (TR) (USD) | 3.51% |
|---|
|
| No Deduction of Taxes [Text Block] |
|
The table and graph presented above do not reflect the deduction of taxes a shareholder would pay on Fund distributions or the redemption of Fund shares.
|
| AssetsNet |
$ 210,406,563
|
$ 210,406,563
|
| Holdings Count | Holding |
177
|
177
|
| Advisory Fees Paid, Amount |
|
$ 295,041
|
| InvestmentCompanyPortfolioTurnover |
|
0.00%
|
| Additional Fund Statistics [Text Block] |
|
Key Fund Statistics as of March 31, 2025 | Total Net Assets | Number of Holdings | Total Advisory Fees Paid | Portfolio Turnover Rate |
|---|
| $210,406,563 | 177 | $295,041 | 0% |
|---|
|
| Holdings [Text Block] |
|
Maturity WeightingsFootnote Reference*Footnote Reference^Value | Value |
|---|
9-12 Months | 13.8% | 6-9 Months | 11.7% | 3-6 Months | 21.0% | 0-3 Months | 47.6% |
| Footnote | Description | Footnote* | Percentages are calculated based on total net assets. | Footnote^ | This chart does not include cash, and therefore, the investments as a percentage to total net assets (which includes cash) will not add up to 100%. |
|
| Largest Holdings [Text Block] |
|
Holding Name | Coupon Rate | Maturity Date | Percentage of Total
Net Assets |
|---|
Microsoft | 3.125%
| 11/03/25
| 1.4% | Manufacturers & Traders Trust | 4.650%
| 01/27/26
| 1.3% | Truist Financial | 3.700%
| 06/05/25
| 1.0% | Toronto-Dominion Bank | 1.150%
| 06/12/25
| 1.0% | American Express | 4.900%
| 02/13/26
| 1.0% | Bank of Nova Scotia | 4.750%
| 02/02/26
| 1.0% | Australia & New Zealand Banking Group NY | 5.375%
| 07/03/25
| 1.0% | Bank of Nova Scotia | 5.450%
| 06/12/25
| 1.0% | Royal Bank of Canada | 4.950%
| 04/25/25
| 1.0% | United Parcel Service | 3.900%
| 04/01/25
| 1.0% |
|
| Material Fund Change [Text Block] |
|
There were no material changes during the reporting period. |
| Updated Prospectus Web Address |
|
https://kraneshares.com/kcsh/
|
| C000249978 |
|
|
| Shareholder Report [Line Items] |
|
|
| Fund Name |
|
KraneShares China Alpha Index ETF
|
| Class Name |
|
KraneShares China Alpha Index ETF
|
| Trading Symbol |
|
KCAI
|
| Security Exchange Name |
|
NYSEArca
|
| Annual or Semi-Annual Statement [Text Block] |
|
This annual shareholder report contains important information about the KraneShares China Alpha Index ETF (the "Fund") for the period from August 27, 2024 (commencement of operations) to March 31, 2025.
|
| Shareholder Report Annual or Semi-Annual |
|
Annual Shareholder Report
|
| Additional Information [Text Block] |
|
You can find additional information about the Fund at https://kraneshares.com/kcai/. You can also request this information by contacting us at 1-855-857-2638.
|
| Additional Information Phone Number |
|
1-855-857-2638
|
| Additional Information Website |
|
https://kraneshares.com/kcai/
|
| Expenses [Text Block] |
|
What were the Fund costs for the period?(based on a hypothetical $10,000 investment) Fund Name | Costs of a $10,000 investmentFootnote Reference* | Costs paid as a percentage of a $10,000 investment |
|---|
KraneShares China Alpha Index ETF | $50 | 0.79% |
|---|
| Footnote | Description | Footnote* | Costs shown not annualized. If the Fund had been open for the full fiscal year, costs shown would have been higher for the period ended. |
|
| Expenses Paid, Amount |
|
$ 50
|
| Expense Ratio, Percent |
|
0.79%
|
| Factors Affecting Performance [Text Block] |
|
*Return since Fund inception on August 27, 2024 (less than one year) (a) Qi China Alpha Index (b) The Fund is in the Morningstar U.S. ETF China Region Category. The KraneShares Qi China Alpha Index ETF seeks to provide investment results that, before fees and expenses, correspond generally to the price and yield performance of the Qi China Alpha Index (the "Underlying Index"). The Underlying Index seeks to provide a total return that exceeds the CSI 300 Index (the "Benchmark Index") using an automated algorithmic machine learning investment process ("AI Process") developed by Quant Insight Ltd. ("Index Provider"). The CSI 300 Index is a free-float capitalization-weighted index that tracks the performance of China A-Shares issued by the 300 largest companies by market capitalization and liquidity traded on the Shanghai Stock Exchange and Shenzhen Stock Exchange. The Fund underperformed China's broad equity market, as represented by the MSCI China All Shares Index, during the Period, due to its investing only in China’s A-shares market during a period when China’s offshore issuers recorded higher performance. The Fund’s overweight to Financials and Industrials and underweight to both Information Technology and Consumer Discretionary led it to underperform the Benchmark Index. |
| Performance Past Does Not Indicate Future [Text] |
|
Past performance is not indicative of future performance.
|
| Line Graph [Table Text Block] |
|
| KraneShares China Alpha Index ETF - $11102 | MSCI China All Shares Index (Net) (USD) - $12627 | Qi China Alpha Index - $11178 |
|---|
Aug/27/24 | $10000 | $10000 | $10000 |
|---|
Aug/24 | $10108 | $10086 | $10116 |
|---|
Sep/24 | $11756 | $12426 | $11808 |
|---|
Oct/24 | $10988 | $11770 | $11046 |
|---|
Nov/24 | $10784 | $11390 | $10847 |
|---|
Dec/24 | $11057 | $11561 | $11128 |
|---|
Jan/25 | $11098 | $11525 | $11179 |
|---|
Feb/25 | $10938 | $12454 | $11013 |
|---|
Mar/25 | $11102 | $12627 | $11178 |
|---|
|
| Average Annual Return [Table Text Block] |
|
Fund/Index Name | Cumulative
Since
Inception |
|---|
KraneShares China Alpha Index ETF | 11.02% |
|---|
MSCI China All Shares Index (Net) (USD) | 26.27% |
|---|
Qi China Alpha Index | 11.78% |
|---|
|
| No Deduction of Taxes [Text Block] |
|
The table and graph presented above do not reflect the deduction of taxes a shareholder would pay on Fund distributions or the redemption of Fund shares.
|
| AssetsNet |
$ 10,858,680
|
$ 10,858,680
|
| Holdings Count | Holding |
35
|
35
|
| Advisory Fees Paid, Amount |
|
$ 44,215
|
| InvestmentCompanyPortfolioTurnover |
|
149.00%
|
| Additional Fund Statistics [Text Block] |
|
Key Fund Statistics as of March 31, 2025 | Total Net Assets | Number of Holdings | Total Advisory Fees Paid | Portfolio Turnover Rate |
|---|
| $10,858,680 | 35 | $44,215 | 149% |
|---|
|
| Holdings [Text Block] |
|
Sector WeightingsFootnote Reference*Value | Value |
|---|
Consumer Discretionary | 8.7% | Information Technology | 14.5% | Materials | 15.7% | Industrials | 17.2% | Financials | 43.9% |
| Footnote | Description | Footnote* | Percentages are calculated based on total net assets. |
|
| Largest Holdings [Text Block] |
|
Holding Name | | | Percentage of
Total Net Assets |
|---|
Zijin Mining Group, Cl A | | | 3.6% | COSCO SHIPPING Holdings, Cl A | | | 3.3% | Eoptolink Technology, Cl A | | | 3.3% | Huaxia Bank, Cl A | | | 3.3% | Satellite Chemical, Cl A | | | 3.3% | Bank of Shanghai, Cl A | | | 3.2% | China Construction Bank, Cl A | | | 3.2% | China Galaxy Securities, Cl A | | | 3.2% | Fuyao Glass Industry Group, Cl A | | | 3.2% | Shanghai International Port Group, Cl A | | | 3.2% |
|
| Material Fund Change [Text Block] |
|
There were no material changes during the reporting period. |
| Updated Prospectus Web Address |
|
https://kraneshares.com/kcai/
|
| C000254137 |
|
|
| Shareholder Report [Line Items] |
|
|
| Fund Name |
KraneShares Man Buyout Beta Index ETF
|
|
| Class Name |
KraneShares Man Buyout Beta Index ETF
|
|
| Trading Symbol |
BUYO
|
|
| Security Exchange Name |
NYSEArca
|
|
| Annual or Semi-Annual Statement [Text Block] |
This annual shareholder report contains important information about the KraneShares Man Buyout Beta Index ETF (the "Fund") for the period from October 7, 2024 (commencement of operations) to March 31, 2025.
|
|
| Shareholder Report Annual or Semi-Annual |
Annual Shareholder Report
|
|
| Additional Information [Text Block] |
You can find additional information about the Fund at https://kraneshares.com/buyo/. You can also request this information by contacting us at 1-855-857-2638.
|
|
| Additional Information Phone Number |
1-855-857-2638
|
|
| Additional Information Website |
https://kraneshares.com/buyo/
|
|
| Expenses [Text Block] |
What were the Fund costs for the period?(based on a hypothetical $10,000 investment) Fund Name | Costs of a $10,000 investmentFootnote Reference* | Costs paid as a percentage of a $10,000 investment |
|---|
KraneShares Man Buyout Beta Index ETF | $41 | 0.89% |
|---|
| Footnote | Description | Footnote* | Costs shown not annualized. If the Fund had been open for the full fiscal year, costs shown would have been higher for the period ended. |
|
|
| Expenses Paid, Amount |
$ 41
|
|
| Expense Ratio, Percent |
0.89%
|
|
| Factors Affecting Performance [Text Block] |
*Return since Fund inception on October 7, 2024 (less than one year) (a) Man Buyout Beta Index (b) The Fund is in the Morningstar U.S. ETF Mid-Cap Blend Category The KraneShares Man Buyout Beta Index ETF seeks to provide investment results that, before fees and expenses, track the price and yield performance of a specific equity securities index. The Fund's current index is the Man Buyout Beta Index (the "Underlying Index"). The Underlying Index is designed to provide a proxy for private equity performance and risk exposures by focusing on small- and mid-capitalization stocks with characteristics similar to companies in private equity buyout funds. A "buyout" fund is a type of fund that targets companies for acquisition or control in an attempt to enhance the value of those acquired companies. The Fund does not invest directly in private equity funds or the privately-held shares of companies, and the Fund will not attempt to acquire or control private companies. The Fund slightly underperformed the small to mid-capitalization U.S. equity market, as represented by the Russell 2,500 Index, during the Period. Small to mid-capitalization stocks are generally affected disproportionately during times of macroeconomic uncertainty. Heightened levels of uncertainty were introduced in mid-February 2025, which weighed on the companies held within the Fund. During the Period, a New Mexico utility company held by the Fund entered into strategic talks with a private buyer about a potential takeover. The deviation between the Fund's performance and that of the Underlying Index can be mainly attributed to management fees paid by the Fund. |
|
| AssetsNet |
$ 10,216,953
|
$ 10,216,953
|
| Holdings Count | Holding |
304
|
304
|
| Advisory Fees Paid, Amount |
$ 46,688
|
|
| InvestmentCompanyPortfolioTurnover |
27.00%
|
|
| Additional Fund Statistics [Text Block] |
Key Fund Statistics as of March 31, 2025 | Total Net Assets | Number of Holdings | Total Advisory Fees Paid | Portfolio Turnover Rate |
|---|
| $10,216,953 | 304 | $46,688 | 27% |
|---|
|
|
| Holdings [Text Block] |
Sector WeightingsFootnote Reference*Value | Value |
|---|
Utilities | 1.9% | Energy | 2.7% | Consumer Staples | 3.7% | Communication Services | 5.0% | Materials | 7.6% | Financials | 8.7% | Health Care | 11.7% | Consumer Discretionary | 13.1% | Industrials | 20.1% | Information Technology | 25.5% |
| Footnote | Description | Footnote* | Percentages are calculated based on total net assets. |
|
|
| Largest Holdings [Text Block] |
Holding Name | | | Percentage of
Total Net Assets |
|---|
Elastic | | | 1.7% | Encompass Health | | | 1.6% | News | | | 1.5% | Nutanix, Cl A | | | 1.4% | Q2 Holdings | | | 1.2% | Option Care Health | | | 1.1% | QIAGEN | | | 1.1% | Light & Wonder | | | 1.0% | Pegasystems | | | 1.0% | Pentair | | | 1.0% |
|
|
| Material Fund Change [Text Block] |
There were no material changes during the reporting period. |
|
| Updated Prospectus Web Address |
https://kraneshares.com/buyo/
|
|