Pay vs Performance Disclosure - USD ($)
Mar. 29, 2025
Mar. 30, 2024
Apr. 01, 2023
Apr. 02, 2022
Apr. 03, 2021
PAY VERSUS PERFORMANCE TABLE
Value of Initial Fixed $100 Investment Based On: | ||||||||||||||||||||||||||||||||||||||||||||||||||
FiscalYear(1) | Summary Compensation Table Total For CEO/PEO ($) | Compensation Actually Paid to CEO/PEO ($)(2)(3) | Average Summary Compensation Table for Non-PEO Named Executive Officers ($) | Average Compensation Actually Paid to Non-PEO Named Executive Officers ($)(2)(4) | Total Shareholder Return ($)(5) | Peer Group Total Shareholder Return ($)(5) | Net Income ($) in thousands)(6) | Adjusted Revenue ($) in thousands)(7) | ||||||||||||||||||||||||||||||||||||||||||
| 2025 | $ | 10,722,488 | $ | 1,345,794 | $ | 2,475,289 | $ | 702,179 | $ | 62.60 | $ | 120.90 | $ | 167,679 | $ | 1,363,800 | ||||||||||||||||||||||||||||||||||
| 2024 | $ | 11,545,113 | $ | 10,182,199 | $ | 2,797,222 | $ | 2,583,973 | $ | 84.55 | $ | 129.18 | $ | 117,558 | $ | 1,305,300 | ||||||||||||||||||||||||||||||||||
| 2023 | $ | 10,686,395 | $ | 18,084,134 | $ | 2,395,331 | $ | 2,834,733 | $ | 81.97 | $ | 137.09 | $ | 115,401 | $ | 1,189,500 | ||||||||||||||||||||||||||||||||||
| 2022 | $ | 8,702,220 | $ | (2,352,047) | $ | 2,871,874 | $ | 1,276,390 | $ | 63.25 | $ | 167.29 | $ | 43,375 | $ | 989,900 | ||||||||||||||||||||||||||||||||||
| 2021 | $ | 8,625,394 | $ | 6,611,926 | $ | 1,951,223 | $ | 1,842,169 | $ | 110.99 | $ | 174.65 | $ | 79,469 | $ | 869,100 | ||||||||||||||||||||||||||||||||||
(1)The CEO/PEO and non-PEO NEOs included in the above compensation columns reflect the following:
| Fiscal Year | CEO/PEO | Non-PEO NEOs | ||||||
| 2025 | Christopher A. Simon | James C. D'Arecca, Michelle L. Basil, Roy Galvin and Stewart W. Strong | ||||||
| 2024 | Christopher A. Simon | James C. D'Arecca, Michelle L. Basil, Anila Lingamneni and Josep L. Llorens | ||||||
| 2023 | Christopher A. Simon | James C. D'Arecca, Michelle L. Basil, Anila Lingamneni, Josep L. Llorens and William P. Burke | ||||||
| 2022 | Christopher A. Simon | William P. Burke, Michelle L. Basil, Josep L. Llorens and Stewart W. Strong | ||||||
| 2021 | Christopher A. Simon | William P. Burke, Michelle L. Basil, Anila Lingamneni and Josep L. Llorens | ||||||
(2)The dollar amounts reflected in these columns represent the "Compensation Actually Paid" ("CAP") to the CEO/PEO and the average amount of CAP to the non-PEO NEOs as a group, respectively, in the applicable fiscal year, as computed in accordance with Item 402(v) of Regulation S-K. “Compensation Actually Paid” does not correlate to the total amount of cash or equity compensation realized during each fiscal year. Instead, it is a nuanced calculation that includes the increase or decrease in value of certain elements of compensation over each fiscal year, including compensation granted in a prior year, in accordance with Item 402(v) of Regulation S-K. The amount of compensation ultimately received may, in fact, be different from the amounts disclosed in these columns.
(3)In accordance with Item 402(v) of Regulation S-K, the following adjustments were made to the compensation for the CEO/PEO for each fiscal year to determine the “Compensation Actually Paid”:
| Adjustments to Determine Compensation “Actually Paid” for CEO/PEO | Fiscal 2025 ($) | Fiscal 2024 ($) | Fiscal 2023 ($) | Fiscal 2022 ($) | Fiscal 2021 ($) | |||||||||||||||||||||||||||
| Summary Compensation Table Total Compensation | $ | 10,722,488 | $ | 11,545,113 | $ | 10,686,395 | $ | 8,702,220 | $ | 8,625,394 | ||||||||||||||||||||||
| Less the aggregate change in the actuarial present value of pension benefits | $ | — | $ | — | $ | — | $ | — | $ | — | ||||||||||||||||||||||
| Plus the actuarial present value of pension benefits attributable to the service during the covered fiscal year and prior service cost | $ | — | $ | — | $ | — | $ | — | $ | — | ||||||||||||||||||||||
| Less the grant date fair value of any equity awards granted during the year | $ | (8,426,642) | $ | (7,945,882) | $ | (7,424,913) | $ | (6,819,232) | $ | (6,596,160) | ||||||||||||||||||||||
| Plus the fair value as of fiscal year-end of any equity awards granted during the covered year that are unvested at the end of the year | $ | 3,701,118 | $ | 6,313,249 | $ | 11,727,337 | $ | 8,268,477 | $ | 7,308,743 | ||||||||||||||||||||||
| Plus the change, measured from the end of the prior fiscal year to the end of the most recently completed fiscal year, in the fair value of any equity awards granted in prior years that are unvested as of the end of the covered year | $ | (7,354,952) | $ | 1,198,186 | $ | 3,234,630 | $ | (7,412,245) | $ | (1,482,976) | ||||||||||||||||||||||
| Plus for awards that are granted and vest in the same year, the fair value as of the vesting date | $ | — | $ | — | $ | — | $ | — | $ | — | ||||||||||||||||||||||
| Plus the change, measured from the end of the prior fiscal year to the vesting date, in fair value of equity awards granted in prior years that vested during the covered year | $ | 2,703,782 | $ | (928,467) | $ | (139,315) | $ | (5,091,267) | $ | (1,243,075) | ||||||||||||||||||||||
| Less the fair value as of the end of the prior fiscal year for any awards granted in any prior fiscal year that fail to meet the applicable vesting conditions during the covered year | $ | — | $ | — | $ | — | $ | — | $ | — | ||||||||||||||||||||||
| Plus the dollar value of any dividends or earnings paid on equity awards in the fiscal year prior to the vesting date that are not otherwise included in total compensation for the year | $ | — | $ | — | $ | — | $ | — | $ | — | ||||||||||||||||||||||
| Total Adjustments | $ | (9,376,694) | $ | (1,362,914) | $ | 7,397,739 | $ | (11,054,267) | $ | (2,013,468) | ||||||||||||||||||||||
| Compensation Actually Paid | $ | 1,345,794 | $ | 10,182,199 | $ | 18,084,134 | $ | (2,352,047) | $ | 6,611,926 | ||||||||||||||||||||||
(4)In accordance with Item 402(v) of Regulation S-K, the following adjustments were made to the compensation for the non-PEO NEOs as a group, for each fiscal year to determine the “Compensation Actually Paid”:
| Adjustments to Determine Average Compensation “Actually Paid” for Non-PEO NEOs | Fiscal 2025 Average ($) | Fiscal 2024 Average ($) | Fiscal 2023 Average ($) | Fiscal 2022 Average ($) | Fiscal 2021 Average ($) | |||||||||||||||||||||||||||
| Summary Compensation Table Total Compensation | $ | 2,475,289 | $ | 2,797,222 | $ | 2,395,331 | $ | 2,871,874 | $ | 1,951,223 | ||||||||||||||||||||||
| Less the aggregate change in the actuarial present value of pension benefits | $ | — | $ | — | $ | — | $ | — | $ | — | ||||||||||||||||||||||
| Plus the actuarial present value of pension benefits attributable to the service during the covered fiscal year and prior service cost | $ | — | $ | — | $ | — | $ | — | $ | — | ||||||||||||||||||||||
| Less the grant date fair value of any equity awards granted during the year | $ | (1,608,422) | $ | (1,619,590) | $ | (1,233,682) | $ | (2,041,847) | $ | (1,129,311) | ||||||||||||||||||||||
| Plus the fair value as of fiscal year-end of any equity awards granted during the covered year that are unvested at the end of the year | $ | 757,748 | $ | 1,286,814 | $ | 1,958,299 | $ | 2,404,154 | $ | 1,256,689 | ||||||||||||||||||||||
| Plus the change, measured from the end of the prior fiscal year to the end of the most recently completed fiscal year, in the fair value of any equity awards granted in prior years that are unvested as of the end of the covered year | $ | (1,197,961) | $ | 200,228 | $ | 404,989 | $ | (1,373,148) | $ | (158,035) | ||||||||||||||||||||||
| Plus, for awards that are granted and vest in the same year, the fair value as of the vesting date | $ | — | $ | — | $ | — | $ | — | $ | — | ||||||||||||||||||||||
| Plus the change, measured from the end of the prior fiscal year to the vesting date, in fair value of equity awards granted in prior years that vested during the covered year | $ | 275,525 | $ | (80,701) | $ | (40,369) | $ | (584,643) | $ | (78,397) | ||||||||||||||||||||||
| Less the fair value as of the end of the prior fiscal year for any awards granted in any prior fiscal year that fail to meet the applicable vesting conditions during the covered year | $ | — | $ | — | $ | (649,835) | $ | — | $ | — | ||||||||||||||||||||||
| Plus the dollar value of any dividends or earnings paid on equity awards in the fiscal year prior to the vesting date that are not otherwise included in total compensation for the year | $ | — | $ | — | $ | — | $ | — | $ | — | ||||||||||||||||||||||
| Total Adjustments | $ | (1,773,110) | $ | (213,249) | $ | 439,402 | $ | (1,595,484) | $ | (109,054) | ||||||||||||||||||||||
| Compensation Actually Paid | $ | 702,179 | $ | 2,583,973 | $ | 2,834,733 | $ | 1,276,390 | $ | 1,842,169 | ||||||||||||||||||||||
(5)For the relevant fiscal year, represents the cumulative total shareholder return on Haemonetics Corporation common stock and on the S&P Health Care Equipment Select Industry Index based on an investment of $100 (with reinvestment of all dividends) in each of Haemonetics Corporation and the S&P Health Care Equipment Select Industry Index on March 30, 2020, the first trading day of our fiscal 2021.
(6)The dollar amounts reported represent the amount of net income reflected in our audited financial statements for the applicable fiscal year.
(7)Adjusted revenue is a non-GAAP number and represents the most important financial performance measure (that is not otherwise required to be disclosed in the table) used by the Company to link compensation actually paid to our NEOs, including our CEO, for the most recently completed fiscal year to the Company’s performance. For purposes of the 2025 Bonus Plan, adjusted revenue equals fiscal 2025 total Company revenue determined in accordance with GAAP, or $1,360.8 million, adjusted to exclude the impacts of currency as well as the sale of the Company’s Whole Blood product line within its Blood Center business unit in January 2025, which occurred after the Compensation Committee set performance goals under the 2025 Bonus Plan during the first quarter of fiscal 2025. As discussed in our Compensation Discussion and Analysis, adjusted revenue results also exclude approximately $14.0 million of fiscal 2025 revenue from North America disposables sales to CSL, which represents the portion of such fiscal 2025 North America disposables sales to CSL that exceeded the amount contemplated in the adjusted revenue performance targets set by the Committee based on the Company’s fiscal 2025 annual operating plan. For more information, see "Annual Short-Term Incentive Compensation" beginning on page 29.
| Fiscal Year | CEO/PEO | Non-PEO NEOs | ||||||
| 2025 | Christopher A. Simon | James C. D'Arecca, Michelle L. Basil, Roy Galvin and Stewart W. Strong | ||||||
| 2024 | Christopher A. Simon | James C. D'Arecca, Michelle L. Basil, Anila Lingamneni and Josep L. Llorens | ||||||
| 2023 | Christopher A. Simon | James C. D'Arecca, Michelle L. Basil, Anila Lingamneni, Josep L. Llorens and William P. Burke | ||||||
| 2022 | Christopher A. Simon | William P. Burke, Michelle L. Basil, Josep L. Llorens and Stewart W. Strong | ||||||
| 2021 | Christopher A. Simon | William P. Burke, Michelle L. Basil, Anila Lingamneni and Josep L. Llorens | ||||||
| Adjustments to Determine Compensation “Actually Paid” for CEO/PEO | Fiscal 2025 ($) | Fiscal 2024 ($) | Fiscal 2023 ($) | Fiscal 2022 ($) | Fiscal 2021 ($) | |||||||||||||||||||||||||||
| Summary Compensation Table Total Compensation | $ | 10,722,488 | $ | 11,545,113 | $ | 10,686,395 | $ | 8,702,220 | $ | 8,625,394 | ||||||||||||||||||||||
| Less the aggregate change in the actuarial present value of pension benefits | $ | — | $ | — | $ | — | $ | — | $ | — | ||||||||||||||||||||||
| Plus the actuarial present value of pension benefits attributable to the service during the covered fiscal year and prior service cost | $ | — | $ | — | $ | — | $ | — | $ | — | ||||||||||||||||||||||
| Less the grant date fair value of any equity awards granted during the year | $ | (8,426,642) | $ | (7,945,882) | $ | (7,424,913) | $ | (6,819,232) | $ | (6,596,160) | ||||||||||||||||||||||
| Plus the fair value as of fiscal year-end of any equity awards granted during the covered year that are unvested at the end of the year | $ | 3,701,118 | $ | 6,313,249 | $ | 11,727,337 | $ | 8,268,477 | $ | 7,308,743 | ||||||||||||||||||||||
| Plus the change, measured from the end of the prior fiscal year to the end of the most recently completed fiscal year, in the fair value of any equity awards granted in prior years that are unvested as of the end of the covered year | $ | (7,354,952) | $ | 1,198,186 | $ | 3,234,630 | $ | (7,412,245) | $ | (1,482,976) | ||||||||||||||||||||||
| Plus for awards that are granted and vest in the same year, the fair value as of the vesting date | $ | — | $ | — | $ | — | $ | — | $ | — | ||||||||||||||||||||||
| Plus the change, measured from the end of the prior fiscal year to the vesting date, in fair value of equity awards granted in prior years that vested during the covered year | $ | 2,703,782 | $ | (928,467) | $ | (139,315) | $ | (5,091,267) | $ | (1,243,075) | ||||||||||||||||||||||
| Less the fair value as of the end of the prior fiscal year for any awards granted in any prior fiscal year that fail to meet the applicable vesting conditions during the covered year | $ | — | $ | — | $ | — | $ | — | $ | — | ||||||||||||||||||||||
| Plus the dollar value of any dividends or earnings paid on equity awards in the fiscal year prior to the vesting date that are not otherwise included in total compensation for the year | $ | — | $ | — | $ | — | $ | — | $ | — | ||||||||||||||||||||||
| Total Adjustments | $ | (9,376,694) | $ | (1,362,914) | $ | 7,397,739 | $ | (11,054,267) | $ | (2,013,468) | ||||||||||||||||||||||
| Compensation Actually Paid | $ | 1,345,794 | $ | 10,182,199 | $ | 18,084,134 | $ | (2,352,047) | $ | 6,611,926 | ||||||||||||||||||||||
(2)The dollar amounts reflected in these columns represent the "Compensation Actually Paid" ("CAP") to the CEO/PEO and the average amount of CAP to the non-PEO NEOs as a group, respectively, in the applicable fiscal year, as computed in accordance with Item 402(v) of Regulation S-K. “Compensation Actually Paid” does not correlate to the total amount of cash or equity compensation realized during each fiscal year. Instead, it is a nuanced calculation that includes the increase or decrease in value of certain elements of compensation over each fiscal year, including compensation granted in a prior year, in accordance with Item 402(v) of Regulation S-K. The amount of compensation ultimately received may, in fact, be different from the amounts disclosed in these columns.
In accordance with Item 402(v) of Regulation S-K, the following adjustments were made to the compensation for the non-PEO NEOs as a group, for each fiscal year to determine the “Compensation Actually Paid”:| Adjustments to Determine Average Compensation “Actually Paid” for Non-PEO NEOs | Fiscal 2025 Average ($) | Fiscal 2024 Average ($) | Fiscal 2023 Average ($) | Fiscal 2022 Average ($) | Fiscal 2021 Average ($) | |||||||||||||||||||||||||||
| Summary Compensation Table Total Compensation | $ | 2,475,289 | $ | 2,797,222 | $ | 2,395,331 | $ | 2,871,874 | $ | 1,951,223 | ||||||||||||||||||||||
| Less the aggregate change in the actuarial present value of pension benefits | $ | — | $ | — | $ | — | $ | — | $ | — | ||||||||||||||||||||||
| Plus the actuarial present value of pension benefits attributable to the service during the covered fiscal year and prior service cost | $ | — | $ | — | $ | — | $ | — | $ | — | ||||||||||||||||||||||
| Less the grant date fair value of any equity awards granted during the year | $ | (1,608,422) | $ | (1,619,590) | $ | (1,233,682) | $ | (2,041,847) | $ | (1,129,311) | ||||||||||||||||||||||
| Plus the fair value as of fiscal year-end of any equity awards granted during the covered year that are unvested at the end of the year | $ | 757,748 | $ | 1,286,814 | $ | 1,958,299 | $ | 2,404,154 | $ | 1,256,689 | ||||||||||||||||||||||
| Plus the change, measured from the end of the prior fiscal year to the end of the most recently completed fiscal year, in the fair value of any equity awards granted in prior years that are unvested as of the end of the covered year | $ | (1,197,961) | $ | 200,228 | $ | 404,989 | $ | (1,373,148) | $ | (158,035) | ||||||||||||||||||||||
| Plus, for awards that are granted and vest in the same year, the fair value as of the vesting date | $ | — | $ | — | $ | — | $ | — | $ | — | ||||||||||||||||||||||
| Plus the change, measured from the end of the prior fiscal year to the vesting date, in fair value of equity awards granted in prior years that vested during the covered year | $ | 275,525 | $ | (80,701) | $ | (40,369) | $ | (584,643) | $ | (78,397) | ||||||||||||||||||||||
| Less the fair value as of the end of the prior fiscal year for any awards granted in any prior fiscal year that fail to meet the applicable vesting conditions during the covered year | $ | — | $ | — | $ | (649,835) | $ | — | $ | — | ||||||||||||||||||||||
| Plus the dollar value of any dividends or earnings paid on equity awards in the fiscal year prior to the vesting date that are not otherwise included in total compensation for the year | $ | — | $ | — | $ | — | $ | — | $ | — | ||||||||||||||||||||||
| Total Adjustments | $ | (1,773,110) | $ | (213,249) | $ | 439,402 | $ | (1,595,484) | $ | (109,054) | ||||||||||||||||||||||
| Compensation Actually Paid | $ | 702,179 | $ | 2,583,973 | $ | 2,834,733 | $ | 1,276,390 | $ | 1,842,169 | ||||||||||||||||||||||
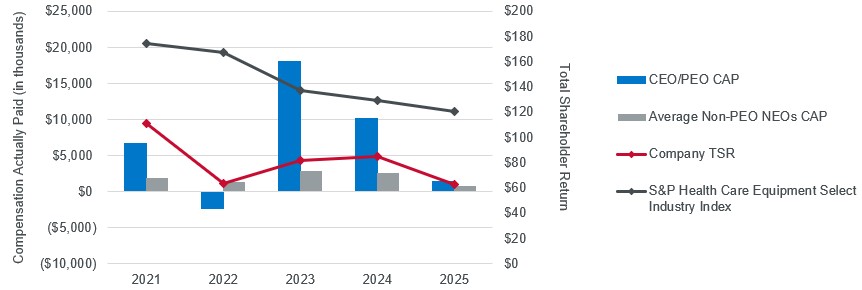
CAP AND TSR
The graph below shows the relationship between (i) the five-year total shareholder return on our common stock and on the S&P Health Care Equipment Select Industry Index, in each case based on an investment of $100 (with reinvestment of all dividends) in
each of Haemonetics and the S&P Health Care Equipment Select Industry Index on March 30, 2020, the first trading day of our fiscal 2021 and (ii) the CAP for our CEO/PEO and the average CAP for our non-PEO NEOs for each of fiscal 2021 through fiscal 2025.
Relationship Between Compensation Actually Paid and Company/Peer Group Total Shareholder Return
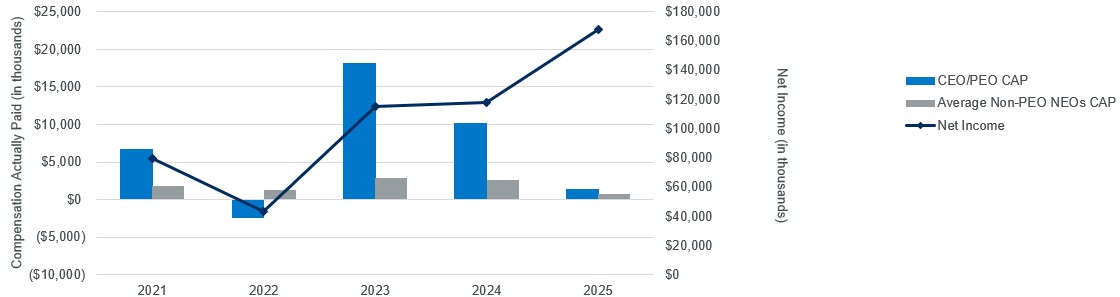
CAP AND NET INCOME
The graph below shows the relationship between our net income and the CAP for our CEO/PEO and the average CAP for our non-PEO NEOs for each of fiscal 2021 through fiscal 2025.
Relationship Between Compensation Actually Paid and Net Income
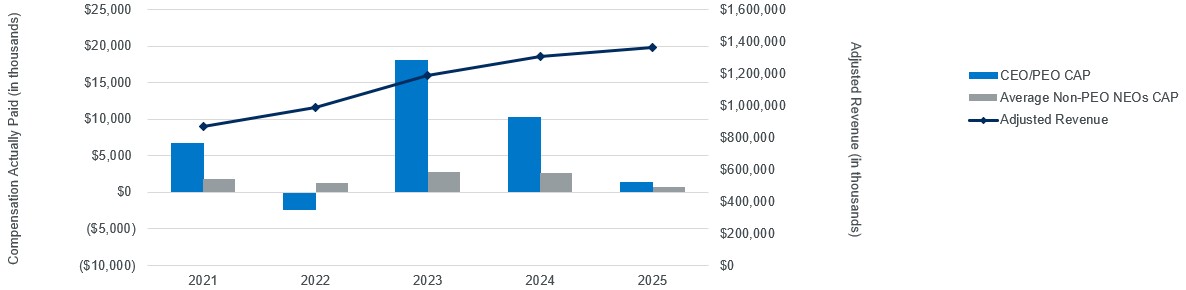
CAP AND ADJUSTED REVENUE
The graph below shows the relationship between our Adjusted Revenue and the CAP for our CEO/PEO and the average CAP for our non-PEO NEOs for each of fiscal 2021 through fiscal 2025.
Relationship Between Compensation Actually Paid and Adjusted Revenue
CAP AND TSR
The graph below shows the relationship between (i) the five-year total shareholder return on our common stock and on the S&P Health Care Equipment Select Industry Index, in each case based on an investment of $100 (with reinvestment of all dividends) in
each of Haemonetics and the S&P Health Care Equipment Select Industry Index on March 30, 2020, the first trading day of our fiscal 2021 and (ii) the CAP for our CEO/PEO and the average CAP for our non-PEO NEOs for each of fiscal 2021 through fiscal 2025.
Relationship Between Compensation Actually Paid and Company/Peer Group Total Shareholder Return
| Adjusted EPS* | ||
| Adjusted Operating Income* | ||
| Adjusted Revenue* | ||
| Business Unit Revenue* | ||
| Relative Total Shareholder Return | ||