Pay vs Performance Disclosure - USD ($)
|
12 Months Ended |
Dec. 31, 2024 |
Dec. 31, 2023 |
Dec. 31, 2022 |
| Pay vs Performance Disclosure |
|
|
|
| Pay vs Performance Disclosure, Table |
| | | | | | | | | | | | | | | | | | | | | | | | | | | | | | | | | | | | | | | | | | | Year(1) | | Summary Compensation Table Total for PEO ($) | | Compensation Actually Paid to PEO(2)(3) ($) | | Average Summary Compensation Table Total for Non-PEO NEOs ($) | | Average Summary Compensation Actually Paid to Non-PEO NEOs(2)(4) ($) | | Value of Initial Fixed $100 Investment Based On: | | Net Loss ($) (in millions) | | | | | | | | Total Shareholder Return(5) ($) | | | | | (a) | | (b) | | (c) | | (d) | | (e) | | (f) | | | | (h) | | | 2024 | | $ | 497,253 | | | $ | (11,893,827) | | | $ | 4,287,546 | | | $ | 2,097,759 | | | $ | 2.12 | | | | | $ | (273.1) | | | | 2023 | | 734,499 | | | (15,624,824) | | | 2,487,120 | | | 970,446 | | | 19.93 | | | | | (571.3) | | | | 2022 | | 94,392,486 | | | 29,435,418 | | | 6,784,751 | | | (10,947,549) | | | 29.27 | | | | | (445.9) | | | | | | | | | | | | | | | | | | | | |
|
|
|
| Named Executive Officers, Footnote |
The following table lists the PEO and non-PEO NEOs for each of fiscal years 2024, 2023 and 2022. | | | | | | | | | | | | | | | | Year | | PEO | | Non-PEO NEOs | 2024 | | Austin Russell | | Thomas J. Fennimore and Alan Prescott | 2023 | | Austin Russell | | Thomas J. Fennimore and Alan Prescott | 2022 | | Austin Russell | | Thomas J. Fennimore and Alan Prescott | | | | | |
|
|
|
| Peer Group Issuers, Footnote |
Assumes $100 was invested for the period starting December 31, 2021, through the end of the listed year in a share of our common stock, and assumes reinvestment of dividends.
|
|
|
| PEO Total Compensation Amount |
$ 497,253
|
$ 734,499
|
$ 94,392,486
|
| PEO Actually Paid Compensation Amount |
$ (11,893,827)
|
(15,624,824)
|
29,435,418
|
| Adjustment To PEO Compensation, Footnote |
The dollar amounts reported represent the amount of “compensation actually paid,” as calculated in accordance with the Pay Versus Performance Rules. These dollar amounts do not reflect the actual amounts of compensation earned by or paid to our NEOs during the applicable year. For purposes of calculating “compensation actually paid,” the fair value of equity awards is calculated in accordance with ASC Topic 718 using the same assumption methodologies used to calculate the grant date fair value of awards for purposes of the Summary Compensation Table (refer to “Executive Compensation Tables—2024 Summary Compensation Table” for additional information).The following table shows the amounts deducted from and added to the Summary Compensation Table total to calculate “compensation actually paid” to Mr. Russell in accordance with the Pay Versus Performance Rules: | | | | | | | | | | | | | | | | | | | | | | | | | | | | | | | | | | | | | | | | | | | | | | | | | | | | | | | | | Equity Award Adjustments | | Year | | Summary Compensation Table Total for PEO ($) | | Reported Value of Equity Awards ($) | | Year End Fair Value of Equity Awards Granted in the Year and Unvested at Year End ($) | | Year Over Year Change in Fair Value of Outstanding and Unvested Equity Awards Granted in Prior Years ($) | | Fair Value as of Vesting Date of Equity Awards Granted and Vested in the Year ($) | | Change in Fair Value of Equity Awards Granted in Prior Years that Vested in the Year ($) | | Fair Value at the End of the Prior Year of Equity Awards that Failed to Meet Vesting Conditions in the Year ($) | | Value of Dividends or other Earnings Paid on Stock or Option Awards not Otherwise Reflected in Fair Value ($) | | Compensation Actually Paid to PEO ($) | 2024 | | $ | 497,253 | | | $ | — | | | $ | — | | | $ | (12,391,080) | | | $ | — | | | $ | — | | | $ | — | | | $ | — | | | $ | (11,893,827) | | | | | | | | | | | | | | | | | | | | | | | | | | | | | | | | | | | | | | | | | | | | | | | | | | | | | | | | | | |
|
|
|
| Non-PEO NEO Average Total Compensation Amount |
$ 4,287,546
|
2,487,120
|
6,784,751
|
| Non-PEO NEO Average Compensation Actually Paid Amount |
$ 2,097,759
|
970,446
|
(10,947,549)
|
| Adjustment to Non-PEO NEO Compensation Footnote |
The dollar amounts reported represent the amount of “compensation actually paid,” as calculated in accordance with the Pay Versus Performance Rules. These dollar amounts do not reflect the actual amounts of compensation earned by or paid to our NEOs during the applicable year. For purposes of calculating “compensation actually paid,” the fair value of equity awards is calculated in accordance with ASC Topic 718 using the same assumption methodologies used to calculate the grant date fair value of awards for purposes of the Summary Compensation Table (refer to “Executive Compensation Tables—2024 Summary Compensation Table” for additional information).The following table shows the amounts deducted from and added to the average Summary Compensation Table total compensation to calculate the average “compensation actually paid” to our non-PEO NEOs in accordance with the Pay Versus Performance Rules. | | | | | | | | | | | | | | | | | | | | | | | | | | | | | | | | | | | | | | | | | | | | | | | | | | | | | | | | | Equity Award Adjustments | | Year | | Average Summary Compensation Table Total for Non-PEO NEOs ($) | | Average Reported Value of Equity Awards ($) | | Average Year End Fair Value of Equity Awards Granted in the Year and Unvested at Year End ($) | | Average Year over Year Change in Fair Value of Outstanding and Unvested Equity Awards Granted in Prior Years ($) | | Average Fair Value as of Vesting Date of Equity Awards Granted and Vested in the Year ($) | | Average Change in Fair Value of Equity Awards Granted in Prior Years that Vested in the Year ($) | | Average Fair Value at the End of the Prior Year of Equity Awards that Failed to Meet Vesting Conditions in the Year ($) | | Average Value of Dividends or other Earnings Paid on Stock or Option Awards not Otherwise Reflected in Fair Value ($) | | Average Compensation Actually Paid to Non-PEO NEOs ($) | 2024 | | $ | 4,287,546 | | | $ | (1,499,996) | | | $ | — | | | $ | (629,668) | | | $ | 1,382,493 | | | $ | (633,468) | | | $ | (809,148) | | | $ | — | | | $ | 2,097,759 | | | | | | | | | | | | | | | | | | | | | | | | | | | | | | | | | | | | | | | | | | | | | | | | | | | | | | | | | | |
|
|
|
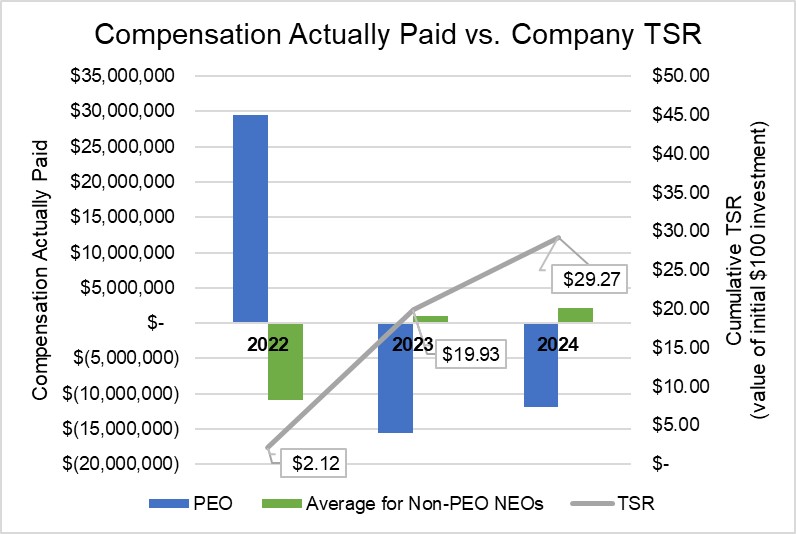
| Compensation Actually Paid vs. Total Shareholder Return |
Compensation Actually Paid and Cumulative TSR
|
|
|
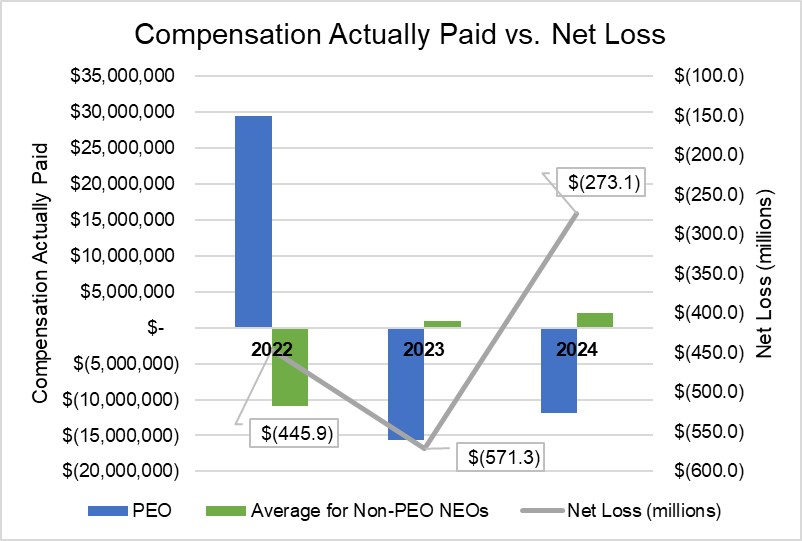
| Compensation Actually Paid vs. Net Income |
ompensation Actually Paid and Net Loss
|
|
|
| Total Shareholder Return Amount |
$ 2.12
|
19.93
|
29.27
|
| Net Income (Loss) |
$ (273,100,000)
|
$ (571,300,000)
|
$ (445,900,000)
|
| PEO Name |
Austin Russell
|
Austin Russell
|
Austin Russell
|
| Additional 402(v) Disclosure |
This section provides disclosure about the relationship between executive compensation actually paid to our principal executive officer (PEO) and non-PEO named executive officers (NEOs) and certain financial performance measures of the Company for the fiscal years listed below. This disclosure has been prepared in accordance with Item 402(v) of Regulation S-K under the Securities Exchange Act of 1934 (the “Pay Versus Performance Rules”) and does not necessarily reflect how the compensation committee evaluates compensation decisions. In accordance with the Pay Versus Performance Rules, the charts below illustrate how “compensation actually paid” to the NEOs aligns with the Company’s financial performance as measured by TSR and net losses.
|
|
|
| PEO | Aggregate Grant Date Fair Value of Equity Award Amounts Reported in Summary Compensation Table |
|
|
|
| Pay vs Performance Disclosure |
|
|
|
| Adjustment to Compensation, Amount |
$ 0
|
|
|
| PEO | Year-end Fair Value of Equity Awards Granted in Covered Year that are Outstanding and Unvested |
|
|
|
| Pay vs Performance Disclosure |
|
|
|
| Adjustment to Compensation, Amount |
0
|
|
|
| PEO | Year-over-Year Change in Fair Value of Equity Awards Granted in Prior Years That are Outstanding and Unvested |
|
|
|
| Pay vs Performance Disclosure |
|
|
|
| Adjustment to Compensation, Amount |
(12,391,080)
|
|
|
| PEO | Vesting Date Fair Value of Equity Awards Granted and Vested in Covered Year |
|
|
|
| Pay vs Performance Disclosure |
|
|
|
| Adjustment to Compensation, Amount |
0
|
|
|
| PEO | Change in Fair Value as of Vesting Date of Prior Year Equity Awards Vested in Covered Year |
|
|
|
| Pay vs Performance Disclosure |
|
|
|
| Adjustment to Compensation, Amount |
0
|
|
|
| PEO | Prior Year End Fair Value of Equity Awards Granted in Any Prior Year that Fail to Meet Applicable Vesting Conditions During Covered Year |
|
|
|
| Pay vs Performance Disclosure |
|
|
|
| Adjustment to Compensation, Amount |
0
|
|
|
| PEO | Dividends or Other Earnings Paid on Equity Awards not Otherwise Reflected in Total Compensation for Covered Year |
|
|
|
| Pay vs Performance Disclosure |
|
|
|
| Adjustment to Compensation, Amount |
0
|
|
|
| Non-PEO NEO | Aggregate Grant Date Fair Value of Equity Award Amounts Reported in Summary Compensation Table |
|
|
|
| Pay vs Performance Disclosure |
|
|
|
| Adjustment to Compensation, Amount |
(1,499,996)
|
|
|
| Non-PEO NEO | Year-end Fair Value of Equity Awards Granted in Covered Year that are Outstanding and Unvested |
|
|
|
| Pay vs Performance Disclosure |
|
|
|
| Adjustment to Compensation, Amount |
0
|
|
|
| Non-PEO NEO | Year-over-Year Change in Fair Value of Equity Awards Granted in Prior Years That are Outstanding and Unvested |
|
|
|
| Pay vs Performance Disclosure |
|
|
|
| Adjustment to Compensation, Amount |
(629,668)
|
|
|
| Non-PEO NEO | Vesting Date Fair Value of Equity Awards Granted and Vested in Covered Year |
|
|
|
| Pay vs Performance Disclosure |
|
|
|
| Adjustment to Compensation, Amount |
1,382,493
|
|
|
| Non-PEO NEO | Change in Fair Value as of Vesting Date of Prior Year Equity Awards Vested in Covered Year |
|
|
|
| Pay vs Performance Disclosure |
|
|
|
| Adjustment to Compensation, Amount |
(633,468)
|
|
|
| Non-PEO NEO | Prior Year End Fair Value of Equity Awards Granted in Any Prior Year that Fail to Meet Applicable Vesting Conditions During Covered Year |
|
|
|
| Pay vs Performance Disclosure |
|
|
|
| Adjustment to Compensation, Amount |
(809,148)
|
|
|
| Non-PEO NEO | Dividends or Other Earnings Paid on Equity Awards not Otherwise Reflected in Total Compensation for Covered Year |
|
|
|
| Pay vs Performance Disclosure |
|
|
|
| Adjustment to Compensation, Amount |
$ 0
|
|
|