Shareholder Report
Mar. 31, 2025
USD ($)
Holding
Shareholder Report |
6 Months Ended |
|---|---|
|
Mar. 31, 2025
USD ($)
Holding
| |
| Shareholder Report [Line Items] | |
| Document Type | N-CSRS |
| Amendment Flag | false |
| Registrant Name | Advisors' Inner Circle Fund III |
| Entity Central Index Key | 0001593547 |
| Entity Investment Company Type | N-1A |
| Document Period End Date | Mar. 31, 2025 |
| C000224149 | |
| Shareholder Report [Line Items] | |
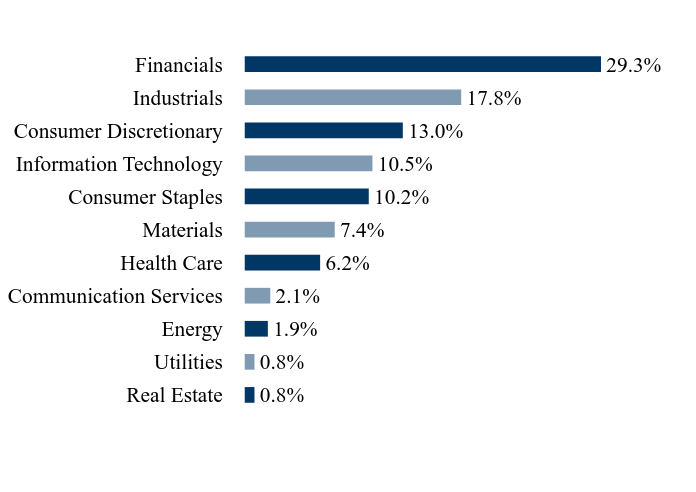
| Fund Name | Rayliant Quantamental China Equity ETF |
| Class Name | Rayliant Quantamental China Equity ETF |
| Trading Symbol | RAYC |
| Security Exchange Name | NYSEArca |
| Annual or Semi-Annual Statement [Text Block] | This semi-annual shareholder report contains important information about the Rayliant Quantamental China Equity ETF (the "Fund") for the period from October 1, 2024 to March 31, 2025. |
| Shareholder Report Annual or Semi-Annual | Semi-Annual Shareholder Report |
| Additional Information [Text Block] | You can find additional information about the Fund at https://funds.rayliant.com/rayc. You can also request this information by contacting us at 866-898-1688. |
| Additional Information Phone Number | 866-898-1688 |
| Additional Information Website | https://funds.rayliant.com/rayc |
| Expenses [Text Block] | |
| Expenses Paid, Amount | $ 39 |
| Expense Ratio, Percent | 0.80% |
| AssetsNet | $ 18,085,021 |
| Holdings Count | Holding | 90 |
| Advisory Fees Paid, Amount | $ 0 |
| InvestmentCompanyPortfolioTurnover | 105.00% |
| Additional Fund Statistics [Text Block] | |
| Holdings [Text Block] | |
| Largest Holdings [Text Block] | |
| Updated Prospectus Phone Number | 866-898-1688 |
| Updated Prospectus Web Address | https://funds.rayliant.com/rayc |
| C000232916 | |
| Shareholder Report [Line Items] | |
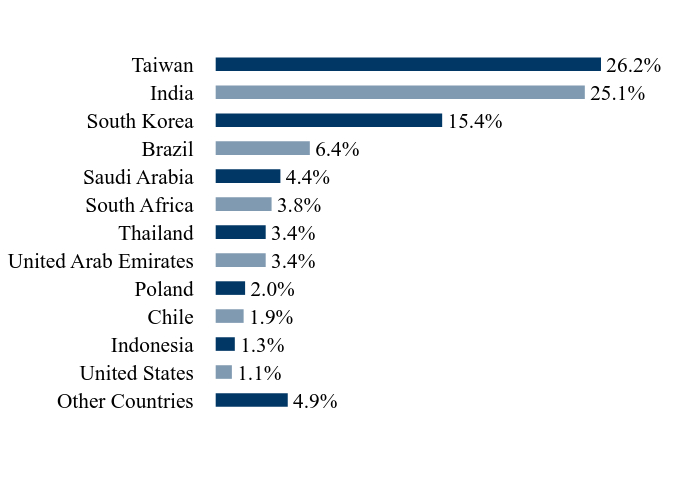
| Fund Name | Rayliant Quantamental Emerging Market ex-China Equity ETF |
| Class Name | Rayliant Quantamental Emerging Market ex-China Equity ETF |
| Trading Symbol | RAYE |
| Security Exchange Name | NYSEArca |
| Annual or Semi-Annual Statement [Text Block] | This semi-annual shareholder report contains important information about the Rayliant Quantamental Emerging Market ex-China Equity ETF (the "Fund") for the period from October 1, 2024 to March 31, 2025. |
| Shareholder Report Annual or Semi-Annual | Semi-Annual Shareholder Report |
| Additional Information [Text Block] | You can find additional information about the Fund at https://funds.rayliant.com/raye. You can also request this information by contacting us at 866-898-1688. |
| Additional Information Phone Number | 866-898-1688 |
| Additional Information Website | https://funds.rayliant.com/raye |
| Expenses [Text Block] | |
| Expenses Paid, Amount | $ 41 |
| Expense Ratio, Percent | 0.88% |
| AssetsNet | $ 62,504,505 |
| Holdings Count | Holding | 101 |
| Advisory Fees Paid, Amount | $ 58,548 |
| InvestmentCompanyPortfolioTurnover | 115.00% |
| Additional Fund Statistics [Text Block] | |
| Holdings [Text Block] | |
| Largest Holdings [Text Block] | |
| Updated Prospectus Phone Number | 866-898-1688 |
| Updated Prospectus Web Address | https://funds.rayliant.com/raye |
| C000232917 | |
| Shareholder Report [Line Items] | |
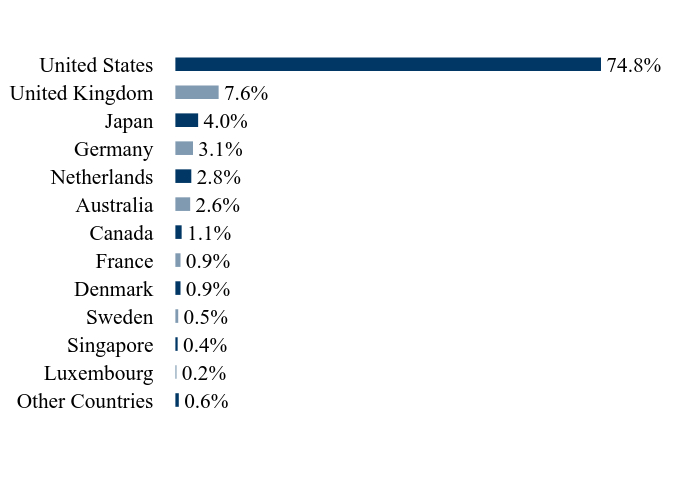
| Fund Name | Rayliant Quantitative Developed Market Equity ETF |
| Class Name | Rayliant Quantitative Developed Market Equity ETF |
| Trading Symbol | RAYD |
| Security Exchange Name | NYSEArca |
| Annual or Semi-Annual Statement [Text Block] | This semi-annual shareholder report contains important information about the Rayliant Quantitative Developed Market Equity ETF (the "Fund") for the period from October 1, 2024 to March 31, 2025. |
| Shareholder Report Annual or Semi-Annual | Semi-Annual Shareholder Report |
| Additional Information [Text Block] | You can find additional information about the Fund at https://funds.rayliant.com/rayd. You can also request this information by contacting us at 866-898-1688. |
| Additional Information Phone Number | 866-898-1688 |
| Additional Information Website | https://funds.rayliant.com/rayd |
| Expenses [Text Block] | |
| Expenses Paid, Amount | $ 41 |
| Expense Ratio, Percent | 0.80% |
| AssetsNet | $ 89,206,342 |
| Holdings Count | Holding | 120 |
| Advisory Fees Paid, Amount | $ 120,404 |
| InvestmentCompanyPortfolioTurnover | 155.00% |
| Additional Fund Statistics [Text Block] | |
| Holdings [Text Block] | |
| Largest Holdings [Text Block] | |
| Updated Prospectus Phone Number | 866-898-1688 |
| Updated Prospectus Web Address | https://funds.rayliant.com/rayd |
| C000248857 | |
| Shareholder Report [Line Items] | |
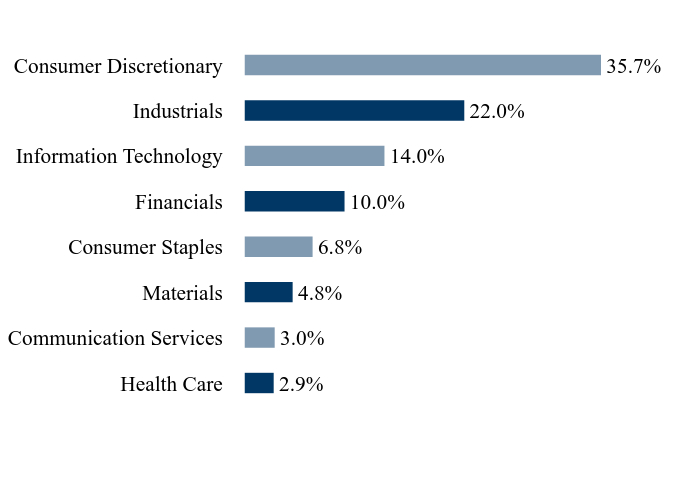
| Fund Name | Rayliant SMDAM Japan Equity ETF |
| Class Name | Rayliant SMDAM Japan Equity ETF |
| Trading Symbol | RAYJ |
| Security Exchange Name | NYSEArca |
| Annual or Semi-Annual Statement [Text Block] | This semi-annual shareholder report contains important information about the Rayliant SMDAM Japan Equity ETF (the "Fund") for the period from October 1, 2024 to March 31, 2025. |
| Shareholder Report Annual or Semi-Annual | Semi-Annual Shareholder Report |
| Additional Information [Text Block] | You can find additional information about the Fund at https://funds.rayliant.com/rayj. You can also request this information by contacting us at 866-898-1688. |
| Additional Information Phone Number | 866-898-1688 |
| Additional Information Website | https://funds.rayliant.com/rayj |
| Expenses [Text Block] | |
| Expenses Paid, Amount | $ 35 |
| Expense Ratio, Percent | 0.72% |
| AssetsNet | $ 32,261,909 |
| Holdings Count | Holding | 30 |
| Advisory Fees Paid, Amount | $ 0 |
| InvestmentCompanyPortfolioTurnover | 21.00% |
| Additional Fund Statistics [Text Block] | |
| Holdings [Text Block] | |
| Largest Holdings [Text Block] | |
| Updated Prospectus Phone Number | 866-898-1688 |
| Updated Prospectus Web Address | https://funds.rayliant.com/rayj |