Shareholder Report
Mar. 31, 2025
USD ($)
Holding
Shareholder Report |
6 Months Ended |
|---|---|
|
Mar. 31, 2025
USD ($)
Holding
| |
| Shareholder Report [Line Items] | |
| Document Type | N-CSRS |
| Amendment Flag | false |
| Registrant Name | Advisors' Inner Circle Fund III |
| Entity Central Index Key | 0001593547 |
| Entity Investment Company Type | N-1A |
| Document Period End Date | Mar. 31, 2025 |
| C000223246 | |
| Shareholder Report [Line Items] | |
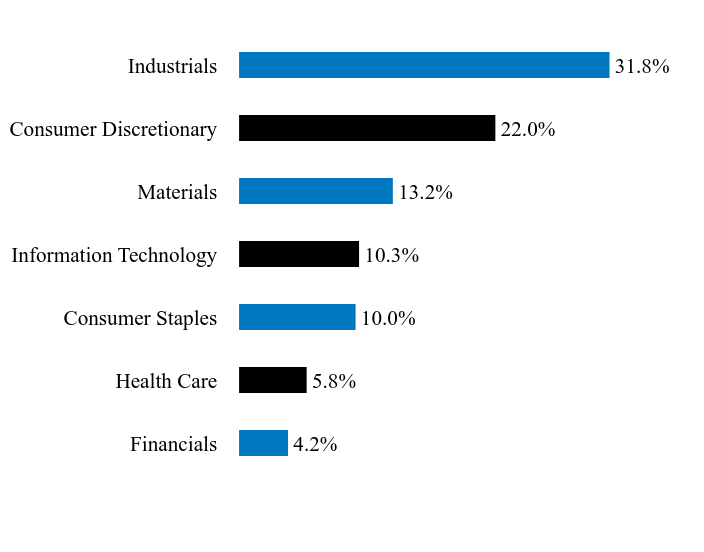
| Fund Name | SouthernSun Small Cap Fund |
| Class Name | Class N Shares |
| Trading Symbol | SSSFX |
| Annual or Semi-Annual Statement [Text Block] | This semi-annual shareholder report contains important information about Class N Shares of the SouthernSun Small Cap Fund (the "Fund") for the period from October 1, 2024 to March 31, 2025. |
| Shareholder Report Annual or Semi-Annual | Semi-Annual Shareholder Report |
| Additional Information [Text Block] | You can find additional information about the Fund at https://southernsunam.com/investment-products/small-cap-fund/. You can also request this information by contacting us at 866-392-2626. |
| Additional Information Phone Number | 866-392-2626 |
| Additional Information Website | https://southernsunam.com/investment-products/small-cap-fund/ |
| Expenses [Text Block] | |
| Expenses Paid, Amount | $ 60 |
| Expense Ratio, Percent | 1.32% |
| AssetsNet | $ 233,357,073 |
| Holdings Count | Holding | 22 |
| Advisory Fees Paid, Amount | $ 1,063,069 |
| InvestmentCompanyPortfolioTurnover | 13.00% |
| Additional Fund Statistics [Text Block] | |
| Holdings [Text Block] | |
| Largest Holdings [Text Block] | |
| Updated Prospectus Phone Number | 866-392-2626 |
| Updated Prospectus Web Address | https://southernsunam.com/investment-products/small-cap-fund/ |
| C000223247 | |
| Shareholder Report [Line Items] | |
| Fund Name | SouthernSun Small Cap Fund |
| Class Name | Class I Shares |
| Trading Symbol | SSSIX |
| Annual or Semi-Annual Statement [Text Block] | This semi-annual shareholder report contains important information about Class I Shares of the SouthernSun Small Cap Fund (the "Fund") for the period from October 1, 2024 to March 31, 2025. |
| Shareholder Report Annual or Semi-Annual | Semi-Annual Shareholder Report |
| Additional Information [Text Block] | You can find additional information about the Fund at https://southernsunam.com/investment-products/small-cap-fund/. You can also request this information by contacting us at 866-392-2626. |
| Additional Information Phone Number | 866-392-2626 |
| Additional Information Website | https://southernsunam.com/investment-products/small-cap-fund/ |
| Expenses [Text Block] | |
| Expenses Paid, Amount | $ 48 |
| Expense Ratio, Percent | 1.07% |
| AssetsNet | $ 233,357,073 |
| Holdings Count | Holding | 22 |
| Advisory Fees Paid, Amount | $ 1,063,069 |
| InvestmentCompanyPortfolioTurnover | 13.00% |
| Additional Fund Statistics [Text Block] | |
| Holdings [Text Block] | |
| Largest Holdings [Text Block] | |
| Updated Prospectus Phone Number | 866-392-2626 |
| Updated Prospectus Web Address | https://southernsunam.com/investment-products/small-cap-fund/ |
| C000223248 | |
| Shareholder Report [Line Items] | |
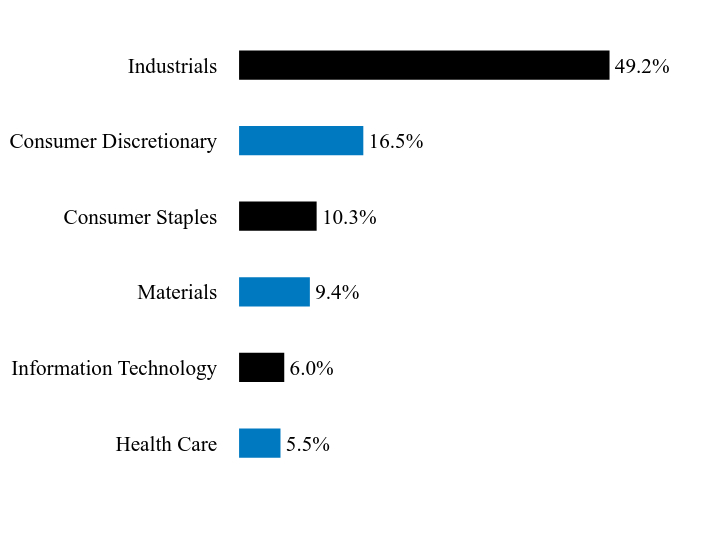
| Fund Name | SouthernSun U.S. Equity Fund |
| Class Name | Class N |
| Trading Symbol | SSEFX |
| Annual or Semi-Annual Statement [Text Block] | This semi-annual shareholder report contains important information about Class N Shares of the SouthernSun U.S. Equity Fund (the "Fund") for the period from October 1, 2024 to March 31, 2025. |
| Shareholder Report Annual or Semi-Annual | Semi-Annual Shareholder Report |
| Additional Information [Text Block] | You can find additional information about the Fund at https://southernsunam.com/investment-products/. You can also request this information by contacting us at 866-392-2626. |
| Additional Information Phone Number | 866-392-2626 |
| Additional Information Website | https://southernsunam.com/investment-products/ |
| Expenses [Text Block] | |
| Expenses Paid, Amount | $ 61 |
| Expense Ratio, Percent | 1.33% |
| AssetsNet | $ 45,033,235 |
| Holdings Count | Holding | 22 |
| Advisory Fees Paid, Amount | $ 180,765 |
| InvestmentCompanyPortfolioTurnover | 6.00% |
| Additional Fund Statistics [Text Block] | |
| Holdings [Text Block] | |
| Largest Holdings [Text Block] | |
| Updated Prospectus Phone Number | 866-392-2626 |
| Updated Prospectus Web Address | https://southernsunam.com/investment-products/ |
| C000223249 | |
| Shareholder Report [Line Items] | |
| Fund Name | SouthernSun U.S. Equity Fund |
| Class Name | Class I |
| Trading Symbol | SSEIX |
| Annual or Semi-Annual Statement [Text Block] | This semi-annual shareholder report contains important information about Class I Shares of the SouthernSun U.S. Equity Fund (the "Fund") for the period from October 1, 2024 to March 31, 2025. |
| Shareholder Report Annual or Semi-Annual | Semi-Annual Shareholder Report |
| Additional Information [Text Block] | You can find additional information about the Fund at https://southernsunam.com/investment-products/. You can also request this information by contacting us at 866-392-2626. |
| Additional Information Phone Number | 866-392-2626 |
| Additional Information Website | https://southernsunam.com/investment-products/ |
| Expenses [Text Block] | |
| Expenses Paid, Amount | $ 50 |
| Expense Ratio, Percent | 1.09% |
| AssetsNet | $ 45,033,235 |
| Holdings Count | Holding | 22 |
| Advisory Fees Paid, Amount | $ 180,765 |
| InvestmentCompanyPortfolioTurnover | 6.00% |
| Additional Fund Statistics [Text Block] | |
| Holdings [Text Block] | |
| Largest Holdings [Text Block] | |
| Updated Prospectus Phone Number | 866-392-2626 |
| Updated Prospectus Web Address | https://southernsunam.com/investment-products/ |