Shareholder Report
Mar. 31, 2025
USD ($)
Holding
What were the Fund costs for the last year?
(based on a hypothetical $10,000 investment)
| Fund name | Costs of a $10,000 investment |
Costs paid as a percentage of a $10,000 investment |
| $0(a) | 0.00%(b) |
| Rounds to less than $1. |
| Rounds to less than 0.01%. |
How did the Fund perform last year?
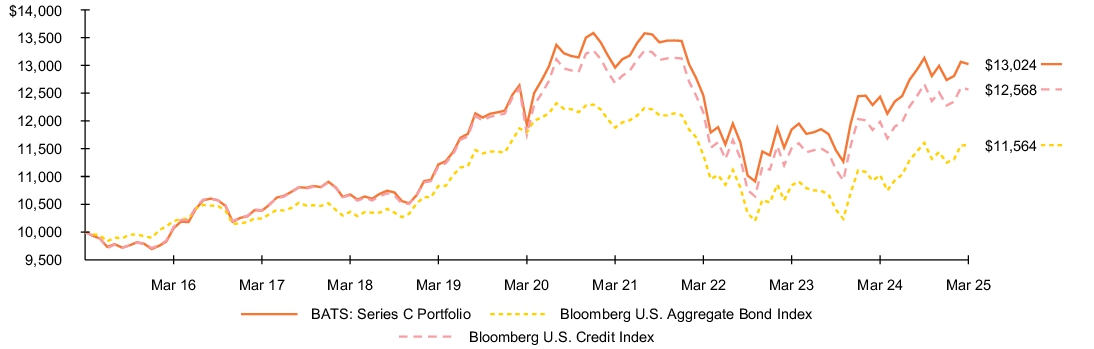
- For the reporting period ended March 31, 2025, the Fund returned 4.73%.
- For the same period, the Bloomberg U.S. Aggregate Bond Index returned 4.88% and the Bloomberg U.S. Credit Index returned 4.87%.
What contributed to performance?
The Fund’s allocations to the banking, utilities and technology sectors were the leading contributors.
What detracted from performance?
The Fund’s duration and yield curve positioning was the largest detractor, followed by allocations to the consumer services sector and non-U.S. government debt. (Duration is a measure of interest rate sensitivity).
The views expressed reflect the opinions of BlackRock as of the date of this report and are subject to change based on changes in market, economic or other conditions. These views are not intended to be a forecast of future events and are no guarantee of future results.
Fund performance
Cumulative performance: April 1, 2015 through March 31, 2025
Initial investment of $10,000
See “Average annual total returns” for additional information on fund performance.
Average annual total returns
| 1 Year | 5 Years | 10 Years | |||
| 4.73 | % | 1.78 | % | 2.68 | % |
| 4.88 | (0.40 | ) | 1.46 | ||
| 4.87 | 1.35 | 2.31 |
Key Fund statistics
| $439,499,546 |
| 837 |
| $0 |
| 446% |
What did the Fund invest in?
(as of March 31, 2025)
Portfolio composition
| Investment Type | Percent of Total Investments(a) |
|
| 88.9 | % | |
| 3.3 | ||
| 3.0 | ||
| 3.0 | ||
| 0.9 | ||
| 0.9 |
Credit quality allocation
| Credit Rating(b) | Percent of Total Investments(a) |
|
| 3.0 | % | |
| 5.4 | ||
| 27.0 | ||
| 61.1 | ||
| 2.3 | ||
| 1.2 |
| Excludes short-term securities, short investments and options, if any. |
| For purposes of this report, credit quality ratings shown above reflect the highest rating assigned by either S&P Global Ratings or Moody’s Investors Service, Inc. if ratings differ. These rating agencies are independent, nationally recognized statistical rating organizations and are widely used. Investment grade ratings are credit ratings of BBB/Baa or higher. Below investment grade ratings are credit ratings of BB/Ba or lower. Investments designated N/R are not rated by either rating agency. Unrated investments do not necessarily indicate low credit quality. Credit quality ratings are subject to change. |
| The investment adviser evaluates the credit quality of unrated investments based upon certain factors including, but not limited to, credit ratings for similar investments and financial analysis of sectors, individual investments and/or issuers. Using this approach, the investment adviser has deemed unrated U.S. Government Sponsored Agency Securities and U.S. Treasury Obligations to be of similar credit quality as investments rated AAA/Aaa. |
What were the Fund costs for the last year?
(based on a hypothetical $10,000 investment)
| Fund name | Costs of a $10,000 investment |
Costs paid as a percentage of a $10,000 investment |
| $0(a) | 0.00%(b) |
| Rounds to less than $1. |
| Rounds to less than 0.01%. |
How did the Fund perform last year?
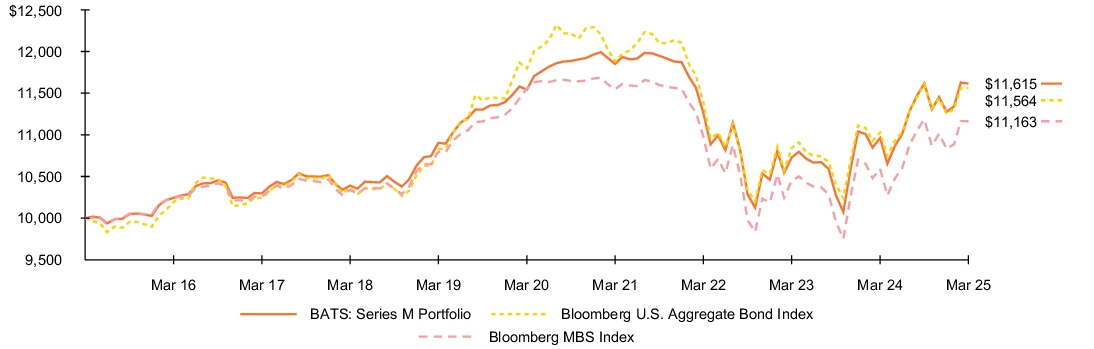
- For the reporting period ended March 31, 2025, the Fund returned 5.96%.
- For the same period, the Bloomberg U.S. Aggregate Bond Index returned 4.88% and the Bloomberg MBS Index returned 5.39%.
What contributed to performance?
Out-of-benchmark allocations to commercial mortgage-backed securities were a leading contributor to performance. Agency mortgage derivatives and fixed rate collateralized mortgage obligations also contributed positively. Within residential mortgage-backed securities, the Fund’s active benchmark strategy, which implements relative value decisions between specified pools and to-be-announced securities (“TBAs”) contributed positively to performance.
What detracted from performance?
The Fund’s active management of duration and corresponding sensitivity to changes in interest rates detracted modestly from performance over the period.
The views expressed reflect the opinions of BlackRock as of the date of this report and are subject to change based on changes in market, economic or other conditions. These views are not intended to be a forecast of future events and are no guarantee of future results.
Fund performance
Cumulative performance: April 1, 2015 through March 31, 2025
Initial investment of $10,000
See “Average annual total returns” for additional information on fund performance.
Average annual total returns
| 1 Year | 5 Years | 10 Years | |||
| 5.96 | % | 0.13 | % | 1.51 | % |
| 4.88 | (0.40 | ) | 1.46 | ||
| 5.39 | (0.69 | ) | 1.11 |
Key Fund statistics
| $1,295,016,533 |
| 1,145 |
| $0 |
| 892% |
What did the Fund invest in?
(as of March 31, 2025)
Portfolio composition
| Investment Type | Percent of Total Investments(a) |
|
| 93.1 | % | |
| 5.4 | ||
| 1.5 |
Credit quality allocation
| Credit Rating(b) | Percent of Total Investments(a) |
|
| 97.3 | % | |
| 0.2 | ||
| 0.2 | ||
| 0.1 | ||
| 2.2 |
| Excludes short-term securities, short investments and options, if any. |
| For purposes of this report, credit quality ratings shown above reflect the highest rating assigned by either S&P Global Ratings or Moody’s Investors Service, Inc. if ratings differ. These rating agencies are independent, nationally recognized statistical rating organizations and are widely used. Investment grade ratings are credit ratings of BBB/Baa or higher. Below investment grade ratings are credit ratings of BB/Ba or lower. Investments designated N/R are not rated by either rating agency. Unrated investments do not necessarily indicate low credit quality. Credit quality ratings are subject to change. |
| The investment adviser evaluates the credit quality of unrated investments based upon certain factors including, but not limited to, credit ratings for similar investments and financial analysis of sectors, individual investments and/or issuers. Using this approach, the investment adviser has deemed unrated U.S. Government Sponsored Agency Securities and U.S. Treasury Obligations to be of similar credit quality as investments rated AAA/Aaa. |
What were the Fund costs for the last year?
(based on a hypothetical $10,000 investment)
| Fund name | Costs of a $10,000 investment |
Costs paid as a percentage of a $10,000 investment |
| $0(a) | 0.00%(b) |
| Rounds to less than $1. |
| Rounds to less than 0.01%. |
How did the Fund perform last year?
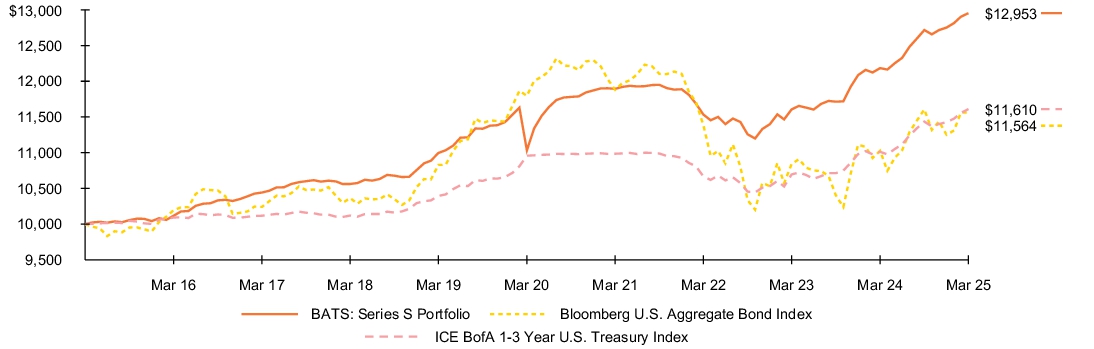
- For the reporting period ended March 31, 2025, the Fund returned 6.31%.
- For the same period, the Bloomberg U.S. Aggregate Bond Index returned 4.88% and the ICE BofA 1-3 Year U.S. Treasury Index returned 5.43%.
What contributed to performance?
The Fund’s allocation to investment-grade corporate bonds made the largest contribution to absolute performance. Allocations to asset-backed securities, U.S. Treasuries, agency residential mortgage-backed securities, and commercial mortgage-backed securities positively impacted returns, as well.
What detracted from performance?
At a time of positive performance for the Fund, no aspects of its positioning stood out as meaningful detractors. However, certain individual securities posted negative absolute returns in the period.
The views expressed reflect the opinions of BlackRock as of the date of this report and are subject to change based on changes in market, economic or other conditions. These views are not intended to be a forecast of future events and are no guarantee of future results.
Fund performance
Cumulative performance: April 1, 2015 through March 31, 2025
Initial investment of $10,000
See “Average annual total returns” for additional information on fund performance.
Average annual total returns
| 1 Year | 5 Years | 10 Years | |||
| 6.31 | % | 3.26 | % | 2.62 | % |
| 4.88 | (0.40 | ) | 1.46 | ||
| 5.43 | 1.16 | 1.50 |
Key Fund statistics
| $364,929,043 |
| 666 |
| $0 |
| 162% |
What did the Fund invest in?
(as of March 31, 2025)
Portfolio composition
| Investment Type | Percent of Total Investments(a) |
|
| 33.5 | % | |
| 24.0 | ||
| 16.9 | ||
| 14.2 | ||
| 11.0 | ||
| 0.4 |
Credit quality allocation
| Credit Rating(b) | Percent of Total Investments |
|
| 61.4 | % | |
| 1.7 | ||
| 12.9 | ||
| 19.0 | ||
| 5.0 |
| Excludes short-term securities, short investments and options, if any. |
| For purposes of this report, credit quality ratings shown above reflect the highest rating assigned by either S&P Global Ratings or Moody’s Investors Service, Inc. if ratings differ. These rating agencies are independent, nationally recognized statistical rating organizations and are widely used. Investment grade ratings are credit ratings of BBB/Baa or higher. Below investment grade ratings are credit ratings of BB/Ba or lower. Investments designated N/R are not rated by either rating agency. Unrated investments do not necessarily indicate low credit quality. Credit quality ratings are subject to change. |
| The investment adviser evaluates the credit quality of unrated investments based upon certain factors including, but not limited to, credit ratings for similar investments and financial analysis of sectors, individual investments and/or issuers. Using this approach, the investment adviser has deemed unrated U.S. Government Sponsored Agency Securities and U.S. Treasury Obligations to be of similar credit quality as investments rated AAA/Aaa. |
What were the Fund costs for the last year?
(based on a hypothetical $10,000 investment)
| Fund name | Costs of a $10,000 investment |
Costs paid as a percentage of a $10,000 investment |
| $0(a) | 0.00%(b) |
| Rounds to less than $1. |
| Rounds to less than 0.01%. |
How did the Fund perform last year?
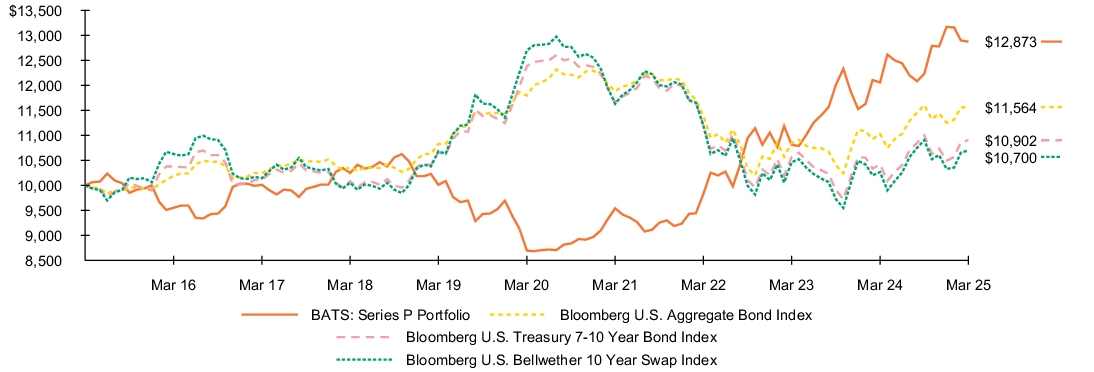
- For the reporting period ended March 31, 2025, the Fund returned 6.75%.
- For the same period, the Bloomberg U.S. Aggregate Bond Index returned 4.88% and the Bloomberg U.S. Treasury 7-10 Year Bond Index returned 4.65%.
What contributed to performance?
Allocations to cash and cash-like securities made the largest contribution to Fund performance. The Fund held cash as collateral in conjunction with its investments in U.S. Treasury futures and interest rate swaps.
The use and cost of derivatives will result in a negative contribution to returns when interest rates fall; however, the Fund’s strategy is designed to offset these costs by holding shares of BlackRock Allocation Target Shares: Series S Portfolio (“Series S Portfolio”), a short-term proprietary fund. The use of derivatives is necessary to achieve the Fund’s objective and should therefore be evaluated in a portfolio context and not as a standalone strategy. The Fund’s use of derivatives contributed to results.
The Fund’s position in the Series S Portfolio also contributed positively.
What detracted from performance?
At a time of positive performance for the Fund, no aspects of its positioning stood out as meaningful detractors. However, certain individual securities in BlackRock Allocation Target Shares Series S posted negative absolute returns during the reporting period.
The views expressed reflect the opinions of BlackRock as of the date of this report and are subject to change based on changes in market, economic or other conditions. These views are not intended to be a forecast of future events and are no guarantee of future results.
Fund performance
Cumulative performance: April 1, 2015 through March 31, 2025
Initial investment of $10,000
See “Average annual total returns” for additional information on fund performance.
Average annual total returns
| 1 Year | 5 Years | 10 Years | |||
| 6.75 | % | 8.17 | % | 2.56 | % |
| 4.88 | (0.40 | ) | 1.46 | ||
| 4.65 | (2.52 | ) | 0.87 | ||
| 4.24 | (3.37 | ) | 0.68 |
Key Fund statistics
| $3,481,645 |
| 16 |
| $0 |
| 134% |
What did the Fund invest in?
(as of March 31, 2025)
Portfolio composition
| Investment Type | Percent of Total Investments |
|
| 21.0 | % | |
| 79.0 |
What were the Fund costs for the last year?
(based on a hypothetical $10,000 investment)
| Fund name | Costs of a $10,000 investment |
Costs paid as a percentage of a $10,000 investment |
| $0(a) | 0.05% |
| Rounds to less than $1. |
How did the Fund perform last year?
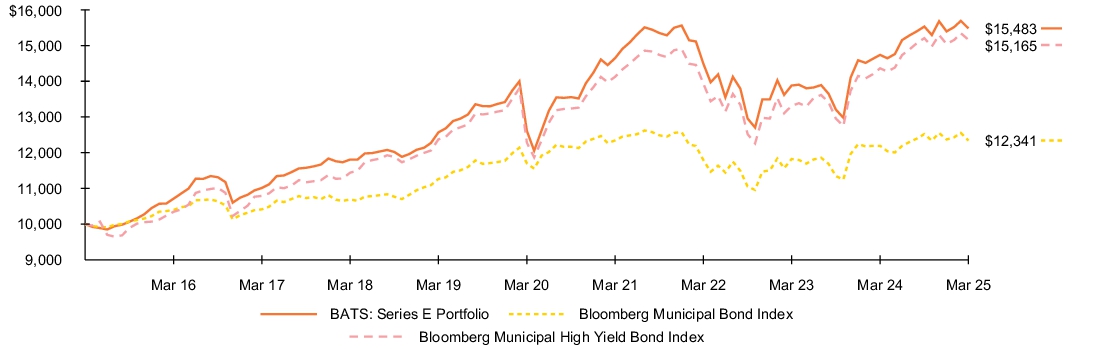
- For the reporting period ended March 31, 2025, the Fund returned 5.05%.
- For the same period, the Bloomberg Municipal Bond Index returned 1.22% and the Bloomberg Municipal High Yield Bond Index returned 5.59%.
What contributed to performance?
On a sector basis, other industries, utilities and healthcare were the largest contributors to absolute performance. In terms of ratings categories, non-rated bonds—which had a 41% portfolio weighting at the close of the period—were the largest contributors by a wide margin. More generally, high yield bonds outperformed investment-grade securities. Bonds with maturities of 25 years and longer were also significant contributors.
At the individual holding level, the Fund benefitted from strong total returns for Puerto Rico Electric Power Authority bonds, Puerto Rico contingent value securities, and the bonds of Brightline East and Brightline West (which were issued to finance a high-speed rail project between Las Vegas and Southern California).
What detracted from performance?
At a time of positive performance for the Fund, no sector, rating, maturity, or coupon category experienced a negative total return. A few individual tobacco bonds posted losses due to declining consumption figures, but the Fund’s overall position in the sector nonetheless delivered a gain. Short-duration, high-grade securities, while producing gains in absolute terms, made the smallest contribution.
The Fund’s cash weighting was slightly elevated as of March 31, 2025. Cash yields remained attractive, and the securities provided stability to the Fund in periods of volatility.
The views expressed reflect the opinions of BlackRock as of the date of this report and are subject to change based on changes in market, economic or other conditions. These views are not intended to be a forecast of future events and are no guarantee of future results.
Fund performance
Cumulative performance: April 1, 2015 through March 31, 2025
Initial investment of $10,000
See “Average annual total returns” for additional information on fund performance.
Average annual total returns
| 1 Year | 5 Years | 10 Years | |||
| 5.05 | % | 4.19 | % | 4.47 | % |
| 1.22 | 1.07 | 2.13 | |||
| 5.59 | 4.31 | 4.25 | |||
| 4.05 | 3.31 | ||||
| 2.73 | 2.21 |
Beginning July 29, 2024, the Fund started to compare its performance to that of the Customized Reference Benchmark comprised of 60% Bloomberg Municipal Bond: High Yield (non-Investment Grade) Total Return Index, 20% Bloomberg Municipal Bond Rated Baa Index, and 20% Bloomberg Municipal Investment Grade ex BBB. Fund management believes that the new benchmark is more representative of the types of investments held within the Fund. The Customized Reference Benchmark commenced on September 30, 2016.
Prior to July 29, 2024, the Fund compared its performance to that of the prior Customized Reference Benchmark, which is comprised of the Bloomberg Municipal Bond Index Total Return Index Value Unhedged (65%) and the Bloomberg Municipal Bond: High Yield (non-Investment Grade) Total Return Index (35%). The prior Customized Reference Benchmark commenced on September 30, 2016.
Key Fund statistics
| $527,280,263 |
| 655 |
| $0 |
| 23% |
What did the Fund invest in?
(as of March 31, 2025)
Sector allocation
| Sector | Percent of Total Investments |
|
| 35.9 | % | |
| 17.0 | ||
| 14.7 | ||
| 11.3 | ||
| 10.6 | ||
| 5.9 | ||
| 4.6 |
Credit quality allocation
| Credit Rating(a) | Percent of Total Investments |
|
| 2.8 | % | |
| 16.7 | ||
| 11.8 | ||
| 10.5 | ||
| 7.9 | ||
| 1.5 | ||
| 0.3 | ||
| 48.5 |
| For purposes of this report, credit quality ratings shown above reflect the highest rating assigned by either S&P Global Ratings or Moody’s Investors Service, Inc. if ratings differ. These rating agencies are independent, nationally recognized statistical rating organizations and are widely used. Investment grade ratings are credit ratings of BBB/Baa or higher. Below investment grade ratings are credit ratings of BB/Ba or lower. Investments designated N/R are not rated by either rating agency. Unrated investments do not necessarily indicate low credit quality. Credit quality ratings are subject to change. |
What were the Fund costs for the last year?
(based on a hypothetical $10,000 investment)
| Fund name | Costs of a $10,000 investment |
Costs paid as a percentage of a $10,000 investment |
| $0(a) | 0.01% |
| Rounds to less than $1. |
How did the Fund perform last year?
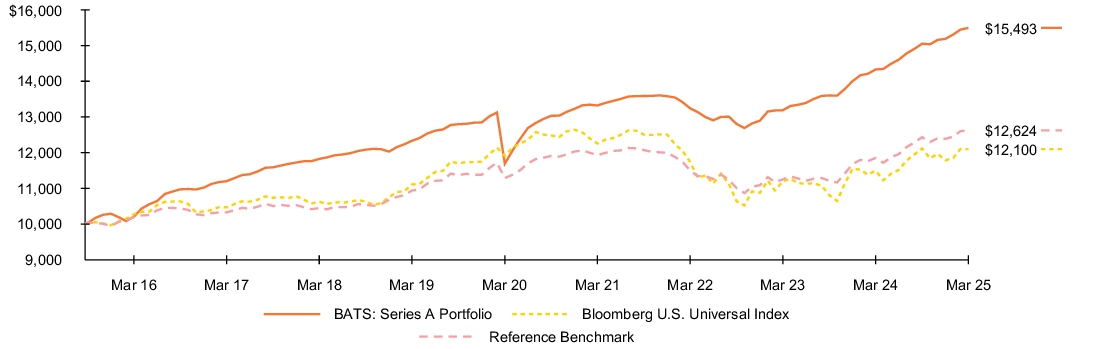
- For the reporting period ended March 31, 2025, the Fund returned 8.11%.
- For the same period, the Bloomberg U.S. Universal Index returned 5.24% and the Reference Benchmark returned 6.51%.
What contributed to performance?
All securitized asset classes contributed positively to the Fund’s performance. Contributions were led by exposure to non-agency residential mortgage-backed securities, particularly those backed by near prime, non-performing/re-performing and subprime loans. This was followed by holdings of single asset/single borrower senior tranches within commercial mortgage-backed securities and AAA-rated collateralized loan obligations (“CLOs”), as those categories posted the largest gains over the period. Allocations to AA-rated CLOs, private student loan asset-backed securities (“ABS”) and unsecured consumer ABS also showed positive returns.
The Fund held some private whole loan securities including commercial mortgage loans and consumer whole loans. These private holdings also produced positive returns.
What detracted from performance?
There were no material detractors from the Fund’s performance during the reporting period.
The views expressed reflect the opinions of BlackRock as of the date of this report and are subject to change based on changes in market, economic or other conditions. These views are not intended to be a forecast of future events and are no guarantee of future results.
Fund performance
Cumulative performance: September 21, 2015 through March 31, 2025
Initial investment of $10,000
See “Average annual total returns” for additional information on fund performance.
Average annual total returns
| 1 Year | 5 Years | Since Fund Inception |
|||
| 8.11 | % | 5.79 | % | 4.70 | % |
| 5.24 | 0.32 | 2.02 | |||
| 6.51 | 2.27 | 2.48 |
Key Fund statistics
| $3,576,385,769 |
| 1,753 |
| $0 |
| 50% |
What did the Fund invest in?
(as of March 31, 2025)
Portfolio composition
| Investment Type | Percent of Total Investments(a) |
|
| 50.0 | % | |
| 49.3 | ||
| 0.4 | ||
| 0.3 | ||
| (b) |
Credit quality allocation
| Credit Rating(c) | Percent of Total Investments(a) |
|
| 36.5 | % | |
| 5.2 | ||
| 2.8 | ||
| 2.9 | ||
| 3.4 | ||
| 0.8 | ||
| 1.7 | ||
| 1.2 | ||
| 0.9 | ||
| 0.1 | ||
| 44.5 |
| Excludes short-term securities, short investments and options, if any. |
| Rounds to less than 0.1%. |
| For purposes of this report, credit quality ratings shown above reflect the highest rating assigned by either S&P Global Ratings or Moody’s Investors Service, Inc. if ratings differ. These rating agencies are independent, nationally recognized statistical rating organizations and are widely used. Investment grade ratings are credit ratings of BBB/Baa or higher. Below investment grade ratings are credit ratings of BB/Ba or lower. Investments designated N/R are not rated by either rating agency. Unrated investments do not necessarily indicate low credit quality. Credit quality ratings are subject to change. |
| The investment adviser evaluates the credit quality of unrated investments based upon certain factors including, but not limited to, credit ratings for similar investments and financial analysis of sectors, individual investments and/or issuers. Using this approach, the investment adviser has deemed unrated U.S. Government Sponsored Agency Securities and U.S. Treasury Obligations to be of similar credit quality as investments rated AAA/Aaa. |
What were the Fund costs for the last year?
(based on a hypothetical $10,000 investment)
| Fund name | Costs of a $10,000 investment |
Costs paid as a percentage of a $10,000 investment |
| $0(a) | 0.00%(b) |
| Rounds to less than $1. |
| Rounds to less than 0.01%. |
How did the Fund perform last year?
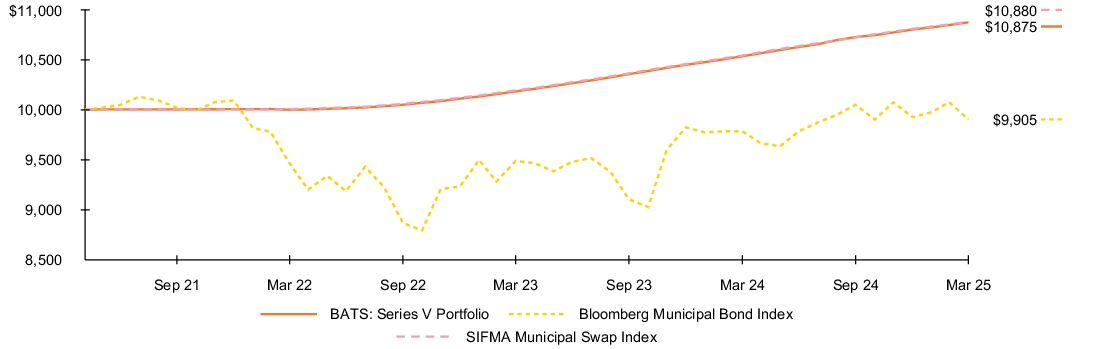
- For the reporting period ended March 31, 2025, the Fund returned 3.23%.
- For the same period, the Bloomberg Municipal Bond Index returned 1.22% and the SIFMA Municipal Swap Index returned 3.21%.
What contributed to performance?
The Fund maintained high levels of liquidity while providing an attractive yield primarily through its holdings of variable rate demand notes (“VRDNs”). The Fund also opportunistically laddered maturities in holdings of attractive municipal commercial paper and select fixed-rate, tax-backed local credits, through both municipal notes and bonds. The Fund maintained its bias for daily and weekly reset VRDNs while also holding select longer-dated commercial paper and municipal notes. The Fund’s weighted average maturity (“WAM”) of 29 days remained longer than the benchmark WAM of 7 days, as the Fund took advantage of opportunities presented by interest rate volatility to purchase fixed-rate securities when their yields appeared attractive relative to expected VRDN yields.
What detracted from performance?
There were no material detractors from the Fund’s performance during the reporting period.
The views expressed reflect the opinions of BlackRock as of the date of this report and are subject to change based on changes in market, economic or other conditions. These views are not intended to be a forecast of future events and are no guarantee of future results.
Fund performance
Cumulative performance: May 5, 2021 through March 31, 2025
Initial investment of $10,000
See “Average annual total returns” for additional information on fund performance.
Average annual total returns
| 1 Year | Since Fund Inception |
||
| 3.23 | % | 2.17 | % |
| 1.22 | (0.24 | ) | |
| 3.21 | 2.19 |
Key Fund statistics
| $125,127,991 |
| 81 |
| $0 |
| 233% |
What did the Fund invest in?
(as of March 31, 2025)
Sector allocation
| Sector | Percent of Total Investments |
|
| 26.5 | % | |
| 25.1 | ||
| 19.3 | ||
| 15.8 | ||
| 12.5 | ||
| 0.8 |
| [1] | Rounds to less than $1. |
| [2] | Rounds to less than 0.01%. |
| [3] | Rounds to less than $1. |
| [4] | Rounds to less than 0.01%. |
| [5] | Rounds to less than $1. |
| [6] | Rounds to less than 0.01%. |
| [7] | Rounds to less than $1. |
| [8] | Rounds to less than 0.01%. |
| [9] | Rounds to less than $1. |
| [10] | Rounds to less than $1. |
| [11] | Rounds to less than $1. |
| [12] | Rounds to less than 0.01%. |