Shareholder Report
Mar. 31, 2025
USD ($)
Holding
This report describes changes to the Fund that occurred during the reporting period.
What were the Fund costs for the last year?
(based on a hypothetical $10,000 investment)
| Class name | Costs of a $10,000 investment |
Costs paid as a percentage of a $10,000 investment |
| $189 | 1.85% |
How did the Fund perform last year?
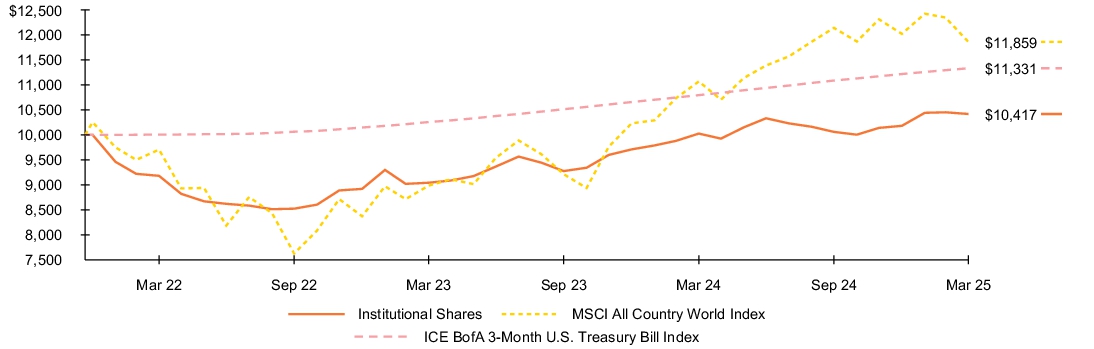
- For the reporting period ended March 31, 2025, the Fund's Institutional Shares returned 3.91%.
- For the same period, the MSCI All Country World Index returned 7.15% and the ICE BofA 3-Month U.S. Treasury Bill Index returned 4.97%.
What contributed to performance?
On a sector level, allocations to financials and industrials were the primary contributors to absolute performance. In regional terms, exposure to Asia was the top contributor, followed by the United Kingdom. Individual securities held within mid- and large-cap stocks drove positive performance.
The Fund used derivatives as part of its investment strategy, including the establishment of both long and synthetic short positions and the use of leverage for the purpose of increasing the economic exposure of the Fund beyond the value of its net assets, contributing to the Fund’s positive return for the period. The Fund’s cash position had no material impact on performance.
What detracted from performance?
On a sector level, allocations to communication services and index derivatives were the primary detractors from absolute performance. In regional terms, exposure to the U.S. was the only detractor as all other regions generated positive returns. Performance was impacted negatively by the Fund’s holdings of smaller cap stocks.
The views expressed reflect the opinions of BlackRock as of the date of this report and are subject to change based on changes in market, economic or other conditions. These views are not intended to be a forecast of future events and are no guarantee of future results.
Fund performance
Cumulative performance: December 21, 2021 through March 31, 2025
Initial investment of $10,000
See “Average annual total returns” for additional information on fund performance.
Average annual total returns
| 1 Year | Since Fund Inception |
||
| 3.91 | % | 1.26 | % |
| 7.15 | 5.35 | ||
| 4.97 | 3.89 |
On December 1, 2023, the Fund began to compare its performance to the standard pricing time of the ICE BofA 3-Month U.S. Treasury Bill Index (the “Index”). Index data prior to March 1, 2021 is for the Index’s standard pricing time of 3pm. Index data from March 1, 2021 through November 30, 2023 is for a custom 4pm pricing variant of the Index. Index returns beginning on December 1, 2023 reflect the Index’s new standard pricing time of 4pm. The change of the Index’s standard pricing time from 3pm to 4pm resulted in the discontinuation of the custom 4pm pricing variant used from March 1, 2021 through November 30, 2023.
Key Fund statistics
| $10,479,130 |
| 1 |
| $0 |
| 48% |
What did the Fund invest in?
(as of March 31, 2025)
Portfolio composition
| Investment Type | Percent of Total Investments |
|
| 100.0 | % |
Material fund changes
This is a summary of certain changes and planned changes to the Fund since March 31, 2024.
On February 20, 2025, the Fund’s Board approved a proposal to liquidate the Fund. Accordingly, effective April 4, 2025, the Fund no longer accepted purchase orders and the Fund was terminated on April 11, 2025.
This report describes changes to the Fund that occurred during the reporting period.
What were the Fund costs for the last year?
(based on a hypothetical $10,000 investment)
| Class name | Costs of a $10,000 investment |
Costs paid as a percentage of a $10,000 investment |
| $214 | 2.10% |
How did the Fund perform last year?
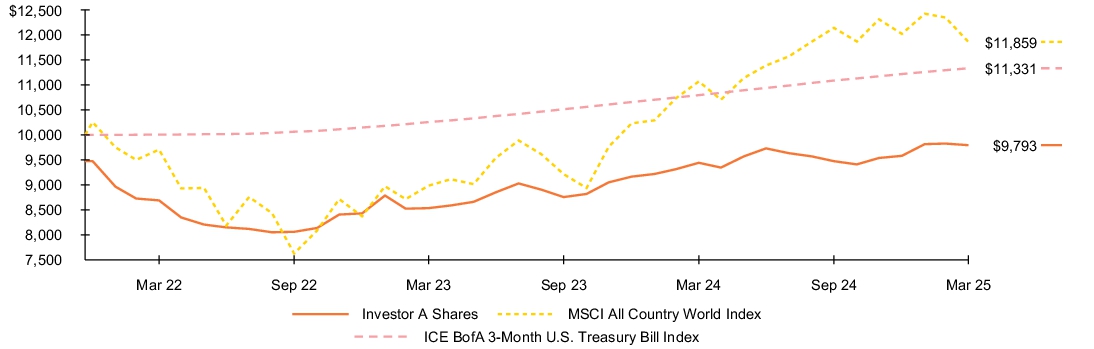
- For the reporting period ended March 31, 2025, the Fund's Investor A Shares returned 3.73%.
- For the same period, the MSCI All Country World Index returned 7.15% and the ICE BofA 3-Month U.S. Treasury Bill Index returned 4.97%.
What contributed to performance?
On a sector level, allocations to financials and industrials were the primary contributors to absolute performance. In regional terms, exposure to Asia was the top contributor, followed by the United Kingdom. Individual securities held within mid- and large-cap stocks drove positive performance.
The Fund used derivatives as part of its investment strategy, including the establishment of both long and synthetic short positions and the use of leverage for the purpose of increasing the economic exposure of the Fund beyond the value of its net assets, contributing to the Fund’s positive return for the period. The Fund’s cash position had no material impact on performance.
What detracted from performance?
On a sector level, allocations to communication services and index derivatives were the primary detractors from absolute performance. In regional terms, exposure to the U.S. was the only detractor as all other regions generated positive returns. Performance was impacted negatively by the Fund’s holdings of smaller cap stocks.
The views expressed reflect the opinions of BlackRock as of the date of this report and are subject to change based on changes in market, economic or other conditions. These views are not intended to be a forecast of future events and are no guarantee of future results.
Fund performance
Cumulative performance: December 21, 2021 through March 31, 2025
Initial investment of $10,000
See “Average annual total returns” for additional information on fund performance.
Average annual total returns
| 1 Year | Since Fund Inception |
||
| 3.73 | % | 1.01 | % |
| (1.72 | ) | (0.64 | ) |
| 7.15 | 5.35 | ||
| 4.97 | 3.89 |
On December 1, 2023, the Fund began to compare its performance to the standard pricing time of the ICE BofA 3-Month U.S. Treasury Bill Index (the “Index”). Index data prior to March 1, 2021 is for the Index’s standard pricing time of 3pm. Index data from March 1, 2021 through November 30, 2023 is for a custom 4pm pricing variant of the Index. Index returns beginning on December 1, 2023 reflect the Index’s new standard pricing time of 4pm. The change of the Index’s standard pricing time from 3pm to 4pm resulted in the discontinuation of the custom 4pm pricing variant used from March 1, 2021 through November 30, 2023.
Key Fund statistics
| $10,479,130 |
| 1 |
| $0 |
| 48% |
What did the Fund invest in?
(as of March 31, 2025)
Portfolio composition
| Investment Type | Percent of Total Investments |
|
| 100.0 | % |
Material fund changes
This is a summary of certain changes and planned changes to the Fund since March 31, 2024.
On February 20, 2025, the Fund’s Board approved a proposal to liquidate the Fund. Accordingly, effective April 4, 2025, the Fund no longer accepted purchase orders and the Fund was terminated on April 11, 2025.
This report describes changes to the Fund that occurred during the reporting period.
What were the Fund costs for the last year?
(based on a hypothetical $10,000 investment)
| Class name | Costs of a $10,000 investment |
Costs paid as a percentage of a $10,000 investment |
| $184 | 1.80% |
How did the Fund perform last year?
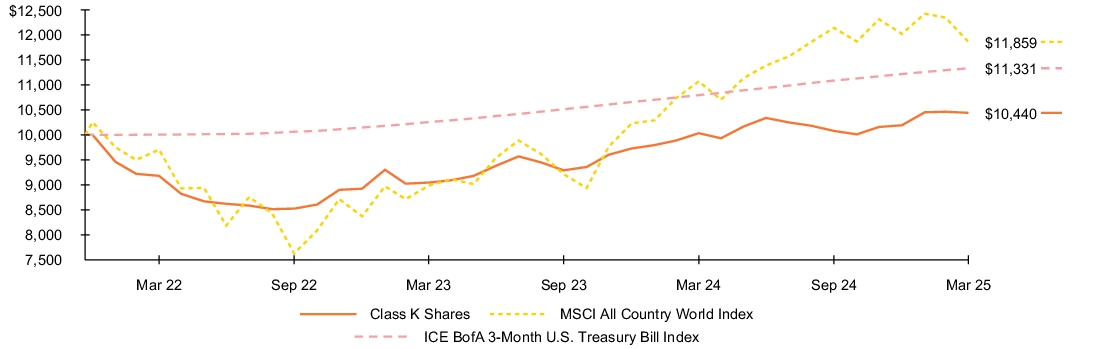
- For the reporting period ended March 31, 2025, the Fund's Class K Shares returned 4.05%.
- For the same period, the MSCI All Country World Index returned 7.15% and the ICE BofA 3-Month U.S. Treasury Bill Index returned 4.97%.
What contributed to performance?
On a sector level, allocations to financials and industrials were the primary contributors to absolute performance. In regional terms, exposure to Asia was the top contributor, followed by the United Kingdom. Individual securities held within mid- and large-cap stocks drove positive performance.
The Fund used derivatives as part of its investment strategy, including the establishment of both long and synthetic short positions and the use of leverage for the purpose of increasing the economic exposure of the Fund beyond the value of its net assets, contributing to the Fund’s positive return for the period. The Fund’s cash position had no material impact on performance.
What detracted from performance?
On a sector level, allocations to communication services and index derivatives were the primary detractors from absolute performance. In regional terms, exposure to the U.S. was the only detractor as all other regions generated positive returns. Performance was impacted negatively by the Fund’s holdings of smaller cap stocks.
The views expressed reflect the opinions of BlackRock as of the date of this report and are subject to change based on changes in market, economic or other conditions. These views are not intended to be a forecast of future events and are no guarantee of future results.
Fund performance
Cumulative performance: December 21, 2021 through March 31, 2025
Initial investment of $10,000
See “Average annual total returns” for additional information on fund performance.
Average annual total returns
| 1 Year | Since Fund Inception |
||
| 4.05 | % | 1.32 | % |
| 7.15 | 5.35 | ||
| 4.97 | 3.89 |
On December 1, 2023, the Fund began to compare its performance to the standard pricing time of the ICE BofA 3-Month U.S. Treasury Bill Index (the “Index”). Index data prior to March 1, 2021 is for the Index’s standard pricing time of 3pm. Index data from March 1, 2021 through November 30, 2023 is for a custom 4pm pricing variant of the Index. Index returns beginning on December 1, 2023 reflect the Index’s new standard pricing time of 4pm. The change of the Index’s standard pricing time from 3pm to 4pm resulted in the discontinuation of the custom 4pm pricing variant used from March 1, 2021 through November 30, 2023.
Key Fund statistics
| $10,479,130 |
| 1 |
| $0 |
| 48% |
What did the Fund invest in?
(as of March 31, 2025)
Portfolio composition
| Investment Type | Percent of Total Investments |
|
| 100.0 | % |
Material fund changes
This is a summary of certain changes and planned changes to the Fund since March 31, 2024.
On February 20, 2025, the Fund’s Board approved a proposal to liquidate the Fund. Accordingly, effective April 4, 2025, the Fund no longer accepted purchase orders and the Fund was terminated on April 11, 2025.