Shareholder Report
Mar. 31, 2025
USD ($)
$ / shares
This report describes changes to the Fund that occurred during the reporting period.
WHAT WERE THE FUND COSTS FOR THE PAST YEAR? (based on a hypothetical $10,000 investment)
|
Class Name
|
Costs of a $10,000 investment
|
Costs paid as a percentage of a $10,000 investment
|
|
Class I
|
$49
|
0.48%
|
HOW DID THE FUND PERFORM LAST YEAR AND WHAT AFFECTED ITS PERFORMANCE?
|
•
|
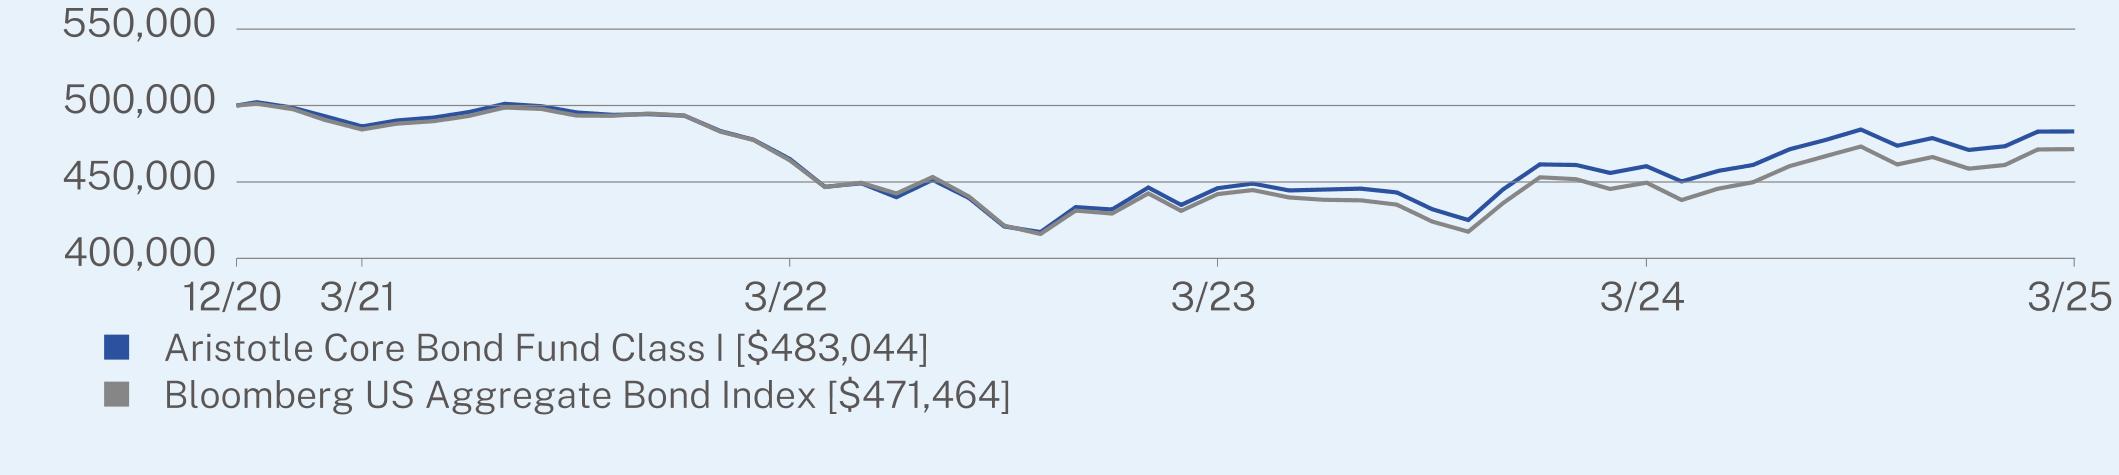
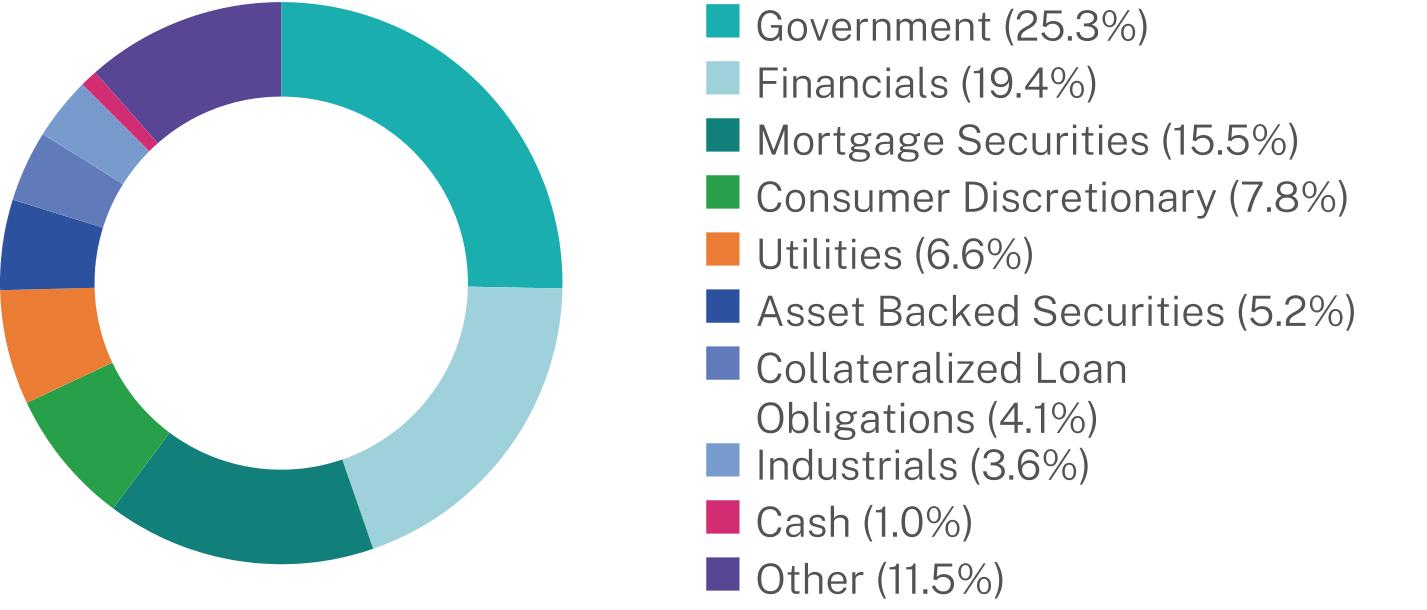
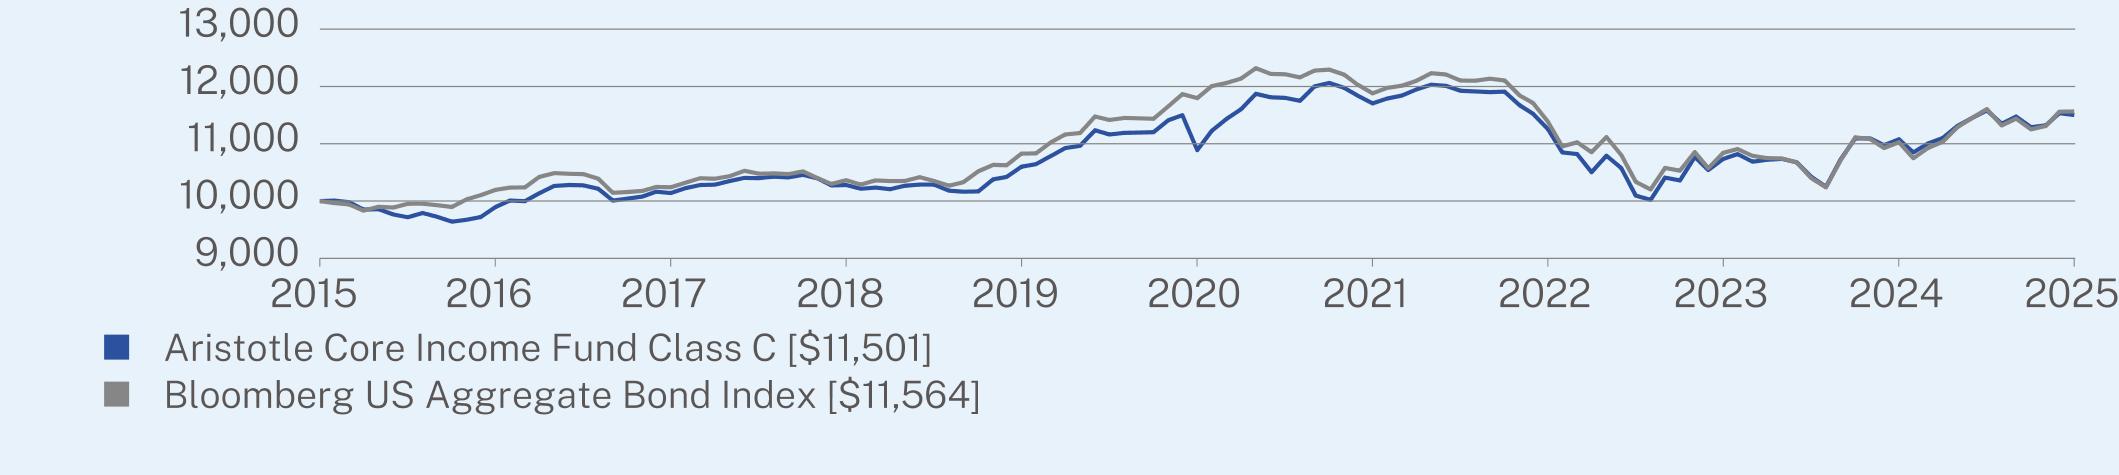
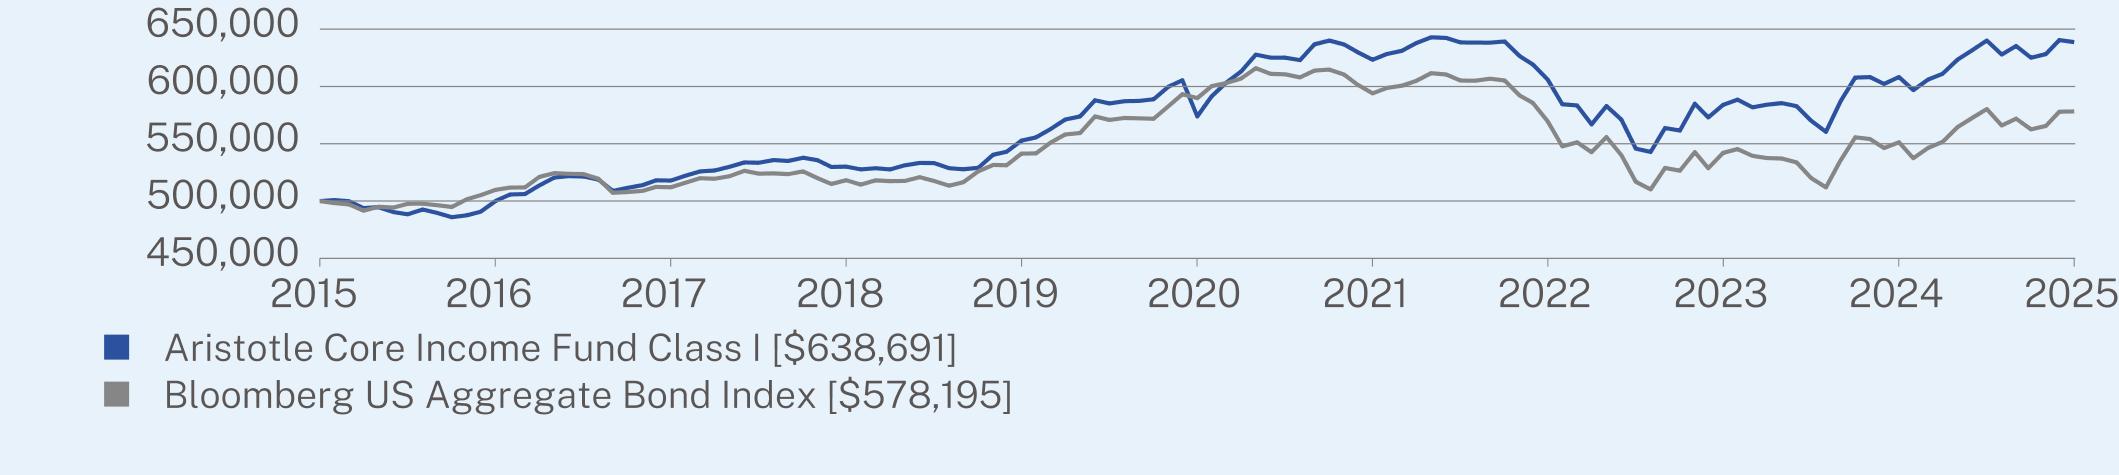
For the 12-month period ended March 31, 2025, the Fund outperformed its performance benchmark, the Bloomberg US Aggregate Bond Index. The Fund primarily invests in a broad range of investment grade debt securities, including corporate bonds, mortgage-related securities, asset-backed securities, debt securities issued by the U.S. government or its related agencies and U.S. dollar-denominated debt securities issued by developed foreign governments and corporation.
|
|
•
|
The front end of the curve and intermediate portions of the curve were supported by the yield curve inversion seen through September 2024. Even post re-inversion, yields remained elevated as compared to recent history, which was beneficial to return. Additionally, corporate spreads remained quite favorable for most of the period.
|
|
•
|
Exposure to credit-sensitive sectors benefited performance for most of the period as credit remained largely well supported. The intermediate curve positioning and elevated yield profile helped to insulate the full effect of credit spread widening seen on a periodic basis as compared to a long duration based offerings.
|
|
•
|
By credit quality, BBB-rated credits were most beneficial to performance (corporate investment grade bonds) followed by AAA-rated credits (mostly securitized assets). On the other hand, agency mortgage exposure and cash holdings were least additive to return.
|
|
•
|
Positive contributions to relative performance were led by active asset class allocation.
|
|
•
|
While duration moved over the last twelve months, the point-to-point Fund duration was nearly flat. The Fund remained roughly inline with benchmark duration. The Fund benefited from an elevated yield environment over the period. On a year-over-year basis, we materially increased the government, agency and non-agency exposure. The Fund also significantly reduced the investment grade corporate bond and asset-backed security exposure over the period.
|
ANNUAL AVERAGE TOTAL RETURN (%)
|
|
1 Year
|
Since Inception
(12/14/2020) |
|
Class I (without sales charge)
|
4.94
|
-0.80
|
|
Bloomberg US Aggregate Bond Index
|
4.88
|
-1.36
|
Visit https://www.aristotlefunds.com/resources/prospectuses-reports for more recent performance information.
KEY FUND STATISTICS (as of March 31, 2025)
|
Net Assets
|
$39,123,189
|
|
Number of Holdings
|
127
|
|
Net Advisory Fee
|
$96,476
|
|
Portfolio Turnover Rate
|
76%
|
|
Top 10 Issuers
|
(%)
|
|
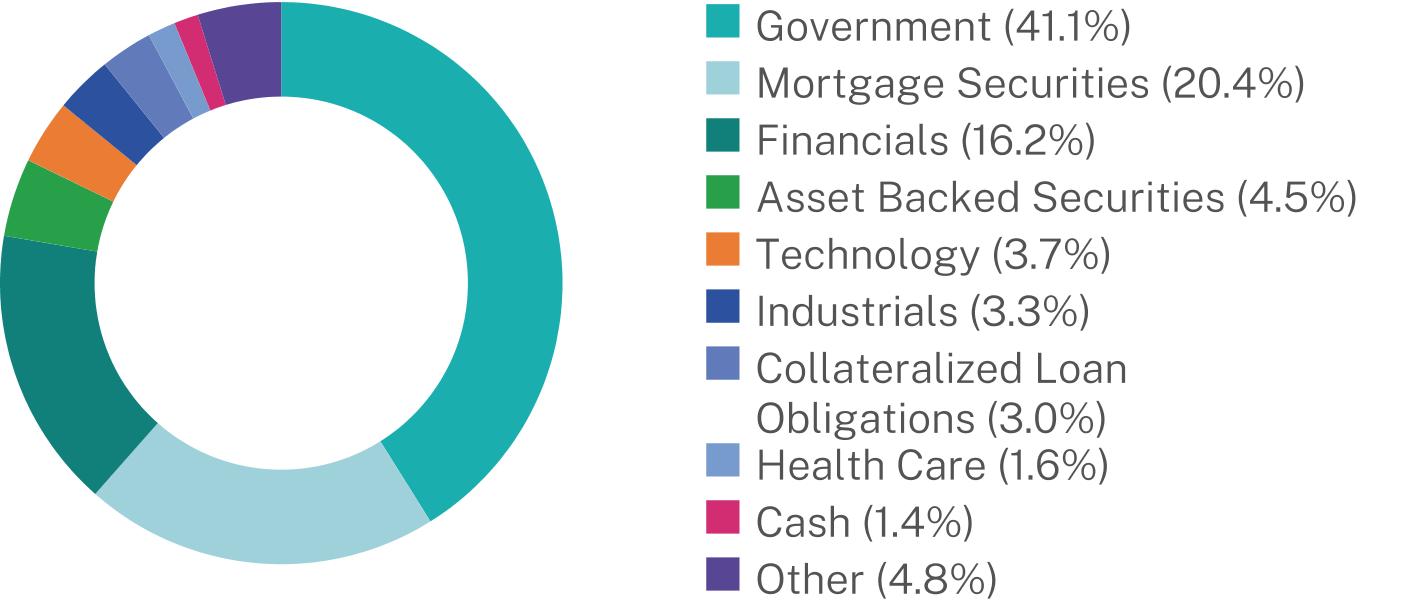
United States Treasury Note/Bond
|
41.1%
|
|
Federal National Mortgage Association
|
1.8%
|
|
Bank of America Corp.
|
1.6%
|
|
UBS Group AG
|
1.5%
|
|
Morgan Stanley
|
1.3%
|
|
Federal National Mortgage Association
|
1.3%
|
|
Federal National Mortgage Association
|
1.1%
|
|
Oracle Corp.
|
1.1%
|
|
Goldman Sachs Group, Inc.
|
1.0%
|
|
COLT Funding LLC
|
1.0%
|
Fund Name Change:
The Fund changed its name from Aristotle ESG Core Bond Fund on February 17, 2025.
Changes to Fund’s Investment Objective or Goals:
The Fund changed its Investment Goal to remove references to consideration of environmental, social or governance (“ESG”) factors on February 17, 2025.
Changes to the Fund’s Principal Investment Strategy:
The Fund changed its Principal Investment Strategies by adding a policy to invest at least 80% of its assets in debt securities. In addition, effective February 17, 2025, because the sub-adviser’s investment process no longer considers ESG criteria as part of its investment process, disclosure related to the sub-adviser’s use of ESG exclusionary screens and ESG metrics has been removed from the Fund’s Principal Investment Strategies. In connection with these changes, disclosure regarding the types of non-agency asset-backed and mortgage-related securities in which the Fund previously invested has been removed.
Changes to Fund’s Principal Risks:
As part of these Principal Investment Strategies changes, in the Fund’s Principal Risks, ESG Criteria Risk was removed, Mortgage-Related and Other Asset-Backed Securities Risk and Foreign Investment Risk were revised and Sector Focus Risk was added.
Changes to Shareholder Fees (fees paid directly from your investment).
Effective April 1, 2024, the Fund’s Advisory Fee was reduced from 0.38% to 0.35% and the Supervision and Administration Fee for Class I has been increased from 0.10% to 0.13%. As a result of these changes, there has been no change to the Fund’s total Management Fee for Class I.
Changes to Fund’s Portfolio Manager or Portfolio Management Team:
Effective March 1, 2025, Jeff Klingelhofer, CFA, has been added as a Portfolio Manager of the Fund.
This report describes changes to the Fund that occurred during the reporting period.
WHAT WERE THE FUND COSTS FOR THE PAST YEAR? (based on a hypothetical $10,000 investment)
|
Class Name
|
Costs of a $10,000 investment
|
Costs paid as a percentage of a $10,000 investment
|
|
Class I-2
|
$49
|
0.48%
|
HOW DID THE FUND PERFORM LAST YEAR AND WHAT AFFECTED ITS PERFORMANCE?
|
•
|
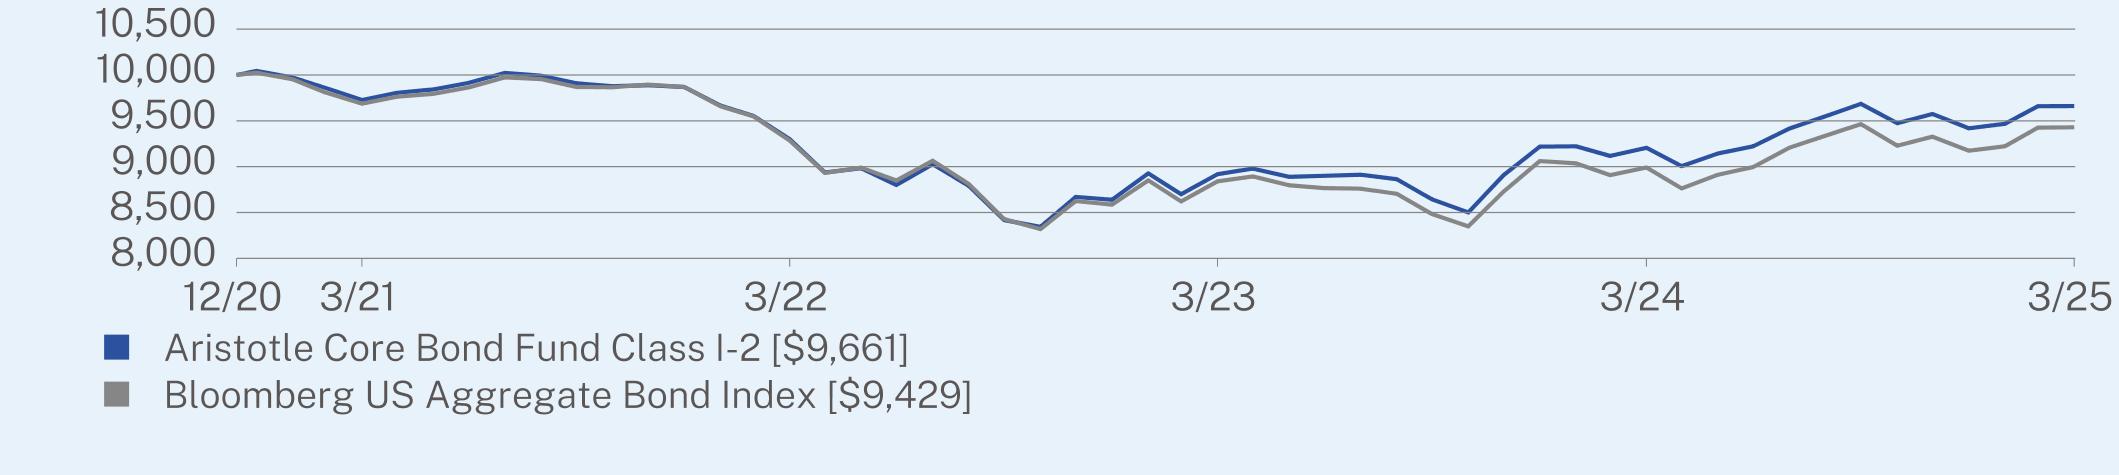
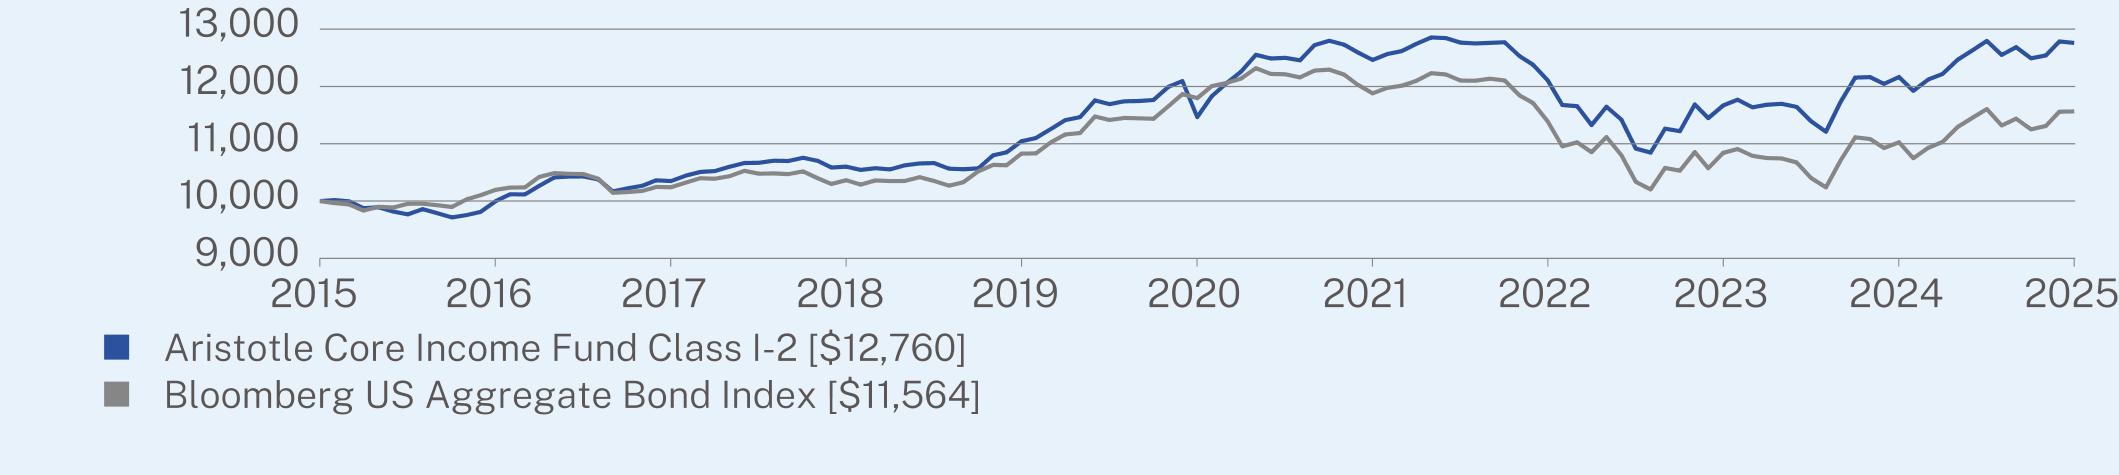
For the 12-month period ended March 31, 2025, the Fund outperformed its performance benchmark, the Bloomberg US Aggregate Bond Index. The Fund primarily invests in a broad range of investment grade debt securities, including corporate bonds, mortgage-related securities, asset-backed securities, debt securities issued by the U.S. government or its related agencies and U.S. dollar-denominated debt securities issued by developed foreign governments and corporation.
|
|
•
|
The front end of the curve and intermediate portions of the curve were supported by the yield curve inversion seen through September 2024. Even post re-inversion, yields remained elevated as compared to recent history, which was beneficial to return. Additionally, corporate spreads remained quite favorable for most of the period.
|
|
•
|
Exposure to credit-sensitive sectors benefited performance for most of the period as credit remained largely well supported. The intermediate curve positioning and elevated yield profile helped to insulate the full effect of credit spread widening seen on a periodic basis as compared to a long duration based offerings.
|
|
•
|
By credit quality, BBB-rated credits were most beneficial to performance (corporate investment grade bonds) followed by AAA-rated credits (mostly securitized assets). On the other hand, agency mortgage exposure and cash holdings were least additive to return.
|
|
•
|
Positive contributions to relative performance were led by active asset class allocation.
|
|
•
|
While duration moved over the last twelve months, the point-to-point Fund duration was nearly flat. The Fund remained roughly inline with benchmark duration. The Fund benefited from an elevated yield environment over the period. On a year-over-year basis, we materially increased the government, agency and non-agency exposure. The Fund also significantly reduced the investment grade corporate bond and asset-backed security exposure over the period.
|
ANNUAL AVERAGE TOTAL RETURN (%)
|
|
1 Year
|
Since Inception
(12/14/2020) |
|
Class I-2 (without sales charge)
|
4.93
|
-0.80
|
|
Bloomberg US Aggregate Bond Index
|
4.88
|
-1.36
|
Visit https://www.aristotlefunds.com/resources/prospectuses-reports for more recent performance information.
KEY FUND STATISTICS (as of March 31, 2025)
|
Net Assets
|
$39,123,189
|
|
Number of Holdings
|
127
|
|
Net Advisory Fee
|
$96,476
|
|
Portfolio Turnover Rate
|
76%
|
|
Top 10 Issuers
|
(%)
|
|
United States Treasury Note/Bond
|
41.1%
|
|
Federal National Mortgage Association
|
1.8%
|
|
Bank of America Corp.
|
1.6%
|
|
UBS Group AG
|
1.5%
|
|
Morgan Stanley
|
1.3%
|
|
Federal National Mortgage Association
|
1.3%
|
|
Federal National Mortgage Association
|
1.1%
|
|
Oracle Corp.
|
1.1%
|
|
Goldman Sachs Group, Inc.
|
1.0%
|
|
COLT Funding LLC
|
1.0%
|

Fund Name Change:
The Fund changed its name from Aristotle ESG Core Bond Fund on February 17, 2025.
Changes to Fund’s Investment Objective or Goals:
The Fund changed its Investment Goal to remove references to consideration of environmental, social or governance (“ESG”) factors on February 17, 2025.
Changes to the Fund’s Principal Investment Strategy:
The Fund changed its Principal Investment Strategies by adding a policy to invest at least 80% of its assets in debt securities. In addition, effective February 17, 2025, because the sub-adviser’s investment process no longer considers ESG criteria as part of its investment process, disclosure related to the sub-adviser’s use of ESG exclusionary screens and ESG metrics has been removed from the Fund’s Principal Investment Strategies. In connection with these changes, disclosure regarding the types of non-agency asset-backed and mortgage-related securities in which the Fund previously invested has been removed.
Changes to Fund’s Principal Risks:
As part of these Principal Investment Strategies changes, in the Fund’s Principal Risks, ESG Criteria Risk was removed, Mortgage-Related and Other Asset-Backed Securities Risk and Foreign Investment Risk were revised and Sector Focus Risk was added.
Changes to Shareholder Fees (fees paid directly from your investment).
Effective April 1, 2024, the Fund’s Advisory Fee was reduced from 0.38% to 0.35% and the Supervision and Administration Fee for Class I-2 has been increased from 0.10% to 0.13%. As a result of these changes, there has been no change to the Fund’s total Management Fee for Class I-2.
Changes to Fund’s Portfolio Manager or Portfolio Management Team:
Effective March 1, 2025, Jeff Klingelhofer, CFA, has been added as a Portfolio Manager of the Fund.
This report describes changes to the Fund that occurred during the reporting period.
WHAT WERE THE FUND COSTS FOR THE PAST YEAR? (based on a hypothetical $10,000 investment)
|
Class Name
|
Costs of a $10,000 investment
|
Costs paid as a percentage of a $10,000 investment
|
|
Class A
|
$87
|
0.85%
|
HOW DID THE FUND PERFORM LAST YEAR AND WHAT AFFECTED ITS PERFORMANCE?
|
•
|
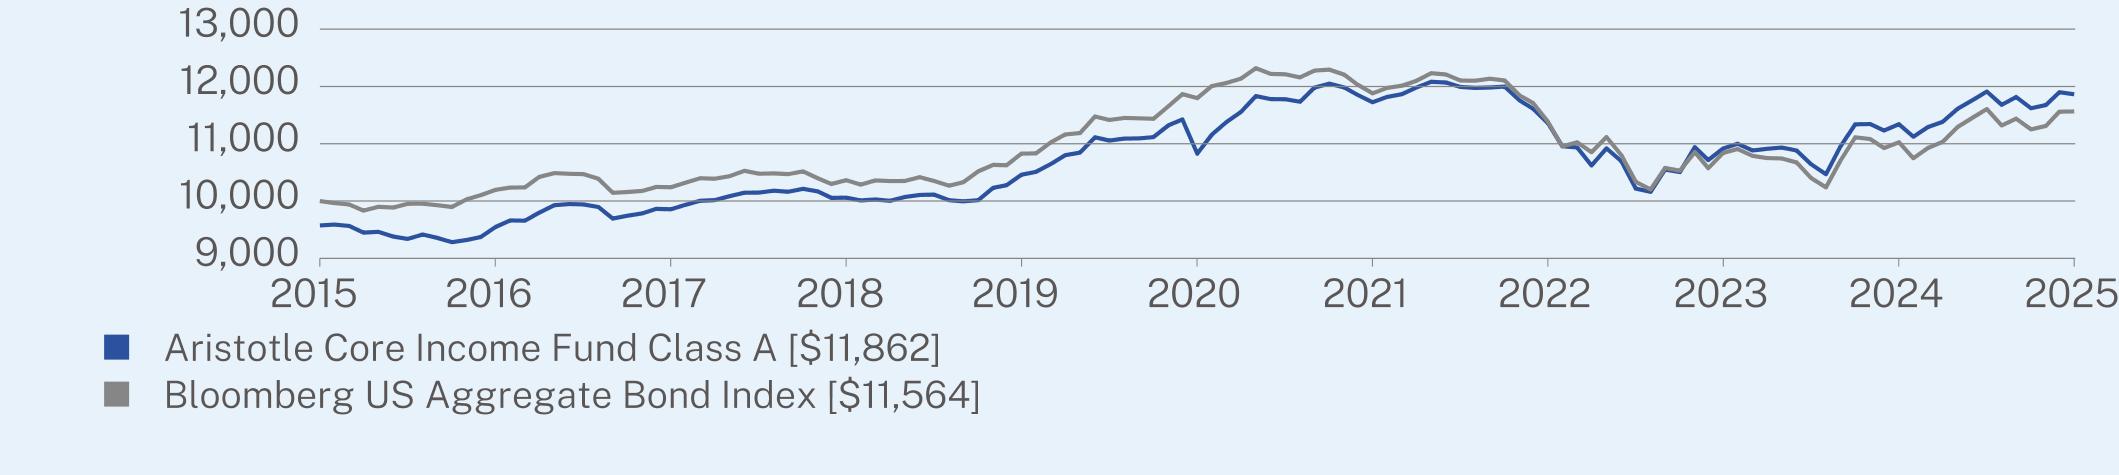
For the 12-month period ended March 31, 2025, the Fund underperformed its performance benchmark, the Bloomberg US Aggregate Bond Index. The Fund invests principally in income-producing debt instruments.
|
|
•
|
The front end of the curve and intermediate portions of the curve were supported by the yield curve inversion seen through September 2024. Even post re-inversion, yields remained elevated as compared to recent history, which was beneficial to return. Additionally, corporate spreads remained quite favorable for most of the period.
|
|
•
|
Exposure to credit-sensitive sectors benefited performance for most of the period as credit remained largely well supported. The intermediate curve positioning and elevated yield profile helped to insulate the full effect of credit spread widening seen on a periodic basis as compared to a long duration based offerings.
|
|
•
|
By credit quality, BBB-rated credits were most beneficial to performance (corporate investment grade bonds) followed by AAA-rated credits (mostly securitized assets). On the other hand, non-U.S. government debt and agency exposures were least additive to return.
|
|
•
|
Positive contributions to relative performance were led by active asset class allocation and credit selectivity.
|
|
•
|
While the Fund duration moved over the last twelve months, the point-to-point duration was nearly flat. The Fund did remain slightly short of benchmark duration. The Fund benefited from an elevated yield environment over the period. On a year-over-year basis, we materially increased agency and non-agency exposure as well as the government exposure. The Fund reduced the securitized, investment grade corporate bond and floating rate loan exposure over the period.
|
ANNUAL AVERAGE TOTAL RETURN (%)
|
|
1 Year
|
5 Year
|
10 Year
|
|
Class A (without sales charge)
|
4.59
|
1.84
|
2.17
|
|
Class A (with sales charge)
|
0.12
|
0.96
|
1.72
|
|
Bloomberg US Aggregate Bond Index
|
4.88
|
-0.40
|
1.46
|
Visit https://www.aristotlefunds.com/resources/prospectuses-reports for more recent performance information.
KEY FUND STATISTICS (as of March 31, 2025)
|
Net Assets
|
$3,162,129,036
|
|
Number of Holdings
|
443
|
|
Net Advisory Fee
|
$11,291,433
|
|
Portfolio Turnover Rate
|
73%
|
|
Top 10 Issuers
|
(%)
|
|
United States Treasury Note/Bond
|
25.0%
|
|
JPMorgan Chase & Co.
|
1.8%
|
|
Bank of America Corp.
|
1.3%
|
|
Goldman Sachs Group, Inc.
|
1.0%
|
|
Federal National Mortgage Association
|
0.9%
|
|
Morgan Stanley
|
0.9%
|
|
Energy Transfer LP
|
0.8%
|
|
VICI Properties LP
|
0.7%
|
|
Freddie Mac Seasoned Credit Risk Transfer Trust
|
0.7%
|
|
Federal National Mortgage Association
|
0.7%
|
Changes to Shareholder Fees (fees paid directly from your investment).
Effective April 1, 2024, the Fund’s Advisory Fee was reduced from 0.50% to 0.40% and the Supervision and Administration Fee was increased from 0.10% to 0.20%. As a result of these changes, there has been no change to the Fund’s total Management Fee.
Changes to Fund’s Principal Risks:
In the Fund’s Principal Risks, Sector Focus Risk was added.
This report describes changes to the Fund that occurred during the reporting period.
WHAT WERE THE FUND COSTS FOR THE PAST YEAR? (based on a hypothetical $10,000 investment)
|
Class Name
|
Costs of a $10,000 investment
|
Costs paid as a percentage of a $10,000 investment
|
|
Class C
|
$163
|
1.60%
|
HOW DID THE FUND PERFORM LAST YEAR AND WHAT AFFECTED ITS PERFORMANCE?
|
•
|
For the 12-month period ended March 31, 2025, the Fund underperformed its performance benchmark, the Bloomberg US Aggregate Bond Index. The Fund invests principally in income-producing debt instruments.
|
|
•
|
The front end of the curve and intermediate portions of the curve were supported by the yield curve inversion seen through September 2024. Even post re-inversion, yields remained elevated as compared to recent history, which was beneficial to return. Additionally, corporate spreads remained quite favorable for most of the period.
|
|
•
|
Exposure to credit-sensitive sectors benefited performance for most of the period as credit remained largely well supported. The intermediate curve positioning and elevated yield profile helped to insulate the full effect of credit spread widening seen on a periodic basis as compared to a long duration based offerings.
|
|
•
|
By credit quality, BBB-rated credits were most beneficial to performance (corporate investment grade bonds) followed by AAA-rated credits (mostly securitized assets). On the other hand, non-U.S. government debt and agency exposures were least additive to return.
|
|
•
|
Positive contributions to relative performance were led by active asset class allocation and credit selectivity.
|
|
•
|
While the Fund duration moved over the last twelve months, the point-to-point duration was nearly flat. The Fund did remain slightly short of benchmark duration. The Fund benefited from an elevated yield environment over the period. On a year-over-year basis, we materially increased agency and non-agency exposure as well as the government exposure. The Fund reduced the securitized, investment grade corporate bond and floating rate loan exposure over the period.
|
ANNUAL AVERAGE TOTAL RETURN (%)
|
|
1 Year
|
5 Year
|
10 Year
|
|
Class C (without sales charge)
|
3.83
|
1.10
|
1.41
|
|
Class C (with sales charge)
|
2.83
|
1.10
|
1.41
|
|
Bloomberg US Aggregate Bond Index
|
4.88
|
-0.40
|
1.46
|
Visit https://www.aristotlefunds.com/resources/prospectuses-reports for more recent performance information.
KEY FUND STATISTICS (as of March 31, 2025)
|
Net Assets
|
$3,162,129,036
|
|
Number of Holdings
|
443
|
|
Net Advisory Fee
|
$11,291,433
|
|
Portfolio Turnover Rate
|
73%
|
|
Top 10 Issuers
|
(%)
|
|
United States Treasury Note/Bond
|
25.0%
|
|
JPMorgan Chase & Co.
|
1.8%
|
|
Bank of America Corp.
|
1.3%
|
|
Goldman Sachs Group, Inc.
|
1.0%
|
|
Federal National Mortgage Association
|
0.9%
|
|
Morgan Stanley
|
0.9%
|
|
Energy Transfer LP
|
0.8%
|
|
VICI Properties LP
|
0.7%
|
|
Freddie Mac Seasoned Credit Risk Transfer Trust
|
0.7%
|
|
Federal National Mortgage Association
|
0.7%
|

Changes to Shareholder Fees (fees paid directly from your investment).
Effective April 1, 2024, the Fund’s Advisory Fee was reduced from 0.50% to 0.40% and the Supervision and Administration Fee was increased from 0.10% to 0.20%. As a result of these changes, there has been no change to the Fund’s total Management Fee.
Changes to Fund’s Principal Risks:
In the Fund’s Principal Risks, Sector Focus Risk was added.
This report describes changes to the Fund that occurred during the reporting period.
WHAT WERE THE FUND COSTS FOR THE PAST YEAR? (based on a hypothetical $10,000 investment)
|
Class Name
|
Costs of a $10,000 investment
|
Costs paid as a percentage of a $10,000 investment
|
|
Class I
|
$46
|
0.45%
|
HOW DID THE FUND PERFORM LAST YEAR AND WHAT AFFECTED ITS PERFORMANCE?
|
•
|
For the 12-month period ended March 31, 2025, the Fund outperformed its performance benchmark, the Bloomberg US Aggregate Bond Index. The Fund invests principally in income-producing debt instruments.
|
|
•
|
The front end of the curve and intermediate portions of the curve were supported by the yield curve inversion seen through September 2024. Even post re-inversion, yields remained elevated as compared to recent history, which was beneficial to return. Additionally, corporate spreads remained quite favorable for most of the period.
|
|
•
|
Exposure to credit-sensitive sectors benefited performance for most of the period as credit remained largely well supported. The intermediate curve positioning and elevated yield profile helped to insulate the full effect of credit spread widening seen on a periodic basis as compared to a long duration based offerings.
|
|
•
|
By credit quality, BBB-rated credits were most beneficial to performance (corporate investment grade bonds) followed by AAA-rated credits (mostly securitized assets). On the other hand, non-U.S. government debt and agency exposures were least additive to return.
|
|
•
|
Positive contributions to relative performance were led by active asset class allocation and credit selectivity.
|
|
•
|
While the Fund duration moved over the last twelve months, the point-to-point duration was nearly flat. The Fund did remain slightly short of benchmark duration. The Fund benefited from an elevated yield environment over the period. On a year-over-year basis, we materially increased agency and non-agency exposure as well as the government exposure. The Fund reduced the securitized, investment grade corporate bond and floating rate loan exposure over the period.
|
ANNUAL AVERAGE TOTAL RETURN (%)
|
|
1 Year
|
5 Year
|
10 Year
|
|
Class I (without sales charge)
|
5.00
|
2.16
|
2.48
|
|
Bloomberg US Aggregate Bond Index
|
4.88
|
-0.40
|
1.46
|
Visit https://www.aristotlefunds.com/resources/prospectuses-reports for more recent performance information.
KEY FUND STATISTICS (as of March 31, 2025)
|
Net Assets
|
$3,162,129,036
|
|
Number of Holdings
|
443
|
|
Net Advisory Fee
|
$11,291,433
|
|
Portfolio Turnover Rate
|
73%
|
|
Top 10 Issuers
|
(%)
|
|
United States Treasury Note/Bond
|
25.0%
|
|
JPMorgan Chase & Co.
|
1.8%
|
|
Bank of America Corp.
|
1.3%
|
|
Goldman Sachs Group, Inc.
|
1.0%
|
|
Federal National Mortgage Association
|
0.9%
|
|
Morgan Stanley
|
0.9%
|
|
Energy Transfer LP
|
0.8%
|
|
VICI Properties LP
|
0.7%
|
|
Freddie Mac Seasoned Credit Risk Transfer Trust
|
0.7%
|
|
Federal National Mortgage Association
|
0.7%
|

Changes to Shareholder Fees (fees paid directly from your investment).
Effective April 1, 2024, the Fund’s Advisory Fee was reduced from 0.50% to 0.40%. As a result, the total Management Fee has been reduced by 0.10%. In addition, the contractual fee waiver for Class I has been reduced from 0.55% to 0.45%.
Changes to Fund’s Principal Risks:
In the Fund’s Principal Risks, Sector Focus Risk was added.
This report describes changes to the Fund that occurred during the reporting period.
WHAT WERE THE FUND COSTS FOR THE PAST YEAR? (based on a hypothetical $10,000 investment)
|
Class Name
|
Costs of a $10,000 investment
|
Costs paid as a percentage of a $10,000 investment
|
|
Class I-2
|
$56
|
0.55%
|
HOW DID THE FUND PERFORM LAST YEAR AND WHAT AFFECTED ITS PERFORMANCE?
|
•
|
For the 12-month period ended March 31, 2025, the Fund outperformed its performance benchmark, the Bloomberg US Aggregate Bond Index. The Fund invests principally in income-producing debt instruments.
|
|
•
|
The front end of the curve and intermediate portions of the curve were supported by the yield curve inversion seen through September 2024. Even post re-inversion, yields remained elevated as compared to recent history, which was beneficial to return. Additionally, corporate spreads remained quite favorable for most of the period.
|
|
•
|
Exposure to credit-sensitive sectors benefited performance for most of the period as credit remained largely well supported. The intermediate curve positioning and elevated yield profile helped to insulate the full effect of credit spread widening seen on a periodic basis as compared to a long duration based offerings.
|
|
•
|
By credit quality, BBB-rated credits were most beneficial to performance (corporate investment grade bonds) followed by AAA-rated credits (mostly securitized assets). On the other hand, non-U.S. government debt and agency exposures were least additive to return.
|
|
•
|
Positive contributions to relative performance were led by active asset class allocation and credit selectivity.
|
|
•
|
While the Fund duration moved over the last twelve months, the point-to-point duration was nearly flat. The Fund did remain slightly short of benchmark duration. The Fund benefited from an elevated yield environment over the period. On a year-over-year basis, we materially increased agency and non-agency exposure as well as the government exposure. The Fund reduced the securitized, investment grade corporate bond and floating rate loan exposure over the period.
|
ANNUAL AVERAGE TOTAL RETURN (%)
|
|
1 Year
|
5 Year
|
10 Year
|
|
Class I-2 (without sales charge)
|
4.89
|
2.16
|
2.47
|
|
Bloomberg US Aggregate Bond Index
|
4.88
|
-0.40
|
1.46
|
Visit https://www.aristotlefunds.com/resources/prospectuses-reports for more recent performance information.
KEY FUND STATISTICS (as of March 31, 2025)
|
Net Assets
|
$3,162,129,036
|
|
Number of Holdings
|
443
|
|
Net Advisory Fee
|
$11,291,433
|
|
Portfolio Turnover Rate
|
73%
|
|
Top 10 Issuers
|
(%)
|
|
United States Treasury Note/Bond
|
25.0%
|
|
JPMorgan Chase & Co.
|
1.8%
|
|
Bank of America Corp.
|
1.3%
|
|
Goldman Sachs Group, Inc.
|
1.0%
|
|
Federal National Mortgage Association
|
0.9%
|
|
Morgan Stanley
|
0.9%
|
|
Energy Transfer LP
|
0.8%
|
|
VICI Properties LP
|
0.7%
|
|
Freddie Mac Seasoned Credit Risk Transfer Trust
|
0.7%
|
|
Federal National Mortgage Association
|
0.7%
|

Changes to Shareholder Fees (fees paid directly from your investment).
Effective April 1, 2024, the Fund’s Advisory Fee was reduced from 0.50% to 0.40% and the Supervision and Administration Fee for Class I-2 was increased from 0.05% to 0.15%. As a result of these changes, there has been no change to the Fund’s total Management Fee.
Changes to Fund’s Principal Risks:
In the Fund’s Principal Risks, Sector Focus Risk was added.
This report describes changes to the Fund that occurred during the reporting period.
WHAT WERE THE FUND COSTS FOR THE PAST YEAR? (based on a hypothetical $10,000 investment)
|
Class Name
|
Costs of a $10,000 investment
|
Costs paid as a percentage of a $10,000 investment
|
|
Class A
|
$105
|
1.02%
|
HOW DID THE FUND PERFORM LAST YEAR AND WHAT AFFECTED ITS PERFORMANCE?
|
•
|
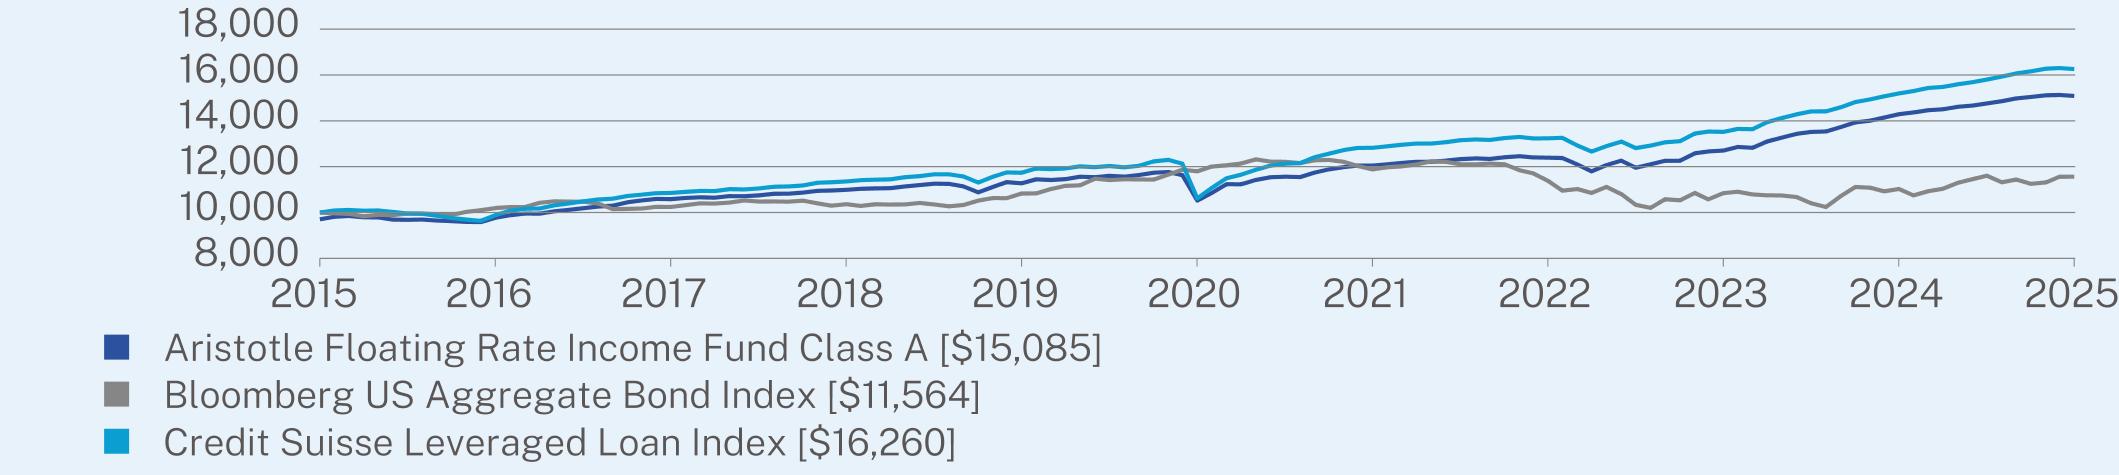
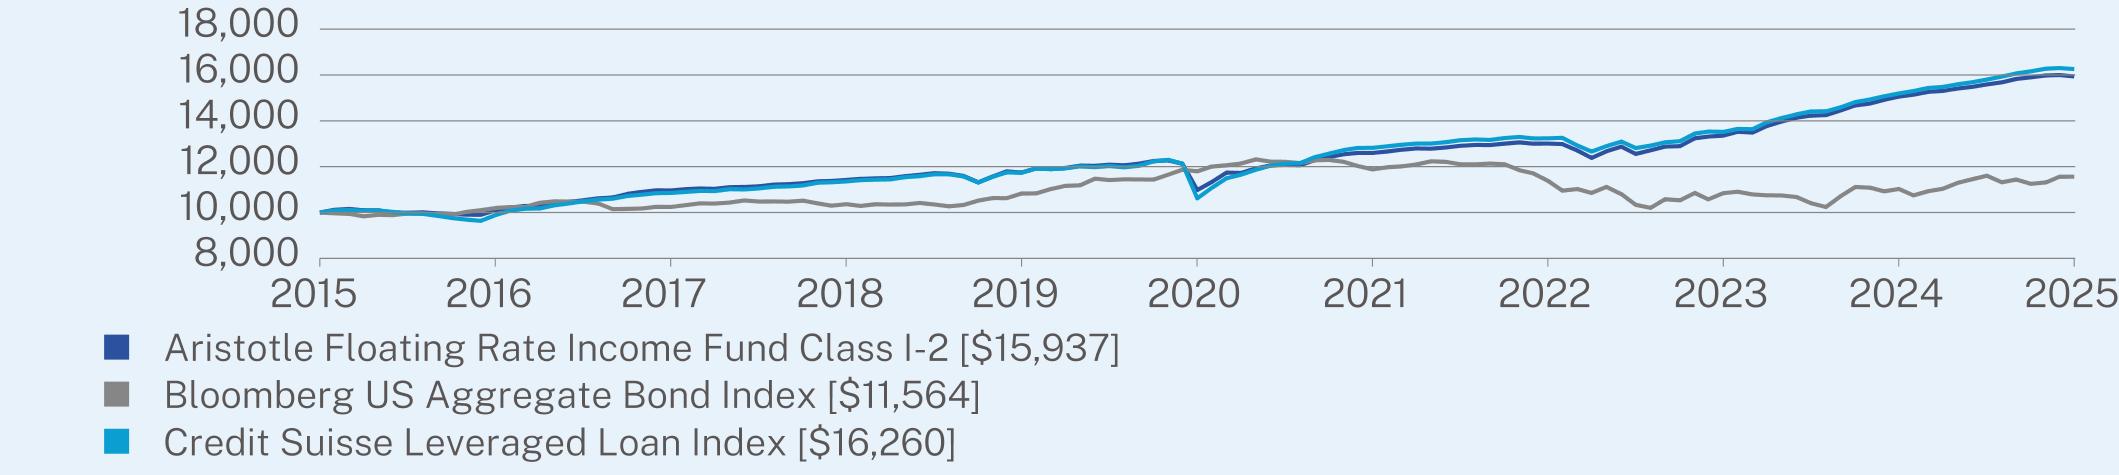
For the 12-month period ended March 31, 2025, the Fund underperformed its performance benchmark, the Credit Suisse Leveraged Loan Index. The Fund invests principally in income-producing floating rate loans and floating rate debt securities.
|
|
•
|
The Fund continues to avoid lower-quality, distressed credits and focuses on large-cap issuers and the performing segment of the loan market. The coupon of the asset class ended the most recent quarter at a historically elevated level (7.6%). We believe loans will continue to provide a ballast during this volatile rate environment.
|
|
•
|
The Fund benefited from largely supportive corporate fundmentals, technicals and an attractive asset class relative value trade. Asset class yields remained elevated as the secured overnight financing rate (SOFR) remained at higher levels.
|
|
•
|
On a year-over-year basis, the Fund maintained its focused exposure inside of the floating rate loan asset class, specifically seeking out the larger more-liquid credits while seeking to avoid deteriorating credits and unfavorable sectors.
|
ANNUAL AVERAGE TOTAL RETURN (%)
|
|
1 Year
|
5 Year
|
10 Year
|
|
Class A (without sales charge)
|
5.57
|
7.48
|
4.51
|
|
Class A (with sales charge)
|
2.35
|
6.83
|
4.20
|
|
Bloomberg US Aggregate Bond Index
|
4.88
|
-0.40
|
1.46
|
|
Credit Suisse Leveraged Loan Index
|
7.02
|
8.90
|
4.98
|
Visit https://www.aristotlefunds.com/resources/prospectuses-reports for more recent performance information.
KEY FUND STATISTICS (as of March 31, 2025)
|
Net Assets
|
$4,284,277,290
|
|
Number of Holdings
|
162
|
|
Net Advisory Fee
|
$23,202,062
|
|
Portfolio Turnover Rate
|
122%
|
|
Top 10 Issuers
|
(%)
|
|
Alliant Holdings Intermediate LLC / Alliant Holdings Co.-Issuer
|
3.6%
|
|
UKG, Inc.
|
3.5%
|
|
TransDigm, Inc.
|
2.8%
|
|
Bausch + Lomb Corp.
|
2.7%
|
|
8th Avenue Food & Provisions, Inc.
|
2.4%
|
|
Deerfield Dakota Holding LLC
|
2.2%
|
|
TIH Insurance Holdings LLC
|
2.2%
|
|
Ellucian Holdings, Inc.
|
2.2%
|
|
ClubCorp Holdings, Inc.
|
2.1%
|
|
Wand NewCo 3, Inc.
|
2.1%
|

Changes to the Fund’s Principal Investment Strategy:
In the Fund’s Principal Investment Strategies, the Fund discloses that a significant portion of the floating rate loans held by the Fund may be “covenant lite” loans.
Changes to Shareholder Fees (fees paid directly from your investment).
Effective April 1, 2024, the Fund’s Advisory Fee was reduced from 0.62% to 0.55% and the Supervision and Administration Fee for Class A was increased from 0.13% to 0.20%. As a result of these changes, there has been no change to the Fund’s total Management Fee.
Changes to Fund’s Principal Risks:
In the Fund’s Principal Risks, Sector Focus Risk was added.
Changes to Fund’s Portfolio Manager or Portfolio Management Team:
Effective March 1, 2025, C. Robert Boyd and Tommy Zhang, CFA, have been added as Portfolio Managers of the Fund.
This report describes changes to the Fund that occurred during the reporting period.
WHAT WERE THE FUND COSTS FOR THE PAST YEAR? (based on a hypothetical $10,000 investment)
|
Class Name
|
Costs of a $10,000 investment
|
Costs paid as a percentage of a $10,000 investment
|
|
Class C
|
$181
|
1.77%
|
HOW DID THE FUND PERFORM LAST YEAR AND WHAT AFFECTED ITS PERFORMANCE?
|
•
|
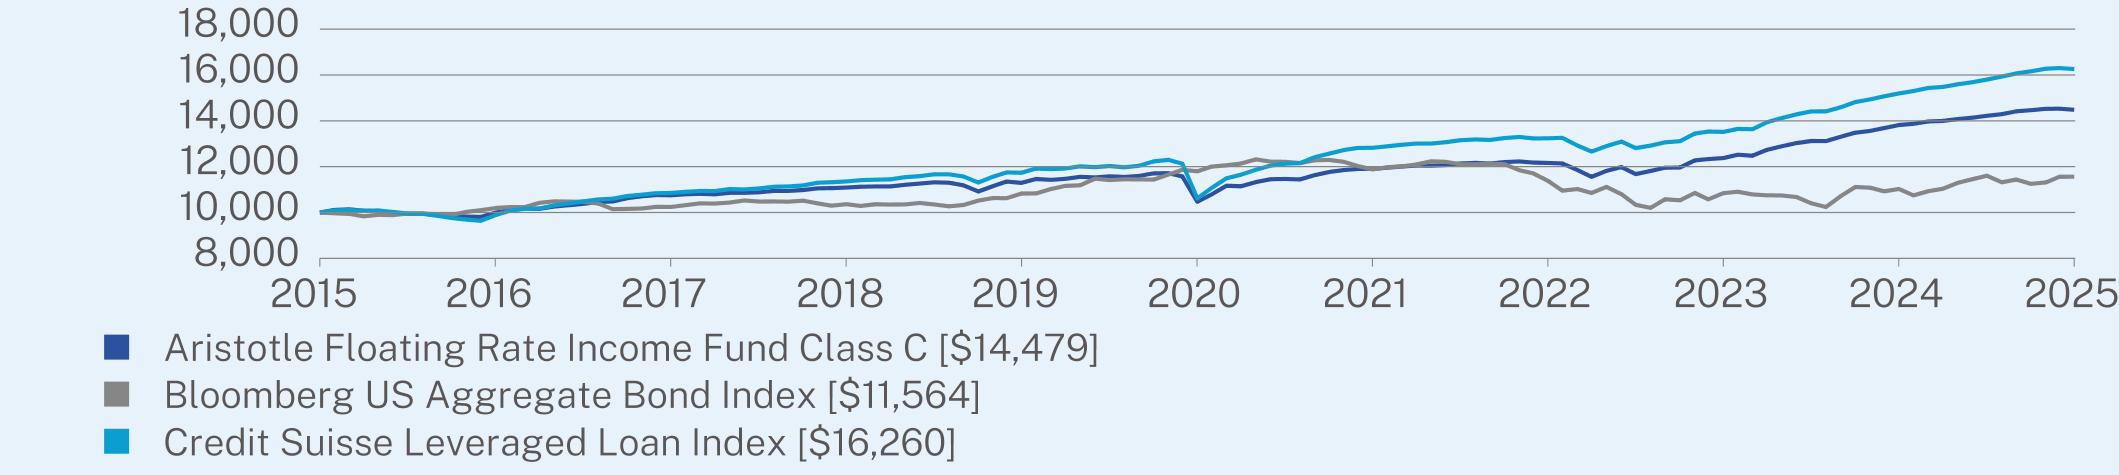
For the 12-month period ended March 31, 2025, the Fund underperformed its performance benchmark, the Credit Suisse Leveraged Loan Index. The Fund invests principally in income-producing floating rate loans and floating rate debt securities.
|
|
•
|
The Fund continues to avoid lower-quality, distressed credits and focuses on large-cap issuers and the performing segment of the loan market. The coupon of the asset class ended the most recent quarter at a historically elevated level (7.6%). We believe loans will continue to provide a ballast during this volatile rate environment.
|
|
•
|
The Fund benefited from largely supportive corporate fundmentals, technicals and an attractive asset class relative value trade. Asset class yields remained elevated as the secured overnight financing rate (SOFR) remained at higher levels.
|
|
•
|
On a year-over-year basis, the Fund maintained its focused exposure inside of the floating rate loan asset class, specifically seeking out the larger more-liquid credits while seeking to avoid deteriorating credits and unfavorable sectors.
|
ANNUAL AVERAGE TOTAL RETURN (%)
|
|
1 Year
|
5 Year
|
10 Year
|
|
Class C (without sales charge)
|
4.78
|
6.70
|
3.77
|
|
Class C (with sales charge)
|
3.80
|
6.70
|
3.77
|
|
Bloomberg US Aggregate Bond Index
|
4.88
|
-0.40
|
1.46
|
|
Credit Suisse Leveraged Loan Index
|
7.02
|
8.90
|
4.98
|
Visit https://www.aristotlefunds.com/resources/prospectuses-reports for more recent performance information.
KEY FUND STATISTICS (as of March 31, 2025)
|
Net Assets
|
$4,284,277,290
|
|
Number of Holdings
|
162
|
|
Net Advisory Fee
|
$23,202,062
|
|
Portfolio Turnover Rate
|
122%
|
|
Top 10 Issuers
|
(%)
|
|
Alliant Holdings Intermediate LLC / Alliant Holdings Co.-Issuer
|
3.6%
|
|
UKG, Inc.
|
3.5%
|
|
TransDigm, Inc.
|
2.8%
|
|
Bausch + Lomb Corp.
|
2.7%
|
|
8th Avenue Food & Provisions, Inc.
|
2.4%
|
|
Deerfield Dakota Holding LLC
|
2.2%
|
|
TIH Insurance Holdings LLC
|
2.2%
|
|
Ellucian Holdings, Inc.
|
2.2%
|
|
ClubCorp Holdings, Inc.
|
2.1%
|
|
Wand NewCo 3, Inc.
|
2.1%
|
Changes to the Fund’s Principal Investment Strategy:
In the Fund’s Principal Investment Strategies, the Fund discloses that a significant portion of the floating rate loans held by the Fund may be “covenant lite” loans.
Changes to Shareholder Fees (fees paid directly from your investment).
Effective April 1, 2024, the Fund’s Advisory Fee was reduced from 0.62% to 0.55% and the Supervision and Administration Fee for Class C was increased from 0.13% to 0.20%. As a result of these changes, there has been no change to the Fund’s total Management Fee.
Changes to Fund’s Principal Risks:
In the Fund’s Principal Risks, Sector Focus Risk was added.
Changes to Fund’s Portfolio Manager or Portfolio Management Team:
Effective March 1, 2025, C. Robert Boyd and Tommy Zhang, CFA, have been added as Portfolio Managers of the Fund.
This report describes changes to the Fund that occurred during the reporting period.
WHAT WERE THE FUND COSTS FOR THE PAST YEAR? (based on a hypothetical $10,000 investment)
|
Class Name
|
Costs of a $10,000 investment
|
Costs paid as a percentage of a $10,000 investment
|
|
Class I
|
$71
|
0.69%
|
HOW DID THE FUND PERFORM LAST YEAR AND WHAT AFFECTED ITS PERFORMANCE?
|
•
|
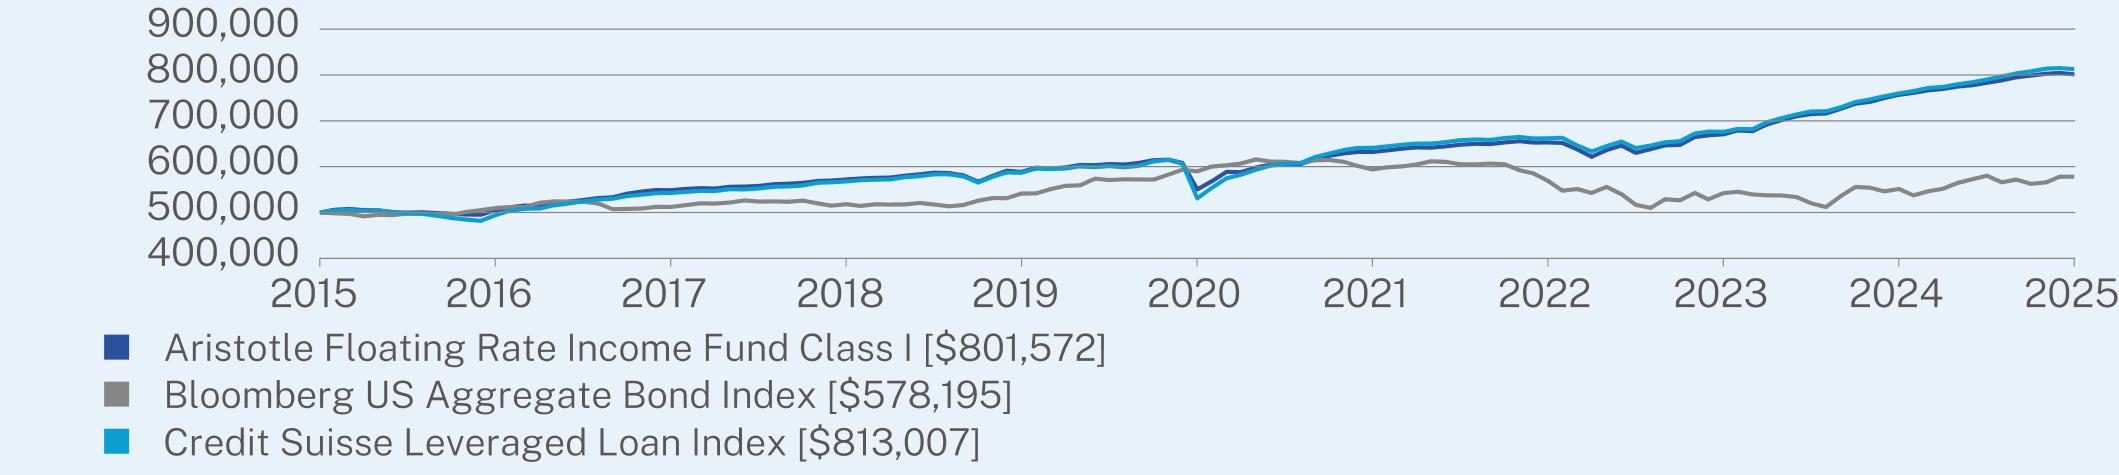
For the 12-month period ended March 31, 2025, the Fund underperformed its performance benchmark, the Credit Suisse Leveraged Loan Index. The Fund invests principally in income-producing floating rate loans and floating rate debt securities.
|
|
•
|
The Fund continues to avoid lower-quality, distressed credits and focuses on large-cap issuers and the performing segment of the loan market. The coupon of the asset class ended the most recent quarter at a historically elevated level (7.6%). We believe loans will continue to provide a ballast during this volatile rate environment.
|
|
•
|
The Fund benefited from largely supportive corporate fundmentals, technicals and an attractive asset class relative value trade. Asset class yields remained elevated as the secured overnight financing rate (SOFR) remained at higher levels.
|
|
•
|
On a year-over-year basis, the Fund maintained its focused exposure inside of the floating rate loan asset class, specifically seeking out the larger more-liquid credits while seeking to avoid deteriorating credits and unfavorable sectors.
|
ANNUAL AVERAGE TOTAL RETURN (%)
|
|
1 Year
|
5 Year
|
10 Year
|
|
Class I (without sales charge)
|
5.91
|
7.81
|
4.83
|
|
Bloomberg US Aggregate Bond Index
|
4.88
|
-0.40
|
1.46
|
|
Credit Suisse Leveraged Loan Index
|
7.02
|
8.90
|
4.98
|
Visit https://www.aristotlefunds.com/resources/prospectuses-reports for more recent performance information.
KEY FUND STATISTICS (as of March 31, 2025)
|
Net Assets
|
$4,284,277,290
|
|
Number of Holdings
|
162
|
|
Net Advisory Fee
|
$23,202,062
|
|
Portfolio Turnover Rate
|
122%
|
|
Top 10 Issuers
|
(%)
|
|
Alliant Holdings Intermediate LLC / Alliant Holdings Co.-Issuer
|
3.6%
|
|
UKG, Inc.
|
3.5%
|
|
TransDigm, Inc.
|
2.8%
|
|
Bausch + Lomb Corp.
|
2.7%
|
|
8th Avenue Food & Provisions, Inc.
|
2.4%
|
|
Deerfield Dakota Holding LLC
|
2.2%
|
|
TIH Insurance Holdings LLC
|
2.2%
|
|
Ellucian Holdings, Inc.
|
2.2%
|
|
ClubCorp Holdings, Inc.
|
2.1%
|
|
Wand NewCo 3, Inc.
|
2.1%
|

Changes to the Fund’s Principal Investment Strategy:
In the Fund’s Principal Investment Strategies, the Fund discloses that a significant portion of the floating rate loans held by the Fund may be “covenant lite” loans.
Changes to Shareholder Fees (fees paid directly from your investment).
Effective April 1, 2024, the Fund’s Advisory Fee was reduced from 0.62% to 0.55% and the Supervision and Administration Fee for Class I has been increased from 0.05% to 0.12%. As a result of these changes, there has been no change to the Fund’s total Management Fee.
Changes to Fund’s Principal Risks:
In the Fund’s Principal Risks, Sector Focus Risk was added.
Changes to Fund’s Portfolio Manager or Portfolio Management Team:
Effective March 1, 2025, C. Robert Boyd and Tommy Zhang, CFA, have been added as Portfolio Managers of the Fund.
This report describes changes to the Fund that occurred during the reporting period.
WHAT WERE THE FUND COSTS FOR THE PAST YEAR? (based on a hypothetical $10,000 investment)
|
Class Name
|
Costs of a $10,000 investment
|
Costs paid as a percentage of a $10,000 investment
|
|
Class I-2
|
$79
|
0.77%
|
HOW DID THE FUND PERFORM LAST YEAR AND WHAT AFFECTED ITS PERFORMANCE?
|
•
|
For the 12-month period ended March 31, 2025, the Fund underperformed its performance benchmark, the Credit Suisse Leveraged Loan Index. The Fund invests principally in income-producing floating rate loans and floating rate debt securities.
|
|
•
|
The Fund continues to avoid lower-quality, distressed credits and focuses on large-cap issuers and the performing segment of the loan market. The coupon of the asset class ended the most recent quarter at a historically elevated level (7.6%). We believe loans will continue to provide a ballast during this volatile rate environment.
|
|
•
|
The Fund benefited from largely supportive corporate fundmentals, technicals and an attractive asset class relative value trade. Asset class yields remained elevated as the secured overnight financing rate (SOFR) remained at higher levels.
|
|
•
|
On a year-over-year basis, the Fund maintained its focused exposure inside of the floating rate loan asset class, specifically seeking out the larger more-liquid credits while seeking to avoid deteriorating credits and unfavorable sectors.
|
ANNUAL AVERAGE TOTAL RETURN (%)
|
|
1 Year
|
5 Year
|
10 Year
|
|
Class I-2 (without sales charge)
|
5.83
|
7.74
|
4.77
|
|
Bloomberg US Aggregate Bond Index
|
4.88
|
-0.40
|
1.46
|
|
Credit Suisse Leveraged Loan Index
|
7.02
|
8.90
|
4.98
|
Visit https://www.aristotlefunds.com/resources/prospectuses-reports for more recent performance information.
KEY FUND STATISTICS (as of March 31, 2025)
|
Net Assets
|
$4,284,277,290
|
|
Number of Holdings
|
162
|
|
Net Advisory Fee
|
$23,202,062
|
|
Portfolio Turnover Rate
|
122%
|
|
Top 10 Issuers
|
(%)
|
|
Alliant Holdings Intermediate LLC / Alliant Holdings Co.-Issuer
|
3.6%
|
|
UKG, Inc.
|
3.5%
|
|
TransDigm, Inc.
|
2.8%
|
|
Bausch + Lomb Corp.
|
2.7%
|
|
8th Avenue Food & Provisions, Inc.
|
2.4%
|
|
Deerfield Dakota Holding LLC
|
2.2%
|
|
TIH Insurance Holdings LLC
|
2.2%
|
|
Ellucian Holdings, Inc.
|
2.2%
|
|
ClubCorp Holdings, Inc.
|
2.1%
|
|
Wand NewCo 3, Inc.
|
2.1%
|

Changes to the Fund’s Principal Investment Strategy:
In the Fund’s Principal Investment Strategies, the Fund discloses that a significant portion of the floating rate loans held by the Fund may be “covenant lite” loans.
Changes to Shareholder Fees (fees paid directly from your investment).
Effective April 1, 2024, the Fund’s Advisory Fee was reduced from 0.62% to 0.55% and the Supervision and Administration Fee for Class I-2 was increased from 0.13% to 0.20%. As a result of these changes, there has been no change to the Fund’s total Management Fee.
Changes to Fund’s Principal Risks:
In the Fund’s Principal Risks, Sector Focus Risk was added.
Changes to Fund’s Portfolio Manager or Portfolio Management Team:
Effective March 1, 2025, C. Robert Boyd and Tommy Zhang, CFA, have been added as Portfolio Managers of the Fund.
This report describes changes to the Fund that occurred during the reporting period.
WHAT WERE THE FUND COSTS FOR THE PAST YEAR? (based on a hypothetical $10,000 investment)
|
Class Name
|
Costs of a $10,000 investment
|
Costs paid as a percentage of a $10,000 investment
|
|
Class A
|
$97
|
0.95%
|
HOW DID THE FUND PERFORM LAST YEAR AND WHAT AFFECTED ITS PERFORMANCE?
|
•
|
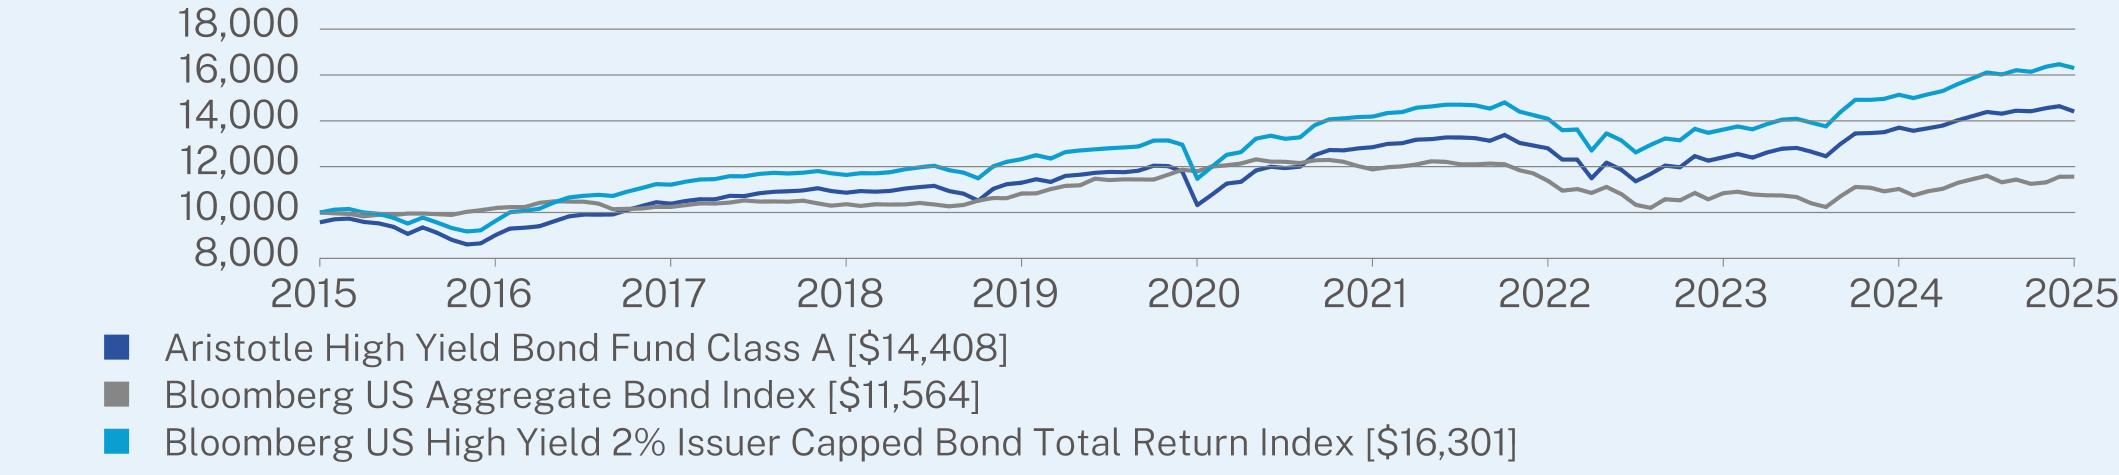
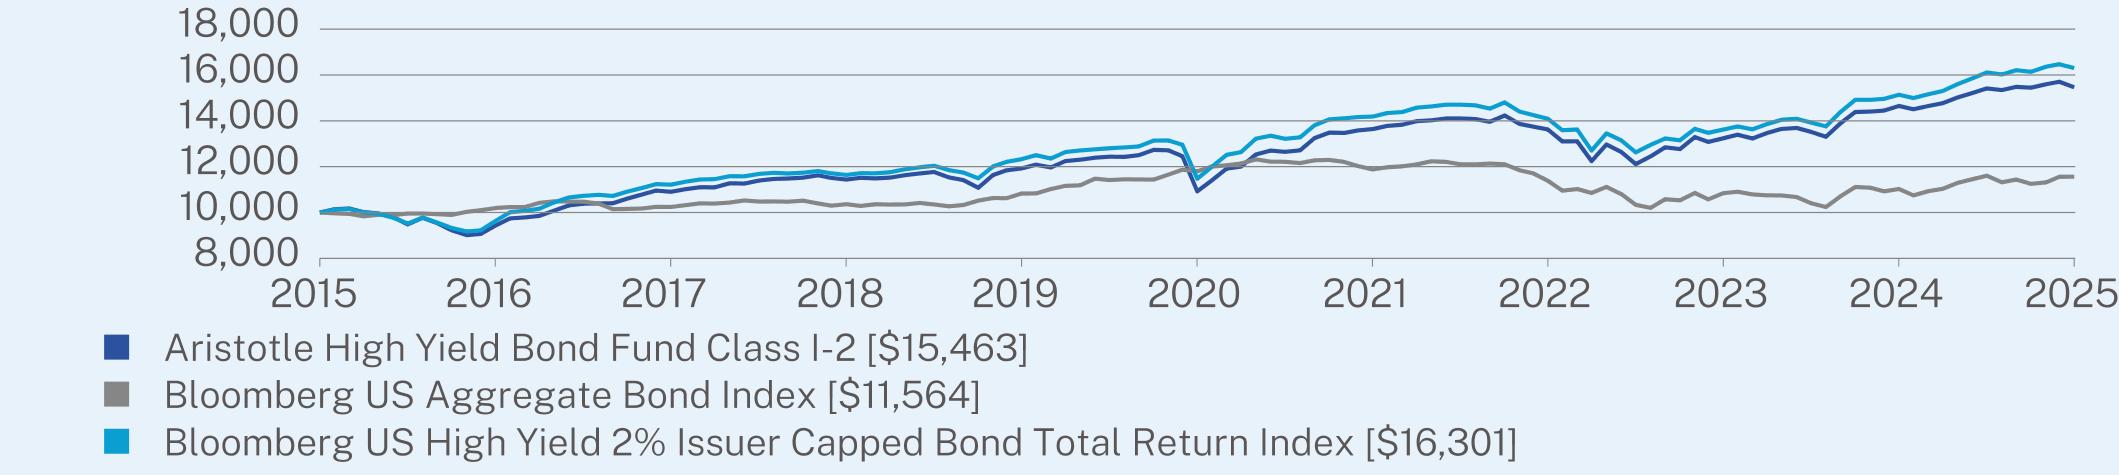
For the 12-month period ended March 31, 2025, the Fund underperformed its performance benchmark, the Bloomberg US High Yield 2% Issuer Capped Bond Total Return Index. The Fund invests at least 80% of its assets in non-investment grade (high yield/high risk, sometimes called “junk bonds”) debt instruments or in instruments with characteristics of non-investment grade debt instruments.
|
|
•
|
A substantial portion of this underperformance is attributable to a lack of exposure to lower-quality distressed credits that benefited during the period. The Fund did benefit from a supportive rate environment elevating entry yields as well as largely compressing credit spreads.
|
|
•
|
Exposure to credit-sensitive sectors benefited performance for most of the period as credit remained largely in favor. The shorter curve positioning and elevated yield profile helped to insulate the full effect of credit spread widening seen on a periodic basis.
|
|
•
|
Positive contribution to relative performance was led by active asset class allocation.
|
|
•
|
While the Fund duration moved over the last twelve months, the point-to-point duration remained relatively flat. The Fund benefited from an elevated yield environment over the period.
|
|
•
|
On a year-over-year basis, we reduced the limited investment grade bond exposure along with the securitized exposure. Conversely, we increased the corporate high yield bond exposure.
|
ANNUAL AVERAGE TOTAL RETURN (%)
|
|
1 Year
|
5 Year
|
10 Year
|
|
Class A (without sales charge)
|
5.14
|
6.89
|
4.18
|
|
Class A (with sales charge)
|
0.62
|
5.96
|
3.72
|
|
Bloomberg US Aggregate Bond Index
|
4.88
|
-0.40
|
1.46
|
|
Bloomberg US High Yield 2% Issuer Capped Bond Total Return Index
|
7.69
|
7.28
|
5.01
|
Visit https://www.aristotlefunds.com/resources/prospectuses-reports for more recent performance information.
KEY FUND STATISTICS (as of March 31, 2025)
|
Net Assets
|
$113,018,110
|
|
Number of Holdings
|
208
|
|
Net Advisory Fee
|
$473,791
|
|
Portfolio Turnover Rate
|
62%
|
|
Top 10 Issuers
|
(%)
|
|
MajorDrive Holdings IV LLC
|
2.3%
|
|
SPX FLOW, Inc.
|
2.0%
|
|
Venture Global LNG, Inc.
|
1.9%
|
|
Acrisure LLC / Acrisure Finance, Inc.
|
1.9%
|
|
CCO Holdings LLC / CCO Holdings Capital Corp.
|
1.8%
|
|
TransDigm, Inc.
|
1.7%
|
|
Allied Universal Holdco LLC
|
1.6%
|
|
Albertsons Cos., Inc. / Safeway, Inc. / New Albertsons LP / Albertsons LLC
|
1.6%
|
|
UKG, Inc.
|
1.6%
|
|
Panther Escrow Issuer LLC
|
1.5%
|

Changes to Shareholder Fees (fees paid directly from your investment).
Effective April 1, 2024, the Fund’s Advisory Fee was reduced from 0.60% to 0.50% and the Supervision and Administration Fee was increased from 0.10% to 0.20%. As a result of these changes, there has been no change to the Fund’s total Management Fee for Class A.
Changes to Fund’s Principal Risks:
In the Fund’s Principal Risks, Sector Focus Risk was added.
Changes to Fund’s Portfolio Manager or Portfolio Management Team:
Effective March 1, 2025, C. Robert Boyd no longer serves as a Portfolio Manager of the Fund.
This report describes changes to the Fund that occurred during the reporting period.
WHAT WERE THE FUND COSTS FOR THE PAST YEAR? (based on a hypothetical $10,000 investment)
|
Class Name
|
Costs of a $10,000 investment
|
Costs paid as a percentage of a $10,000 investment
|
|
Class C
|
$174
|
1.70%
|
HOW DID THE FUND PERFORM LAST YEAR AND WHAT AFFECTED ITS PERFORMANCE?
|
•
|
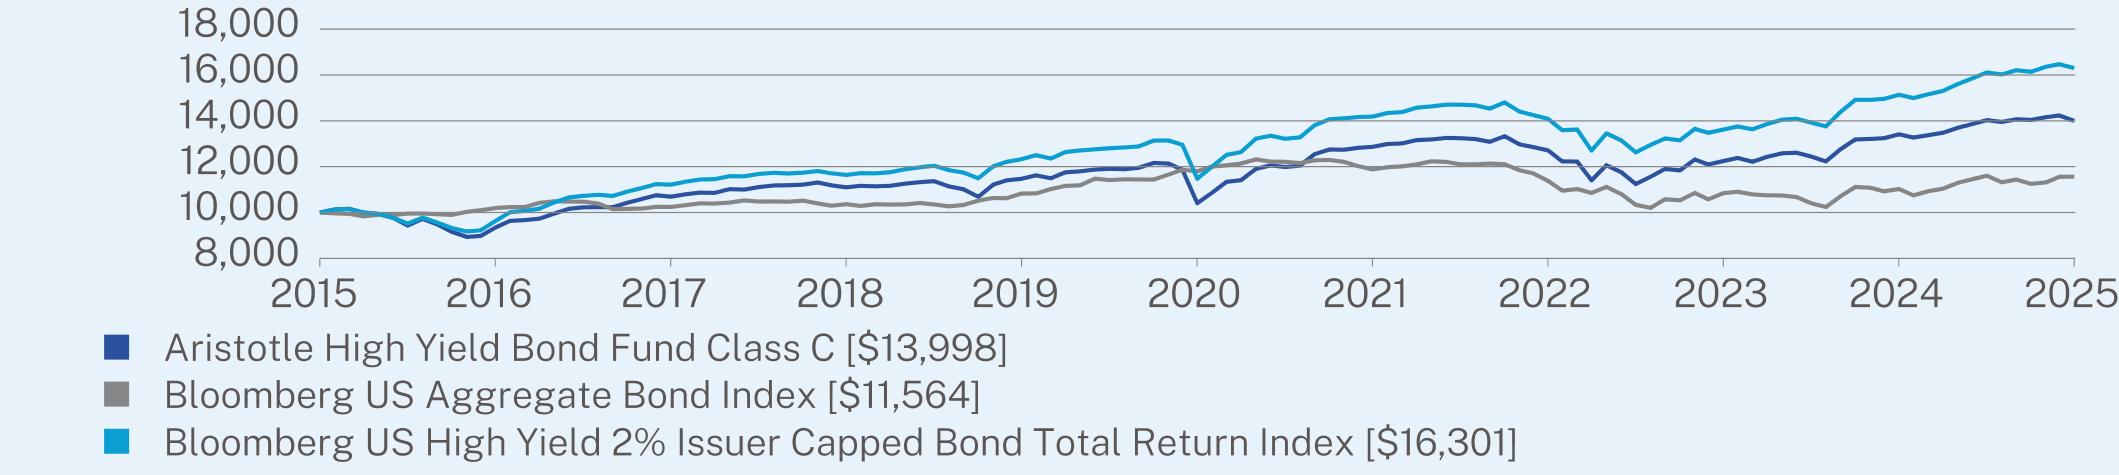
For the 12-month period ended March 31, 2025, the Fund underperformed its performance benchmark, the Bloomberg US High Yield 2% Issuer Capped Bond Total Return Index. The Fund invests at least 80% of its assets in non-investment grade (high yield/high risk, sometimes called “junk bonds”) debt instruments or in instruments with characteristics of non-investment grade debt instruments.
|
|
•
|
A substantial portion of this underperformance is attributable to a lack of exposure to lower-quality distressed credits that benefited during the period. The Fund did benefit from a supportive rate environment elevating entry yields as well as largely compressing credit spreads.
|
|
•
|
Exposure to credit-sensitive sectors benefited performance for most of the period as credit remained largely in favor. The shorter curve positioning and elevated yield profile helped to insulate the full effect of credit spread widening seen on a periodic basis.
|
|
•
|
Positive contribution to relative performance was led by active asset class allocation.
|
|
•
|
While the Fund duration moved over the last twelve months, the point-to-point duration remained relatively flat. The Fund benefited from an elevated yield environment over the period.
|
|
•
|
On a year-over-year basis, we reduced the limited investment grade bond exposure along with the securitized exposure. Conversely, we increased the corporate high yield bond exposure.
|
ANNUAL AVERAGE TOTAL RETURN (%)
|
|
1 Year
|
5 Year
|
10 Year
|
|
Class C (without sales charge)
|
4.35
|
6.11
|
3.42
|
|
Class C (with sales charge)
|
3.36
|
6.11
|
3.42
|
|
Bloomberg US Aggregate Bond Index
|
4.88
|
-0.40
|
1.46
|
|
Bloomberg US High Yield 2% Issuer Capped Bond Total Return Index
|
7.69
|
7.28
|
5.01
|
Visit https://www.aristotlefunds.com/resources/prospectuses-reports for more recent performance information.
KEY FUND STATISTICS (as of March 31, 2025)
|
Net Assets
|
$113,018,110
|
|
Number of Holdings
|
208
|
|
Net Advisory Fee
|
$473,791
|
|
Portfolio Turnover Rate
|
62%
|
|
Top 10 Issuers
|
(%)
|
|
MajorDrive Holdings IV LLC
|
2.3%
|
|
SPX FLOW, Inc.
|
2.0%
|
|
Venture Global LNG, Inc.
|
1.9%
|
|
Acrisure LLC / Acrisure Finance, Inc.
|
1.9%
|
|
CCO Holdings LLC / CCO Holdings Capital Corp.
|
1.8%
|
|
TransDigm, Inc.
|
1.7%
|
|
Allied Universal Holdco LLC
|
1.6%
|
|
Albertsons Cos., Inc. / Safeway, Inc. / New Albertsons LP / Albertsons LLC
|
1.6%
|
|
UKG, Inc.
|
1.6%
|
|
Panther Escrow Issuer LLC
|
1.5%
|
Changes to Shareholder Fees (fees paid directly from your investment).
Effective April 1, 2024, the Fund’s Advisory Fee was reduced from 0.60% to 0.50% and the Supervision and Administration Fee was increased from 0.10% to 0.20%. As a result of these changes, there has been no change to the Fund’s total Management Fee for Class C.
Changes to Fund’s Principal Risks:
In the Fund’s Principal Risks, Sector Focus Risk was added.
Changes to Fund’s Portfolio Manager or Portfolio Management Team:
Effective March 1, 2025, C. Robert Boyd no longer serves as a Portfolio Manager of the Fund.
This report describes changes to the Fund that occurred during the reporting period.
WHAT WERE THE FUND COSTS FOR THE PAST YEAR? (based on a hypothetical $10,000 investment)
|
Class Name
|
Costs of a $10,000 investment
|
Costs paid as a percentage of a $10,000 investment
|
|
Class I
|
$57
|
0.55%
|
HOW DID THE FUND PERFORM LAST YEAR AND WHAT AFFECTED ITS PERFORMANCE?
|
•
|
For the 12-month period ended March 31, 2025, the Fund underperformed its performance benchmark, the Bloomberg US High Yield 2% Issuer Capped Bond Total Return Index. The Fund invests at least 80% of its assets in non-investment grade (high yield/high risk, sometimes called “junk bonds”) debt instruments or in instruments with characteristics of non-investment grade debt instruments.
|
|
•
|
A substantial portion of this underperformance is attributable to a lack of exposure to lower-quality distressed credits that benefited during the period. The Fund did benefit from a supportive rate environment elevating entry yields as well as largely compressing credit spreads.
|
|
•
|
Exposure to credit-sensitive sectors benefited performance for most of the period as credit remained largely in favor. The shorter curve positioning and elevated yield profile helped to insulate the full effect of credit spread widening seen on a periodic basis.
|
|
•
|
Positive contribution to relative performance was led by active asset class allocation.
|
|
•
|
While the Fund duration moved over the last twelve months, the point-to-point duration remained relatively flat. The Fund benefited from an elevated yield environment over the period.
|
|
•
|
On a year-over-year basis, we reduced the limited investment grade bond exposure along with the securitized exposure. Conversely, we increased the corporate high yield bond exposure.
|

ANNUAL AVERAGE TOTAL RETURN (%)
|
|
1 Year
|
5 Year
|
10 Year
|
|
Class I (without sales charge)
|
5.64
|
7.19
|
4.46
|
|
Bloomberg US Aggregate Bond Index
|
4.88
|
-0.40
|
1.46
|
|
Bloomberg US High Yield 2% Issuer Capped Bond Total Return Index
|
7.69
|
7.28
|
5.01
|
Visit https://www.aristotlefunds.com/resources/prospectuses-reports for more recent performance information.
KEY FUND STATISTICS (as of March 31, 2025)
|
Net Assets
|
$113,018,110
|
|
Number of Holdings
|
208
|
|
Net Advisory Fee
|
$473,791
|
|
Portfolio Turnover Rate
|
62%
|
|
Top 10 Issuers
|
(%)
|
|
MajorDrive Holdings IV LLC
|
2.3%
|
|
SPX FLOW, Inc.
|
2.0%
|
|
Venture Global LNG, Inc.
|
1.9%
|
|
Acrisure LLC / Acrisure Finance, Inc.
|
1.9%
|
|
CCO Holdings LLC / CCO Holdings Capital Corp.
|
1.8%
|
|
TransDigm, Inc.
|
1.7%
|
|
Allied Universal Holdco LLC
|
1.6%
|
|
Albertsons Cos., Inc. / Safeway, Inc. / New Albertsons LP / Albertsons LLC
|
1.6%
|
|
UKG, Inc.
|
1.6%
|
|
Panther Escrow Issuer LLC
|
1.5%
|

Changes to Shareholder Fees (fees paid directly from your investment).
Class I: Effective April 1, 2024, the Fund’s Advisory Fee was reduced from 0.60% to 0.50%. As a result of this change, the total Management Fee for Class I was reduced by 0.10%. In addition, the contractual fee waiver for Class I has been reduced from 0.65% to 0.55%.
Changes to Fund’s Principal Risks:
In the Fund’s Principal Risks, Sector Focus Risk was added.
Changes to Fund’s Portfolio Manager or Portfolio Management Team:
Effective March 1, 2025, C. Robert Boyd no longer serves as a Portfolio Manager of the Fund.
This report describes changes to the Fund that occurred during the reporting period.
WHAT WERE THE FUND COSTS FOR THE PAST YEAR? (based on a hypothetical $10,000 investment)
|
Class Name
|
Costs of a $10,000 investment
|
Costs paid as a percentage of a $10,000 investment
|
|
Class I-2
|
$67
|
0.65%
|
HOW DID THE FUND PERFORM LAST YEAR AND WHAT AFFECTED ITS PERFORMANCE?
|
•
|
For the 12-month period ended March 31, 2025, the Fund underperformed its performance benchmark, the Bloomberg US High Yield 2% Issuer Capped Bond Total Return Index. The Fund invests at least 80% of its assets in non-investment grade (high yield/high risk, sometimes called “junk bonds”) debt instruments or in instruments with characteristics of non-investment grade debt instruments.
|
|
•
|
A substantial portion of this underperformance is attributable to a lack of exposure to lower-quality distressed credits that benefited during the period. The Fund did benefit from a supportive rate environment elevating entry yields as well as largely compressing credit spreads.
|
|
•
|
Exposure to credit-sensitive sectors benefited performance for most of the period as credit remained largely in favor. The shorter curve positioning and elevated yield profile helped to insulate the full effect of credit spread widening seen on a periodic basis.
|
|
•
|
Positive contribution to relative performance was led by active asset class allocation.
|
|
•
|
While the Fund duration moved over the last twelve months, the point-to-point duration remained relatively flat. The Fund benefited from an elevated yield environment over the period.
|
|
•
|
On a year-over-year basis, we reduced the limited investment grade bond exposure along with the securitized exposure. Conversely, we increased the corporate high yield bond exposure.
|
ANNUAL AVERAGE TOTAL RETURN (%)
|
|
1 Year
|
5 Year
|
10 Year
|
|
Class I-2 (without sales charge)
|
5.55
|
7.20
|
4.46
|
|
Bloomberg US Aggregate Bond Index
|
4.88
|
-0.40
|
1.46
|
|
Bloomberg US High Yield 2% Issuer Capped Bond Total Return Index
|
7.69
|
7.28
|
5.01
|
Visit https://www.aristotlefunds.com/resources/prospectuses-reports for more recent performance information.
KEY FUND STATISTICS (as of March 31, 2025)
|
Net Assets
|
$113,018,110
|
|
Number of Holdings
|
208
|
|
Net Advisory Fee
|
$473,791
|
|
Portfolio Turnover Rate
|
62%
|
|
Top 10 Issuers
|
(%)
|
|
MajorDrive Holdings IV LLC
|
2.3%
|
|
SPX FLOW, Inc.
|
2.0%
|
|
Venture Global LNG, Inc.
|
1.9%
|
|
Acrisure LLC / Acrisure Finance, Inc.
|
1.9%
|
|
CCO Holdings LLC / CCO Holdings Capital Corp.
|
1.8%
|
|
TransDigm, Inc.
|
1.7%
|
|
Allied Universal Holdco LLC
|
1.6%
|
|
Albertsons Cos., Inc. / Safeway, Inc. / New Albertsons LP / Albertsons LLC
|
1.6%
|
|
UKG, Inc.
|
1.6%
|
|
Panther Escrow Issuer LLC
|
1.5%
|

Changes to Shareholder Fees (fees paid directly from your investment).
Effective April 1, 2024, the Fund’s Advisory Fee was reduced from 0.60% to 0.50% and the Supervision and Administration Fee was increased from 0.10% to 0.15%. As a result of these changes, the total Management Fee for Class I-2 was reduced by 0.05%. In addition, the contractual fee waiver for Class I-2 was reduced from 0.70% to 0.65%.
Changes to Fund’s Principal Risks:
In the Fund’s Principal Risks, Sector Focus Risk was added.
Changes to Fund’s Portfolio Manager or Portfolio Management Team:
Effective March 1, 2025, C. Robert Boyd no longer serves as a Portfolio Manager of the Fund.
This report describes changes to the Fund that occurred during the reporting period.
WHAT WERE THE FUND COSTS FOR THE PAST YEAR? (based on a hypothetical $10,000 investment)
|
Class Name
|
Costs of a $10,000 investment
|
Costs paid as a percentage of a $10,000 investment
|
|
Class A
|
$77
|
0.75%
|
HOW DID THE FUND PERFORM LAST YEAR AND WHAT AFFECTED ITS PERFORMANCE?
|
•
|
For the 12-month period ended March 31, 2025, the Fund outperformed its performance benchmark, the Bloomberg 1-3 Year US Government/Credit Index. The Fund invests principally in income-producing debt instruments.
|
|
•
|
The front end of the curve was highly favorable due to a yield curve inversion seen through September 2024. Even post re-inversion, yields remained elevated compared to recent history, which was beneficial to the return. Additionally, corporate spreads remained quite favorable for most of the period.
|
|
•
|
Exposure to credit-sensitive sectors benefited performance for most of the period as credit remained largely well supported. The front-end positioning and elevated yield profile helped to insulate the full effect of credit spread widening seen on a periodic basis as compared to a long duration based offerings.
|
|
•
|
By credit quality, BBB-rated credits were most beneficial to performance (corporate investment grade bonds) followed by AAA-rated credits (mostly securitized assets). On the other hand, U.S. government and non-U.S. government debt were the least additive to return.
|
|
•
|
Positive contributions to relative performance were led by active asset class allocation and credit selectivity.
|
|
•
|
The Fund duration remained essentially flat on a point-to-point basis. However, this was beneficial as the front end of the rate curve remained largely supportive. On a year-over-year basis, we materially increased shorter duration investment grade rated corporate bond exposure while significantly reducing its floating rate loan exposure.
|

ANNUAL AVERAGE TOTAL RETURN (%)
|
|
1 Year
|
5 Year
|
10 Year
|
|
Class A (without sales charge)
|
5.77
|
3.32
|
2.32
|
|
Class A (with sales charge)
|
2.63
|
2.70
|
2.01
|
|
Bloomberg US Aggregate Bond Index
|
4.88
|
-0.40
|
1.46
|
|
Bloomberg 1-3 Year US Government/Credit Index
|
5.61
|
1.56
|
1.73
|
Visit https://www.aristotlefunds.com/resources/prospectuses-reports for more recent performance information.
KEY FUND STATISTICS (as of March 31, 2025)
|
Net Assets
|
$905,079,417
|
|
Number of Holdings
|
277
|
|
Net Advisory Fee
|
$2,175,233
|
|
Portfolio Turnover Rate
|
66%
|
|
Top 10 Issuers
|
(%)
|
|
United States Treasury Note/Bond
|
14.8%
|
|
JPMorgan Chase & Co.
|
3.0%
|
|
Bank of America Corp.
|
2.7%
|
|
Morgan Stanley
|
2.1%
|
|
DTE Energy Co.
|
1.3%
|
|
UBS Group AG
|
1.2%
|
|
Public Service Enterprise Group, Inc.
|
1.1%
|
|
Wells Fargo & Co.
|
1.1%
|
|
Goldman Sachs Group, Inc.
|
1.1%
|
|
TransDigm, Inc.
|
1.1%
|

Changes to Shareholder Fees (fees paid directly from your investment).
Effective April 1, 2024, the Fund’s Advisory Fee was reduced from 0.40% to 0.25% and the Supervision and Administration Fee was increased from 0.10% to 0.25%. As a result of these changes, there is no change to the Fund’s total Management Fee for Class A shares.
Changes to Fund’s Principal Risks:
In the Fund’s Principal Risks, Sector Focus Risk was added.
This report describes changes to the Fund that occurred during the reporting period.
WHAT WERE THE FUND COSTS FOR THE PAST YEAR? (based on a hypothetical $10,000 investment)
|
Class Name
|
Costs of a $10,000 investment
|
Costs paid as a percentage of a $10,000 investment
|
|
Class C
|
$154
|
1.50%
|
HOW DID THE FUND PERFORM LAST YEAR AND WHAT AFFECTED ITS PERFORMANCE?
|
•
|
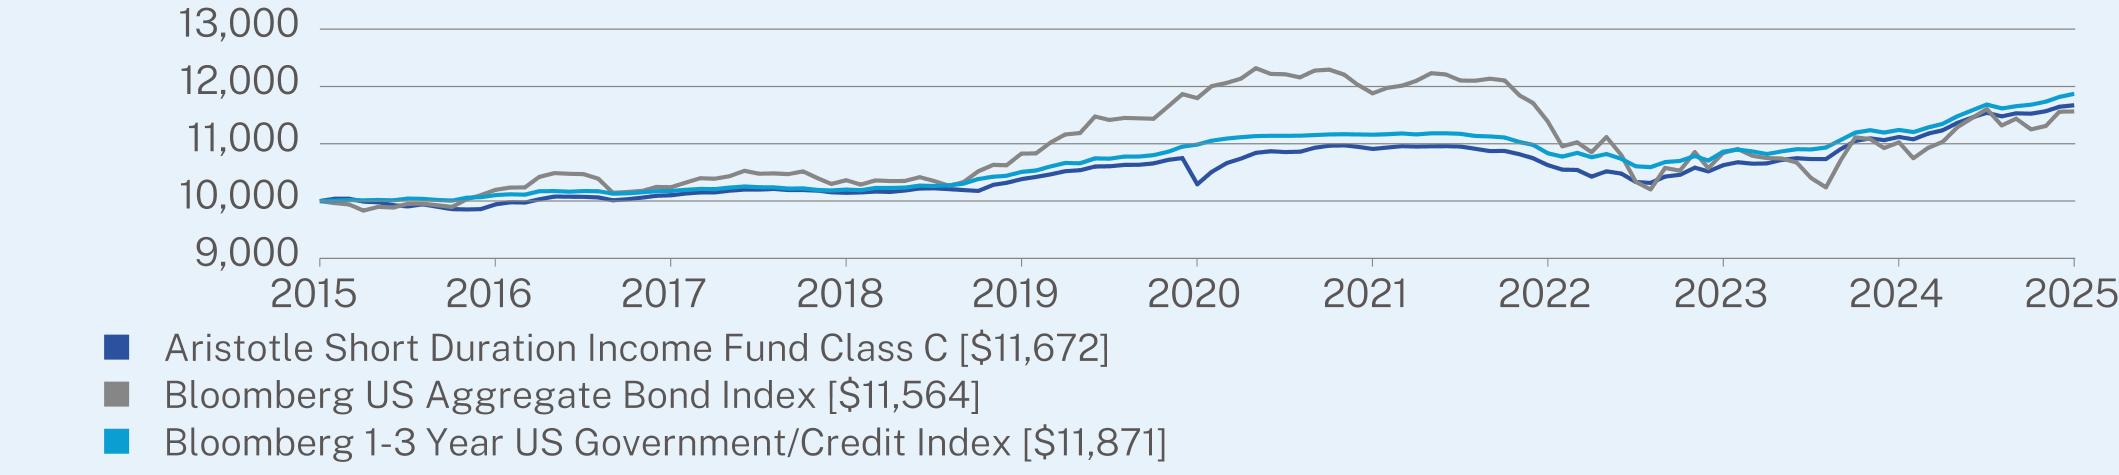
For the 12-month period ended March 31, 2025, the Fund underperformed its performance benchmark, the Bloomberg 1-3 Year US Government/Credit Index. The Fund invests principally in income-producing debt instruments.
|
|
•
|
The front end of the curve was highly favorable due to a yield curve inversion seen through September 2024. Even post re-inversion, yields remained elevated compared to recent history, which was beneficial to the return. Additionally, corporate spreads remained quite favorable for most of the period.
|
|
•
|
Exposure to credit-sensitive sectors benefited performance for most of the period as credit remained largely well supported. The front-end positioning and elevated yield profile helped to insulate the full effect of credit spread widening seen on a periodic basis as compared to a long duration based offerings.
|
|
•
|
By credit quality, BBB-rated credits were most beneficial to performance (corporate investment grade bonds) followed by AAA-rated credits (mostly securitized assets). On the other hand, U.S. government and non-U.S. government debt were the least additive to return.
|
|
•
|
Positive contributions to relative performance were led by active asset class allocation and credit selectivity.
|
|
•
|
The Fund duration remained essentially flat on a point-to-point basis. However, this was beneficial as the front end of the rate curve remained largely supportive. On a year-over-year basis, we materially increased shorter duration investment grade rated corporate bond exposure while significantly reducing its floating rate loan exposure.
|
ANNUAL AVERAGE TOTAL RETURN (%)
|
|
1 Year
|
5 Year
|
10 Year
|
|
Class C (without sales charge)
|
4.98
|
2.55
|
1.56
|
|
Class C (with sales charge)
|
3.98
|
2.55
|
1.56
|
|
Bloomberg US Aggregate Bond Index
|
4.88
|
-0.40
|
1.46
|
|
Bloomberg 1-3 Year US Government/Credit Index
|
5.61
|
1.56
|
1.73
|
Visit https://www.aristotlefunds.com/resources/prospectuses-reports for more recent performance information.
KEY FUND STATISTICS (as of March 31, 2025)
|
Net Assets
|
$905,079,417
|
|
Number of Holdings
|
277
|
|
Net Advisory Fee
|
$2,175,233
|
|
Portfolio Turnover Rate
|
66%
|
|
Top 10 Issuers
|
(%)
|
|
United States Treasury Note/Bond
|
14.8%
|
|
JPMorgan Chase & Co.
|
3.0%
|
|
Bank of America Corp.
|
2.7%
|
|
Morgan Stanley
|
2.1%
|
|
DTE Energy Co.
|
1.3%
|
|
UBS Group AG
|
1.2%
|
|
Public Service Enterprise Group, Inc.
|
1.1%
|
|
Wells Fargo & Co.
|
1.1%
|
|
Goldman Sachs Group, Inc.
|
1.1%
|
|
TransDigm, Inc.
|
1.1%
|

Changes to Shareholder Fees (fees paid directly from your investment).
Effective April 1, 2024, the Fund’s Advisory Fee was reduced from 0.40% to 0.25% and the Supervision and Administration Fee was increased from 0.10% to 0.25%. As a result of these changes, there is no change to the Fund’s total Management Fee for Class C shares.
Changes to Fund’s Principal Risks:
In the Fund’s Principal Risks, Sector Focus Risk was added.
This report describes changes to the Fund that occurred during the reporting period.
WHAT WERE THE FUND COSTS FOR THE PAST YEAR? (based on a hypothetical $10,000 investment)
|
Class Name
|
Costs of a $10,000 investment
|
Costs paid as a percentage of a $10,000 investment
|
|
Class I
|
$40
|
0.39%
|
HOW DID THE FUND PERFORM LAST YEAR AND WHAT AFFECTED ITS PERFORMANCE?
|
•
|
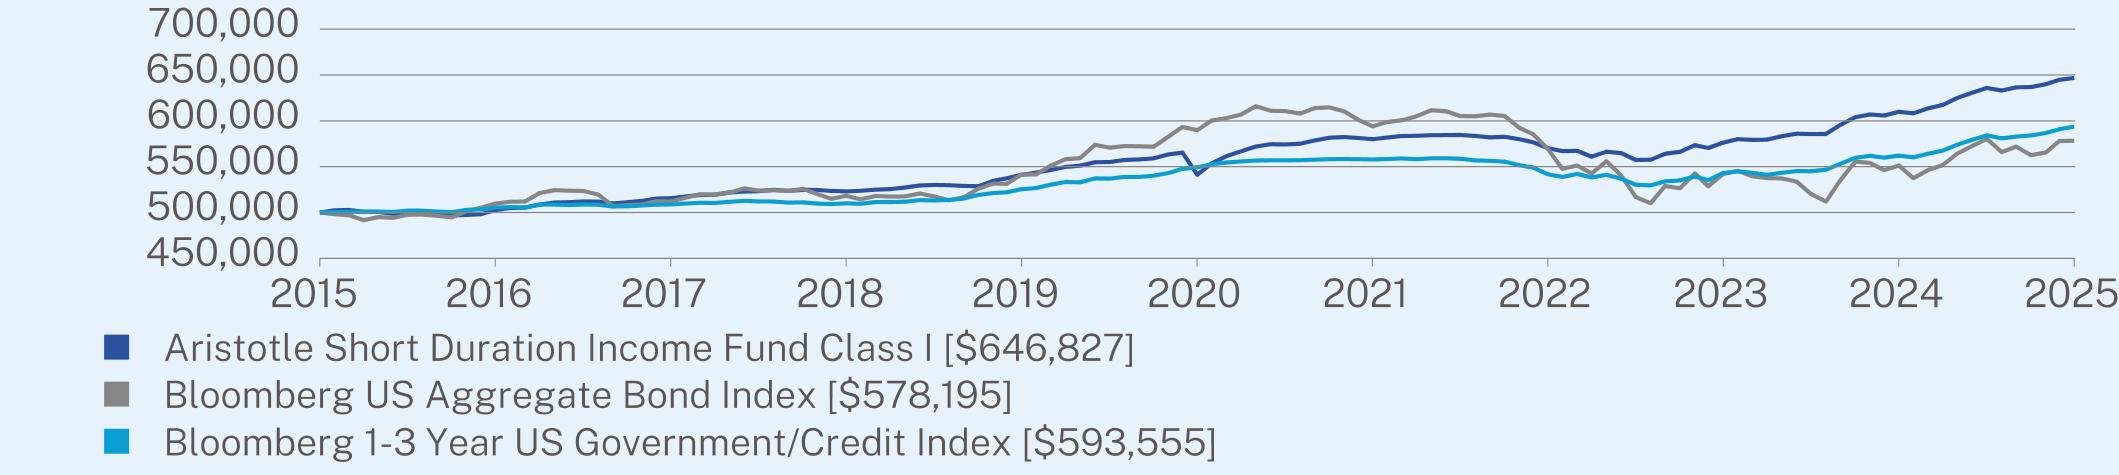
For the 12-month period ended March 31, 2025, the Fund outperformed its performance benchmark, the Bloomberg 1-3 Year US Government/Credit Index. The Fund invests principally in income-producing debt instruments.
|
|
•
|
The front end of the curve was highly favorable due to a yield curve inversion seen through September 2024. Even post re-inversion, yields remained elevated compared to recent history, which was beneficial to the return. Additionally, corporate spreads remained quite favorable for most of the period.
|
|
•
|
Exposure to credit-sensitive sectors benefited performance for most of the period as credit remained largely well supported. The front-end positioning and elevated yield profile helped to insulate the full effect of credit spread widening seen on a periodic basis as compared to a long duration based offerings.
|
|
•
|
By credit quality, BBB-rated credits were most beneficial to performance (corporate investment grade bonds) followed by AAA-rated credits (mostly securitized assets). On the other hand, U.S. government and non-U.S. government debt were the least additive to return.
|
|
•
|
Positive contributions to relative performance were led by active asset class allocation and credit selectivity.
|
|
•
|
The Fund duration remained essentially flat on a point-to-point basis. However, this was beneficial as the front end of the rate curve remained largely supportive. On a year-over-year basis, we materially increased shorter duration investment grade rated corporate bond exposure while significantly reducing its floating rate loan exposure.
|
ANNUAL AVERAGE TOTAL RETURN (%)
|
|
1 Year
|
5 Year
|
10 Year
|
|
Class I (without sales charge)
|
6.06
|
3.63
|
2.61
|
|
Bloomberg US Aggregate Bond Index
|
4.88
|
-0.40
|
1.46
|
|
Bloomberg 1-3 Year US Government/Credit Index
|
5.61
|
1.56
|
1.73
|
Visit https://www.aristotlefunds.com/resources/prospectuses-reports for more recent performance information.
KEY FUND STATISTICS (as of March 31, 2025)
|
Net Assets
|
$905,079,417
|
|
Number of Holdings
|
277
|
|
Net Advisory Fee
|
$2,175,233
|
|
Portfolio Turnover Rate
|
66%
|
|
Top 10 Issuers
|
(%)
|
|
United States Treasury Note/Bond
|
14.8%
|
|
JPMorgan Chase & Co.
|
3.0%
|
|
Bank of America Corp.
|
2.7%
|
|
Morgan Stanley
|
2.1%
|
|
DTE Energy Co.
|
1.3%
|
|
UBS Group AG
|
1.2%
|
|
Public Service Enterprise Group, Inc.
|
1.1%
|
|
Wells Fargo & Co.
|
1.1%
|
|
Goldman Sachs Group, Inc.
|
1.1%
|
|
TransDigm, Inc.
|
1.1%
|
Changes to Shareholder Fees (fees paid directly from your investment).
Effective April 1, 2024, the Fund’s Advisory Fee was reduced from 0.40% to 0.25% and the Supervision and Administration Fee was increased from 0.05% to 0.14%. As a result of these changes, the total Management Fee for Class I has been reduced by 0.06%. In addition, the contractual fee waiver for Class I shares has been reduced from 0.45% to 0.39%.
Changes to Fund’s Principal Risks:
In the Fund’s Principal Risks, Sector Focus Risk was added.
This report describes changes to the Fund that occurred during the reporting period.
WHAT WERE THE FUND COSTS FOR THE PAST YEAR? (based on a hypothetical $10,000 investment)
|
Class Name
|
Costs of a $10,000 investment
|
Costs paid as a percentage of a $10,000 investment
|
|
Class I-2
|
$50
|
0.49%
|
HOW DID THE FUND PERFORM LAST YEAR AND WHAT AFFECTED ITS PERFORMANCE?
|
•
|
For the 12-month period ended March 31, 2025, the Fund outperformed its performance benchmark, the Bloomberg 1-3 Year US Government/Credit Index. The Fund invests principally in income-producing debt instruments.
|
|
•
|
The front end of the curve was highly favorable due to a yield curve inversion seen through September 2024. Even post re-inversion, yields remained elevated compared to recent history, which was beneficial to the return. Additionally, corporate spreads remained quite favorable for most of the period.
|
|
•
|
Exposure to credit-sensitive sectors benefited performance for most of the period as credit remained largely well supported. The front-end positioning and elevated yield profile helped to insulate the full effect of credit spread widening seen on a periodic basis as compared to a long duration based offerings.
|
|
•
|
By credit quality, BBB-rated credits were most beneficial to performance (corporate investment grade bonds) followed by AAA-rated credits (mostly securitized assets). On the other hand, U.S. government and non-U.S. government debt were the least additive to return.
|
|
•
|
Positive contributions to relative performance were led by active asset class allocation and credit selectivity.
|
|
•
|
The Fund duration remained essentially flat on a point-to-point basis. However, this was beneficial as the front end of the rate curve remained largely supportive. On a year-over-year basis, we materially increased shorter duration investment grade rated corporate bond exposure while significantly reducing its floating rate loan exposure.
|
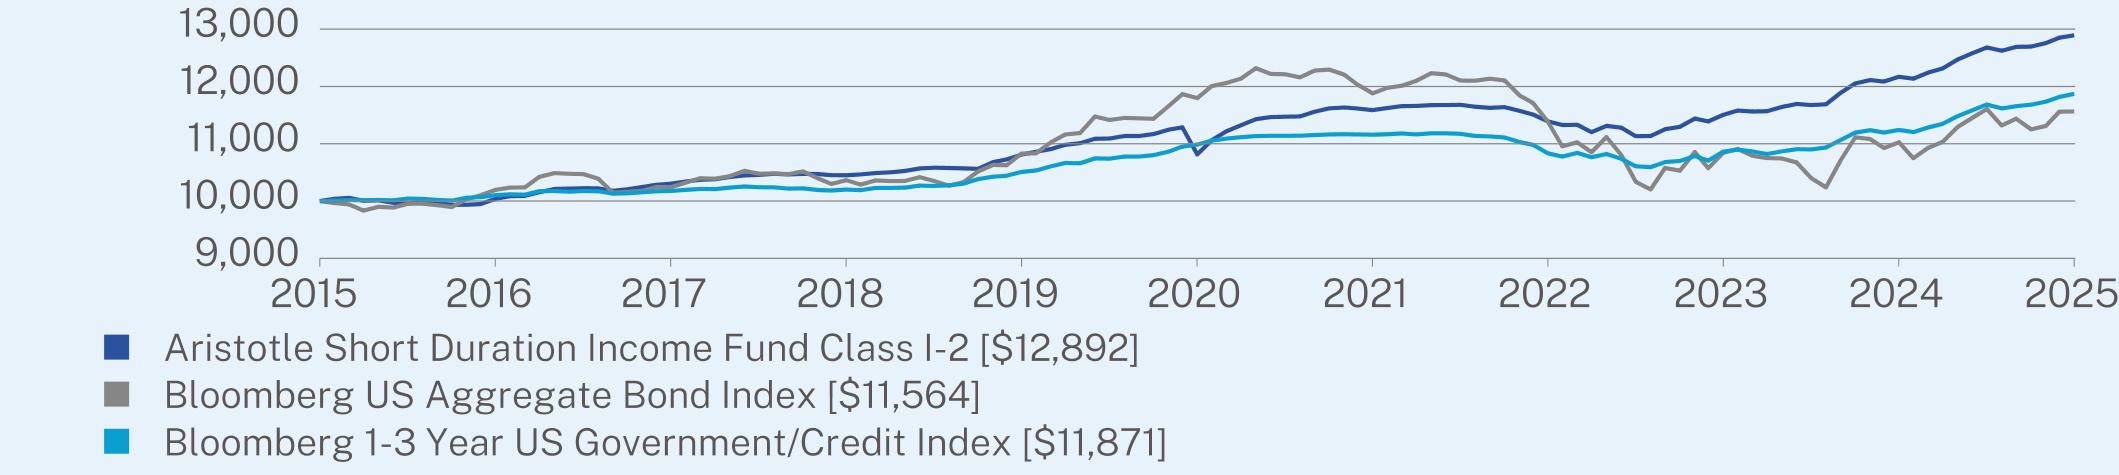
ANNUAL AVERAGE TOTAL RETURN (%)
|
|
1 Year
|
5 Year
|
10 Year
|
|
Class I-2 (without sales charge)
|
5.94
|
3.58
|
2.57
|
|
Bloomberg US Aggregate Bond Index
|
4.88
|
-0.40
|
1.46
|
|
Bloomberg 1-3 Year US Government/Credit Index
|
5.61
|
1.56
|
1.73
|
Visit https://www.aristotlefunds.com/resources/prospectuses-reports for more recent performance information.
KEY FUND STATISTICS (as of March 31, 2025)
|
Net Assets
|
$905,079,417
|
|
Number of Holdings
|
277
|
|
Net Advisory Fee
|
$2,175,233
|
|
Portfolio Turnover Rate
|
66%
|
|
Top 10 Issuers
|
(%)
|
|
United States Treasury Note/Bond
|
14.8%
|
|
JPMorgan Chase & Co.
|
3.0%
|
|
Bank of America Corp.
|
2.7%
|
|
Morgan Stanley
|
2.1%
|
|
DTE Energy Co.
|
1.3%
|
|
UBS Group AG
|
1.2%
|
|
Public Service Enterprise Group, Inc.
|
1.1%
|
|
Wells Fargo & Co.
|
1.1%
|
|
Goldman Sachs Group, Inc.
|
1.1%
|
|
TransDigm, Inc.
|
1.1%
|

Changes to Shareholder Fees (fees paid directly from your investment).
Effective April 1, 2024, the Fund’s Advisory Fee was reduced from 0.40% to 0.25% and the Supervision and Administration Fee for Class I-2 has been increased from 0.10% to 0.24%. As a result of these changes, the total Management Fee for Class I-2 has been reduced by 0.01%. In addition, the contractual fee waiver for Class I-2 has been reduced from 0.50% to 0.49%.
Changes to Fund’s Principal Risks:
In the Fund’s Principal Risks, Sector Focus Risk was added.
This report describes changes to the Fund that occurred during the reporting period.
WHAT WERE THE FUND COSTS FOR THE PAST YEAR? (based on a hypothetical $10,000 investment)
|
Class Name
|
Costs of a $10,000 investment
|
Costs paid as a percentage of a $10,000 investment
|
|
Class A
|
$96
|
0.94%
|
HOW DID THE FUND PERFORM LAST YEAR AND WHAT AFFECTED ITS PERFORMANCE?
|
•
|
For the 12-month period ended March 31, 2025, the Fund outperformed its performance benchmark, the Bloomberg US Aggregate Bond Index. The Fund invests principally in income-producing debt instruments.
|
|
•
|
The Fund benefited from an elevated rate environment supporting all in yields as well as largely supportive credit spreads.
|
|
•
|
Exposure to credit-sensitive sectors benefited performance for most of the period as credit remained largely well supported. The intermediate curve positioning and elevated yield profile helped to insulate the full effect of credit spread widening seen on a periodic basis as compared to a long duration based offerings.
|
|
•
|
The Fund benefited across the credit quality spectrum with the exception of lower rated credit exposure (some CCC). On the other hand, cash holdings were least additive to return.
|
|
•
|
Positive contributions to relative performance were led by credit selection and active asset class allocation.
|
|
•
|
While the Fund duration moved over the last twelve months, the point-to-point duration was slightly below its starting level. The Fund’s shorter-than-benchmark duration profile proved mostly beneficial to performance. The Fund benefited from an elevated yield environment over the period. On a year-over-year basis, we reduced the investment grade bond exposure. Conversely, we increased the corporate high yield bond exposure along with the floating rate loan exposure.
|

ANNUAL AVERAGE TOTAL RETURN (%)
|
|
1 Year
|
5 Year
|
10 Year
|
|
Class A (without sales charge)
|
5.17
|
6.15
|
4.04
|
|
Class A (with sales charge)
|
0.65
|
5.24
|
3.58
|
|
Bloomberg US Aggregate Bond Index
|
4.88
|
-0.40
|
1.46
|
Visit https://www.aristotlefunds.com/resources/prospectuses-reports for more recent performance information.
KEY FUND STATISTICS (as of March 31, 2025)
|
Net Assets
|
$3,791,942,005
|
|
Number of Holdings
|
437
|
|
Net Advisory Fee
|
$16,201,644
|
|
Portfolio Turnover Rate
|
45%
|
|
Top 10 Issuers
|
(%)
|
|
United States Treasury Note/Bond
|
2.0%
|
|
JPMorgan Chase & Co.
|
1.8%
|
|
Goldman Sachs Group, Inc.
|
1.8%
|
|
Venture Global LNG, Inc.
|
1.7%
|
|
TransDigm, Inc.
|
1.7%
|
|
Citigroup, Inc.
|
1.4%
|
|
Bank of America Corp.
|
1.4%
|
|
Morgan Stanley
|
1.3%
|
|
Energy Transfer LP
|
1.2%
|
|
UKG, Inc.
|
1.2%
|

Changes to Shareholder Fees (fees paid directly from your investment).
Effective April 1, 2024, the Fund’s Advisory Fee was reduced from 0.59% to 0.50% and the Supervision and Administration Fee for Class A was increased from 0.10% to 0.19%. As a result of these changes, there has been no change to the Fund’s total Management Fee.
Changes to Fund’s Principal Risks:
In the Fund’s Principal Risks, Sector Focus Risk and Financial Sector Risk were added.
This report describes changes to the Fund that occurred during the reporting period.
WHAT WERE THE FUND COSTS FOR THE PAST YEAR? (based on a hypothetical $10,000 investment)
|
Class Name
|
Costs of a $10,000 investment
|
Costs paid as a percentage of a $10,000 investment
|
|
Class C
|
$173
|
1.69%
|
HOW DID THE FUND PERFORM LAST YEAR AND WHAT AFFECTED ITS PERFORMANCE?
|
•
|
For the 12-month period ended March 31, 2025, the Fund underperformed its performance benchmark, the Bloomberg US Aggregate Bond Index. The Fund invests principally in income-producing debt instruments.
|
|
•
|
The Fund benefited from an elevated rate environment supporting all in yields as well as largely supportive credit spreads.
|
|
•
|
Exposure to credit-sensitive sectors benefited performance for most of the period as credit remained largely well supported. The intermediate curve positioning and elevated yield profile helped to insulate the full effect of credit spread widening seen on a periodic basis as compared to a long duration based offerings.
|
|
•
|
The Fund benefited across the credit quality spectrum with the exception of lower rated credit exposure (some CCC). On the other hand, cash holdings were least additive to return.
|
|
•
|
Positive contributions to relative performance were led by credit selection and active asset class allocation.
|
|
•
|
While the Fund duration moved over the last twelve months, the point-to-point duration was slightly below its starting level. The Fund’s shorter-than-benchmark duration profile proved mostly beneficial to performance. The Fund benefited from an elevated yield environment over the period. On a year-over-year basis, we reduced the investment grade bond exposure. Conversely, we increased the corporate high yield bond exposure along with the floating rate loan exposure.
|
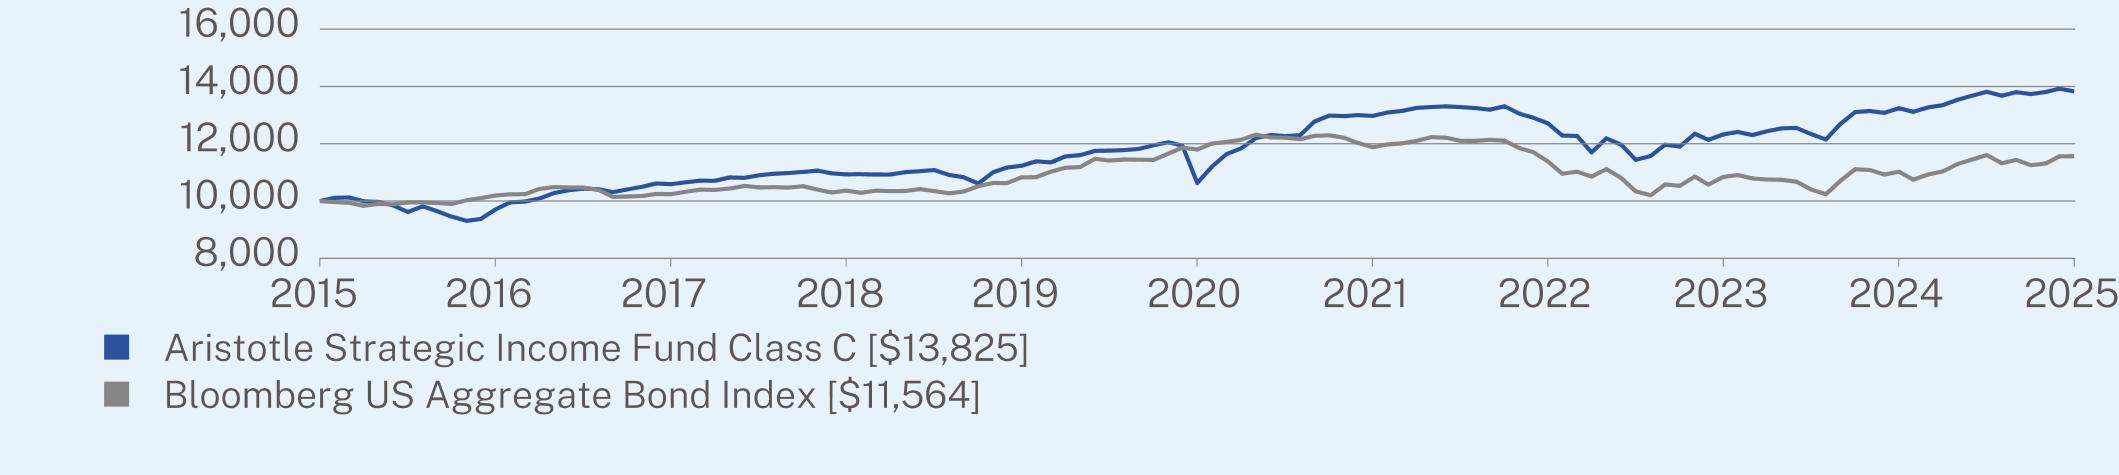
ANNUAL AVERAGE TOTAL RETURN (%)
|
|
1 Year
|
5 Year
|
10 Year
|
|
Class C (without sales charge)
|
4.41
|
5.40
|
3.29
|
|
Class C (with sales charge)
|
3.41
|
5.40
|
3.29
|
|
Bloomberg US Aggregate Bond Index
|
4.88
|
-0.40
|
1.46
|
Visit https://www.aristotlefunds.com/resources/prospectuses-reports for more recent performance information.
KEY FUND STATISTICS (as of March 31, 2025)
|
Net Assets
|
$3,791,942,005
|
|
Number of Holdings
|
437
|
|
Net Advisory Fee
|
$16,201,644
|
|
Portfolio Turnover Rate
|
45%
|
|
Top 10 Issuers
|
(%)
|
|
United States Treasury Note/Bond
|
2.0%
|
|
JPMorgan Chase & Co.
|
1.8%
|
|
Goldman Sachs Group, Inc.
|
1.8%
|
|
Venture Global LNG, Inc.
|
1.7%
|
|
TransDigm, Inc.
|
1.7%
|
|
Citigroup, Inc.
|
1.4%
|
|
Bank of America Corp.
|
1.4%
|
|
Morgan Stanley
|
1.3%
|
|
Energy Transfer LP
|
1.2%
|
|
UKG, Inc.
|
1.2%
|

Changes to Shareholder Fees (fees paid directly from your investment).
Effective April 1, 2024, the Fund’s Advisory Fee was reduced from 0.59% to 0.50% and the Supervision and Administration Fee for Class C was increased from 0.10% to 0.19%. As a result of these changes, there has been no change to the Fund’s total Management Fee.
Changes to Fund’s Principal Risks:
In the Fund’s Principal Risks, Sector Focus Risk and Financial Sector Risk were added.
This report describes changes to the Fund that occurred during the reporting period.
WHAT WERE THE FUND COSTS FOR THE PAST YEAR? (based on a hypothetical $10,000 investment)
|
Class Name
|
Costs of a $10,000 investment
|
Costs paid as a percentage of a $10,000 investment
|
|
Class I
|
$61
|
0.59%
|
HOW DID THE FUND PERFORM LAST YEAR AND WHAT AFFECTED ITS PERFORMANCE?
|
•
|
For the 12-month period ended March 31, 2025, the Fund outperformed its performance benchmark, the Bloomberg US Aggregate Bond Index. The Fund invests principally in income-producing debt instruments.
|
|
•
|
The Fund benefited from an elevated rate environment supporting all in yields as well as largely supportive credit spreads.
|
|
•
|
Exposure to credit-sensitive sectors benefited performance for most of the period as credit remained largely well supported. The intermediate curve positioning and elevated yield profile helped to insulate the full effect of credit spread widening seen on a periodic basis as compared to a long duration based offerings.
|
|
•
|
The Fund benefited across the credit quality spectrum with the exception of lower rated credit exposure (some CCC). On the other hand, cash holdings were least additive to return.
|
|
•
|
Positive contributions to relative performance were led by credit selection and active asset class allocation.
|
|
•
|
While the Fund duration moved over the last twelve months, the point-to-point duration was slightly below its starting level. The Fund’s shorter-than-benchmark duration profile proved mostly beneficial to performance. The Fund benefited from an elevated yield environment over the period. On a year-over-year basis, we reduced the investment grade bond exposure. Conversely, we increased the corporate high yield bond exposure along with the floating rate loan exposure.
|
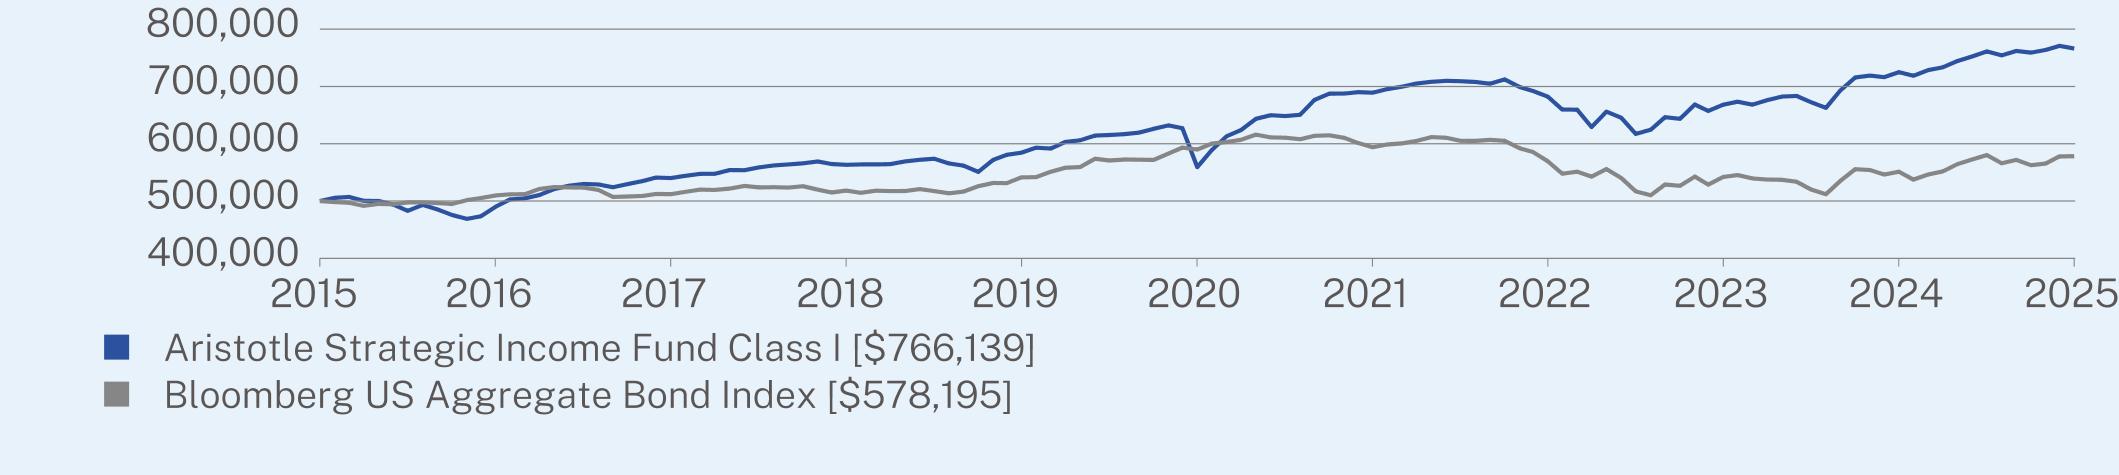
ANNUAL AVERAGE TOTAL RETURN (%)
|
|
1 Year
|
5 Year
|
10 Year
|
|
Class I (without sales charge)
|
5.68
|
6.50
|
4.36
|
|
Bloomberg US Aggregate Bond Index
|
4.88
|
-0.40
|
1.46
|
Visit https://www.aristotlefunds.com/resources/prospectuses-reports for more recent performance information.
KEY FUND STATISTICS (as of March 31, 2025)
|
Net Assets
|
$3,791,942,005
|
|
Number of Holdings
|
437
|
|
Net Advisory Fee
|
$16,201,644
|
|
Portfolio Turnover Rate
|
45%
|
|
Top 10 Issuers
|
(%)
|
|
United States Treasury Note/Bond
|
2.0%
|
|
JPMorgan Chase & Co.
|
1.8%
|
|
Goldman Sachs Group, Inc.
|
1.8%
|
|
Venture Global LNG, Inc.
|
1.7%
|
|
TransDigm, Inc.
|
1.7%
|
|
Citigroup, Inc.
|
1.4%
|
|
Bank of America Corp.
|
1.4%
|
|
Morgan Stanley
|
1.3%
|
|
Energy Transfer LP
|
1.2%
|
|
UKG, Inc.
|
1.2%
|
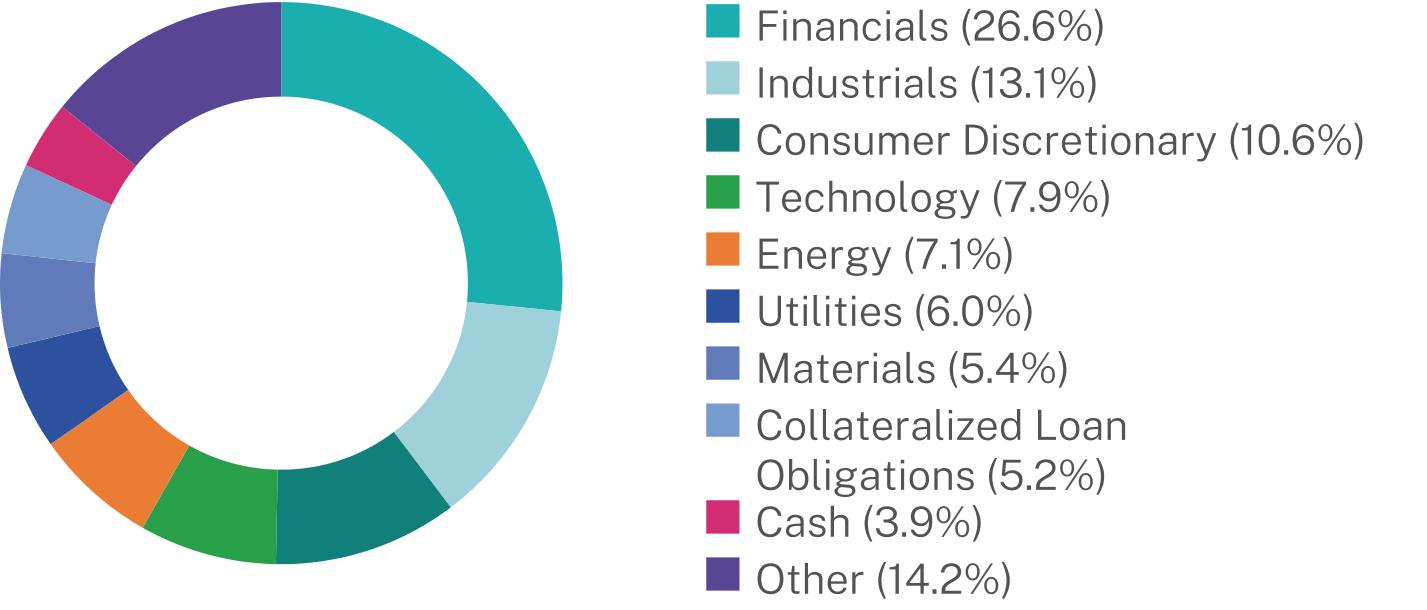
Changes to Shareholder Fees (fees paid directly from your investment).
Effective April 1, 2024, the Fund’s Advisory Fee was reduced from 0.59% to 0.50% and the Supervision and Administration Fee for Class I has been increased from 0.05% to 0.09%. As a result of these changes, the total Management Fee for Class I has been reduced by 0.05%. In addition, the contractual fee waiver for Class I has been reduced from 0.64% to 0.59%.
Changes to Fund’s Principal Risks:
In the Fund’s Principal Risks, Sector Focus Risk and Financial Sector Risk were added.
This report describes changes to the Fund that occurred during the reporting period.
WHAT WERE THE FUND COSTS FOR THE PAST YEAR? (based on a hypothetical $10,000 investment)
|
Class Name
|
Costs of a $10,000 investment
|
Costs paid as a percentage of a $10,000 investment
|
|
Class I-2
|
$71
|
0.69%
|
HOW DID THE FUND PERFORM LAST YEAR AND WHAT AFFECTED ITS PERFORMANCE?
|
•
|
For the 12-month period ended March 31, 2025, the Fund outperformed its performance benchmark, the Bloomberg US Aggregate Bond Index. The Fund invests principally in income-producing debt instruments.
|
|
•
|
The Fund benefited from an elevated rate environment supporting all in yields as well as largely supportive credit spreads.
|
|
•
|
Exposure to credit-sensitive sectors benefited performance for most of the period as credit remained largely well supported. The intermediate curve positioning and elevated yield profile helped to insulate the full effect of credit spread widening seen on a periodic basis as compared to a long duration based offerings.
|
|
•
|
The Fund benefited across the credit quality spectrum with the exception of lower rated credit exposure (some CCC). On the other hand, cash holdings were least additive to return.
|
|
•
|
Positive contributions to relative performance were led by credit selection and active asset class allocation.
|
|
•
|
While the Fund duration moved over the last twelve months, the point-to-point duration was slightly below its starting level. The Fund’s shorter-than-benchmark duration profile proved mostly beneficial to performance. The Fund benefited from an elevated yield environment over the period. On a year-over-year basis, we reduced the investment grade bond exposure. Conversely, we increased the corporate high yield bond exposure along with the floating rate loan exposure.
|
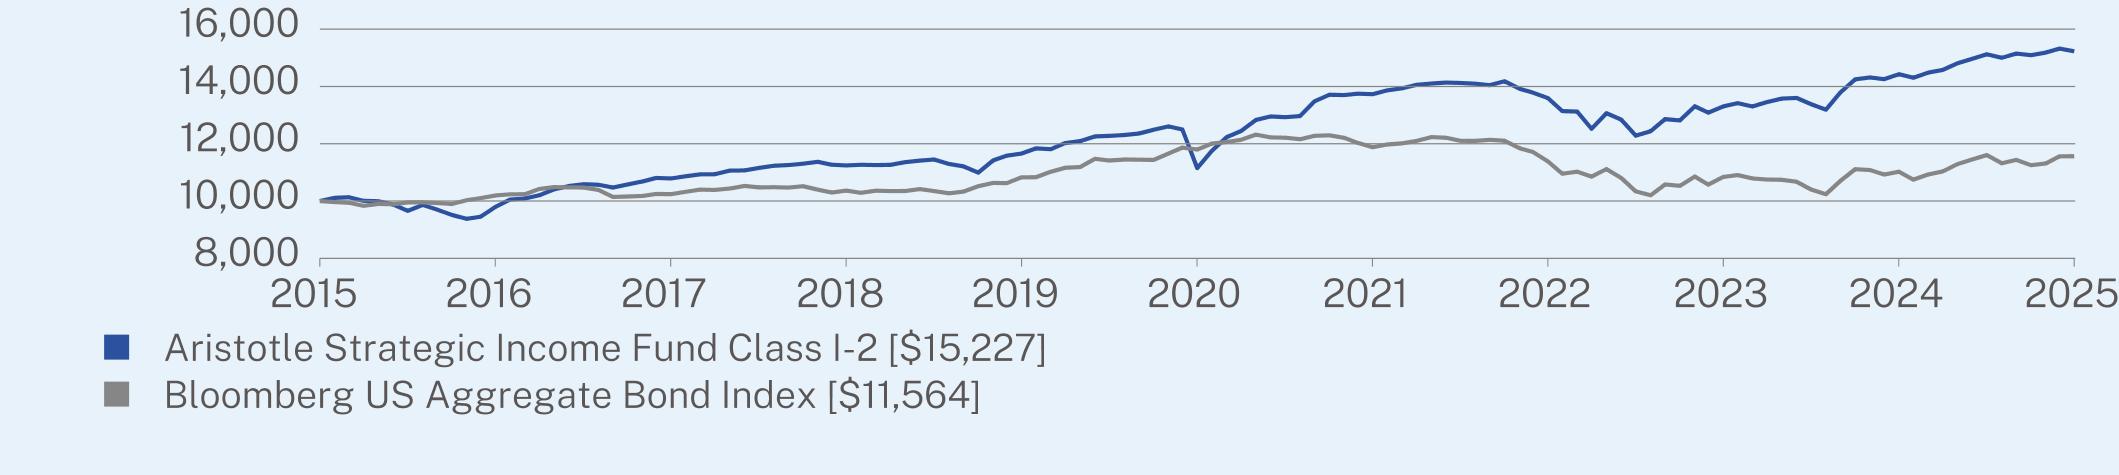
ANNUAL AVERAGE TOTAL RETURN (%)
|
|
1 Year
|
5 Year
|
10 Year
|
|
Class I-2 (without sales charge)
|
5.53
|
6.43
|
4.29
|
|
Bloomberg US Aggregate Bond Index
|
4.88
|
-0.40
|
1.46
|
Visit https://www.aristotlefunds.com/resources/prospectuses-reports for more recent performance information.
KEY FUND STATISTICS (as of March 31, 2025)
|
Net Assets
|
$3,791,942,005
|
|
Number of Holdings
|
437
|
|
Net Advisory Fee
|
$16,201,644
|
|
Portfolio Turnover Rate
|
45%
|
|
Top 10 Issuers
|
(%)
|
|
United States Treasury Note/Bond
|
2.0%
|
|
JPMorgan Chase & Co.
|
1.8%
|
|
Goldman Sachs Group, Inc.
|
1.8%
|
|
Venture Global LNG, Inc.
|
1.7%
|
|
TransDigm, Inc.
|
1.7%
|
|
Citigroup, Inc.
|
1.4%
|
|
Bank of America Corp.
|
1.4%
|
|
Morgan Stanley
|
1.3%
|
|
Energy Transfer LP
|
1.2%
|
|
UKG, Inc.
|
1.2%
|

Changes to Shareholder Fees (fees paid directly from your investment).
Effective April 1, 2024, the Fund’s Advisory Fee was reduced from 0.59% to 0.50% and the Supervision and Administration Fee for Class I-2 was increased from 0.10% to 0.19%. As a result of these changes, there has been no change to the Fund’s total Management Fee.
Changes to Fund’s Principal Risks:
In the Fund’s Principal Risks, Sector Focus Risk and Financial Sector Risk were added.
This report describes changes to the Fund that occurred during the reporting period.
WHAT WERE THE FUND COSTS FOR THE PAST YEAR? (based on a hypothetical $10,000 investment)
|
Class Name
|
Costs of a $10,000 investment
|
Costs paid as a percentage of a $10,000 investment
|
|
Class A
|
$60
|
0.58%
|
HOW DID THE FUND PERFORM LAST YEAR AND WHAT AFFECTED ITS PERFORMANCE?
|
•
|
For the 12-month period ended March 31, 2025, the Fund outperformed its performance benchmark, the Bloomberg Short Treasury Total Return Index. The Fund primarily invests in investment grade, U.S. dollar-denominated short-term fixed and floating rate debt securities, including corporate debt securities, mortgage-related securities, asset-backed securities, U.S. government securities and agency securities and money market instruments such as commercial paper, certificates of deposit, time deposits, deposit notes and bank notes.
|
|
•
|
The front end of the curve was highly favorable due to a yield curve inversion seen through September 2024. Even post re-inversion, yields remained elevated compared to recent history, which was beneficial to the return. Additionally, corporate spreads remained quite favorable for most of the period.
|
|
•
|
Exposure to credit-sensitive sectors benefited performance for most of the period as credit remained largely well supported. The front-end positioning and elevated yield profile helped to insulate the full effect of credit spread widening seen on a periodic basis as compared to a long duration based offerings.
|
|
•
|
By credit quality, BBB-rated credits were most beneficial to performance (corporate investment grade bonds) followed by AAA-rated credits (mostly securitized assets). On the other hand, U.S. government debt and U.S. corporate high yield debt were the least positive to return.
|
|
•
|
Positive contributions to relative performance were led by active asset class allocation and credit selectivity.
|
|
•
|
The Fund duration remained very front-end pinned which benefited from an attractive rate curve. On a year-over-year basis, we reduced floating rate loan and high yield bond exposure as well as slightly trimmed the asset backed security exposure. We increased cash holdings.
|
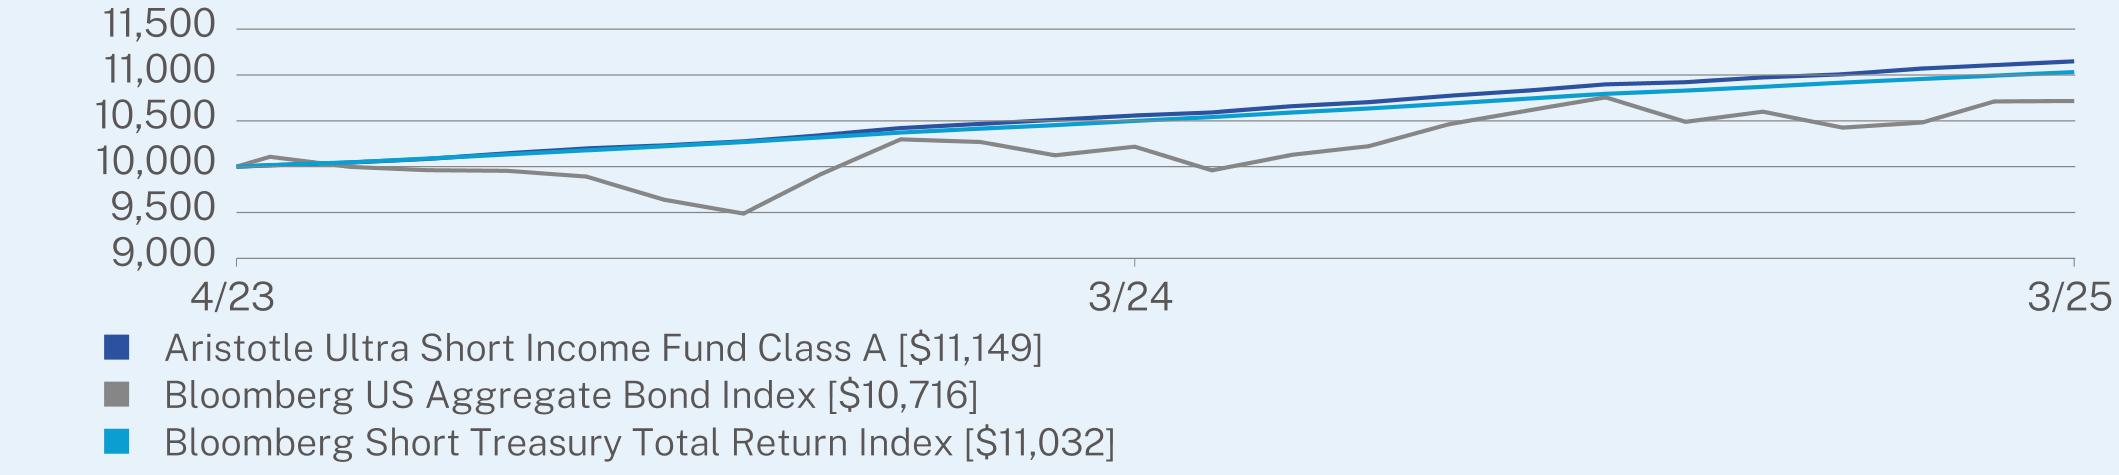
ANNUAL AVERAGE TOTAL RETURN (%)
|
|
1 Year
|
Since Inception
(04/17/2023) |
|
Class A (without sales charge)
|
5.60
|
5.72
|
|
Bloomberg US Aggregate Bond Index
|
4.88
|
3.60
|
|
Bloomberg Short Treasury Total Return Index
|
5.07
|
5.15
|
Visit https://www.aristotlefunds.com/resources/prospectuses-reports for more recent performance information.
KEY FUND STATISTICS (as of March 31, 2025)
|
Net Assets
|
$47,710,925
|
|
Number of Holdings
|
128
|
|
Net Advisory Fee
|
$102,984
|
|
Portfolio Turnover Rate
|
128%
|
|
Top 10 Issuers
|
(%)
|
|
United States Treasury Bill
|
4.2%
|
|
Bank of America Corp.
|
4.0%
|
|
Goldman Sachs Group, Inc.
|
3.3%
|
|
JPMorgan Chase & Co.
|
2.6%
|
|
Morgan Stanley
|
2.4%
|
|
HSBC Holdings PLC
|
2.3%
|
|
Magnetite CLO Ltd.
|
2.2%
|
|
Neuberger Berman CLO Ltd.
|
2.1%
|
|
United Airlines, Inc.
|
2.0%
|
|
Santander Consumer USA Holdings, Inc.
|
1.8%
|
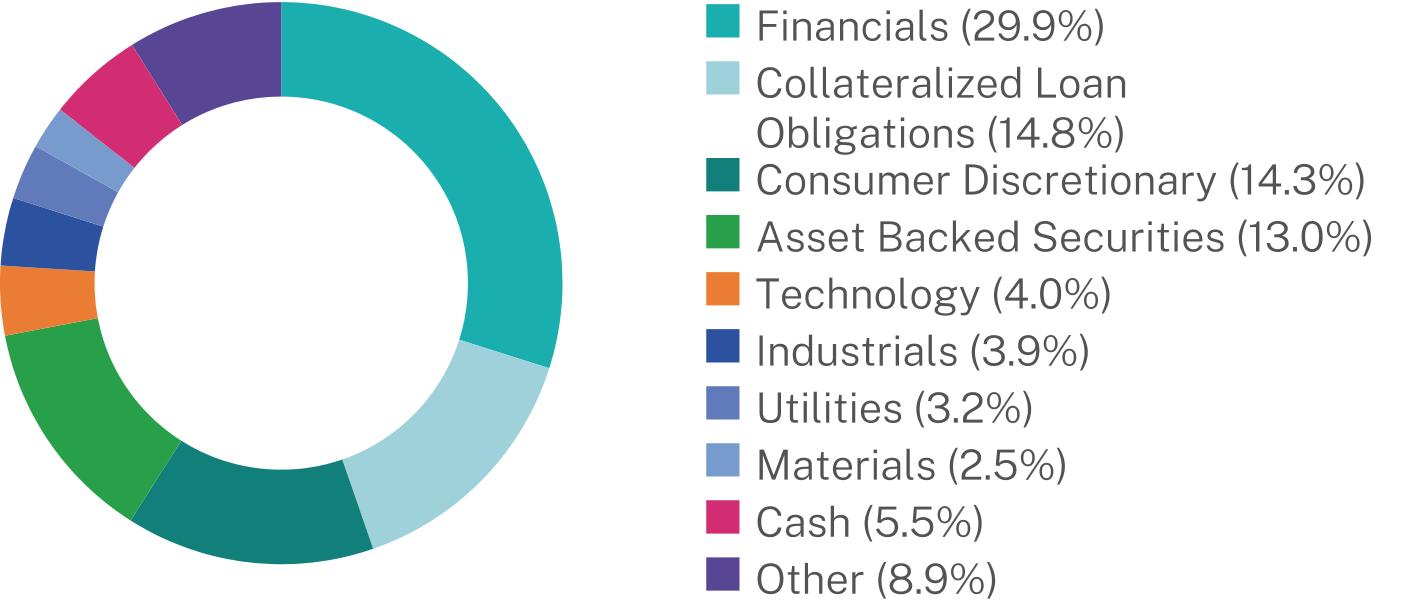
Changes to Fund’s Principal Risks:
In the Fund’s Principal Risks, Sector Focus Risk was added.
This report describes changes to the Fund that occurred during the reporting period.
WHAT WERE THE FUND COSTS FOR THE PAST YEAR? (based on a hypothetical $10,000 investment)
|
Class Name
|
Costs of a $10,000 investment
|
Costs paid as a percentage of a $10,000 investment
|
|
Class I
|
$33
|
0.32%
|
HOW DID THE FUND PERFORM LAST YEAR AND WHAT AFFECTED ITS PERFORMANCE?
|
•
|
For the 12-month period ended March 31, 2025, the Fund outperformed its performance benchmark, the Bloomberg Short Treasury Total Return Index. The Fund primarily invests in investment grade, U.S. dollar-denominated short-term fixed and floating rate debt securities, including corporate debt securities, mortgage-related securities, asset-backed securities, U.S. government securities and agency securities and money market instruments such as commercial paper, certificates of deposit, time deposits, deposit notes and bank notes.
|
|
•
|
The front end of the curve was highly favorable due to a yield curve inversion seen through September 2024. Even post re-inversion, yields remained elevated compared to recent history, which was beneficial to the return. Additionally, corporate spreads remained quite favorable for most of the period.
|
|
•
|
Exposure to credit-sensitive sectors benefited performance for most of the period as credit remained largely well supported. The front-end positioning and elevated yield profile helped to insulate the full effect of credit spread widening seen on a periodic basis as compared to a long duration based offerings.
|
|
•
|
By credit quality, BBB-rated credits were most beneficial to performance (corporate investment grade bonds) followed by AAA-rated credits (mostly securitized assets). On the other hand, U.S. government debt and U.S. corporate high yield debt were the least positive to return.
|
|
•
|
Positive contributions to relative performance were led by active asset class allocation and credit selectivity.
|
|
•
|
The Fund duration remained very front-end pinned which benefited from an attractive rate curve. On a year-over-year basis, we reduced floating rate loan and high yield bond exposure as well as slightly trimmed the asset backed security exposure. We increased cash holdings.
|
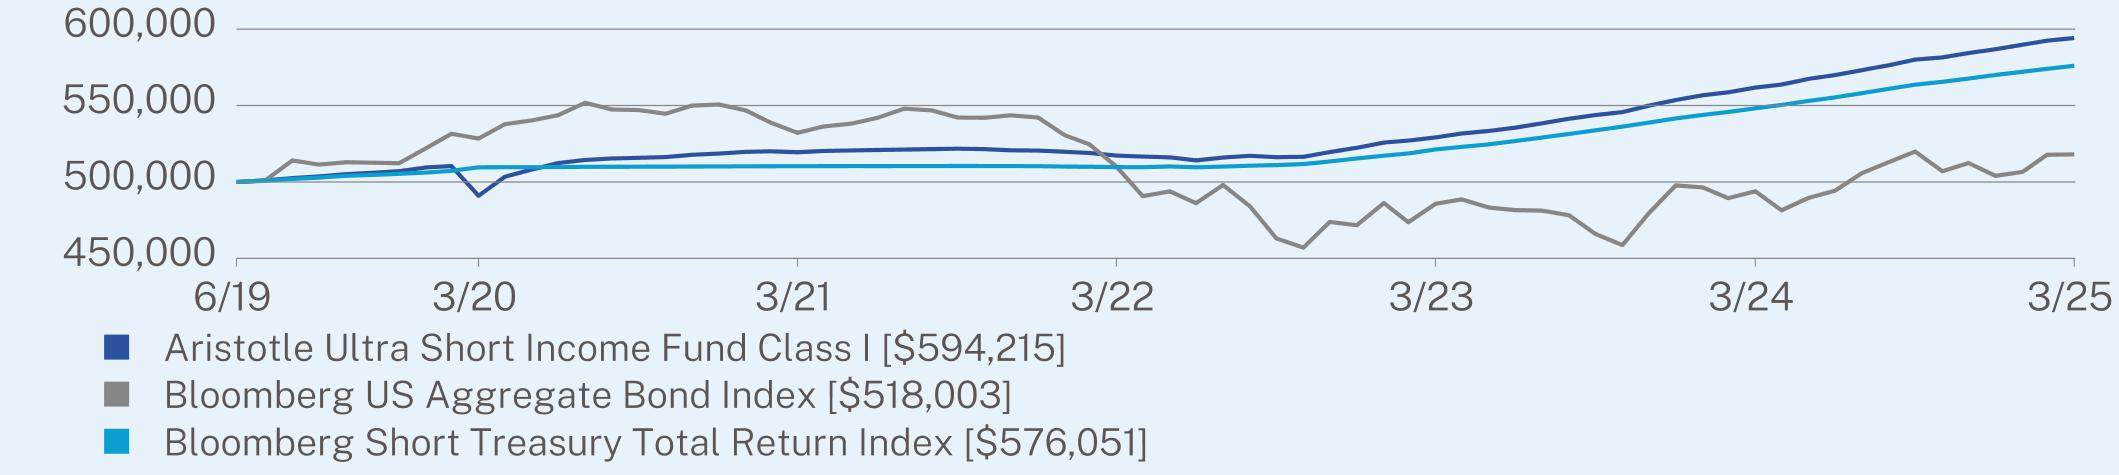
ANNUAL AVERAGE TOTAL RETURN (%)
|
|
1 Year
|
5 Year
|
Since Inception
(06/28/2019) |
|
Class I (without sales charge)
|
5.77
|
3.89
|
3.04
|
|
Bloomberg US Aggregate Bond Index
|
4.88
|
-0.40
|
0.62
|
|
Bloomberg Short Treasury Total Return Index
|
5.07
|
2.48
|
2.49
|
Visit https://www.aristotlefunds.com/resources/prospectuses-reports for more recent performance information.
KEY FUND STATISTICS (as of March 31, 2025)
|
Net Assets
|
$47,710,925
|
|
Number of Holdings
|
128
|
|
Net Advisory Fee
|
$102,984
|
|
Portfolio Turnover Rate
|
128%
|
|
Top 10 Issuers
|
(%)
|
|
United States Treasury Bill
|
4.2%
|
|
Bank of America Corp.
|
4.0%
|
|
Goldman Sachs Group, Inc.
|
3.3%
|
|
JPMorgan Chase & Co.
|
2.6%
|
|
Morgan Stanley
|
2.4%
|
|
HSBC Holdings PLC
|
2.3%
|
|
Magnetite CLO Ltd.
|
2.2%
|
|
Neuberger Berman CLO Ltd.
|
2.1%
|
|
United Airlines, Inc.
|
2.0%
|
|
Santander Consumer USA Holdings, Inc.
|
1.8%
|

Changes to Fund’s Principal Risks:
In the Fund’s Principal Risks, Sector Focus Risk was added.
This report describes changes to the Fund that occurred during the reporting period.
WHAT WERE THE FUND COSTS FOR THE PAST YEAR? (based on a hypothetical $10,000 investment)
|
Class Name
|
Costs of a $10,000 investment
|
Costs paid as a percentage of a $10,000 investment
|
|
Class I-2
|
$33
|
0.32%
|
HOW DID THE FUND PERFORM LAST YEAR AND WHAT AFFECTED ITS PERFORMANCE?
|
•
|
For the 12-month period ended March 31, 2025, the Fund outperformed its performance benchmark, the Bloomberg Short Treasury Total Return Index. The Fund primarily invests in investment grade, U.S. dollar-denominated short-term fixed and floating rate debt securities, including corporate debt securities, mortgage-related securities, asset-backed securities, U.S. government securities and agency securities and money market instruments such as commercial paper, certificates of deposit, time deposits, deposit notes and bank notes.
|
|
•
|
The front end of the curve was highly favorable due to a yield curve inversion seen through September 2024. Even post re-inversion, yields remained elevated compared to recent history, which was beneficial to the return. Additionally, corporate spreads remained quite favorable for most of the period.
|
|
•
|
Exposure to credit-sensitive sectors benefited performance for most of the period as credit remained largely well supported. The front-end positioning and elevated yield profile helped to insulate the full effect of credit spread widening seen on a periodic basis as compared to a long duration based offerings.
|
|
•
|
By credit quality, BBB-rated credits were most beneficial to performance (corporate investment grade bonds) followed by AAA-rated credits (mostly securitized assets). On the other hand, U.S. government debt and U.S. corporate high yield debt were the least positive to return.
|
|
•
|
Positive contributions to relative performance were led by active asset class allocation and credit selectivity.
|
|
•
|
The Fund duration remained very front-end pinned which benefited from an attractive rate curve. On a year-over-year basis, we reduced floating rate loan and high yield bond exposure as well as slightly trimmed the asset backed security exposure. We increased cash holdings.
|
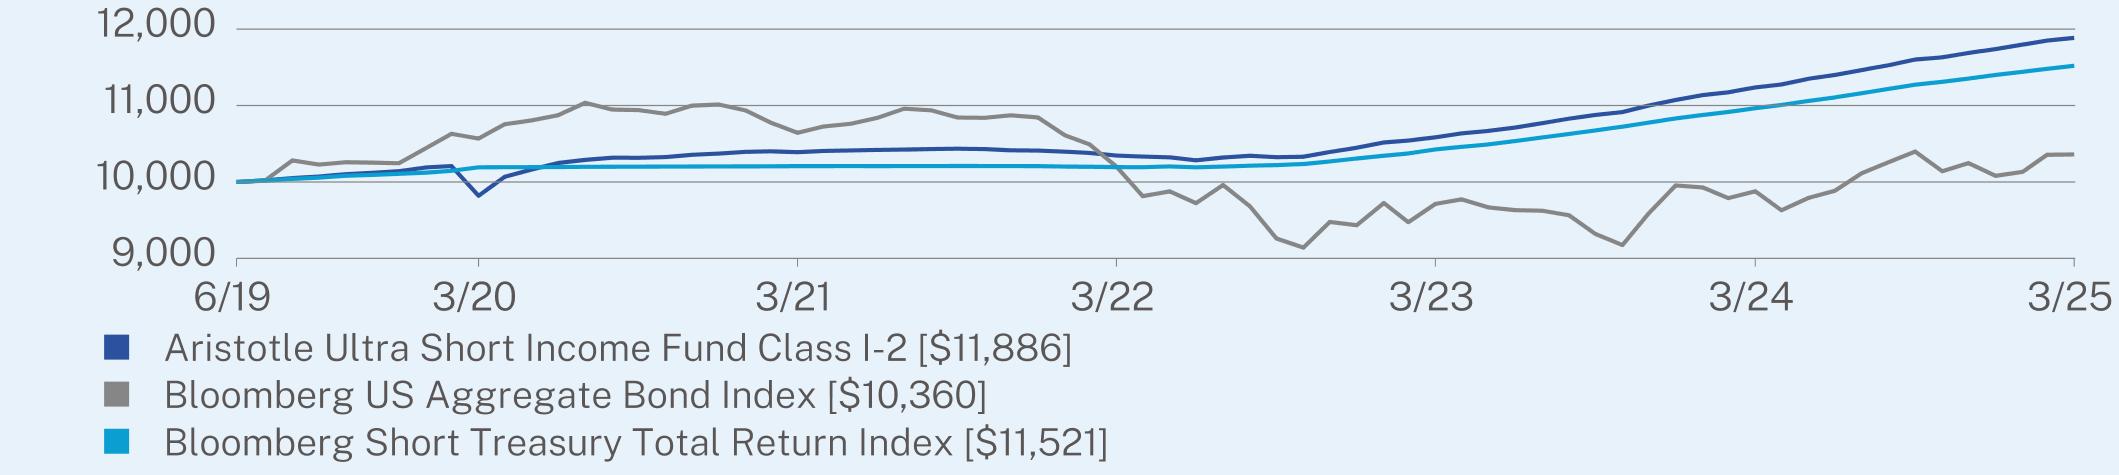
ANNUAL AVERAGE TOTAL RETURN (%)
|
|
1 Year
|
5 Year
|
Since Inception
(06/28/2019) |
|
Class I-2 (without sales charge)
|
5.77
|
3.89
|
3.05
|
|
Bloomberg US Aggregate Bond Index
|
4.88
|
-0.40
|
0.62
|
|
Bloomberg Short Treasury Total Return Index
|
5.07
|
2.48
|
2.49
|
Visit https://www.aristotlefunds.com/resources/prospectuses-reports for more recent performance information.
KEY FUND STATISTICS (as of March 31, 2025)
|
Net Assets
|
$47,710,925
|
|
Number of Holdings
|
128
|
|
Net Advisory Fee
|
$102,984
|
|
Portfolio Turnover Rate
|
128%
|
|
Top 10 Issuers
|
(%)
|
|
United States Treasury Bill
|
4.2%
|
|
Bank of America Corp.
|
4.0%
|
|
Goldman Sachs Group, Inc.
|
3.3%
|
|
JPMorgan Chase & Co.
|
2.6%
|
|
Morgan Stanley
|
2.4%
|
|
HSBC Holdings PLC
|
2.3%
|
|
Magnetite CLO Ltd.
|
2.2%
|
|
Neuberger Berman CLO Ltd.
|
2.1%
|
|
United Airlines, Inc.
|
2.0%
|
|
Santander Consumer USA Holdings, Inc.
|
1.8%
|

Changes to Fund’s Principal Risks:
In the Fund’s Principal Risks, Sector Focus Risk was added.
This report describes changes to the Fund that occurred during the reporting period.
WHAT WERE THE FUND COSTS FOR THE PAST YEAR? (based on a hypothetical $10,000 investment)
|
Class Name
|
Costs of a $10,000 investment
|
Costs paid as a percentage of a $10,000 investment
|
|
Class A
|
$93
|
0.90%
|
HOW DID THE FUND PERFORM LAST YEAR AND WHAT AFFECTED ITS PERFORMANCE?
|
•
|
For the 12-month period ended March 31, 2025, the Fund underperformed its performance benchmark, the S&P 500 Index. The Fund invests at least 80% of its assets in equity securities.
|
|
•
|
The underperformance of the Fund relative to the S&P 500 Index over the 1-year period was due to security selection, while sector allocation contributed to relative performance.
|
|
•
|
Security selection in consumer staples and industrials detracted the most from relative performance. Conversely, security selection in healthcare and communication services contributed.
|
|
•
|
Darling Ingredients, Halliburton and Avery Dennison were the largest detractors over the period. Meanwhile, Guardant Health, Adaptive Biotechnologies and Antero Resources were the top contributors to relative performance for the year.
|
|
•
|
From a sector allocation standpoint, underweights in financials and utilities detracted from relative performance. Conversely, an overweight to consumer discretionary and underweight in materials contributed to relative performance.
|
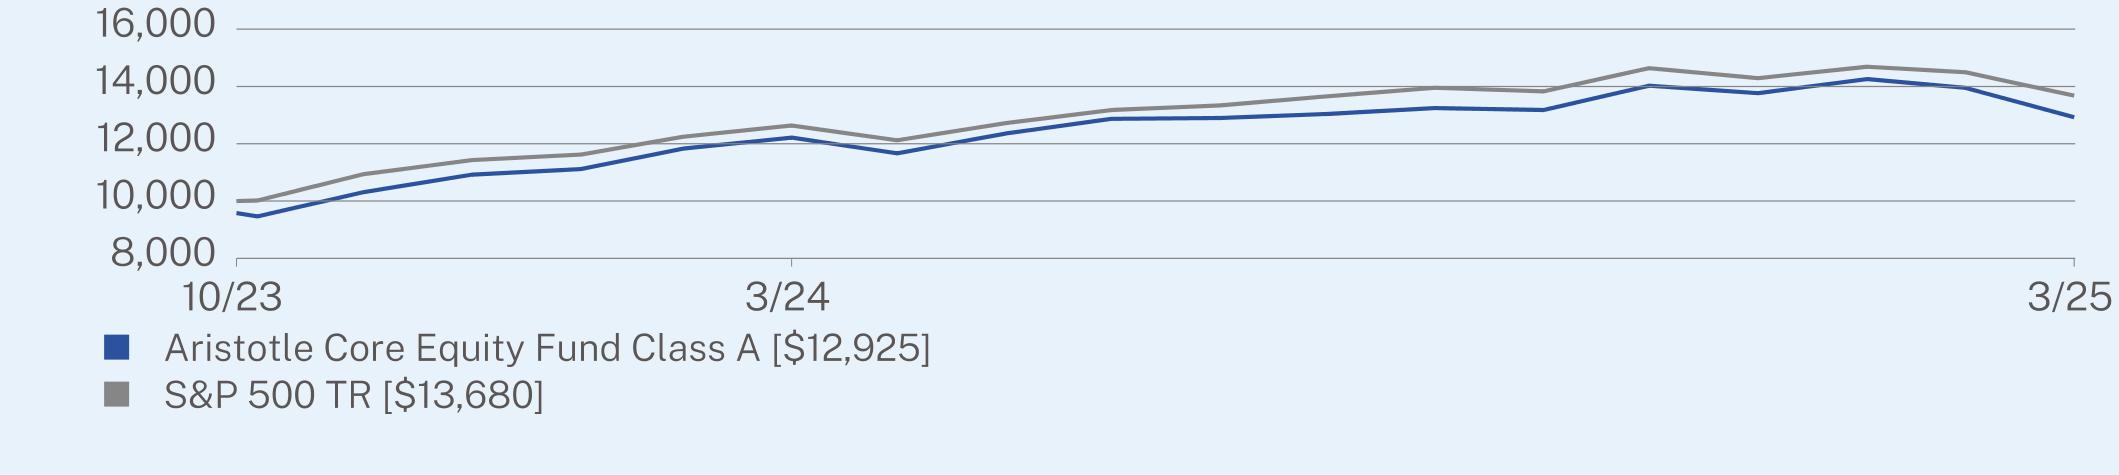
ANNUAL AVERAGE TOTAL RETURN (%)
|
|
1 Year
|
Since Inception
(10/25/2023) |
|
Class A (without sales charge)
|
5.82
|
23.26
|
|
Class A (with sales charge)
|
1.34
|
19.61
|
|
S&P 500 TR
|
8.25
|
24.44
|
Visit https://www.aristotlefunds.com/resources/prospectuses-reports for more recent performance information.
KEY FUND STATISTICS (as of March 31, 2025)
|
Net Assets
|
$491,650,394
|
|
Number of Holdings
|
51
|
|
Net Advisory Fee
|
$2,184,347
|
|
Portfolio Turnover Rate
|
26%
|
|
Top 10 Issuers
|
(%)
|
|
Microsoft Corp.
|
7.1%
|
|
NVIDIA Corp.
|
6.1%
|
|
Apple, Inc.
|
5.6%
|
|
Amazon.com, Inc.
|
4.6%
|
|
Meta Platforms, Inc.
|
4.3%
|
|
Alphabet, Inc.
|
4.1%
|
|
JPMorgan Chase & Co.
|
3.4%
|
|
Costco Wholesale Corp.
|
2.8%
|
|
Broadcom, Inc.
|
2.8%
|
|
Visa, Inc.
|
2.7%
|

Changes to Fund’s Principal Risks:
In the Fund’s Principal Risks, REIT Investment Risk and Emerging Markets Risk were added.
This report describes changes to the Fund that occurred during the reporting period.
WHAT WERE THE FUND COSTS FOR THE PAST YEAR? (based on a hypothetical $10,000 investment)
|
Class Name
|
Costs of a $10,000 investment
|
Costs paid as a percentage of a $10,000 investment
|
|
Class I
|
$67
|
0.65%
|
HOW DID THE FUND PERFORM LAST YEAR AND WHAT AFFECTED ITS PERFORMANCE?
|
•
|
For the 12-month period ended March 31, 2025, the Fund underperformed its performance benchmark, the S&P 500 Index. The Fund invests at least 80% of its assets in equity securities.
|
|
•
|
The underperformance of the Fund relative to the S&P 500 Index over the 1-year period was due to security selection, while sector allocation contributed to relative performance.
|
|
•
|
Security selection in consumer staples and industrials detracted the most from relative performance. Conversely, security selection in healthcare and communication services contributed.
|
|
•
|
Darling Ingredients, Halliburton and Avery Dennison were the largest detractors over the period. Meanwhile, Guardant Health, Adaptive Biotechnologies and Antero Resources were the top contributors to relative performance for the year.
|
|
•
|
From a sector allocation standpoint, underweights in financials and utilities detracted from relative performance. Conversely, an overweight to consumer discretionary and underweight in materials contributed to relative performance.
|
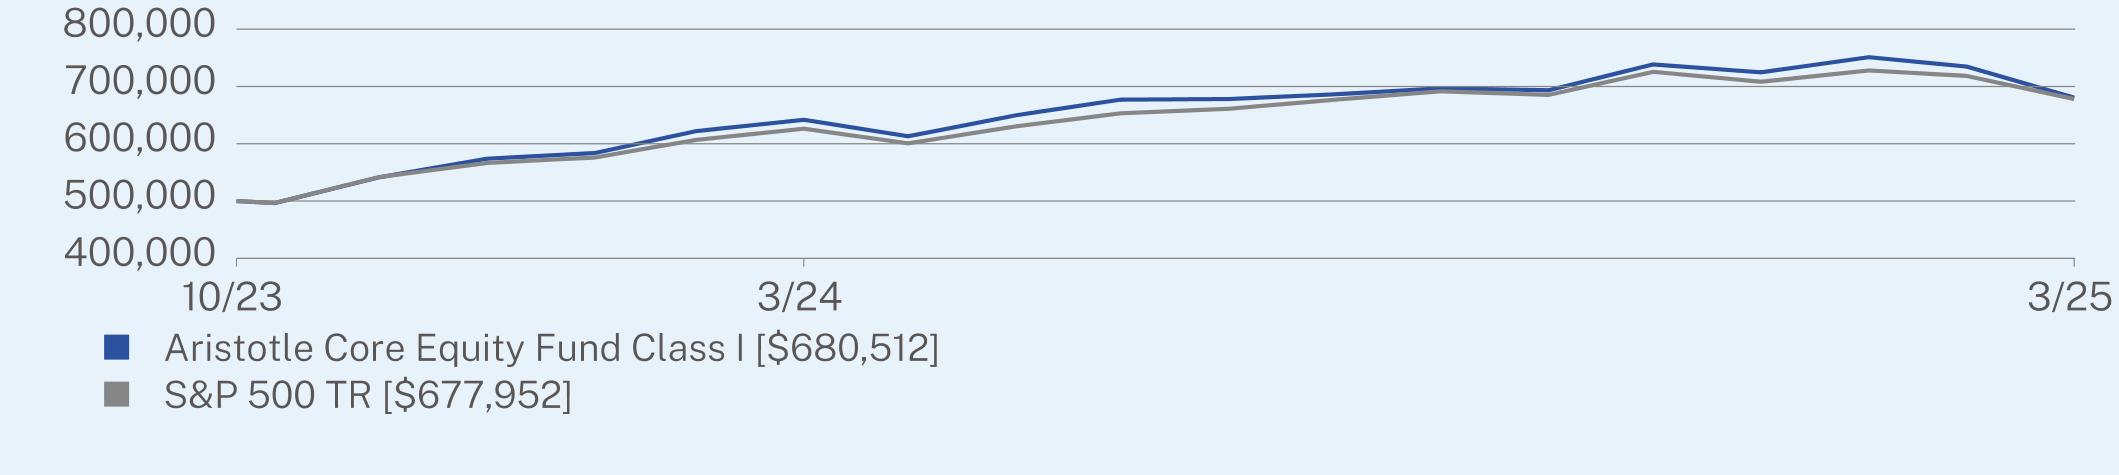
ANNUAL AVERAGE TOTAL RETURN (%)
|
|
1 Year
|
Since Inception
(10/20/2023) |
|
Class I (without sales charge)
|
6.03
|
23.75
|
|
S&P 500 TR
|
8.25
|
23.43
|
Visit https://www.aristotlefunds.com/resources/prospectuses-reports for more recent performance information.
KEY FUND STATISTICS (as of March 31, 2025)
|
Net Assets
|
$491,650,394
|
|
Number of Holdings
|
51
|
|
Net Advisory Fee
|
$2,184,347
|
|
Portfolio Turnover Rate
|
26%
|
|
Top 10 Issuers
|
(%)
|
|
Microsoft Corp.
|
7.1%
|
|
NVIDIA Corp.
|
6.1%
|
|
Apple, Inc.
|
5.6%
|
|
Amazon.com, Inc.
|
4.6%
|
|
Meta Platforms, Inc.
|
4.3%
|
|
Alphabet, Inc.
|
4.1%
|
|
JPMorgan Chase & Co.
|
3.4%
|
|
Costco Wholesale Corp.
|
2.8%
|
|
Broadcom, Inc.
|
2.8%
|
|
Visa, Inc.
|
2.7%
|
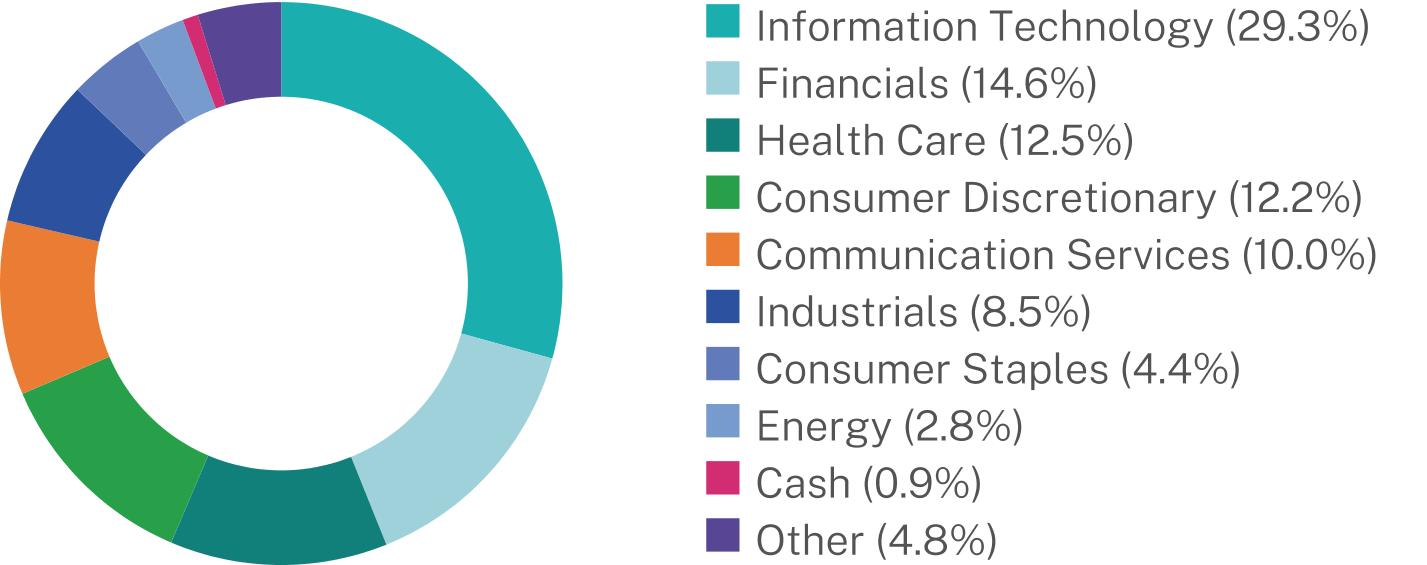
Changes to Shareholder Fees (fees paid directly from your investment).
Class I: Effective April 1, 2024, a Management Fee waiver was implemented to limit Total Annual Fund Operating Expenses to 0.65%.
Changes to Fund’s Principal Risks:
In the Fund’s Principal Risks, REIT Investment Risk and Emerging Markets Risk were added.
This report describes changes to the Fund that occurred during the reporting period.
WHAT WERE THE FUND COSTS FOR THE PAST YEAR? (based on a hypothetical $10,000 investment)
|
Class Name
|
Costs of a $10,000 investment
|
Costs paid as a percentage of a $10,000 investment
|
|
Class I-2
|
$67
|
0.65%
|
HOW DID THE FUND PERFORM LAST YEAR AND WHAT AFFECTED ITS PERFORMANCE?
|
•
|
For the 12-month period ended March 31, 2025, the Fund underperformed its performance benchmark, the S&P 500 Index. The Fund invests at least 80% of its assets in equity securities.
|
|
•
|
The underperformance of the Fund relative to the S&P 500 Index over the 1-year period was due to security selection, while sector allocation contributed to relative performance.
|
|
•
|
Security selection in consumer staples and industrials detracted the most from relative performance. Conversely, security selection in healthcare and communication services contributed.
|
|
•
|
Darling Ingredients, Halliburton and Avery Dennison were the largest detractors over the period. Meanwhile, Guardant Health, Adaptive Biotechnologies and Antero Resources were the top contributors to relative performance for the year.
|
|
•
|
From a sector allocation standpoint, underweights in financials and utilities detracted from relative performance. Conversely, an overweight to consumer discretionary and underweight in materials contributed to relative performance.
|
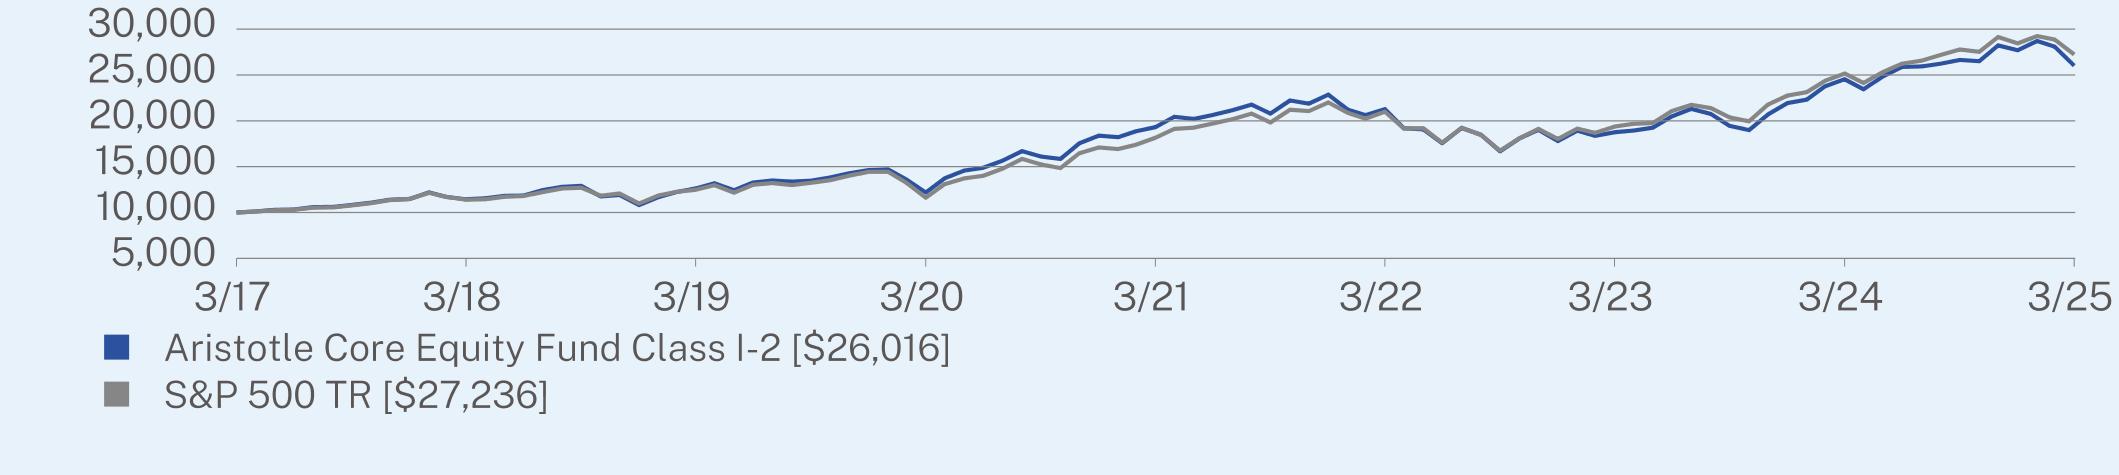
ANNUAL AVERAGE TOTAL RETURN (%)
|
|
1 Year
|
5 Year
|
Since Inception
(03/31/2017) |
|
Class I-2 (without sales charge)
|
6.02
|
16.40
|
12.70
|
|
S&P 500 TR
|
8.25
|
18.59
|
13.34
|
Visit https://www.aristotlefunds.com/resources/prospectuses-reports for more recent performance information.
KEY FUND STATISTICS (as of March 31, 2025)
|
Net Assets
|
$491,650,394
|
|
Number of Holdings
|
51
|
|
Net Advisory Fee
|
$2,184,347
|
|
Portfolio Turnover Rate
|
26%
|
|
Top 10 Issuers
|
(%)
|
|
Microsoft Corp.
|
7.1%
|
|
NVIDIA Corp.
|
6.1%
|
|
Apple, Inc.
|
5.6%
|
|
Amazon.com, Inc.
|
4.6%
|
|
Meta Platforms, Inc.
|
4.3%
|
|
Alphabet, Inc.
|
4.1%
|
|
JPMorgan Chase & Co.
|
3.4%
|
|
Costco Wholesale Corp.
|
2.8%
|
|
Broadcom, Inc.
|
2.8%
|
|
Visa, Inc.
|
2.7%
|

Changes to Fund’s Principal Risks:
In the Fund’s Principal Risks, REIT Investment Risk and Emerging Markets Risk were added.
This report describes changes to the Fund that occurred during the reporting period.
WHAT WERE THE FUND COSTS FOR THE PAST YEAR? (based on a hypothetical $10,000 investment)
|
Class Name
|
Costs of a $10,000 investment
|
Costs paid as a percentage of a $10,000 investment
|
|
Class A
|
$98
|
0.95%
|
HOW DID THE FUND PERFORM LAST YEAR AND WHAT AFFECTED ITS PERFORMANCE?
|
•
|
For the 12-month period ended March 31, 2025, the Fund underperformed its performance benchmark, the Russell 1000 Growth Index. The Fund invests at least 80% of its assets in equity securities.
|
|
•
|
The underperformance of the Fund relative to the Russell 1000 Growth Index over the 1-year period was due to security selection and sector allocation.
|
|
•
|
Security selection in information technology and industrials detracted the most from relative performance. Conversely, security selection in financials and consumer discretionary contributed.
|
|
•
|
Dexcom, Synopsys and Bio-Techne were the largest detractors over the period. Meanwhile, Guardant Health, Adaptive Biotechnologies and NVIDIA were the top contributors to relative performance for the year.
|
|
•
|
From a sector allocation standpoint, underweights in financials and energy detracted from relative performance. Conversely, an overweight to consumer discretionary and underweight in consumer staples contributed to relative performance.
|
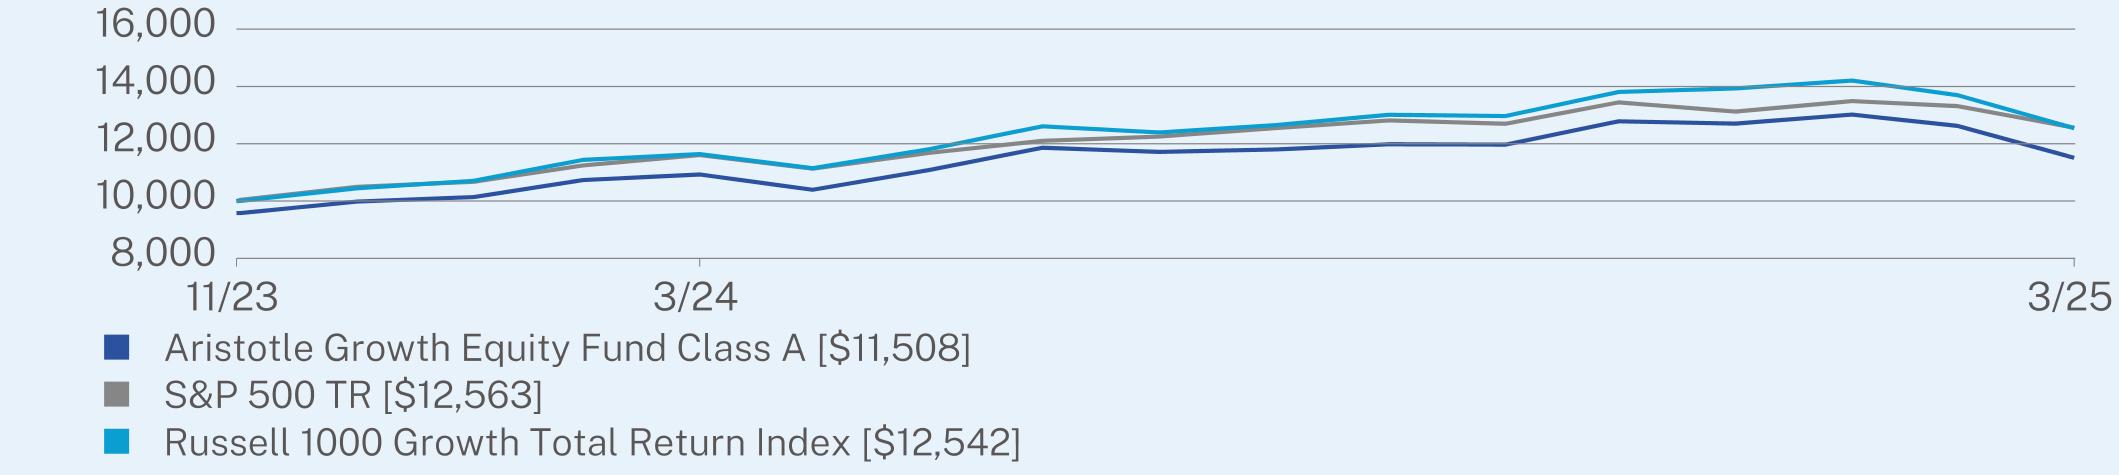
ANNUAL AVERAGE TOTAL RETURN (%)
|
|
1 Year
|
Since Inception
(11/29/2023) |
|
Class A (without sales charge)
|
5.31
|
14.71
|
|
Class A (with sales charge)
|
0.83
|
11.07
|
|
S&P 500 TR
|
8.25
|
18.61
|
|
Russell 1000 Growth Total Return Index
|
7.76
|
18.46
|
Visit https://www.aristotlefunds.com/resources/prospectuses-reports for more recent performance information.
KEY FUND STATISTICS (as of March 31, 2025)
|
Net Assets
|
$233,695,319
|
|
Number of Holdings
|
38
|
|
Net Advisory Fee
|
$1,609,666
|
|
Portfolio Turnover Rate
|
35%
|
|
Top 10 Issuers
|
(%)
|
|
Microsoft Corp.
|
10.8%
|
|
NVIDIA Corp.
|
10.1%
|
|
Apple, Inc.
|
10.0%
|
|
Amazon.com, Inc.
|
7.9%
|
|
Alphabet, Inc.
|
6.2%
|
|
Visa, Inc.
|
4.9%
|
|
Meta Platforms, Inc.
|
4.1%
|
|
Broadcom, Inc.
|
3.1%
|
|
Costco Wholesale Corp.
|
2.6%
|
|
Home Depot, Inc.
|
2.5%
|

Changes to Fund’s Principal Risks:
In the Fund’s Principal Risks, Sector Focus Risk, REIT Investment Risk, Warrants and Rights Risk and Small-Capitalization Companies Risk were added.
This report describes changes to the Fund that occurred during the reporting period.
WHAT WERE THE FUND COSTS FOR THE PAST YEAR? (based on a hypothetical $10,000 investment)
|
Class Name
|
Costs of a $10,000 investment
|
Costs paid as a percentage of a $10,000 investment
|
|
Class I
|
$72
|
0.70%
|
HOW DID THE FUND PERFORM LAST YEAR AND WHAT AFFECTED ITS PERFORMANCE?
|
•
|
For the 12-month period ended March 31, 2025, the Fund underperformed its performance benchmark, the Russell 1000 Growth Index. The Fund invests at least 80% of its assets in equity securities.
|
|
•
|
The underperformance of the Fund relative to the Russell 1000 Growth Index over the 1-year period was due to security selection and sector allocation.
|
|
•
|
Security selection in information technology and industrials detracted the most from relative performance. Conversely, security selection in financials and consumer discretionary contributed.
|
|
•
|
Dexcom, Synopsys and Bio-Techne were the largest detractors over the period. Meanwhile, Guardant Health, Adaptive Biotechnologies and NVIDIA were the top contributors to relative performance for the year.
|
|
•
|
From a sector allocation standpoint, underweights in financials and energy detracted from relative performance. Conversely, an overweight to consumer discretionary and underweight in consumer staples contributed to relative performance.
|
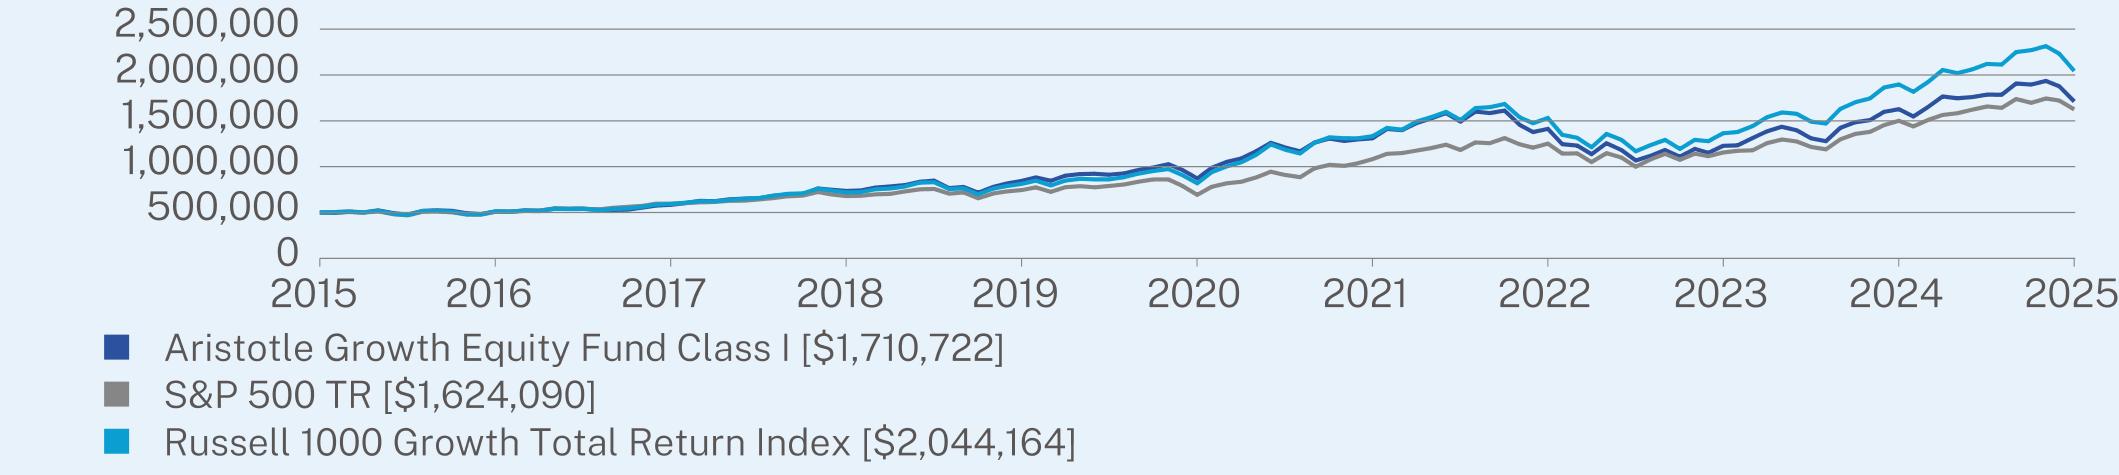
ANNUAL AVERAGE TOTAL RETURN (%)
|
|
1 Year
|
5 Year
|
10 Year
|
|
Class I (without sales charge)
|
5.15
|
14.46
|
13.09
|
|
S&P 500 TR
|
8.25
|
18.59
|
12.50
|
|
Russell 1000 Growth Total Return Index
|
7.76
|
20.09
|
15.12
|
Visit https://www.aristotlefunds.com/resources/prospectuses-reports for more recent performance information.
KEY FUND STATISTICS (as of March 31, 2025)
|
Net Assets
|
$233,695,319
|
|
Number of Holdings
|
38
|
|
Net Advisory Fee
|
$1,609,666
|
|
Portfolio Turnover Rate
|
35%
|
|
Top 10 Issuers
|
(%)
|
|
Microsoft Corp.
|
10.8%
|
|
NVIDIA Corp.
|
10.1%
|
|
Apple, Inc.
|
10.0%
|
|
Amazon.com, Inc.
|
7.9%
|
|
Alphabet, Inc.
|
6.2%
|
|
Visa, Inc.
|
4.9%
|
|
Meta Platforms, Inc.
|
4.1%
|
|
Broadcom, Inc.
|
3.1%
|
|
Costco Wholesale Corp.
|
2.6%
|
|
Home Depot, Inc.
|
2.5%
|
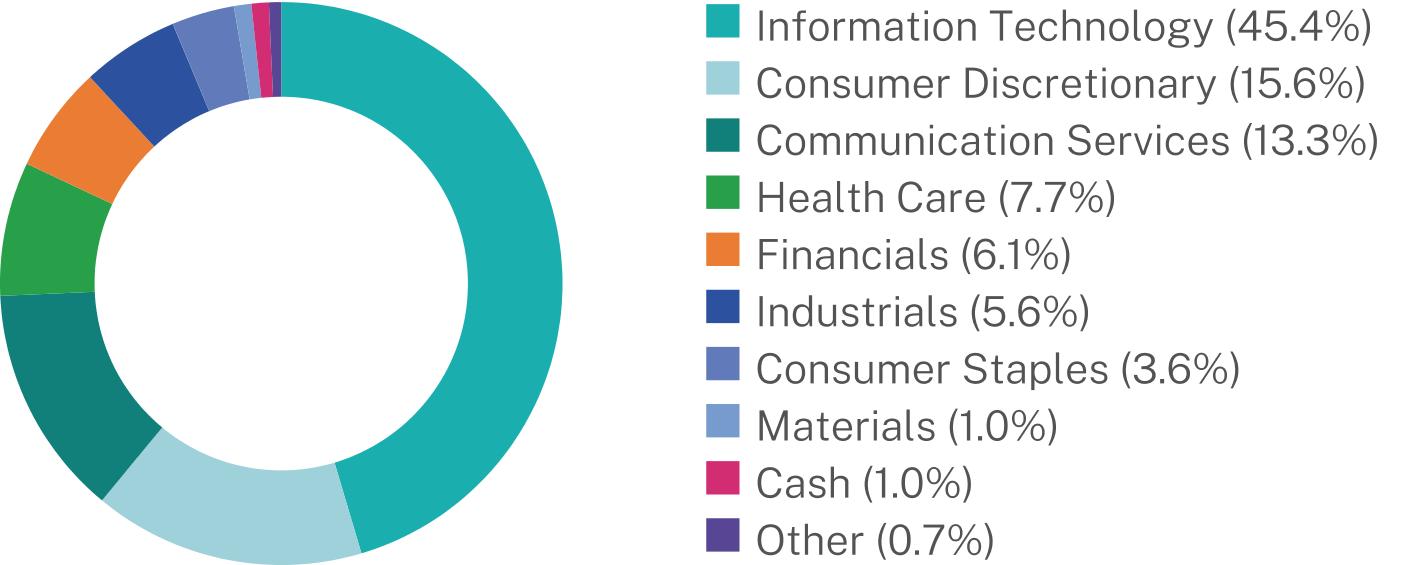
Changes to Fund’s Principal Risks:
In the Fund’s Principal Risks, Sector Focus Risk, REIT Investment Risk, Warrants and Rights Risk and Small-Capitalization Companies Risk were added.
This report describes changes to the Fund that occurred during the reporting period.
WHAT WERE THE FUND COSTS FOR THE PAST YEAR? (based on a hypothetical $10,000 investment)
|
Class Name
|
Costs of a $10,000 investment
|
Costs paid as a percentage of a $10,000 investment
|
|
Class I-2
|
$72
|
0.70%
|
HOW DID THE FUND PERFORM LAST YEAR AND WHAT AFFECTED ITS PERFORMANCE?
|
•
|
For the 12-month period ended March 31, 2025, the Fund underperformed its performance benchmark, the Russell 1000 Growth Index. The Fund invests at least 80% of its assets in equity securities.
|
|
•
|
The underperformance of the Fund relative to the Russell 1000 Growth Index over the 1-year period was due to security selection and sector allocation.
|
|
•
|
Security selection in information technology and industrials detracted the most from relative performance. Conversely, security selection in financials and consumer discretionary contributed.
|
|
•
|
Dexcom, Synopsys and Bio-Techne were the largest detractors over the period. Meanwhile, Guardant Health, Adaptive Biotechnologies and NVIDIA were the top contributors to relative performance for the year.
|
|
•
|
From a sector allocation standpoint, underweights in financials and energy detracted from relative performance. Conversely, an overweight to consumer discretionary and underweight in consumer staples contributed to relative performance.
|
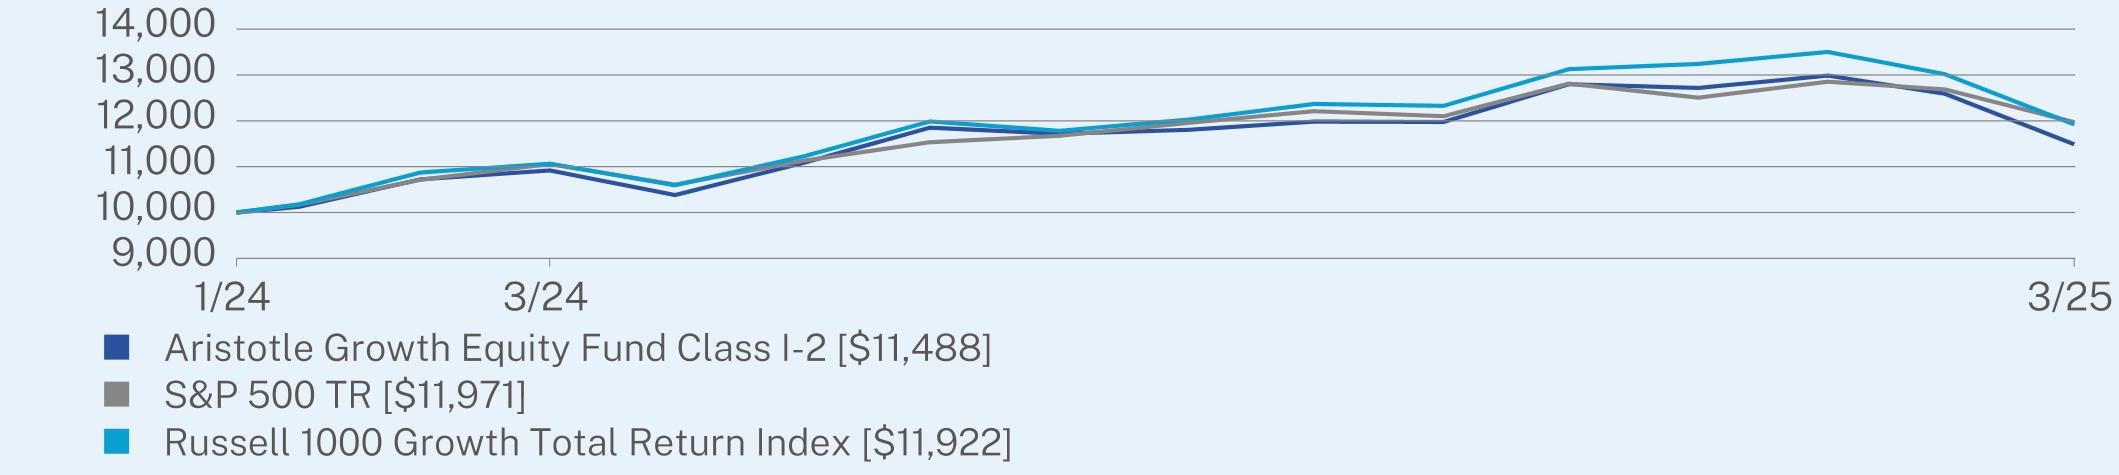
ANNUAL AVERAGE TOTAL RETURN (%)
|
|
1 Year
|
Since Inception
(01/16/2024) |
|
Class I-2 (without sales charge)
|
5.23
|
12.20
|
|
S&P 500 TR
|
8.25
|
16.10
|
|
Russell 1000 Growth Total Return Index
|
7.76
|
15.70
|
Visit https://www.aristotlefunds.com/resources/prospectuses-reports for more recent performance information.
KEY FUND STATISTICS (as of March 31, 2025)
|
Net Assets
|
$233,695,319
|
|
Number of Holdings
|
38
|
|
Net Advisory Fee
|
$1,609,666
|
|
Portfolio Turnover Rate
|
35%
|
|
Top 10 Issuers
|
(%)
|
|
Microsoft Corp.
|
10.8%
|
|
NVIDIA Corp.
|
10.1%
|
|
Apple, Inc.
|
10.0%
|
|
Amazon.com, Inc.
|
7.9%
|
|
Alphabet, Inc.
|
6.2%
|
|
Visa, Inc.
|
4.9%
|
|
Meta Platforms, Inc.
|
4.1%
|
|
Broadcom, Inc.
|
3.1%
|
|
Costco Wholesale Corp.
|
2.6%
|
|
Home Depot, Inc.
|
2.5%
|

Changes to Fund’s Principal Risks:
In the Fund’s Principal Risks, Sector Focus Risk, REIT Investment Risk, Warrants and Rights Risk and Small-Capitalization Companies Risk were added.
This report describes changes to the Fund that occurred during the reporting period.
WHAT WERE THE FUND COSTS FOR THE PAST YEAR? (based on a hypothetical $10,000 investment)
|
Class Name
|
Costs of a $10,000 investment
|
Costs paid as a percentage of a $10,000 investment
|
|
Class A
|
$107
|
1.04%
|
HOW DID THE FUND PERFORM LAST YEAR AND WHAT AFFECTED ITS PERFORMANCE?
|
•
|
For the 12-month period ended March 31, 2025, the Fund outperformed its primary performance benchmark, the MSCI EAFE Index (net), but underperformed its secondary performance benchmark, the MSCI ACWI ex USA Index (net). The Fund invests at least 80% of its assets in publicly traded equity securities or depositary receipts of companies organized, headquartered, or doing a substantial amount of business outside of the United States.
|
|
•
|
The performance explanation is provided relative to the primary benchmark, the MSCI EAFE Index (net). The outperformance of the Fund relative to the MSCI EAFE Index (net) over the 1-year period came from security selection, while sector allocation detracted value.
|
|
•
|
Security selection in the healthcare and consumer discretionary sectors added the most. On the other hand, security selection in the industrials and materials sectors detracted the most. Exposure to Sony, Erste Group Bank and DBS Group positively contributed to relative returns. Meanwhile, Samsung Electronics, Ashtead Group and LVMH Moët Hennessy Louis Vuitton were the top detractors to relative performance for the year.
|
|
•
|
It is also worth noting that the largest holding of the Index, Novo Nordisk, dropped 46% over the period as newer entrants in the GLP-1 business (a pharmaceutical for diabetes being used for weight loss) threatens the company’s dominance. Security selection here helped the Fund’s excess returns.
|
|
•
|
From a sector allocation standpoint, an overweight position in the industrials sector and an underweight position in the materials sector added to relative performance. An underweight exposure to the communication services sector and an overweight position in the consumer discretionary sector detracted value.
|
|
•
|
Regionally, security selection in Developed Asia positively contributed to relative return, while security selection in the United Kingdom detracted. A significant underweight allocation to Developed Asia proved to be beneficial to performance but was partially offset by the Fund’s exposure to select Emerging Markets, specifically Peru and South Korea).
|

ANNUAL AVERAGE TOTAL RETURN (%)
|
|
1 Year
|
Since Inception
(12/28/2023) |
|
Class A (without sales charge)
|
5.37
|
7.06
|
|
Class A (with sales charge)
|
0.88
|
3.45
|
|
MSCI AC WORLD INDEX ex USA Net (USD)
|
6.09
|
8.60
|
|
MSCI EAFE Net (USD)
|
4.88
|
8.42
|
Visit https://www.aristotlefunds.com/resources/prospectuses-reports for more recent performance information.
KEY FUND STATISTICS (as of March 31, 2025)
|
Net Assets
|
$555,189,249
|
|
Number of Holdings
|
39
|
|
Net Advisory Fee
|
$3,684,143
|
|
Portfolio Turnover Rate
|
12%
|
|
Top 10 Issuers
|
(%)
|
|
Sony Group Corp.
|
4.5%
|
|
Brookfield Corp.
|
4.0%
|
|
Safran SA
|
3.8%
|
|
MonotaRO Co. Ltd.
|
3.8%
|
|
Nemetschek SE
|
3.7%
|
|
Muenchener Rueckversicherungs-Gesellschaft AG in Muenchen
|
3.5%
|
|
Pan Pacific International Holdings Corp.
|
3.5%
|
|
DBS Group Holdings Ltd.
|
3.5%
|
|
Accenture PLC
|
3.4%
|
|
Roche Holding AG
|
3.3%
|

|
Top Ten Countries
|
(%)
|
|
Japan
|
21.4%
|
|
United Kingdom
|
16.5%
|
|
France
|
12.6%
|
|
Germany
|
8.9%
|
|
Switzerland
|
7.8%
|
|
Canada
|
7.0%
|
|
Ireland
|
5.8%
|
|
Singapore
|
3.5%
|
|
Netherlands
|
3.2%
|
|
Cash & Other
|
13.3%
|
Changes to Shareholder Fees (fees paid directly from your investment).
Effective April 1, 2024, the Fund’s Advisory Fee was reduced from 0.70% to 0.60% and the Supervision and Administration Fee for Class A has been increased from 0.08% to 0.18%. As a result of these changes, there has been no change to the Fund’s total Management Fee.
Changes to Fund’s Principal Risks:
In the Fund’s Principal Risks, Sector Focus Risk was added.
This report describes changes to the Fund that occurred during the reporting period.
WHAT WERE THE FUND COSTS FOR THE PAST YEAR? (based on a hypothetical $10,000 investment)
|
Class Name
|
Costs of a $10,000 investment
|
Costs paid as a percentage of a $10,000 investment
|
|
Class I
|
$80
|
0.78%
|
HOW DID THE FUND PERFORM LAST YEAR AND WHAT AFFECTED ITS PERFORMANCE?
|
•
|
For the 12-month period ended March 31, 2025, the Fund outperformed its primary performance benchmark, the MSCI EAFE Index (net), but underperformed its secondary performance benchmark, the MSCI ACWI ex USA Index (net). The Fund invests at least 80% of its assets in publicly traded equity securities or depositary receipts of companies organized, headquartered, or doing a substantial amount of business outside of the United States.
|
|
•
|
The performance explanation is provided relative to the primary benchmark, the MSCI EAFE Index (net). The outperformance of the Fund relative to the MSCI EAFE Index (net) over the 1-year period came from security selection, while sector allocation detracted value.
|
|
•
|
Security selection in the healthcare and consumer discretionary sectors added the most. On the other hand, security selection in the industrials and materials sectors detracted the most. Exposure to Sony, Erste Group Bank and DBS Group positively contributed to relative returns. Meanwhile, Samsung Electronics, Ashtead Group and LVMH Moët Hennessy Louis Vuitton were the top detractors to relative performance for the year.
|
|
•
|
It is also worth noting that the largest holding of the Index, Novo Nordisk, dropped 46% over the period as newer entrants in the GLP-1 business (a pharmaceutical for diabetes being used for weight loss) threatens the company’s dominance. Security selection here helped the Fund’s excess returns.
|
|
•
|
From a sector allocation standpoint, an overweight position in the industrials sector and an underweight position in the materials sector added to relative performance. An underweight exposure to the communication services sector and an overweight position in the consumer discretionary sector detracted value.
|
|
•
|
Regionally, security selection in Developed Asia positively contributed to relative return, while security selection in the United Kingdom detracted. A significant underweight allocation to Developed Asia proved to be beneficial to performance but was partially offset by the Fund’s exposure to select Emerging Markets, specifically Peru and South Korea).
|
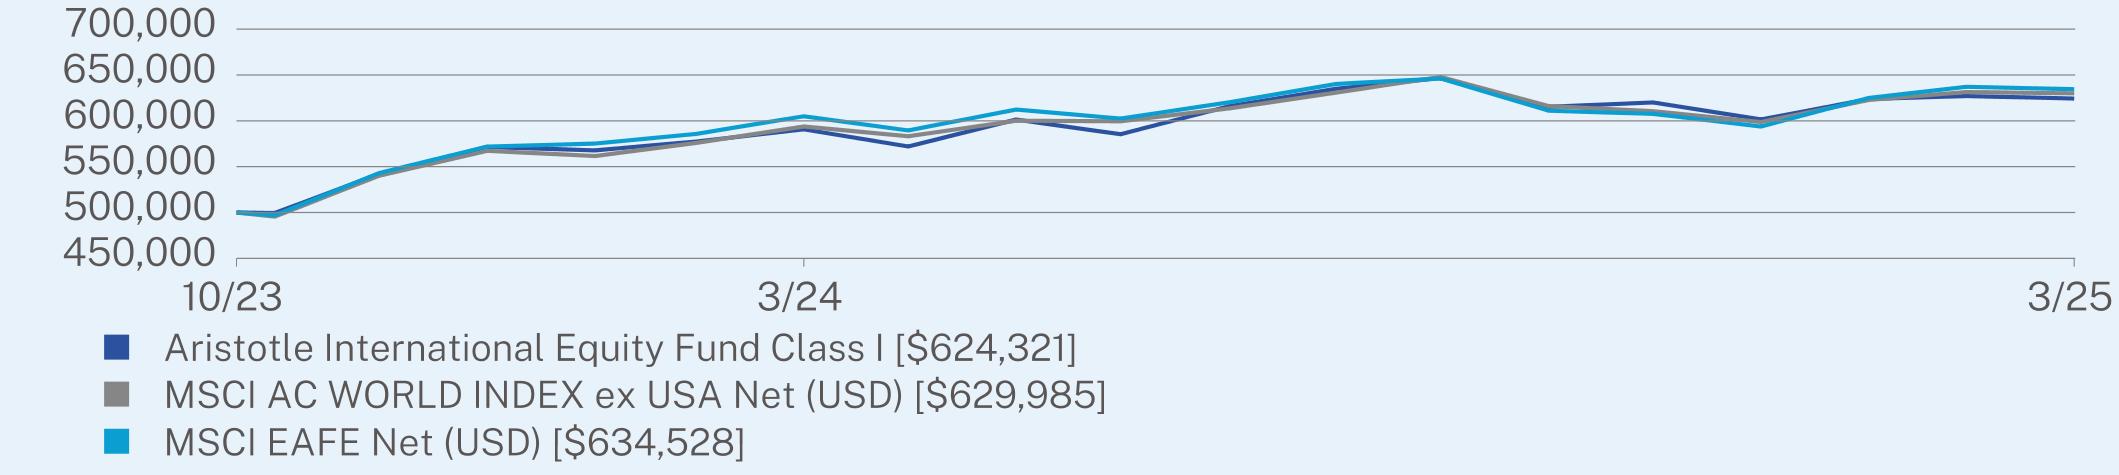
ANNUAL AVERAGE TOTAL RETURN (%)
|
|
1 Year
|
Since Inception
(10/20/2023) |
|
Class I (without sales charge)
|
5.69
|
16.59
|
|
MSCI AC WORLD INDEX ex USA Net (USD)
|
6.09
|
17.32
|
|
MSCI EAFE Net (USD)
|
4.88
|
17.91
|
Visit https://www.aristotlefunds.com/resources/prospectuses-reports for more recent performance information.
KEY FUND STATISTICS (as of March 31, 2025)
|
Net Assets
|
$555,189,249
|
|
Number of Holdings
|
39
|
|
Net Advisory Fee
|
$3,684,143
|
|
Portfolio Turnover Rate
|
12%
|
|
Top 10 Issuers
|
(%)
|
|
Sony Group Corp.
|
4.5%
|
|
Brookfield Corp.
|
4.0%
|
|
Safran SA
|
3.8%
|
|
MonotaRO Co. Ltd.
|
3.8%
|
|
Nemetschek SE
|
3.7%
|
|
Muenchener Rueckversicherungs-Gesellschaft AG in Muenchen
|
3.5%
|
|
Pan Pacific International Holdings Corp.
|
3.5%
|
|
DBS Group Holdings Ltd.
|
3.5%
|
|
Accenture PLC
|
3.4%
|
|
Roche Holding AG
|
3.3%
|
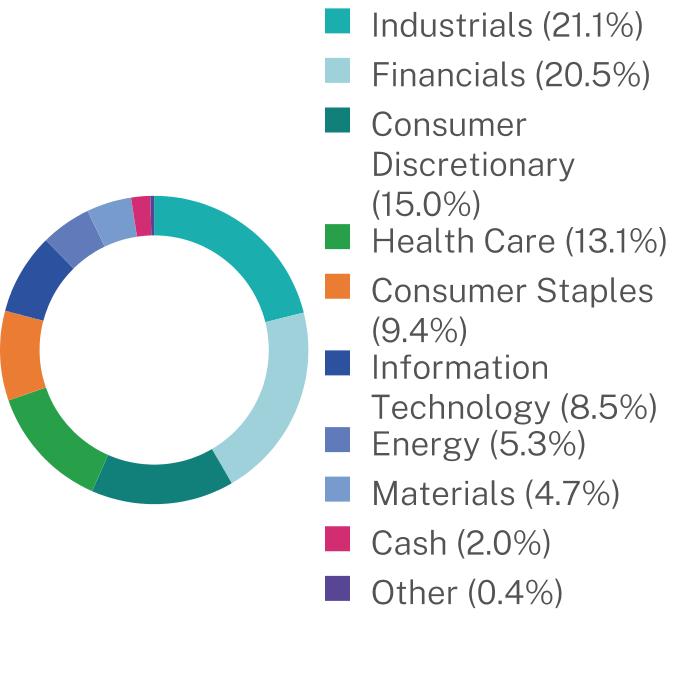
|
Top Ten Countries
|
(%)
|
|
Japan
|
21.4%
|
|
United Kingdom
|
16.5%
|
|
France
|
12.6%
|
|
Germany
|
8.9%
|
|
Switzerland
|
7.8%
|
|
Canada
|
7.0%
|
|
Ireland
|
5.8%
|
|
Singapore
|
3.5%
|
|
Netherlands
|
3.2%
|
|
Cash & Other
|
13.3%
|
Changes to Shareholder Fees (fees paid directly from your investment).
Effective April 1, 2024, a Management Fee waiver was implemented to limit Total Annual Fund Operating Expenses to 0.78%. Effective April 1, 2024, the Fund’s Advisory Fee was reduced from 0.70% to 0.60% and the Supervision and
Administration Fee for Class I has been increased from 0.08% to 0.18%. As a result of these changes, there has been no change to the Fund’s total Management Fee.
Changes to Fund’s Principal Risks:
In the Fund’s Principal Risks, Sector Focus Risk was added.
This report describes changes to the Fund that occurred during the reporting period.
WHAT WERE THE FUND COSTS FOR THE PAST YEAR? (based on a hypothetical $10,000 investment)
|
Class Name
|
Costs of a $10,000 investment
|
Costs paid as a percentage of a $10,000 investment
|
|
Class I-2
|
$80
|
0.78%
|
HOW DID THE FUND PERFORM LAST YEAR AND WHAT AFFECTED ITS PERFORMANCE?
|
•
|
For the 12-month period ended March 31, 2025, the Fund outperformed its primary performance benchmark, the MSCI EAFE Index (net), but underperformed its secondary performance benchmark, the MSCI ACWI ex USA Index (net). The Fund invests at least 80% of its assets in publicly traded equity securities or depositary receipts of companies organized, headquartered, or doing a substantial amount of business outside of the United States.
|
|
•
|
The performance explanation is provided relative to the primary benchmark, the MSCI EAFE Index (net). The outperformance of the Fund relative to the MSCI EAFE Index (net) over the 1-year period came from security selection, while sector allocation detracted value.
|
|
•
|
Security selection in the healthcare and consumer discretionary sectors added the most. On the other hand, security selection in the industrials and materials sectors detracted the most. Exposure to Sony, Erste Group Bank and DBS Group positively contributed to relative returns. Meanwhile, Samsung Electronics, Ashtead Group and LVMH Moët Hennessy Louis Vuitton were the top detractors to relative performance for the year.
|
|
•
|
It is also worth noting that the largest holding of the Index, Novo Nordisk, dropped 46% over the period as newer entrants in the GLP-1 business (a pharmaceutical for diabetes being used for weight loss) threatens the company’s dominance. Security selection here helped the Fund’s excess returns.
|
|
•
|
From a sector allocation standpoint, an overweight position in the industrials sector and an underweight position in the materials sector added to relative performance. An underweight exposure to the communication services sector and an overweight position in the consumer discretionary sector detracted value.
|
|
•
|
Regionally, security selection in Developed Asia positively contributed to relative return, while security selection in the United Kingdom detracted. A significant underweight allocation to Developed Asia proved to be beneficial to performance but was partially offset by the Fund’s exposure to select Emerging Markets, specifically Peru and South Korea).
|
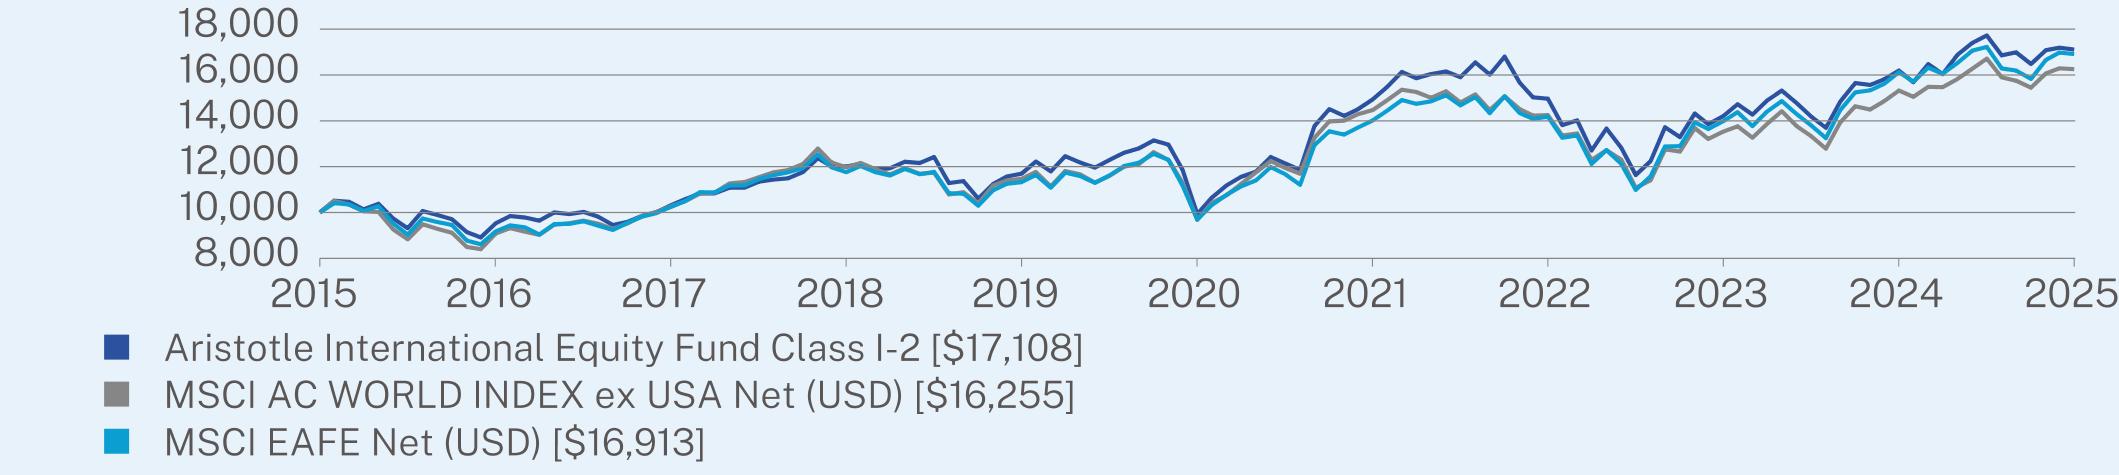
ANNUAL AVERAGE TOTAL RETURN (%)
|
|
1 Year
|
5 Year
|
10 Year
|
|
Class I-2 (without sales charge)
|
5.65
|
11.49
|
5.52
|
|
MSCI AC WORLD INDEX ex USA Net (USD)
|
6.09
|
10.92
|
4.98
|
|
MSCI EAFE Net (USD)
|
4.88
|
11.77
|
5.40
|
Visit https://www.aristotlefunds.com/resources/prospectuses-reports for more recent performance information.
KEY FUND STATISTICS (as of March 31, 2025)
|
Net Assets
|
$555,189,249
|
|
Number of Holdings
|
39
|
|
Net Advisory Fee
|
$3,684,143
|
|
Portfolio Turnover Rate
|
12%
|
|
Top 10 Issuers
|
(%)
|
|
Sony Group Corp.
|
4.5%
|
|
Brookfield Corp.
|
4.0%
|
|
Safran SA
|
3.8%
|
|
MonotaRO Co. Ltd.
|
3.8%
|
|
Nemetschek SE
|
3.7%
|
|
Muenchener Rueckversicherungs-Gesellschaft AG in Muenchen
|
3.5%
|
|
Pan Pacific International Holdings Corp.
|
3.5%
|
|
DBS Group Holdings Ltd.
|
3.5%
|
|
Accenture PLC
|
3.4%
|
|
Roche Holding AG
|
3.3%
|

|
Top Ten Countries
|
(%)
|
|
Japan
|
21.4%
|
|
United Kingdom
|
16.5%
|
|
France
|
12.6%
|
|
Germany
|
8.9%
|
|
Switzerland
|
7.8%
|
|
Canada
|
7.0%
|
|
Ireland
|
5.8%
|
|
Singapore
|
3.5%
|
|
Netherlands
|
3.2%
|
|
Cash & Other
|
13.3%
|
Changes to Shareholder Fees (fees paid directly from your investment).
Effective April 1, 2024, a Management Fee waiver was implemented to limit Total Annual Fund Operating Expenses to 0.78%. Effective April 1, 2024, the Fund’s Advisory Fee was reduced from 0.70% to 0.60% and the Supervision and
Administration Fee for Class I has been increased from 0.08% to 0.18%. As a result of these changes, there has been no change to the Fund’s total Management Fee.
Changes to Fund’s Principal Risks:
In the Fund’s Principal Risks, Sector Focus Risk was added.
This report describes changes to the Fund that occurred during the reporting period.
WHAT WERE THE FUND COSTS FOR THE PAST YEAR? (based on a hypothetical $10,000 investment)
|
Class Name
|
Costs of a $10,000 investment
|
Costs paid as a percentage of a $10,000 investment
|
|
Class A
|
$114
|
1.16%
|
HOW DID THE FUND PERFORM LAST YEAR AND WHAT AFFECTED ITS PERFORMANCE?
|
•
|
For the 12-month period ended March 31, 2025, the Fund outperformed its performance benchmark, the Russell 2000 Index. The Fund invests at least 80% of its assets in equity securities of small-capitalization companies.
|
|
•
|
U.S. small cap equities generally advanced between April and November of last year, mainly driven by investor sentiment around the Federal Reserve and the potential for the easing cycle to resume, coupled with the post-election advance, peaking on November 25, 2024. Subsequently, volatility increased, and sentiment turned negative with markets selling off, as clarity around the Federal Reserve’s interest rate policy came into focus, with investors adjusting to a higher for longer interest rate environment. Additionally, uncertainty around the new administration’s policies and implementation methods and geopolitical tensions also weighed on markets.
|
|
•
|
The primary driver of the Fund’s relative outperformance during the fiscal year was strong security selection while sector allocation detracted. Security selection within the information technology and materials sectors were the largest contributors, while selections in consumer discretionary and consumer staples detracted.
|
|
•
|
On a relative basis, Huron Consulting Group, ACI Worldwide and an out-of-benchmark position in World Wrestling Entertainment contributed the most to performance.
|
|
•
|
In contrast, the biggest individual relative detractors to performance were out-of-benchmark positions in Acadia Healthcare and Carter’s, alongside Columbus Mckinnon.
|
|
•
|
Examining sector allocation, underweight exposures to consumer discretionary and healthcare (specifically pharmaceuticals and biotechnology) both added value, while an underweight exposure in financials and an overweight exposure in information technology detracted from relative performance.
|
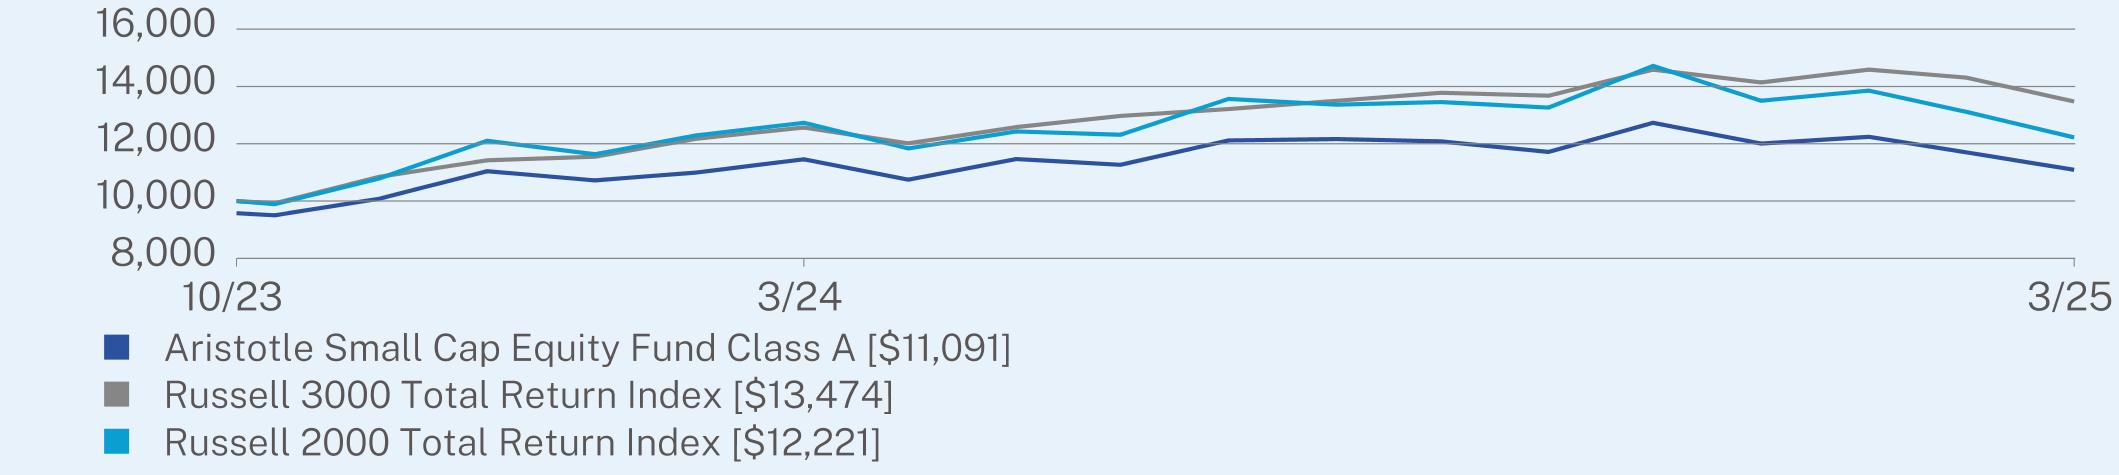
ANNUAL AVERAGE TOTAL RETURN (%)
|
|
1 Year
|
Since Inception
(10/20/2023) |
|
Class A (without sales charge)
|
-3.20
|
10.69
|
|
Class A (with sales charge)
|
-7.29
|
7.42
|
|
Russell 3000 Total Return Index
|
7.22
|
22.89
|
|
Russell 2000 Total Return Index
|
-4.01
|
14.88
|
Visit https://www.aristotlefunds.com/resources/prospectuses-reports for more recent performance information.
KEY FUND STATISTICS (as of March 31, 2025)
|
Net Assets
|
$149,826,774
|
|
Number of Holdings
|
98
|
|
Net Advisory Fee
|
$1,271,976
|
|
Portfolio Turnover Rate
|
15%
|
|
Top 10 Issuers
|
(%)
|
|
Huron Consulting Group, Inc.
|
2.9%
|
|
AerCap Holdings NV
|
2.6%
|
|
ACI Worldwide, Inc.
|
2.4%
|
|
Itron, Inc.
|
2.3%
|
|
Merit Medical Systems, Inc.
|
2.3%
|
|
HealthEquity, Inc.
|
2.0%
|
|
TKO Group Holdings, Inc.
|
2.0%
|
|
MACOM Technology Solutions Holdings, Inc.
|
1.9%
|
|
Chemed Corp.
|
1.9%
|
|
Dycom Industries, Inc.
|
1.9%
|

Changes to the Fund’s Principal Investment Strategy:
The Fund’s Principal Investment Strategies were revised to reflect that the Fund defines a small cap company as one that, at the time of initial purchase, has a market capitalization that falls within the capitalization range of the Russell 2000® Index.
Changes to Shareholder Fees (fees paid directly from your investment).
Effective April 1, 2024, the Fund’s Advisory Fee was reduced from 0.70% to 0.65% and the Supervision and Administration Fee for Class A was increased from 0.20% to 0.25%. As a result of these changes, there has been no change to the Fund’s total Management Fee.
Changes to Fund’s Principal Risks:
In the Fund’s Principal Risks, Sector Focus Risk and Industrial Sector Risk were added.
This report describes changes to the Fund that occurred during the reporting period.
WHAT WERE THE FUND COSTS FOR THE PAST YEAR? (based on a hypothetical $10,000 investment)
|
Class Name
|
Costs of a $10,000 investment
|
Costs paid as a percentage of a $10,000 investment
|
|
Class C
|
$187
|
1.91%
|
HOW DID THE FUND PERFORM LAST YEAR AND WHAT AFFECTED ITS PERFORMANCE?
|
•
|
For the 12-month period ended March 31, 2025, the Fund outperformed its performance benchmark, the Russell 2000 Index. The Fund invests at least 80% of its assets in equity securities of small-capitalization companies.
|
|
•
|
U.S. small cap equities generally advanced between April and November of last year, mainly driven by investor sentiment around the Federal Reserve and the potential for the easing cycle to resume, coupled with the post-election advance, peaking on November 25, 2024. Subsequently, volatility increased, and sentiment turned negative with markets selling off, as clarity around the Federal Reserve’s interest rate policy came into focus, with investors adjusting to a higher for longer interest rate environment. Additionally, uncertainty around the new administration’s policies and implementation methods and geopolitical tensions also weighed on markets.
|
|
•
|
The primary driver of the Fund’s relative outperformance during the fiscal year was strong security selection while sector allocation detracted. Security selection within the information technology and materials sectors were the largest contributors, while selections in consumer discretionary and consumer staples detracted.
|
|
•
|
On a relative basis, Huron Consulting Group, ACI Worldwide and an out-of-benchmark position in World Wrestling Entertainment contributed the most to performance.
|
|
•
|
In contrast, the biggest individual relative detractors to performance were out-of-benchmark positions in Acadia Healthcare and Carter’s, alongside Columbus Mckinnon.
|
|
•
|
Examining sector allocation, underweight exposures to consumer discretionary and healthcare (specifically pharmaceuticals and biotechnology) both added value, while an underweight exposure in financials and an overweight exposure in information technology detracted from relative performance.
|
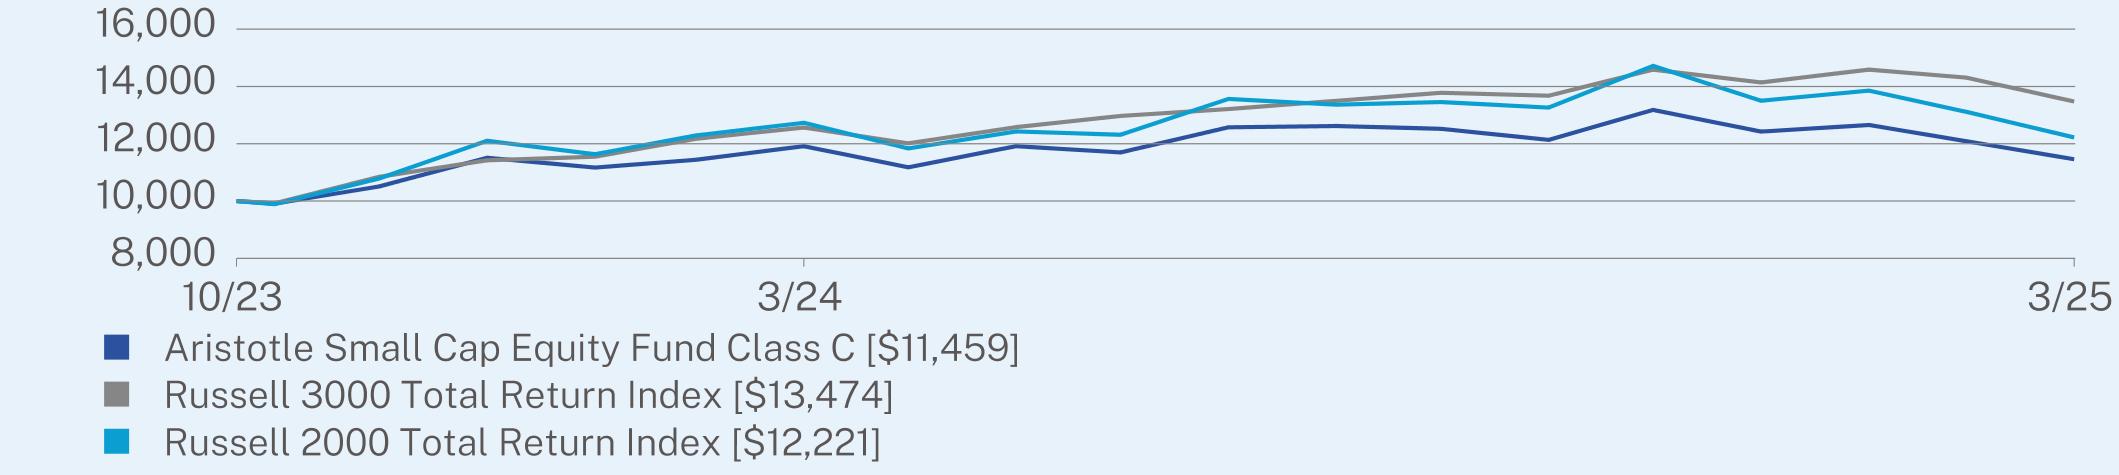
ANNUAL AVERAGE TOTAL RETURN (%)
|
|
1 Year
|
Since Inception
(10/20/2023) |
|
Class C (without sales charge)
|
-3.83
|
9.87
|
|
Class C (with sales charge)
|
-4.79
|
9.87
|
|
Russell 3000 Total Return Index
|
7.22
|
22.89
|
|
Russell 2000 Total Return Index
|
-4.01
|
14.88
|
Visit https://www.aristotlefunds.com/resources/prospectuses-reports for more recent performance information.
KEY FUND STATISTICS (as of March 31, 2025)
|
Net Assets
|
$149,826,774
|
|
Number of Holdings
|
98
|
|
Net Advisory Fee
|
$1,271,976
|
|
Portfolio Turnover Rate
|
15%
|
|
Top 10 Issuers
|
(%)
|
|
Huron Consulting Group, Inc.
|
2.9%
|
|
AerCap Holdings NV
|
2.6%
|
|
ACI Worldwide, Inc.
|
2.4%
|
|
Itron, Inc.
|
2.3%
|
|
Merit Medical Systems, Inc.
|
2.3%
|
|
HealthEquity, Inc.
|
2.0%
|
|
TKO Group Holdings, Inc.
|
2.0%
|
|
MACOM Technology Solutions Holdings, Inc.
|
1.9%
|
|
Chemed Corp.
|
1.9%
|
|
Dycom Industries, Inc.
|
1.9%
|

Changes to the Fund’s Principal Investment Strategy:
The Fund’s Principal Investment Strategies were revised to reflect that the Fund defines a small cap company as one that, at the time of initial purchase, has a market capitalization that falls within the capitalization range of the Russell 2000® Index.
Changes to Shareholder Fees (fees paid directly from your investment).
Effective April 1, 2024, the Fund’s Advisory Fee was reduced from 0.70% to 0.65% and the Supervision and Administration Fee for Class C was increased from 0.20% to 0.25%. As a result of these changes, there has been no change to the Fund’s total Management Fee.
Changes to Fund’s Principal Risks:
In the Fund’s Principal Risks, Sector Focus Risk and Industrial Sector Risk were added.
This report describes changes to the Fund that occurred during the reporting period.
WHAT WERE THE FUND COSTS FOR THE PAST YEAR? (based on a hypothetical $10,000 investment)
|
Class Name
|
Costs of a $10,000 investment
|
Costs paid as a percentage of a $10,000 investment
|
|
Class I
|
$89
|
0.90%
|
HOW DID THE FUND PERFORM LAST YEAR AND WHAT AFFECTED ITS PERFORMANCE?
|
•
|
For the 12-month period ended March 31, 2025, the Fund outperformed its performance benchmark, the Russell 2000 Index. The Fund invests at least 80% of its assets in equity securities of small-capitalization companies.
|
|
•
|
U.S. small cap equities generally advanced between April and November of last year, mainly driven by investor sentiment around the Federal Reserve and the potential for the easing cycle to resume, coupled with the post-election advance, peaking on November 25, 2024. Subsequently, volatility increased, and sentiment turned negative with markets selling off, as clarity around the Federal Reserve’s interest rate policy came into focus, with investors adjusting to a higher for longer interest rate environment. Additionally, uncertainty around the new administration’s policies and implementation methods and geopolitical tensions also weighed on markets.
|
|
•
|
The primary driver of the Fund’s relative outperformance during the fiscal year was strong security selection while sector allocation detracted. Security selection within the information technology and materials sectors were the largest contributors, while selections in consumer discretionary and consumer staples detracted.
|
|
•
|
On a relative basis, Huron Consulting Group, ACI Worldwide and an out-of-benchmark position in World Wrestling Entertainment contributed the most to performance.
|
|
•
|
In contrast, the biggest individual relative detractors to performance were out-of-benchmark positions in Acadia Healthcare and Carter’s, alongside Columbus Mckinnon.
|
|
•
|
Examining sector allocation, underweight exposures to consumer discretionary and healthcare (specifically pharmaceuticals and biotechnology) both added value, while an underweight exposure in financials and an overweight exposure in information technology detracted from relative performance.
|
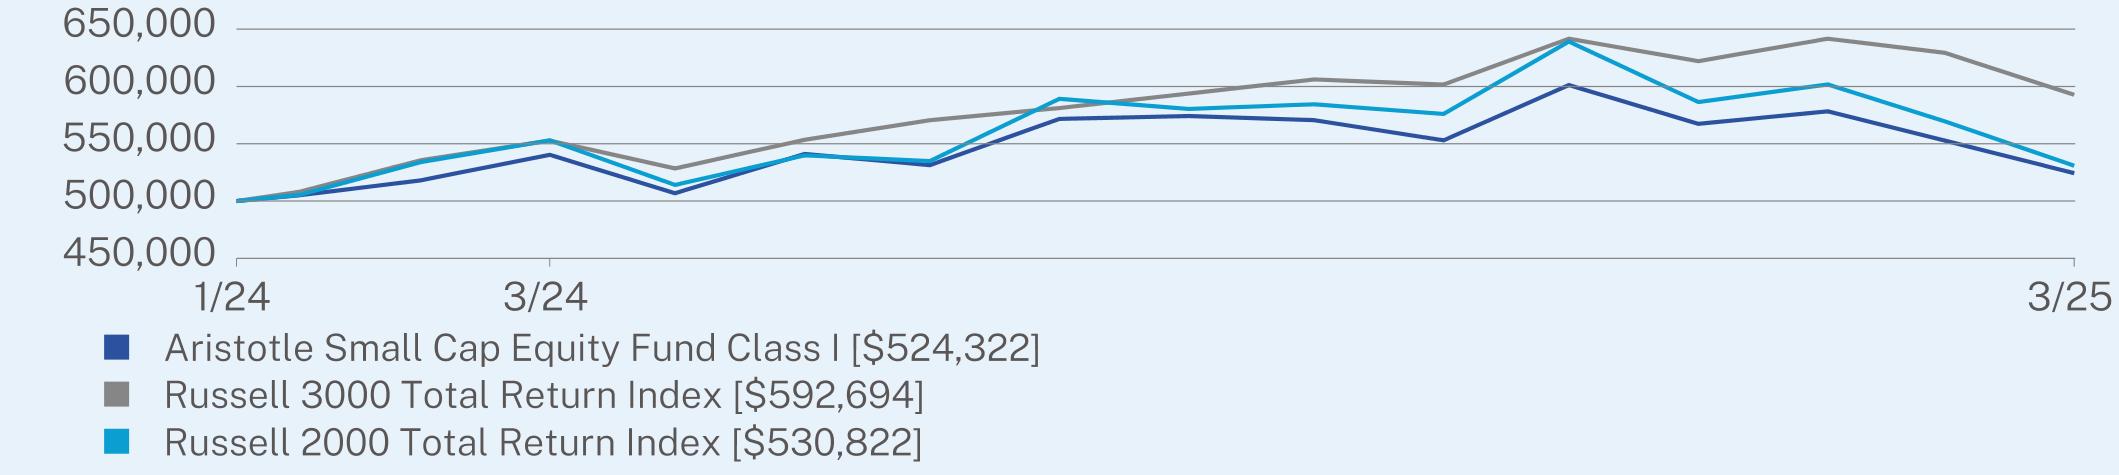
ANNUAL AVERAGE TOTAL RETURN (%)
|
|
1 Year
|
Since Inception
(01/16/2024) |
|
Class I (without sales charge)
|
-2.97
|
4.02
|
|
Russell 3000 Total Return Index
|
7.22
|
15.15
|
|
Russell 2000 Total Return Index
|
-4.01
|
5.09
|
Visit https://www.aristotlefunds.com/resources/prospectuses-reports for more recent performance information.
KEY FUND STATISTICS (as of March 31, 2025)
|
Net Assets
|
$149,826,774
|
|
Number of Holdings
|
98
|
|
Net Advisory Fee
|
$1,271,976
|
|
Portfolio Turnover Rate
|
15%
|
|
Top 10 Issuers
|
(%)
|
|
Huron Consulting Group, Inc.
|
2.9%
|
|
AerCap Holdings NV
|
2.6%
|
|
ACI Worldwide, Inc.
|
2.4%
|
|
Itron, Inc.
|
2.3%
|
|
Merit Medical Systems, Inc.
|
2.3%
|
|
HealthEquity, Inc.
|
2.0%
|
|
TKO Group Holdings, Inc.
|
2.0%
|
|
MACOM Technology Solutions Holdings, Inc.
|
1.9%
|
|
Chemed Corp.
|
1.9%
|
|
Dycom Industries, Inc.
|
1.9%
|

Changes to the Fund’s Principal Investment Strategy:
The Fund’s Principal Investment Strategies were revised to reflect that the Fund defines a small cap company as one that, at the time of initial purchase, has a market capitalization that falls within the capitalization range of the Russell 2000® Index.
Changes to Shareholder Fees (fees paid directly from your investment).
Effective April 1, 2024, the Fund’s Advisory Fee was reduced from 0.70% to 0.65% and the Supervision and Administration Fee for Class I was increased from 0.20% to 0.25%. As a result of these changes, there has been no change to the Fund’s total Management Fee.
Changes to Fund’s Principal Risks:
In the Fund’s Principal Risks, Sector Focus Risk and Industrial Sector Risk were added.
This report describes changes to the Fund that occurred during the reporting period.
WHAT WERE THE FUND COSTS FOR THE PAST YEAR? (based on a hypothetical $10,000 investment)
|
Class Name
|
Costs of a $10,000 investment
|
Costs paid as a percentage of a $10,000 investment
|
|
Class I-2
|
$89
|
0.90%
|
HOW DID THE FUND PERFORM LAST YEAR AND WHAT AFFECTED ITS PERFORMANCE?
|
•
|
For the 12-month period ended March 31, 2025, the Fund outperformed its performance benchmark, the Russell 2000 Index. The Fund invests at least 80% of its assets in equity securities of small-capitalization companies.
|
|
•
|
U.S. small cap equities generally advanced between April and November of last year, mainly driven by investor sentiment around the Federal Reserve and the potential for the easing cycle to resume, coupled with the post-election advance, peaking on November 25, 2024. Subsequently, volatility increased, and sentiment turned negative with markets selling off, as clarity around the Federal Reserve’s interest rate policy came into focus, with investors adjusting to a higher for longer interest rate environment. Additionally, uncertainty around the new administration’s policies and implementation methods and geopolitical tensions also weighed on markets.
|
|
•
|
The primary driver of the Fund’s relative outperformance during the fiscal year was strong security selection while sector allocation detracted. Security selection within the information technology and materials sectors were the largest contributors, while selections in consumer discretionary and consumer staples detracted.
|
|
•
|
On a relative basis, Huron Consulting Group, ACI Worldwide and an out-of-benchmark position in World Wrestling Entertainment contributed the most to performance.
|
|
•
|
In contrast, the biggest individual relative detractors to performance were out-of-benchmark positions in Acadia Healthcare and Carter’s, alongside Columbus Mckinnon.
|
|
•
|
Examining sector allocation, underweight exposures to consumer discretionary and healthcare (specifically pharmaceuticals and biotechnology) both added value, while an underweight exposure in financials and an overweight exposure in information technology detracted from relative performance.
|
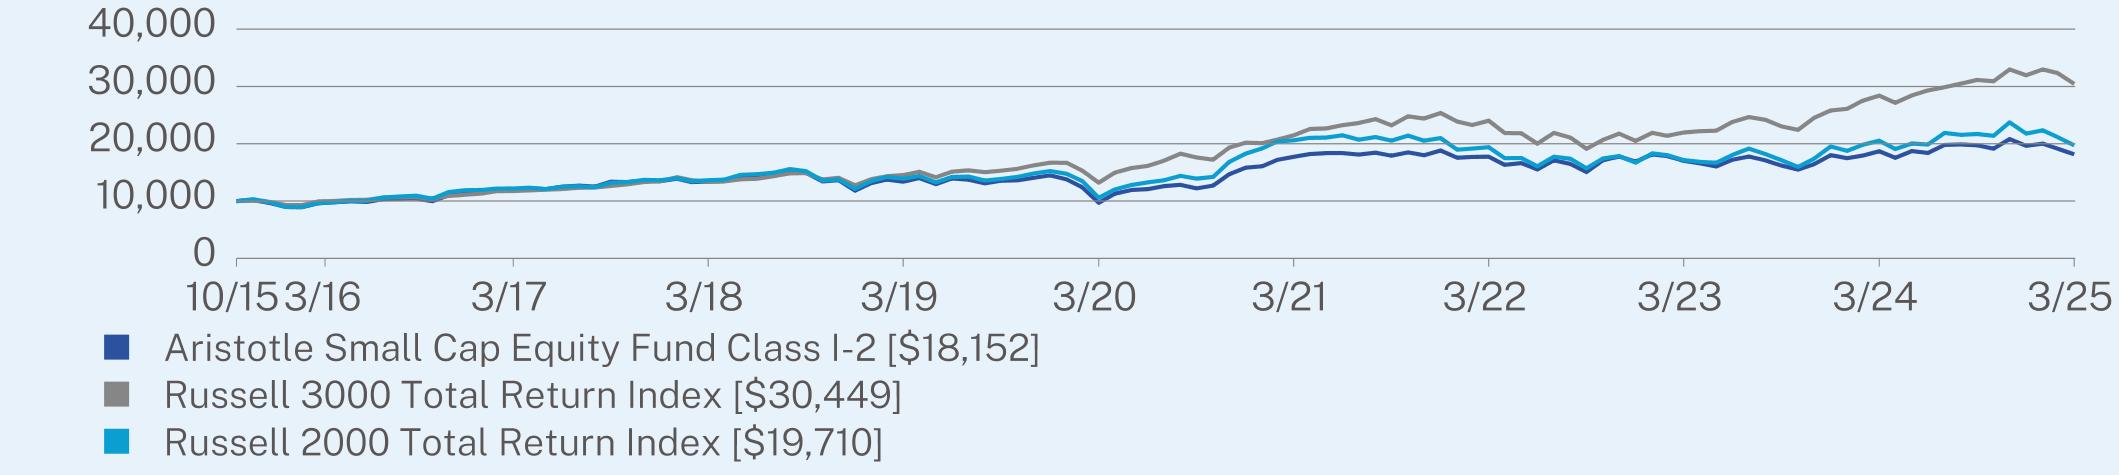
ANNUAL AVERAGE TOTAL RETURN (%)
|
|
1 Year
|
5 Year
|
Since Inception
(10/30/2015) |
|
Class I-2 (without sales charge)
|
-2.89
|
13.36
|
6.53
|
|
Russell 3000 Total Return Index
|
7.22
|
18.18
|
12.55
|
|
Russell 2000 Total Return Index
|
-4.01
|
13.27
|
7.47
|
Visit https://www.aristotlefunds.com/resources/prospectuses-reports for more recent performance information.
KEY FUND STATISTICS (as of March 31, 2025)
|
Net Assets
|
$149,826,774
|
|
Number of Holdings
|
98
|
|
Net Advisory Fee
|
$1,271,976
|
|
Portfolio Turnover Rate
|
15%
|
|
Top 10 Issuers
|
(%)
|
|
Huron Consulting Group, Inc.
|
2.9%
|
|
AerCap Holdings NV
|
2.6%
|
|
ACI Worldwide, Inc.
|
2.4%
|
|
Itron, Inc.
|
2.3%
|
|
Merit Medical Systems, Inc.
|
2.3%
|
|
HealthEquity, Inc.
|
2.0%
|
|
TKO Group Holdings, Inc.
|
2.0%
|
|
MACOM Technology Solutions Holdings, Inc.
|
1.9%
|
|
Chemed Corp.
|
1.9%
|
|
Dycom Industries, Inc.
|
1.9%
|
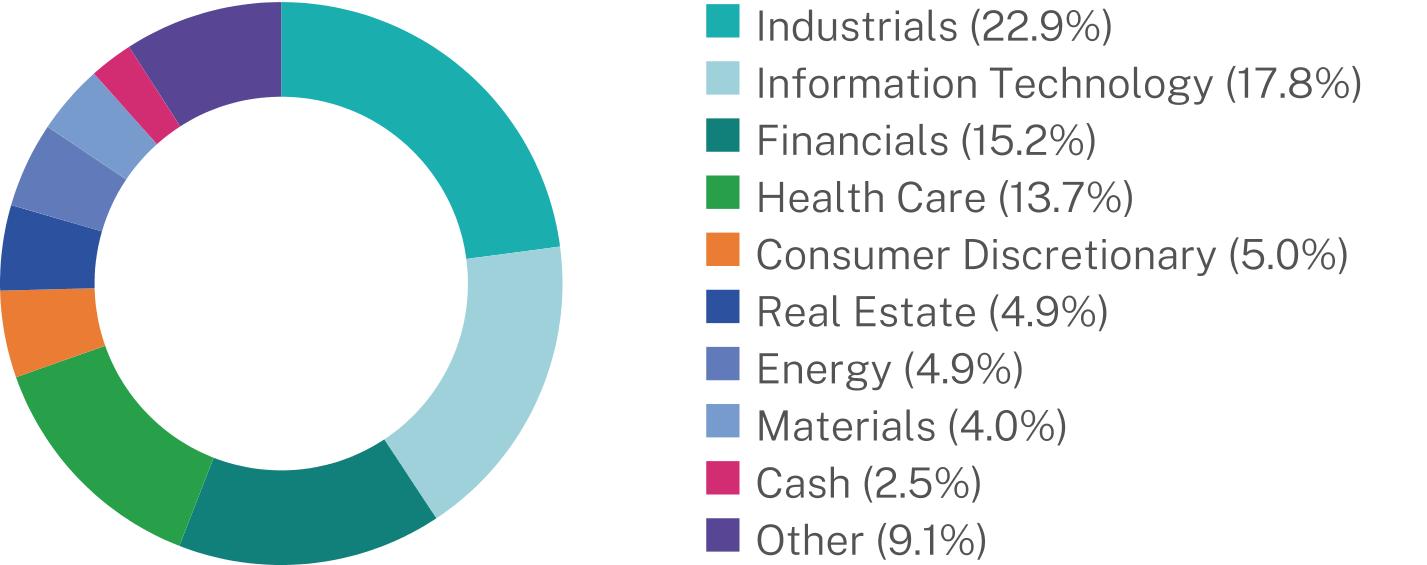
Changes to the Fund’s Principal Investment Strategy:
The Fund’s Principal Investment Strategies were revised to reflect that the Fund defines a small cap company as one that, at the time of initial purchase, has a market capitalization that falls within the capitalization range of the Russell 2000® Index.
Changes to Shareholder Fees (fees paid directly from your investment).
Effective April 1, 2024, the Fund’s Advisory Fee was reduced from 0.70% to 0.65% and the Supervision and Administration Fee for Class I-2 was increased from 0.20% to 0.25%. As a result of these changes, there has been no change to the Fund’s total Management Fee.
Changes to Fund’s Principal Risks:
In the Fund’s Principal Risks, Sector Focus Risk and Industrial Sector Risk were added.
This report describes changes to the Fund that occurred during the reporting period.
WHAT WERE THE FUND COSTS FOR THE PAST YEAR? (based on a hypothetical $10,000 investment)
|
Class Name
|
Costs of a $10,000 investment
|
Costs paid as a percentage of a $10,000 investment
|
|
Class R6
|
$84
|
0.85%
|
HOW DID THE FUND PERFORM LAST YEAR AND WHAT AFFECTED ITS PERFORMANCE?
|
•
|
For the 12-month period ended March 31, 2025, the Fund outperformed its performance benchmark, the Russell 2000 Index. The Fund invests at least 80% of its assets in equity securities of small-capitalization companies.
|
|
•
|
U.S. small cap equities generally advanced between April and November of last year, mainly driven by investor sentiment around the Federal Reserve and the potential for the easing cycle to resume, coupled with the post-election advance, peaking on November 25, 2024. Subsequently, volatility increased, and sentiment turned negative with markets selling off, as clarity around the Federal Reserve’s interest rate policy came into focus, with investors adjusting to a higher for longer interest rate environment. Additionally, uncertainty around the new administration’s policies and implementation methods and geopolitical tensions also weighed on markets.
|
|
•
|
The primary driver of the Fund’s relative outperformance during the fiscal year was strong security selection while sector allocation detracted. Security selection within the information technology and materials sectors were the largest contributors, while selections in consumer discretionary and consumer staples detracted.
|
|
•
|
On a relative basis, Huron Consulting Group, ACI Worldwide and an out-of-benchmark position in World Wrestling Entertainment contributed the most to performance.
|
|
•
|
In contrast, the biggest individual relative detractors to performance were out-of-benchmark positions in Acadia Healthcare and Carter’s, alongside Columbus Mckinnon.
|
|
•
|
Examining sector allocation, underweight exposures to consumer discretionary and healthcare (specifically pharmaceuticals and biotechnology) both added value, while an underweight exposure in financials and an overweight exposure in information technology detracted from relative performance.
|
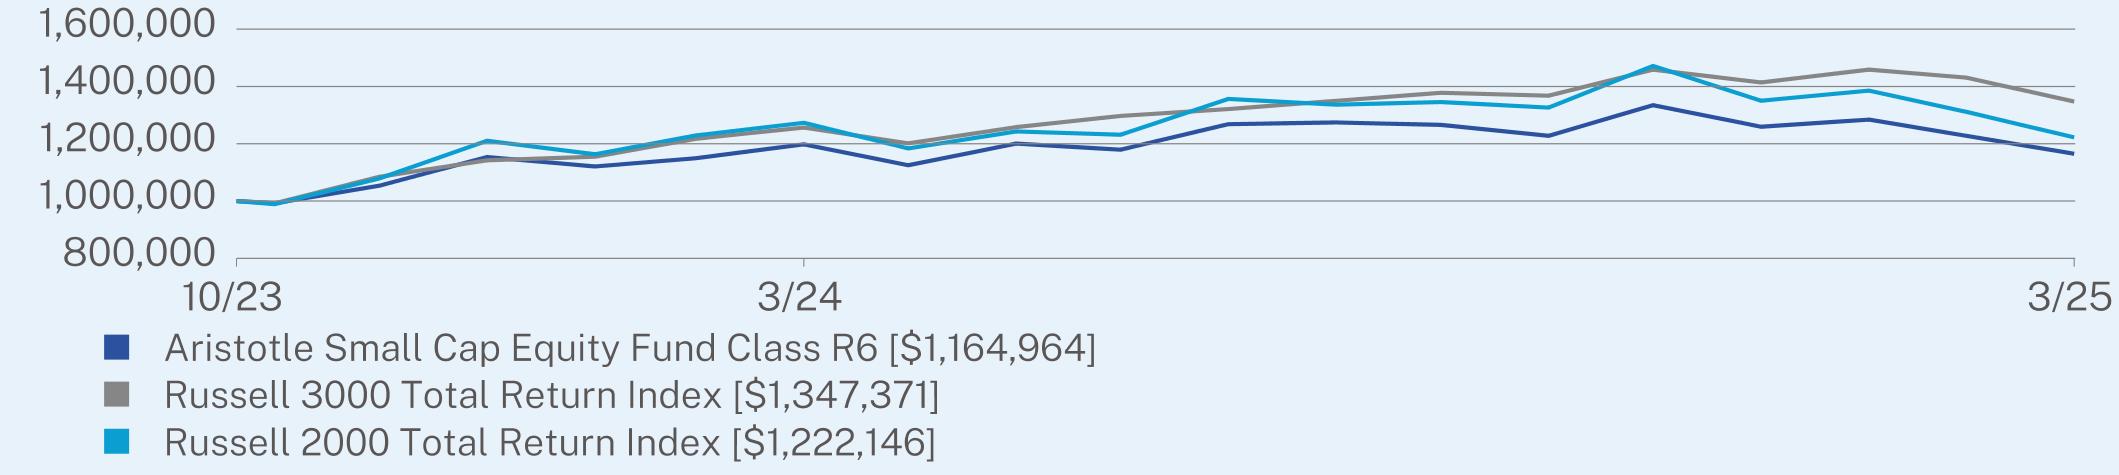
ANNUAL AVERAGE TOTAL RETURN (%)
|
|
1 Year
|
Since Inception
(10/20/2023) |
|
Class R6 (without sales charge)
|
-2.75
|
11.13
|
|
Russell 3000 Total Return Index
|
7.22
|
22.89
|
|
Russell 2000 Total Return Index
|
-4.01
|
14.88
|
Visit https://www.aristotlefunds.com/resources/prospectuses-reports for more recent performance information.
KEY FUND STATISTICS (as of March 31, 2025)
|
Net Assets
|
$149,826,774
|
|
Number of Holdings
|
98
|
|
Net Advisory Fee
|
$1,271,976
|
|
Portfolio Turnover Rate
|
15%
|
|
Top 10 Issuers
|
(%)
|
|
Huron Consulting Group, Inc.
|
2.9%
|
|
AerCap Holdings NV
|
2.6%
|
|
ACI Worldwide, Inc.
|
2.4%
|
|
Itron, Inc.
|
2.3%
|
|
Merit Medical Systems, Inc.
|
2.3%
|
|
HealthEquity, Inc.
|
2.0%
|
|
TKO Group Holdings, Inc.
|
2.0%
|
|
MACOM Technology Solutions Holdings, Inc.
|
1.9%
|
|
Chemed Corp.
|
1.9%
|
|
Dycom Industries, Inc.
|
1.9%
|

Changes to the Fund’s Principal Investment Strategy:
The Fund’s Principal Investment Strategies were revised to reflect that the Fund defines a small cap company as one that, at the time of initial purchase, has a market capitalization that falls within the capitalization range of the Russell 2000® Index.
Changes to Shareholder Fees (fees paid directly from your investment).
Effective April 1, 2024, the Fund’s Advisory Fee was reduced from 0.70% to 0.65% and the Supervision and Administration Fee for Class R6 was increased from 0.15% to 0.20%. As a result of these changes, there has been no change to the Fund’s total Management Fee.
Changes to Fund’s Principal Risks:
In the Fund’s Principal Risks, Sector Focus Risk and Industrial Sector Risk were added.
This report describes changes to the Fund that occurred during the reporting period.
WHAT WERE THE FUND COSTS FOR THE PAST YEAR? (based on a hypothetical $10,000 investment)
|
Class Name
|
Costs of a $10,000 investment
|
Costs paid as a percentage of a $10,000 investment
|
|
Class A
|
$115
|
1.15%
|
HOW DID THE FUND PERFORM LAST YEAR AND WHAT AFFECTED ITS PERFORMANCE?
|
•
|
For the 12-month period ended March 31, 2025, the Fund outperformed its performance benchmark, the Russell 2500 Index. The Fund invests at least 80% of its assets in equity securities of small-capitalization and mid-capitalization companies.
|
|
•
|
U.S. small cap and mid cap equities generally advanced between April and November of last year, mainly driven by investor sentiment around the Federal Reserve and the potential for the easing cycle to resume, coupled with the post-election advance, peaking on November 25, 2024. Subsequently, volatility increased, and sentiment turned negative with markets selling off, as clarity around the Federal Reserve’s interest rate policy came into focus, with investors adjusting to a higher for longer interest rate environment. Additionally, uncertainty around the new administration’s policies and implementation methods and geopolitical tensions also weighed on markets.
|
|
•
|
The primary driver of the Fund’s relative outperformance during the fiscal year was strong security selection while sector allocation detracted. Security selection within the information technology and materials sectors were the largest contributors, while selections in consumer discretionary and consumer staples detracted.
|
|
•
|
On a relative basis, an out-of-benchmark position in Alamos Gold, Huron Consulting Group and Baldwin Insurance Group contributed the most to performance.
|
|
•
|
In contrast, the biggest individual relative detractors to performance were Acadia Healthcare, Tronox Holdings and ASGN Incorporated.
|
|
•
|
Examining sector allocation, an underweight exposure to consumer discretionary and a slight overweight to energy added value, while an overweight exposure to information technology and an underweight exposure to financials detracted from relative performance.
|
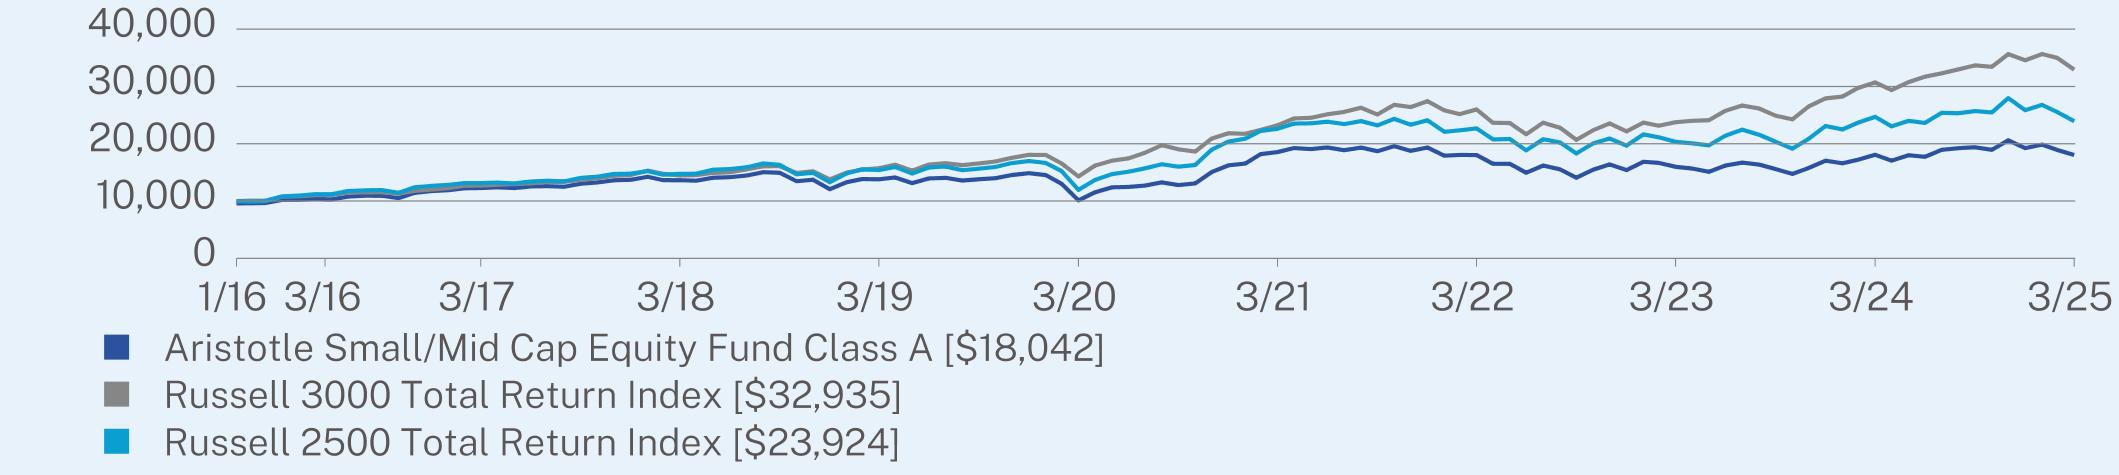
ANNUAL AVERAGE TOTAL RETURN (%)
|
|
1 Year
|
5 Year
|
Since Inception
(01/08/2016) |
|
Class A (without sales charge)
|
-0.18
|
12.28
|
7.10
|
|
Class A (with sales charge)
|
-4.40
|
11.32
|
6.60
|
|
Russell 3000 Total Return Index
|
7.22
|
18.18
|
13.79
|
|
Russell 2500 Total Return Index
|
-3.11
|
14.91
|
9.91
|
Visit https://www.aristotlefunds.com/resources/prospectuses-reports for more recent performance information.
KEY FUND STATISTICS (as of March 31, 2025)
|
Net Assets
|
$34,521,593
|
|
Number of Holdings
|
101
|
|
Net Advisory Fee
|
$277,333
|
|
Portfolio Turnover Rate
|
17%
|
|
Top 10 Issuers
|
(%)
|
|
Alamos Gold, Inc.
|
2.6%
|
|
Huron Consulting Group, Inc.
|
2.5%
|
|
AerCap Holdings NV
|
2.4%
|
|
ACI Worldwide, Inc.
|
2.2%
|
|
Merit Medical Systems, Inc.
|
2.2%
|
|
MACOM Technology Solutions Holdings, Inc.
|
2.1%
|
|
Itron, Inc.
|
2.0%
|
|
Belden, Inc.
|
1.9%
|
|
Dycom Industries, Inc.
|
1.9%
|
|
Chemed Corp.
|
1.9%
|

Changes to the Fund’s Principal Investment Strategy:
The Fund’s Principal Investment Strategies were revised to reflect that the Fund defines a small cap and mid cap company as one that, at the time of initial purchase, has a market capitalization that falls within the capitalization range of the Russell 2500® Index.
Changes to Shareholder Fees (fees paid directly from your investment).
Effective April 1, 2024, the Fund’s Advisory Fee was reduced from 0.70% to 0.65% and the Supervision and Administration Fee for Class A was increased from 0.20% to 0.25%. As a result of these changes, there has been no change to the Fund’s total Management Fee.
Changes to Fund’s Principal Risks:
In the Fund’s Principal Risks, Sector Focus Risk and Industrial Sector Risk were added.
This report describes changes to the Fund that occurred during the reporting period.
WHAT WERE THE FUND COSTS FOR THE PAST YEAR? (based on a hypothetical $10,000 investment)
|
Class Name
|
Costs of a $10,000 investment
|
Costs paid as a percentage of a $10,000 investment
|
|
Class C
|
$189
|
1.90%
|
HOW DID THE FUND PERFORM LAST YEAR AND WHAT AFFECTED ITS PERFORMANCE?
|
•
|
For the 12-month period ended March 31, 2025, the Fund outperformed its performance benchmark, the Russell 2500 Index. The Fund invests at least 80% of its assets in equity securities of small-capitalization and mid-capitalization companies.
|
|
•
|
U.S. small cap and mid cap equities generally advanced between April and November of last year, mainly driven by investor sentiment around the Federal Reserve and the potential for the easing cycle to resume, coupled with the post-election advance, peaking on November 25, 2024. Subsequently, volatility increased, and sentiment turned negative with markets selling off, as clarity around the Federal Reserve’s interest rate policy came into focus, with investors adjusting to a higher for longer interest rate environment. Additionally, uncertainty around the new administration’s policies and implementation methods and geopolitical tensions also weighed on markets.
|
|
•
|
The primary driver of the Fund’s relative outperformance during the fiscal year was strong security selection while sector allocation detracted. Security selection within the information technology and materials sectors were the largest contributors, while selections in consumer discretionary and consumer staples detracted.
|
|
•
|
On a relative basis, an out-of-benchmark position in Alamos Gold, Huron Consulting Group and Baldwin Insurance Group contributed the most to performance.
|
|
•
|
In contrast, the biggest individual relative detractors to performance were Acadia Healthcare, Tronox Holdings and ASGN Incorporated.
|
|
•
|
Examining sector allocation, an underweight exposure to consumer discretionary and a slight overweight to energy added value, while an overweight exposure to information technology and an underweight exposure to financials detracted from relative performance.
|
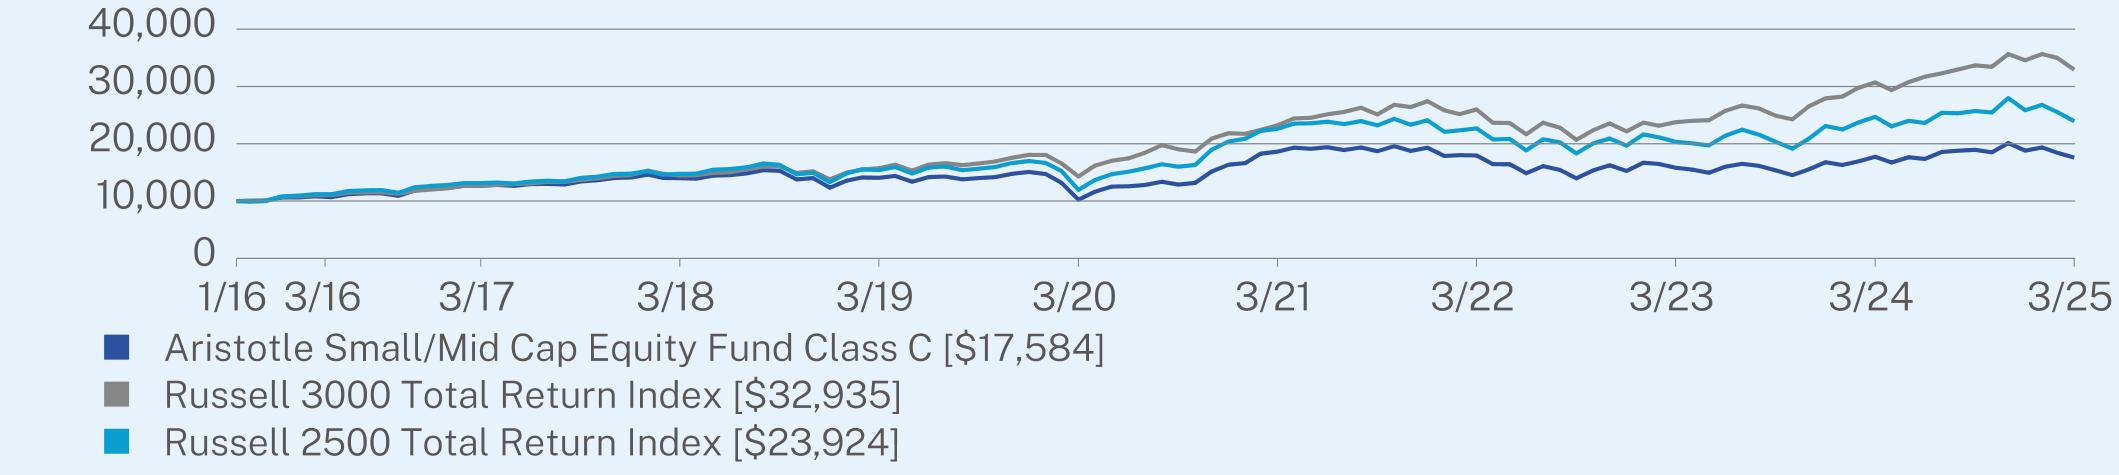
ANNUAL AVERAGE TOTAL RETURN (%)
|
|
1 Year
|
5 Year
|
Since Inception
(01/08/2016) |
|
Class C (without sales charge)
|
-0.82
|
11.45
|
6.31
|
|
Class C (with sales charge)
|
-1.73
|
11.45
|
6.31
|
|
Russell 3000 Total Return Index
|
7.22
|
18.18
|
13.79
|
|
Russell 2500 Total Return Index
|
-3.11
|
14.91
|
9.91
|
Visit https://www.aristotlefunds.com/resources/prospectuses-reports for more recent performance information.
KEY FUND STATISTICS (as of March 31, 2025)
|
Net Assets
|
$34,521,593
|
|
Number of Holdings
|
101
|
|
Net Advisory Fee
|
$277,333
|
|
Portfolio Turnover Rate
|
17%
|
|
Top 10 Issuers
|
(%)
|
|
Alamos Gold, Inc.
|
2.6%
|
|
Huron Consulting Group, Inc.
|
2.5%
|
|
AerCap Holdings NV
|
2.4%
|
|
ACI Worldwide, Inc.
|
2.2%
|
|
Merit Medical Systems, Inc.
|
2.2%
|
|
MACOM Technology Solutions Holdings, Inc.
|
2.1%
|
|
Itron, Inc.
|
2.0%
|
|
Belden, Inc.
|
1.9%
|
|
Dycom Industries, Inc.
|
1.9%
|
|
Chemed Corp.
|
1.9%
|

Changes to the Fund’s Principal Investment Strategy:
Effective April 1, 2024, the Fund’s Advisory Fee was reduced from 0.70% to 0.65% and the Supervision and Administration Fee for Class C was increased from 0.20% to 0.25%. As a result of these changes, there has been no change to the Fund’s total Management Fee.
Changes to Shareholder Fees (fees paid directly from your investment).
The Fund’s Principal Investment Strategies were revised to reflect that the Fund defines a small cap and mid cap company as one that, at the time of initial purchase, has a market capitalization that falls within the capitalization range of the Russell 2500® Index.
Changes to Fund’s Principal Risks:
In the Fund’s Principal Risks, Sector Focus Risk and Industrial Sector Risk were added.
This report describes changes to the Fund that occurred during the reporting period.
WHAT WERE THE FUND COSTS FOR THE PAST YEAR? (based on a hypothetical $10,000 investment)
|
Class Name
|
Costs of a $10,000 investment
|
Costs paid as a percentage of a $10,000 investment
|
|
Class I
|
$85
|
0.85%
|
HOW DID THE FUND PERFORM LAST YEAR AND WHAT AFFECTED ITS PERFORMANCE?
|
•
|
For the 12-month period ended March 31, 2025, the Fund outperformed its performance benchmark, the Russell 2500 Index. The Fund invests at least 80% of its assets in equity securities of small-capitalization and mid-capitalization companies.
|
|
•
|
U.S. small cap and mid cap equities generally advanced between April and November of last year, mainly driven by investor sentiment around the Federal Reserve and the potential for the easing cycle to resume, coupled with the post-election advance, peaking on November 25, 2024. Subsequently, volatility increased, and sentiment turned negative with markets selling off, as clarity around the Federal Reserve’s interest rate policy came into focus, with investors adjusting to a higher for longer interest rate environment. Additionally, uncertainty around the new administration’s policies and implementation methods and geopolitical tensions also weighed on markets.
|
|
•
|
The primary driver of the Fund’s relative outperformance during the fiscal year was strong security selection while sector allocation detracted. Security selection within the information technology and materials sectors were the largest contributors, while selections in consumer discretionary and consumer staples detracted.
|
|
•
|
On a relative basis, an out-of-benchmark position in Alamos Gold, Huron Consulting Group and Baldwin Insurance Group contributed the most to performance.
|
|
•
|
In contrast, the biggest individual relative detractors to performance were Acadia Healthcare, Tronox Holdings and ASGN Incorporated.
|
|
•
|
Examining sector allocation, an underweight exposure to consumer discretionary and a slight overweight to energy added value, while an overweight exposure to information technology and an underweight exposure to financials detracted from relative performance.
|
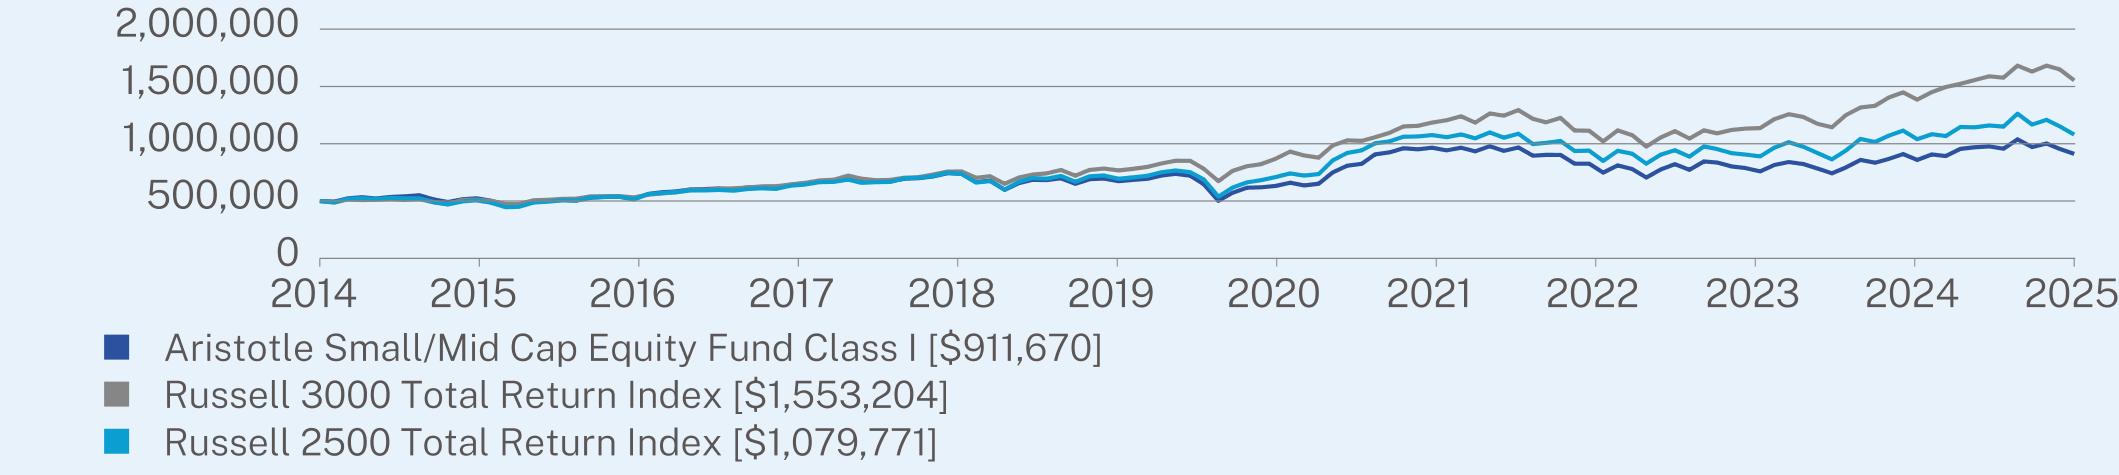
ANNUAL AVERAGE TOTAL RETURN (%)
|
|
1 Year
|
5 Year
|
10 Year
|
|
Class I (without sales charge)
|
0.16
|
12.68
|
5.51
|
|
Russell 3000 Total Return Index
|
7.22
|
18.18
|
11.80
|
|
Russell 2500 Total Return Index
|
-3.11
|
14.91
|
7.46
|
Visit https://www.aristotlefunds.com/resources/prospectuses-reports for more recent performance information.
KEY FUND STATISTICS (as of March 31, 2025)
|
Net Assets
|
$34,521,593
|
|
Number of Holdings
|
101
|
|
Net Advisory Fee
|
$277,333
|
|
Portfolio Turnover Rate
|
17%
|
|
Top 10 Issuers
|
(%)
|
|
Alamos Gold, Inc.
|
2.6%
|
|
Huron Consulting Group, Inc.
|
2.5%
|
|
AerCap Holdings NV
|
2.4%
|
|
ACI Worldwide, Inc.
|
2.2%
|
|
Merit Medical Systems, Inc.
|
2.2%
|
|
MACOM Technology Solutions Holdings, Inc.
|
2.1%
|
|
Itron, Inc.
|
2.0%
|
|
Belden, Inc.
|
1.9%
|
|
Dycom Industries, Inc.
|
1.9%
|
|
Chemed Corp.
|
1.9%
|
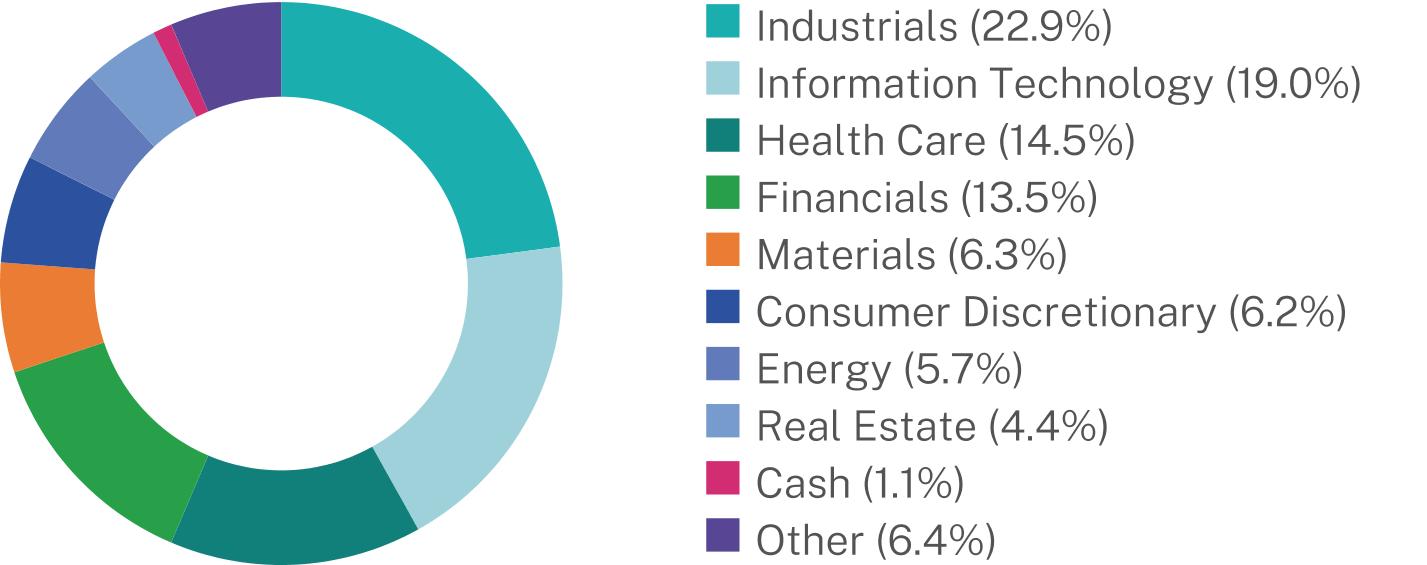
Changes to the Fund’s Principal Investment Strategy:
The Fund’s Principal Investment Strategies were revised to reflect that the Fund defines a small cap and mid cap company as one that, at the time of initial purchase, has a market capitalization that falls within the capitalization range of the Russell 2500® Index.
Changes to Shareholder Fees (fees paid directly from your investment).
Effective April 1, 2024, the Fund’s Advisory Fee was reduced from 0.70% to 0.65% and the Supervision and Administration Fee for Class I has been increased from 0.15% to 0.20%. As a result of these changes, there has been no change to the Fund’s total Management Fee.
Changes to Fund’s Principal Risks:
In the Fund’s Principal Risks, Sector Focus Risk and Industrial Sector Risk were added.
This report describes changes to the Fund that occurred during the reporting period.
WHAT WERE THE FUND COSTS FOR THE PAST YEAR? (based on a hypothetical $10,000 investment)
|
Class Name
|
Costs of a $10,000 investment
|
Costs paid as a percentage of a $10,000 investment
|
|
Class I-2
|
$90
|
0.90%
|
HOW DID THE FUND PERFORM LAST YEAR AND WHAT AFFECTED ITS PERFORMANCE?
|
•
|
For the 12-month period ended March 31, 2025, the Fund outperformed its performance benchmark, the Russell 2500 Index. The Fund invests at least 80% of its assets in equity securities of small-capitalization and mid-capitalization companies.
|
|
•
|
U.S. small cap and mid cap equities generally advanced between April and November of last year, mainly driven by investor sentiment around the Federal Reserve and the potential for the easing cycle to resume, coupled with the post-election advance, peaking on November 25, 2024. Subsequently, volatility increased, and sentiment turned negative with markets selling off, as clarity around the Federal Reserve’s interest rate policy came into focus, with investors adjusting to a higher for longer interest rate environment. Additionally, uncertainty around the new administration’s policies and implementation methods and geopolitical tensions also weighed on markets.
|
|
•
|
The primary driver of the Fund’s relative outperformance during the fiscal year was strong security selection while sector allocation detracted. Security selection within the information technology and materials sectors were the largest contributors, while selections in consumer discretionary and consumer staples detracted.
|
|
•
|
On a relative basis, an out-of-benchmark position in Alamos Gold, Huron Consulting Group and Baldwin Insurance Group contributed the most to performance.
|
|
•
|
In contrast, the biggest individual relative detractors to performance were Acadia Healthcare, Tronox Holdings and ASGN Incorporated.
|
|
•
|
Examining sector allocation, an underweight exposure to consumer discretionary and a slight overweight to energy added value, while an overweight exposure to information technology and an underweight exposure to financials detracted from relative performance.
|
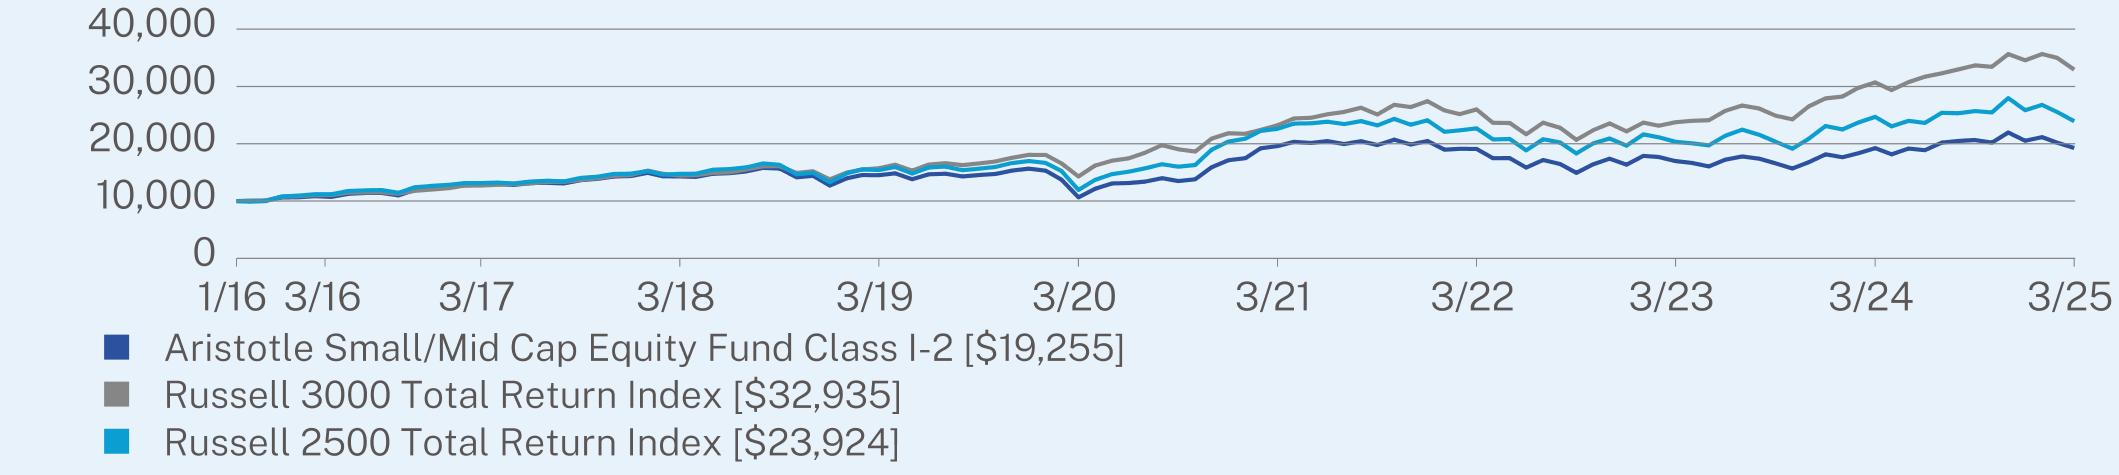
ANNUAL AVERAGE TOTAL RETURN (%)
|
|
1 Year
|
5 Year
|
Since Inception
(01/08/2016) |
|
Class I-2 (without sales charge)
|
0.07
|
12.58
|
7.36
|
|
Russell 3000 Total Return Index
|
7.22
|
18.18
|
13.79
|
|
Russell 2500 Total Return Index
|
-3.11
|
14.91
|
9.91
|
Visit https://www.aristotlefunds.com/resources/prospectuses-reports for more recent performance information.
KEY FUND STATISTICS (as of March 31, 2025)
|
Net Assets
|
$34,521,593
|
|
Number of Holdings
|
101
|
|
Net Advisory Fee
|
$277,333
|
|
Portfolio Turnover Rate
|
17%
|
|
Top 10 Issuers
|
(%)
|
|
Alamos Gold, Inc.
|
2.6%
|
|
Huron Consulting Group, Inc.
|
2.5%
|
|
AerCap Holdings NV
|
2.4%
|
|
ACI Worldwide, Inc.
|
2.2%
|
|
Merit Medical Systems, Inc.
|
2.2%
|
|
MACOM Technology Solutions Holdings, Inc.
|
2.1%
|
|
Itron, Inc.
|
2.0%
|
|
Belden, Inc.
|
1.9%
|
|
Dycom Industries, Inc.
|
1.9%
|
|
Chemed Corp.
|
1.9%
|

Changes to the Fund’s Principal Investment Strategy:
The Fund’s Principal Investment Strategies were revised to reflect that the Fund defines a small cap and mid cap company as one that, at the time of initial purchase, has a market capitalization that falls within the capitalization range of the Russell 2500® Index.
Changes to Shareholder Fees (fees paid directly from your investment).
Effective April 1, 2024, the Fund’s Advisory Fee was reduced from 0.70% to 0.65% and the Supervision and Administration Fee for Class I-2 was increased from 0.20% to 0.25%. As a result of these changes, there has been no change to the Fund’s total Management Fee.
Changes to Fund’s Principal Risks:
In the Fund’s Principal Risks, Sector Focus Risk and Industrial Sector Risk were added.
This report describes changes to the Fund that occurred during the reporting period.
WHAT WERE THE FUND COSTS FOR THE PAST YEAR? (based on a hypothetical $10,000 investment)
|
Class Name
|
Costs of a $10,000 investment
|
Costs paid as a percentage of a $10,000 investment
|
|
Class A
|
$102
|
1.03%
|
HOW DID THE FUND PERFORM LAST YEAR AND WHAT AFFECTED ITS PERFORMANCE?
|
•
|
For the 12-month period ended March 31, 2025, the Fund underperformed its primary and secondary performance benchmarks, the MSCI ACWI Index (net) and the MSCI World Index (net), respectively. The Fund invests at least 80% of its assets in equity securities that are listed on an exchange or that are otherwise publicly traded in the United States or in a foreign country.
|
|
•
|
The performance explanation is provided relative to the primary benchmark, the MSCI ACWI Index (net). The underperformance of the Fund relative to the MSCI ACWI Index (net) over the 1-year period came primarily from security selection, although sector allocation also detracted value.
|
|
•
|
Security selection in the information technology and consumer discretionary sectors detracted the most. On the other hand, security selection in the healthcare and financials sectors added the most. Exposure to Lennar, Microchip Technology and Samsung Electronics negatively contributed to relative returns. Meanwhile, MonotaRO, DBS Group and Sony were the top contributors to relative performance for the year.
|
|
•
|
Key holdings in the technology sector (notably, Microchip Technology and Adobe, mentioned above) significantly lagged related peers that were more aligned with the first wave of artificial intelligence (AI) spending in the economy. These “first wave” AI companies include large weights in the Index such as Apple, NVIDIA, Amazon, Meta, Broadcom and Tesla—all of which were not owned by the Fund over the period and detracted from excess returns. The goods and services provided by Microchip and Adobe (i.e., microcontrollers and software providers) have the potential to be beneficiaries of AI spending in the years to come.
|
|
•
|
From a sector allocation standpoint, an overweight position in the materials sector and an underweight position in the communication services sectors detracted from relative performance. An underweight exposure to the information technology sector and an overweight position to the financials sector added value.
|
|
•
|
Regionally, security selection in North America negatively contributed to relative return, while security selection in Japan added to relative return. A significant overweight allocation to Japen proved to be detrimental to performance but was partially offset by the Fund’s underweight exposure to North America.
|

ANNUAL AVERAGE TOTAL RETURN (%)
|
|
1 Year
|
Since Inception
(01/16/2024) |
|
Class A (without sales charge)
|
-1.74
|
4.47
|
|
Class A (with sales charge)
|
-5.91
|
0.80
|
|
MSCI ACWI Net Total Return Index (USD)
|
7.15
|
14.06
|
|
MSCI THE WORLD INDEX Net (USD)
|
7.04
|
14.20
|
Visit https://www.aristotlefunds.com/resources/prospectuses-reports for more recent performance information.
KEY FUND STATISTICS (as of March 31, 2025)
|
Net Assets
|
$31,070,164
|
|
Number of Holdings
|
48
|
|
Net Advisory Fee
|
$250,608
|
|
Portfolio Turnover Rate
|
9%
|
|
Top 10 Issuers
|
(%)
|
|
Microsoft Corp.
|
4.5%
|
|
Muenchener Rueckversicherungs-Gesellschaft AG in Muenchen
|
3.9%
|
|
Lennar Corp.
|
3.6%
|
|
MonotaRO Co. Ltd.
|
3.3%
|
|
Sony Group Corp.
|
3.2%
|
|
DBS Group Holdings Ltd.
|
3.1%
|
|
Martin Marietta Materials, Inc.
|
3.1%
|
|
Cameco Corp.
|
2.8%
|
|
Amgen, Inc.
|
2.7%
|
|
TotalEnergies SE
|
2.7%
|

|
Top Ten Countries
|
(%)
|
|
United States
|
40.0%
|
|
Japan
|
18.6%
|
|
Germany
|
9.3%
|
|
Canada
|
5.1%
|
|
France
|
4.2%
|
|
Switzerland
|
3.7%
|
|
Ireland
|
3.1%
|
|
United Kingdom
|
3.1%
|
|
Singapore
|
3.1%
|
|
Cash & Other
|
9.8%
|
Changes to Fund’s Investment Objective or Goals:
The Fund changed its Investment Goal to seek to maximize long-term capital appreciation, removing the reference to also seeking income.
Changes to Shareholder Fees (fees paid directly from your investment).
Effective April 1, 2024, the Fund’s Advisory Fee was reduced from 0.70% to 0.60% and the Supervision and Administration Fee for Class A has been increased from 0.08% to 0.18%. As a result of these changes, there has been no change to the Fund’s total Management Fee.
Changes to Fund’s Principal Risks:
In the Fund’s Principal Risks, Information Technology Sector Risk was added.
This report describes changes to the Fund that occurred during the reporting period.
WHAT WERE THE FUND COSTS FOR THE PAST YEAR? (based on a hypothetical $10,000 investment)
|
Class Name
|
Costs of a $10,000 investment
|
Costs paid as a percentage of a $10,000 investment
|
|
Class I
|
$77
|
0.78%
|
HOW DID THE FUND PERFORM LAST YEAR AND WHAT AFFECTED ITS PERFORMANCE?
|
•
|
For the 12-month period ended March 31, 2025, the Fund underperformed its primary and secondary performance benchmarks, the MSCI ACWI Index (net) and the MSCI World Index (net), respectively. The Fund invests at least 80% of its assets in equity securities that are listed on an exchange or that are otherwise publicly traded in the United States or in a foreign country.
|
|
•
|
The performance explanation is provided relative to the primary benchmark, the MSCI ACWI Index (net). The underperformance of the Fund relative to the MSCI ACWI Index (net) over the 1-year period came primarily from security selection, although sector allocation also detracted value.
|
|
•
|
Security selection in the information technology and consumer discretionary sectors detracted the most. On the other hand, security selection in the healthcare and financials sectors added the most. Exposure to Lennar, Microchip Technology and Samsung Electronics negatively contributed to relative returns. Meanwhile, MonotaRO, DBS Group and Sony were the top contributors to relative performance for the year.
|
|
•
|
Key holdings in the technology sector (notably, Microchip Technology and Adobe, mentioned above) significantly lagged related peers that were more aligned with the first wave of artificial intelligence (AI) spending in the economy. These “first wave” AI companies include large weights in the Index such as Apple, NVIDIA, Amazon, Meta, Broadcom and Tesla—all of which were not owned by the Fund over the period and detracted from excess returns. The goods and services provided by Microchip and Adobe (i.e., microcontrollers and software providers) have the potential to be beneficiaries of AI spending in the years to come.
|
|
•
|
From a sector allocation standpoint, an overweight position in the materials sector and an underweight position in the communication services sectors detracted from relative performance. An underweight exposure to the information technology sector and an overweight position to the financials sector added value.
|
|
•
|
Regionally, security selection in North America negatively contributed to relative return, while security selection in Japan added to relative return. A significant overweight allocation to Japen proved to be detrimental to performance but was partially offset by the Fund’s underweight exposure to North America.
|
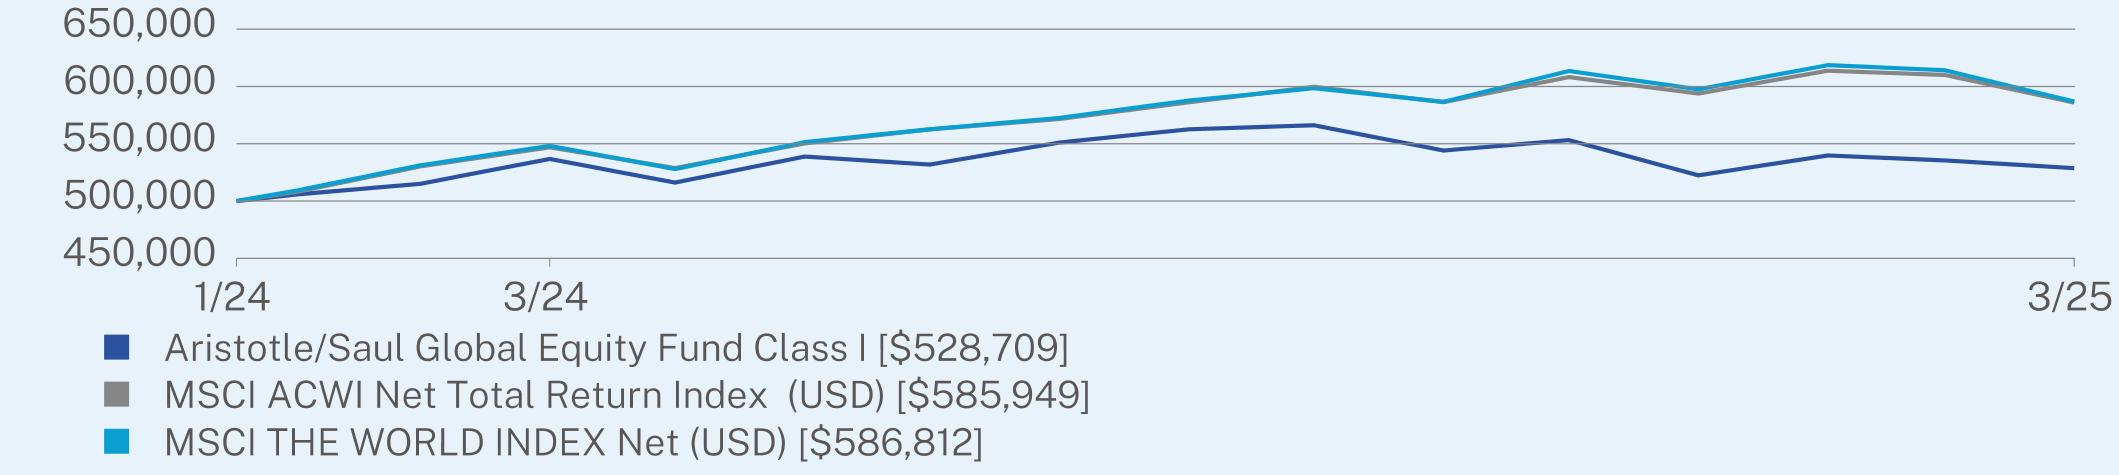
ANNUAL AVERAGE TOTAL RETURN (%)
|
|
1 Year
|
Since Inception
(01/16/2024) |
|
Class I (without sales charge)
|
-1.50
|
4.74
|
|
MSCI ACWI Net Total Return Index (USD)
|
7.15
|
14.06
|
|
MSCI THE WORLD INDEX Net (USD)
|
7.04
|
14.20
|
Visit https://www.aristotlefunds.com/resources/prospectuses-reports for more recent performance information.
KEY FUND STATISTICS (as of March 31, 2025)
|
Net Assets
|
$31,070,164
|
|
Number of Holdings
|
48
|
|
Net Advisory Fee
|
$250,608
|
|
Portfolio Turnover Rate
|
9%
|
|
Top 10 Issuers
|
(%)
|
|
Microsoft Corp.
|
4.5%
|
|
Muenchener Rueckversicherungs-Gesellschaft AG in Muenchen
|
3.9%
|
|
Lennar Corp.
|
3.6%
|
|
MonotaRO Co. Ltd.
|
3.3%
|
|
Sony Group Corp.
|
3.2%
|
|
DBS Group Holdings Ltd.
|
3.1%
|
|
Martin Marietta Materials, Inc.
|
3.1%
|
|
Cameco Corp.
|
2.8%
|
|
Amgen, Inc.
|
2.7%
|
|
TotalEnergies SE
|
2.7%
|
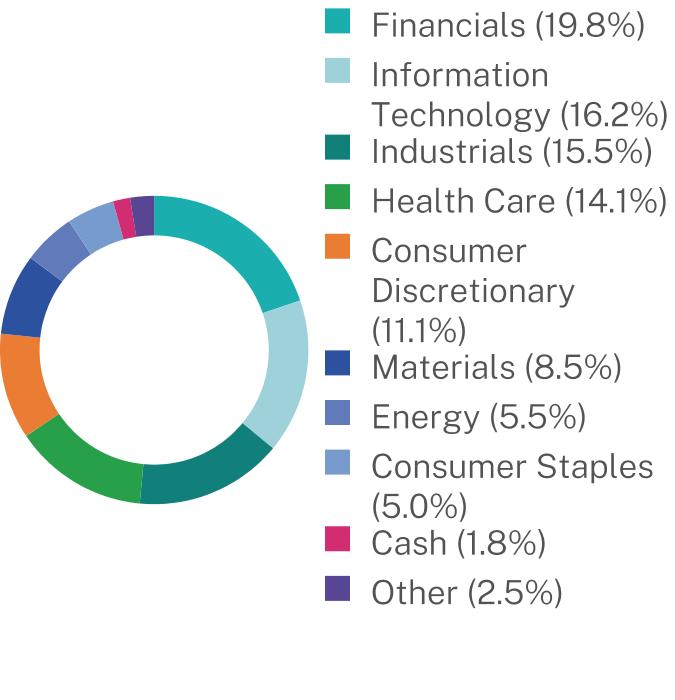
|
Top Ten Countries
|
(%)
|
|
United States
|
40.0%
|
|
Japan
|
18.6%
|
|
Germany
|
9.3%
|
|
Canada
|
5.1%
|
|
France
|
4.2%
|
|
Switzerland
|
3.7%
|
|
Ireland
|
3.1%
|
|
United Kingdom
|
3.1%
|
|
Singapore
|
3.1%
|
|
Cash & Other
|
9.8%
|
Changes to Fund’s Investment Objective or Goals:
The Fund changed its Investment Goal to seek to maximize long-term capital appreciation, removing the reference to also seeking income.
Changes to Shareholder Fees (fees paid directly from your investment).
Effective April 1, 2024, a Management Fee waiver was implemented to limit Total Annual Fund Operating Expenses to 0.78%. Effective April 1, 2024, the Fund’s Advisory Fee was reduced from 0.70% to 0.60% and the Supervision and Administration Fee for Class I has been increased from 0.08% to 0.18%. As a result of these changes, there has been no change to the Fund’s total Management Fee.
Changes to Fund’s Principal Risks:
In the Fund’s Principal Risks, Information Technology Sector Risk was added.
This report describes changes to the Fund that occurred during the reporting period.
WHAT WERE THE FUND COSTS FOR THE PAST YEAR? (based on a hypothetical $10,000 investment)
|
Class Name
|
Costs of a $10,000 investment
|
Costs paid as a percentage of a $10,000 investment
|
|
Class I-2
|
$78
|
0.79%
|
HOW DID THE FUND PERFORM LAST YEAR AND WHAT AFFECTED ITS PERFORMANCE?
|
•
|
For the 12-month period ended March 31, 2025, the Fund underperformed its primary and secondary performance benchmarks, the MSCI ACWI Index (net) and the MSCI World Index (net), respectively. The Fund invests at least 80% of its assets in equity securities that are listed on an exchange or that are otherwise publicly traded in the United States or in a foreign country.
|
|
•
|
The performance explanation is provided relative to the primary benchmark, the MSCI ACWI Index (net). The underperformance of the Fund relative to the MSCI ACWI Index (net) over the 1-year period came primarily from security selection, although sector allocation also detracted value.
|
|
•
|
Security selection in the information technology and consumer discretionary sectors detracted the most. On the other hand, security selection in the healthcare and financials sectors added the most. Exposure to Lennar, Microchip Technology and Samsung Electronics negatively contributed to relative returns. Meanwhile, MonotaRO, DBS Group and Sony were the top contributors to relative performance for the year.
|
|
•
|
Key holdings in the technology sector (notably, Microchip Technology and Adobe, mentioned above) significantly lagged related peers that were more aligned with the first wave of artificial intelligence (AI) spending in the economy. These “first wave” AI companies include large weights in the Index such as Apple, NVIDIA, Amazon, Meta, Broadcom and Tesla—all of which were not owned by the Fund over the period and detracted from excess returns. The goods and services provided by Microchip and Adobe (i.e., microcontrollers and software providers) have the potential to be beneficiaries of AI spending in the years to come.
|
|
•
|
From a sector allocation standpoint, an overweight position in the materials sector and an underweight position in the communication services sectors detracted from relative performance. An underweight exposure to the information technology sector and an overweight position to the financials sector added value.
|
|
•
|
Regionally, security selection in North America negatively contributed to relative return, while security selection in Japan added to relative return. A significant overweight allocation to Japen proved to be detrimental to performance but was partially offset by the Fund’s underweight exposure to North America.
|
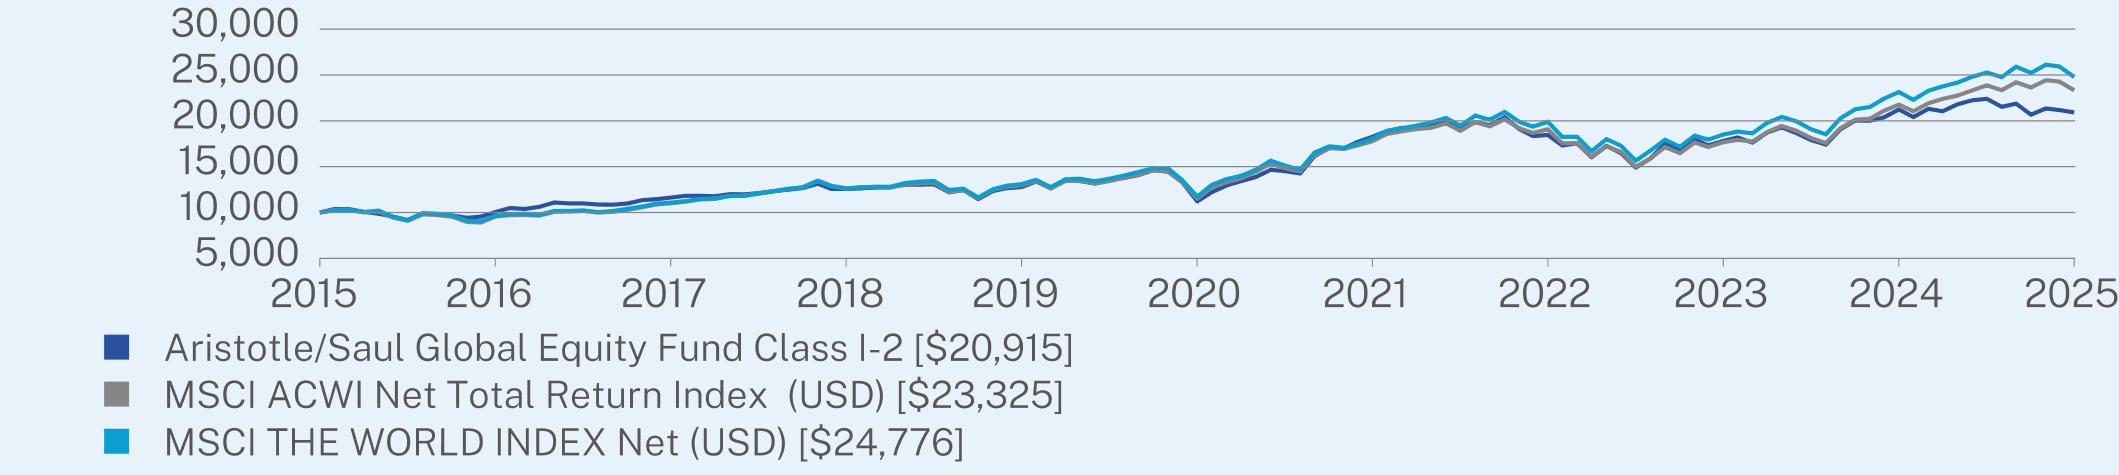
ANNUAL AVERAGE TOTAL RETURN (%)
|
|
1 Year
|
5 Year
|
10 Year
|
|
Class I-2 (without sales charge)
|
-1.53
|
13.27
|
7.66
|
|
MSCI ACWI Net Total Return Index (USD)
|
7.15
|
15.18
|
8.84
|
|
MSCI THE WORLD INDEX Net (USD)
|
7.04
|
16.13
|
9.50
|
Visit https://www.aristotlefunds.com/resources/prospectuses-reports for more recent performance information.
KEY FUND STATISTICS (as of March 31, 2025)
|
Net Assets
|
$31,070,164
|
|
Number of Holdings
|
48
|
|
Net Advisory Fee
|
$250,608
|
|
Portfolio Turnover Rate
|
9%
|
|
Top 10 Issuers
|
(%)
|
|
Microsoft Corp.
|
4.5%
|
|
Muenchener Rueckversicherungs-Gesellschaft AG in Muenchen
|
3.9%
|
|
Lennar Corp.
|
3.6%
|
|
MonotaRO Co. Ltd.
|
3.3%
|
|
Sony Group Corp.
|
3.2%
|
|
DBS Group Holdings Ltd.
|
3.1%
|
|
Martin Marietta Materials, Inc.
|
3.1%
|
|
Cameco Corp.
|
2.8%
|
|
Amgen, Inc.
|
2.7%
|
|
TotalEnergies SE
|
2.7%
|

|
Top Ten Countries
|
(%)
|
|
United States
|
40.0%
|
|
Japan
|
18.6%
|
|
Germany
|
9.3%
|
|
Canada
|
5.1%
|
|
France
|
4.2%
|
|
Switzerland
|
3.7%
|
|
Ireland
|
3.1%
|
|
United Kingdom
|
3.1%
|
|
Singapore
|
3.1%
|
|
Cash & Other
|
9.8%
|
Changes to Fund’s Investment Objective or Goals:
The Fund changed its Investment Goal to seek to maximize long-term capital appreciation, removing the reference to also seeking income.
Changes to Shareholder Fees (fees paid directly from your investment).
Effective April 1, 2024, the Fund’s Advisory Fee was reduced from 0.70% to 0.60% and the Supervision and Administration Fee for Class I-2 has been increased from 0.08% to 0.18%. As a result of these changes, there has been no change to the Fund’s total Management Fee.
Changes to Fund’s Principal Risks:
In the Fund’s Principal Risks, Information Technology Sector Risk was added.
This report describes changes to the Fund that occurred during the reporting period.
WHAT WERE THE FUND COSTS FOR THE PAST YEAR? (based on a hypothetical $10,000 investment)
|
Class Name
|
Costs of a $10,000 investment
|
Costs paid as a percentage of a $10,000 investment
|
|
Class A
|
$95
|
0.95%
|
HOW DID THE FUND PERFORM LAST YEAR AND WHAT AFFECTED ITS PERFORMANCE?
|
•
|
For the 12-month period ended March 31, 2025, the Fund underperformed its primary and secondary performance benchmarks, the Russell 1000 Value Index and the S&P 500 Index, respectively. The Fund invests at least 80% of its assets in equity securities.
|
|
•
|
The performance explanation is provided relative to the primary benchmark, the Russell 1000 Value Index. The underperformance of the Fund relative to the Russell 1000 Value Index over the 1-year period came from both security selection and sector allocation.
|
|
•
|
Security selection in the information technology and financials sectors detracted the most from relative performance. On the other hand, security selection in the utilities and energy sectors added the most value.
|
|
•
|
Exposure to Microchip Technology, Lennar and Adobe negatively contributed to relative returns. Meanwhile, Sony, Atmos Energy and Mitsubishi UFJ Financial Group were the top contributors to relative performance for the year.
|
|
•
|
Key holdings in the technology sector (notably, Microchip Technology and Adobe, mentioned above) lagged related peers that were more aligned with the “first wave” of artificial intelligence (AI) spending in the economy.
|
|
•
|
From a sector allocation standpoint, an overweight position in the materials and information technology sectors detracted from relative performance. An underweight exposure to the healthcare sector and an overweight position in the utilities sector added value.
|
|
•
|
During the 12-month period, some companies in the Russell 1000 Value Index (top holdings at significant percentages and not owned by the Fund due to valuations) meaningfully outperformed the market, representing a key area of detraction from excess return. Top detractors not owned included Berkshire Hathaway, Walmart and JPMorgan.
|

ANNUAL AVERAGE TOTAL RETURN (%)
|
|
1 Year
|
Since Inception
(12/28/2023) |
|
Class A (without sales charge)
|
0.28
|
5.92
|
|
Class A (with sales charge)
|
-4.02
|
2.35
|
|
S&P 500 TR
|
8.25
|
15.10
|
|
Russell 1000 Value Total Return Index
|
7.18
|
12.87
|
Visit https://www.aristotlefunds.com/resources/prospectuses-reports for more recent performance information.
KEY FUND STATISTICS (as of March 31, 2025)
|
Net Assets
|
$562,116,132
|
|
Number of Holdings
|
44
|
|
Net Advisory Fee
|
$3,606,610
|
|
Portfolio Turnover Rate
|
13%
|
|
Top 10 Issuers
|
(%)
|
|
Parker-Hannifin Corp.
|
4.4%
|
|
Ameriprise Financial, Inc.
|
3.6%
|
|
Microsoft Corp.
|
3.4%
|
|
Corteva, Inc.
|
3.3%
|
|
Capital One Financial Corp.
|
3.2%
|
|
Sony Group Corp.
|
2.9%
|
|
ANSYS, Inc.
|
2.8%
|
|
Atmos Energy Corp.
|
2.7%
|
|
Amgen, Inc.
|
2.6%
|
|
Lennar Corp.
|
2.6%
|
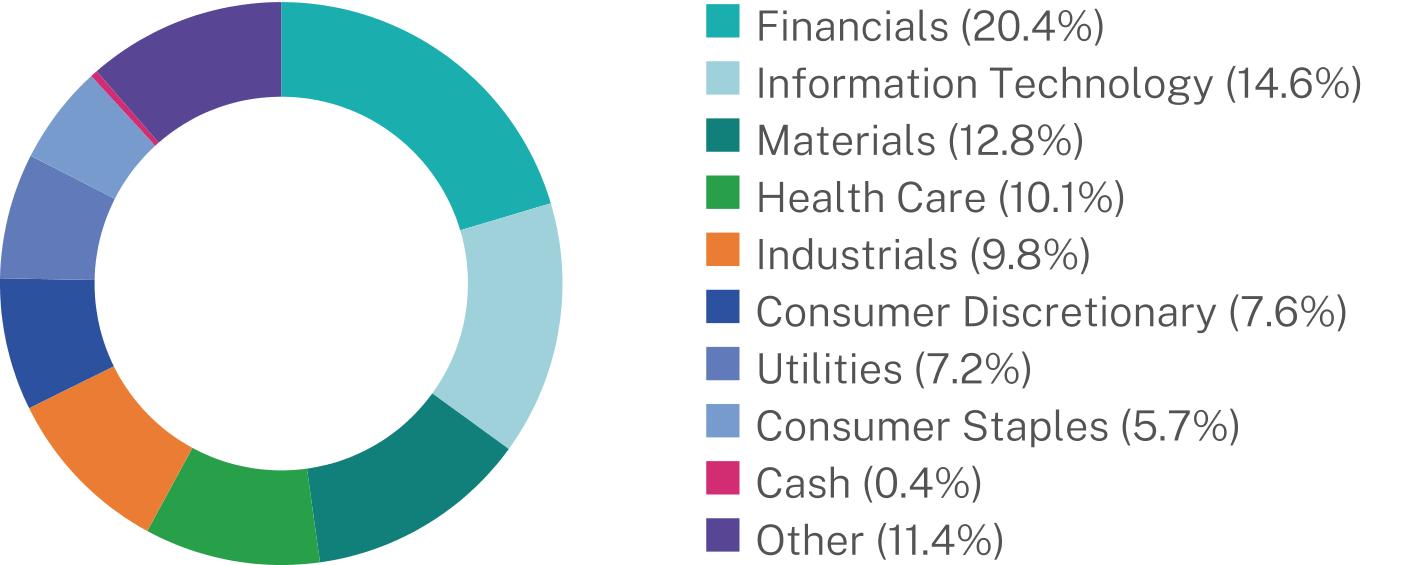
Changes to Shareholder Fees (fees paid directly from your investment).
Effective April 1, 2024, the Fund’s Advisory Fee was reduced from 0.60% to 0.55% and the Supervision and Administration Fee for Class A has been increased from 0.09% to 0.14%. As a result of these changes, there has been no change to the Fund’s total Management Fee.
Changes to Fund’s Principal Risks:
In the Fund’s Principal Risks, Information Technology Sector Risk and Sector Focus Risk were added.
This report describes changes to the Fund that occurred during the reporting period.
WHAT WERE THE FUND COSTS FOR THE PAST YEAR? (based on a hypothetical $10,000 investment)
|
Class Name
|
Costs of a $10,000 investment
|
Costs paid as a percentage of a $10,000 investment
|
|
Class I
|
$69
|
0.69%
|
HOW DID THE FUND PERFORM LAST YEAR AND WHAT AFFECTED ITS PERFORMANCE?
|
•
|
For the 12-month period ended March 31, 2025, the Fund underperformed its primary and secondary performance benchmarks, the Russell 1000 Value Index and the S&P 500 Index, respectively. The Fund invests at least 80% of its assets in equity securities.
|
|
•
|
The performance explanation is provided relative to the primary benchmark, the Russell 1000 Value Index. The underperformance of the Fund relative to the Russell 1000 Value Index over the 1-year period came from both security selection and sector allocation.
|
|
•
|
Security selection in the information technology and financials sectors detracted the most from relative performance. On the other hand, security selection in the utilities and energy sectors added the most value.
|
|
•
|
Exposure to Microchip Technology, Lennar and Adobe negatively contributed to relative returns. Meanwhile, Sony, Atmos Energy and Mitsubishi UFJ Financial Group were the top contributors to relative performance for the year.
|
|
•
|
Key holdings in the technology sector (notably, Microchip Technology and Adobe, mentioned above) lagged related peers that were more aligned with the “first wave” of artificial intelligence (AI) spending in the economy.
|
|
•
|
From a sector allocation standpoint, an overweight position in the materials and information technology sectors detracted from relative performance. An underweight exposure to the healthcare sector and an overweight position in the utilities sector added value.
|
|
•
|
During the 12-month period, some companies in the Russell 1000 Value Index (top holdings at significant percentages and not owned by the Fund due to valuations) meaningfully outperformed the market, representing a key area of detraction from excess return. Top detractors not owned included Berkshire Hathaway, Walmart and JPMorgan.
|
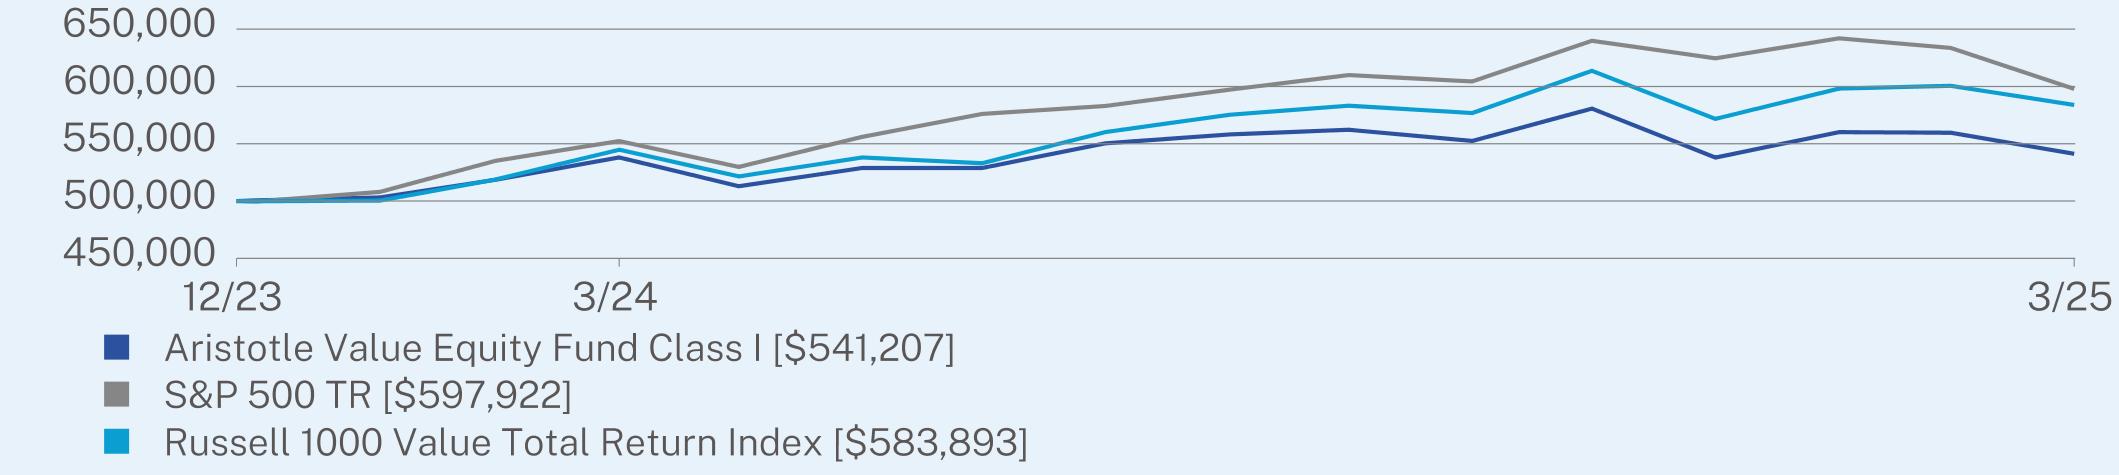
ANNUAL AVERAGE TOTAL RETURN (%)
|
|
1 Year
|
Since Inception
(12/26/2023) |
|
Class I (without sales charge)
|
0.58
|
6.47
|
|
S&P 500 TR
|
8.25
|
15.21
|
|
Russell 1000 Value Total Return Index
|
7.18
|
13.07
|
Visit https://www.aristotlefunds.com/resources/prospectuses-reports for more recent performance information.
KEY FUND STATISTICS (as of March 31, 2025)
|
Net Assets
|
$562,116,132
|
|
Number of Holdings
|
44
|
|
Net Advisory Fee
|
$3,606,610
|
|
Portfolio Turnover Rate
|
13%
|
|
Top 10 Issuers
|
(%)
|
|
Parker-Hannifin Corp.
|
4.4%
|
|
Ameriprise Financial, Inc.
|
3.6%
|
|
Microsoft Corp.
|
3.4%
|
|
Corteva, Inc.
|
3.3%
|
|
Capital One Financial Corp.
|
3.2%
|
|
Sony Group Corp.
|
2.9%
|
|
ANSYS, Inc.
|
2.8%
|
|
Atmos Energy Corp.
|
2.7%
|
|
Amgen, Inc.
|
2.6%
|
|
Lennar Corp.
|
2.6%
|

Changes to Shareholder Fees (fees paid directly from your investment).
Effective April 1, 2024, a Management Fee waiver was implemented to limit Total Annual Fund Operating Expenses to 0.69%. Effective April 1, 2024, the Fund’s Advisory Fee was reduced from 0.60% to 0.55% and the Supervision and Administration Fee for Class I has been increased from 0.09% to 0.14%. As a result of these changes, there has been no change to the Fund’s total Management Fee.
Changes to Fund’s Principal Risks:
In the Fund’s Principal Risks, Information Technology Sector Risk and Sector Focus Risk were added.
This report describes changes to the Fund that occurred during the reporting period.
WHAT WERE THE FUND COSTS FOR THE PAST YEAR? (based on a hypothetical $10,000 investment)
|
Class Name
|
Costs of a $10,000 investment
|
Costs paid as a percentage of a $10,000 investment
|
|
Class I-2
|
$69
|
0.69%
|
HOW DID THE FUND PERFORM LAST YEAR AND WHAT AFFECTED ITS PERFORMANCE?
|
•
|
For the 12-month period ended March 31, 2025, the Fund underperformed its primary and secondary performance benchmarks, the Russell 1000 Value Index and the S&P 500 Index, respectively. The Fund invests at least 80% of its assets in equity securities.
|
|
•
|
The performance explanation is provided relative to the primary benchmark, the Russell 1000 Value Index. The underperformance of the Fund relative to the Russell 1000 Value Index over the 1-year period came from both security selection and sector allocation.
|
|
•
|
Security selection in the information technology and financials sectors detracted the most from relative performance. On the other hand, security selection in the utilities and energy sectors added the most value.
|
|
•
|
Exposure to Microchip Technology, Lennar and Adobe negatively contributed to relative returns. Meanwhile, Sony, Atmos Energy and Mitsubishi UFJ Financial Group were the top contributors to relative performance for the year.
|
|
•
|
Key holdings in the technology sector (notably, Microchip Technology and Adobe, mentioned above) lagged related peers that were more aligned with the “first wave” of artificial intelligence (AI) spending in the economy.
|
|
•
|
From a sector allocation standpoint, an overweight position in the materials and information technology sectors detracted from relative performance. An underweight exposure to the healthcare sector and an overweight position in the utilities sector added value.
|
|
•
|
During the 12-month period, some companies in the Russell 1000 Value Index (top holdings at significant percentages and not owned by the Fund due to valuations) meaningfully outperformed the market, representing a key area of detraction from excess return. Top detractors not owned included Berkshire Hathaway, Walmart and JPMorgan.
|
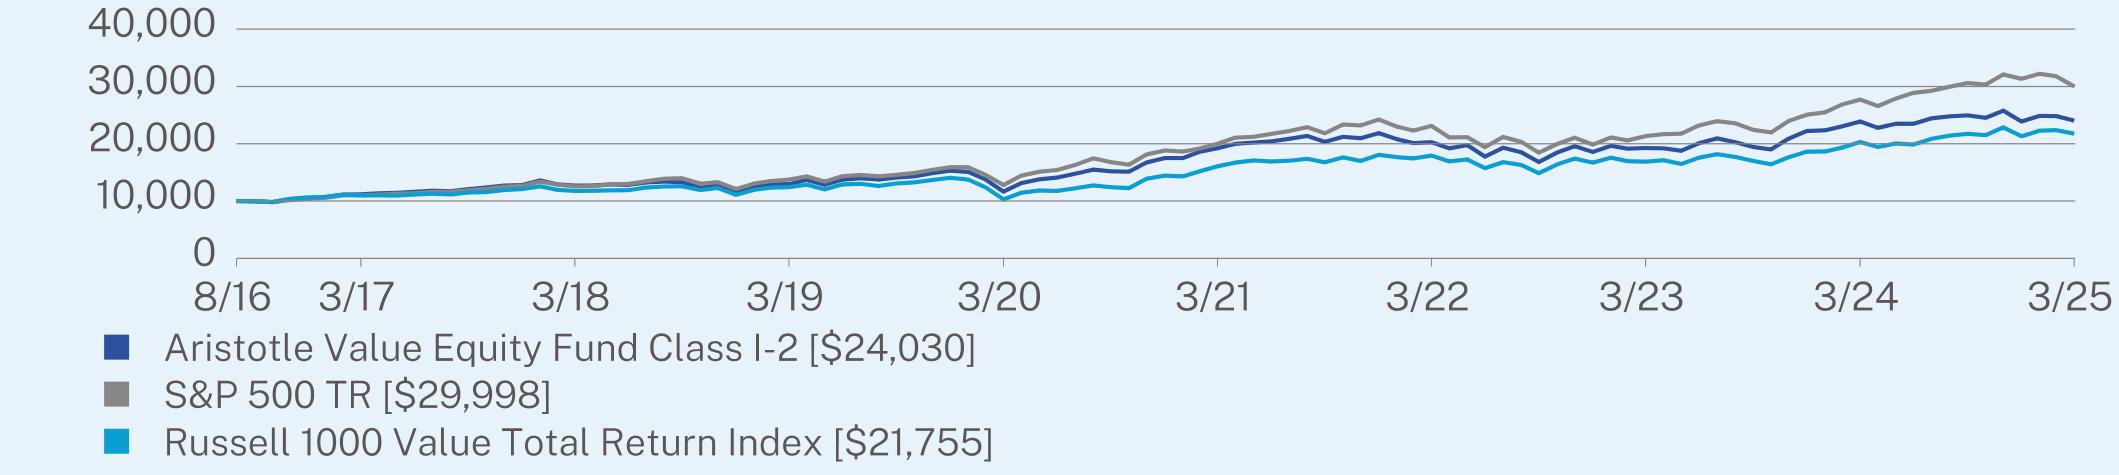
ANNUAL AVERAGE TOTAL RETURN (%)
|
|
1 Year
|
5 Year
|
Since Inception
(08/31/2016) |
|
Class I-2 (without sales charge)
|
0.61
|
15.58
|
10.76
|
|
S&P 500 TR
|
8.25
|
18.59
|
13.66
|
|
Russell 1000 Value Total Return Index
|
7.18
|
16.15
|
9.48
|
Visit https://www.aristotlefunds.com/resources/prospectuses-reports for more recent performance information.
KEY FUND STATISTICS (as of March 31, 2025)
|
Net Assets
|
$562,116,132
|
|
Number of Holdings
|
44
|
|
Net Advisory Fee
|
$3,606,610
|
|
Portfolio Turnover Rate
|
13%
|
|
Top 10 Issuers
|
(%)
|
|
Parker-Hannifin Corp.
|
4.4%
|
|
Ameriprise Financial, Inc.
|
3.6%
|
|
Microsoft Corp.
|
3.4%
|
|
Corteva, Inc.
|
3.3%
|
|
Capital One Financial Corp.
|
3.2%
|
|
Sony Group Corp.
|
2.9%
|
|
ANSYS, Inc.
|
2.8%
|
|
Atmos Energy Corp.
|
2.7%
|
|
Amgen, Inc.
|
2.6%
|
|
Lennar Corp.
|
2.6%
|

Changes to Shareholder Fees (fees paid directly from your investment).
Effective April 1, 2024, the Fund’s Advisory Fee was reduced from 0.60% to 0.55% and the Supervision and Administration Fee for Class I-2 has been increased from 0.09% to 0.14%. As a result of these changes, there has been no change to the Fund’s total Management Fee.
Changes to Fund’s Principal Risks:
In the Fund’s Principal Risks, Information Technology Sector Risk and Sector Focus Risk were added.
This report describes changes to the Fund that occurred during the reporting period.
WHAT WERE THE FUND COSTS FOR THE PAST YEAR? (based on a hypothetical $10,000 investment)
|
Class Name
|
Costs of a $10,000 investment
|
Costs paid as a percentage of a $10,000 investment
|
|
Class R6
|
$61
|
0.61%
|
HOW DID THE FUND PERFORM LAST YEAR AND WHAT AFFECTED ITS PERFORMANCE?
|
•
|
For the 12-month period ended March 31, 2025, the Fund underperformed its primary and secondary performance benchmarks, the Russell 1000 Value Index and the S&P 500 Index, respectively. The Fund invests at least 80% of its assets in equity securities.
|
|
•
|
The performance explanation is provided relative to the primary benchmark, the Russell 1000 Value Index. The underperformance of the Fund relative to the Russell 1000 Value Index over the 1-year period came from both security selection and sector allocation.
|
|
•
|
Security selection in the information technology and financials sectors detracted the most from relative performance. On the other hand, security selection in the utilities and energy sectors added the most value.
|
|
•
|
Exposure to Microchip Technology, Lennar and Adobe negatively contributed to relative returns. Meanwhile, Sony, Atmos Energy and Mitsubishi UFJ Financial Group were the top contributors to relative performance for the year.
|
|
•
|
Key holdings in the technology sector (notably, Microchip Technology and Adobe, mentioned above) lagged related peers that were more aligned with the “first wave” of artificial intelligence (AI) spending in the economy.
|
|
•
|
From a sector allocation standpoint, an overweight position in the materials and information technology sectors detracted from relative performance. An underweight exposure to the healthcare sector and an overweight position in the utilities sector added value.
|
|
•
|
During the 12-month period, some companies in the Russell 1000 Value Index (top holdings at significant percentages and not owned by the Fund due to valuations) meaningfully outperformed the market, representing a key area of detraction from excess return. Top detractors not owned included Berkshire Hathaway, Walmart and JPMorgan.
|
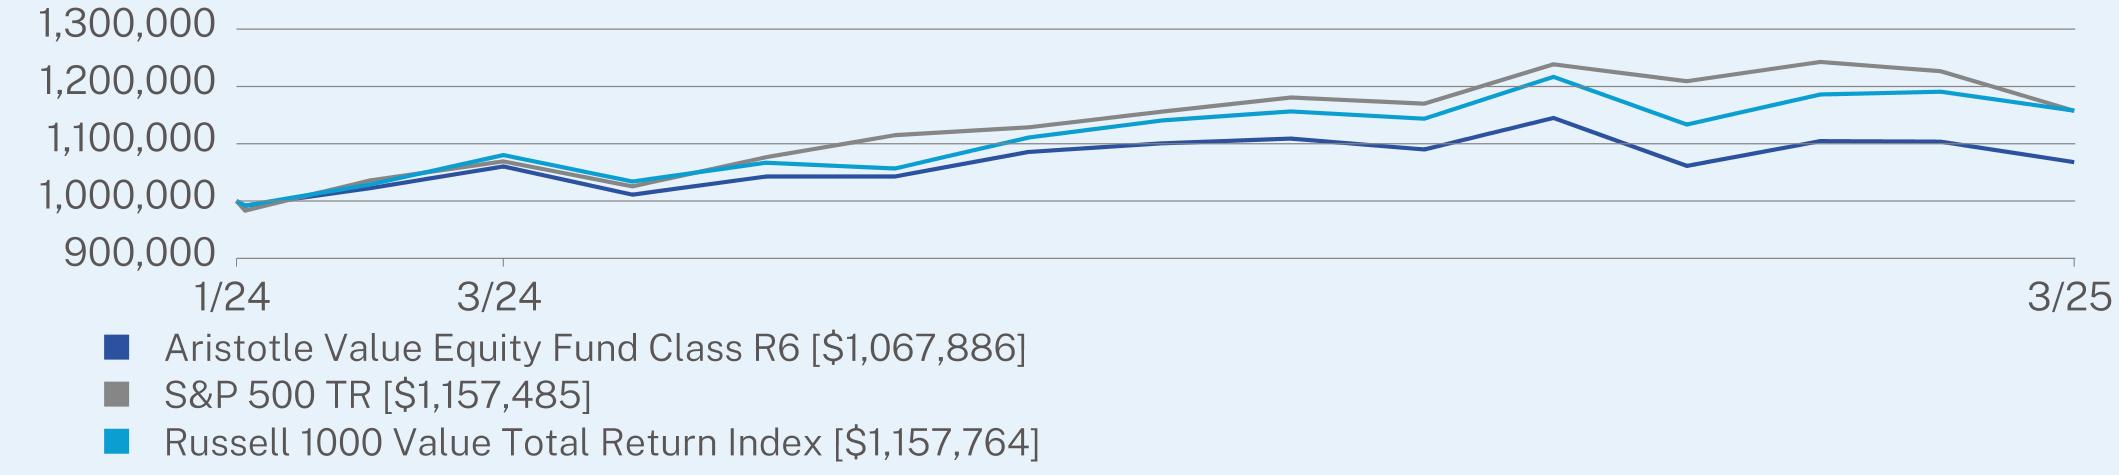
ANNUAL AVERAGE TOTAL RETURN (%)
|
|
1 Year
|
Since Inception
(01/29/2024) |
|
Class R6 (without sales charge)
|
0.71
|
5.78
|
|
S&P 500 TR
|
8.25
|
13.32
|
|
Russell 1000 Value Total Return Index
|
7.18
|
13.34
|
Visit https://www.aristotlefunds.com/resources/prospectuses-reports for more recent performance information.
KEY FUND STATISTICS (as of March 31, 2025)
|
Net Assets
|
$562,116,132
|
|
Number of Holdings
|
44
|
|
Net Advisory Fee
|
$3,606,610
|
|
Portfolio Turnover Rate
|
13%
|
|
Top 10 Issuers
|
(%)
|
|
Parker-Hannifin Corp.
|
4.4%
|
|
Ameriprise Financial, Inc.
|
3.6%
|
|
Microsoft Corp.
|
3.4%
|
|
Corteva, Inc.
|
3.3%
|
|
Capital One Financial Corp.
|
3.2%
|
|
Sony Group Corp.
|
2.9%
|
|
ANSYS, Inc.
|
2.8%
|
|
Atmos Energy Corp.
|
2.7%
|
|
Amgen, Inc.
|
2.6%
|
|
Lennar Corp.
|
2.6%
|

Changes to Shareholder Fees (fees paid directly from your investment).
Effective April 1, 2024, a Management Fee waiver was implemented to limit Total Annual Fund Operating Expenses to 0.61%. Effective April 1, 2024, the Fund’s Advisory Fee was reduced from 0.60% to 0.55% and the Supervision and Administration Fee for Class R6 has been increased from 0.01% to 0.06%. As a result of these changes, there has been no change to the Fund’s total Management Fee.
Changes to Fund’s Principal Risks:
In the Fund’s Principal Risks, Information Technology Sector Risk and Sector Focus Risk were added.
This report describes changes to the Fund that occurred during the reporting period.
WHAT WERE THE FUND COSTS FOR THE PAST YEAR? (based on a hypothetical $10,000 investment)
|
Class Name
|
Costs of a $10,000 investment
|
Costs paid as a percentage of a $10,000 investment
|
|
Class A
|
$72
|
0.70%
|
HOW DID THE FUND PERFORM LAST YEAR AND WHAT AFFECTED ITS PERFORMANCE?
|
•
|
For the 12-month period ended March 31, 2025, the Fund underperformed the Aristotle Portfolio Optimization Aggressive Growth Composite Benchmark1. The Fund is a “fund of funds” that seeks to achieve its investment goal by investing in a combination of underlying funds, including funds that are actively managed by an affiliate of the investment adviser and unaffiliated ETFs, including passively managed funds that seek to track the performance of a benchmark index.
|
|
•
|
For the 12-month period ending March 31, 2025, both equity and fixed income markets ended in positive territory, with equities pulling back in the first quarter of 2025.
|
|
•
|
The U.S. equity markets peaked after the U.S. presidential election prior to pulling back in the first quarter among uncertainty in trade and tariff discussions.
|
|
•
|
International equity performed well with the uncertainty in the U.S. market.
|
|
•
|
Fixed income had a strong start to 2025 and remained up for the 1-year period.
|
|
•
|
The Fund is positioned to be overweight U.S. equity with a slight underweight to international equity and fixed income.
|
|
•
|
Top contributors from our asset allocation during came from an overweight to foreign large-cap value, and an foreign small/mid-cap blend. While detractors came from the overweight to mid-cap growth and an underweight to intermediate-term bond.
|
|
•
|
Top contributors within manager research was an outperformance from foreign large-cap growth and emerging market equity. While detractions came from U.S. large-cap growth and foreign large-cap value.
|

ANNUAL AVERAGE TOTAL RETURN (%)
|
|
1 Year
|
5 Year
|
10 Year
|
|
Class A (without sales charge)
|
4.66
|
13.23
|
7.45
|
|
Class A (with sales charge)
|
-1.11
|
11.96
|
6.84
|
|
S&P 500 TR
|
8.25
|
18.59
|
12.50
|
|
Bloomberg US Aggregate Bond Index
|
4.88
|
-0.40
|
1.46
|
|
Aristotle Portfolio Optimization Aggressive Growth Composite Benchmark
|
7.35
|
15.91
|
10.16
|
Visit https://www.aristotlefunds.com/resources/prospectuses-reports for more recent performance information.
KEY FUND STATISTICS (as of March 31, 2025)
|
Net Assets
|
$254,529,693
|
|
Number of Holdings
|
15
|
|
Net Advisory Fee
|
$544,589
|
|
Portfolio Turnover Rate
|
69%
|
|
Top 10 Issuers
|
(%)
|
|
Aristotle Core Equity Fund
|
22.9%
|
|
Aristotle Growth Equity Fund
|
16.8%
|
|
iShares Russell 1000 Value ETF
|
13.8%
|
|
Aristotle International Equity Fund
|
10.9%
|
|
iShares Russell 2000 Value ETF
|
6.5%
|
|
iShares Russell Mid-Cap Growth ETF
|
6.5%
|
|
iShares Russell Mid-Cap Value ETF
|
4.6%
|
|
iShares MSCI EAFE Value ETF
|
3.5%
|
|
iShares Russell 2000 Growth ETF
|
3.4%
|
|
iShares Core U.S. REIT ETF
|
3.1%
|

Changes to the Fund’s Principal Investment Strategy:
The Fund’s Principal Investment Strategies were revised to reflect that the Fund’s investment in unaffiliated exchange-traded funds may include passively managed funds that seek to track the performance of a benchmark index.
Changes to Fund’s Principal Risks:
In the Fund’s Principal Risks, the description of Asset Allocation Fund of Funds Risk was revised and in the Principal Risks from Holdings In Underlying Funds, Debt Securities Risk, Leverage Risk, Credit Risk, Interest Rate Risk, Mortgage-Related and Other Asset-Backed Securities Risk, U.S. Government Securities Risk, Financial Sector Risk and Liquidity Risk were removed, and Information Technology Sector Risk, Non-Diversification Risk, REIT Investment Risk, Geographic Risk Related to Europe and Sector Focus Risk were added.
This report describes changes to the Fund that occurred during the reporting period.
WHAT WERE THE FUND COSTS FOR THE PAST YEAR? (based on a hypothetical $10,000 investment)
|
Class Name
|
Costs of a $10,000 investment
|
Costs paid as a percentage of a $10,000 investment
|
|
Class C
|
$148
|
1.45%
|
HOW DID THE FUND PERFORM LAST YEAR AND WHAT AFFECTED ITS PERFORMANCE?
|
•
|
For the 12-month period ended March 31, 2025, the Fund underperformed the Aristotle Portfolio Optimization Aggressive Growth Composite Benchmark1. The Fund is a “fund of funds” that seeks to achieve its investment goal by investing in a combination of underlying funds, including funds that are actively managed by an affiliate of the investment adviser and unaffiliated ETFs, including passively managed funds that seek to track the performance of a benchmark index.
|
|
•
|
For the 12-month period ending March 31, 2025, both equity and fixed income markets ended in positive territory, with equities pulling back in the first quarter of 2025.
|
|
•
|
The U.S. equity markets peaked after the U.S. presidential election prior to pulling back in the first quarter among uncertainty in trade and tariff discussions.
|
|
•
|
International equity performed well with the uncertainty in the U.S. market.
|
|
•
|
Fixed income had a strong start to 2025 and remained up for the 1-year period.
|
|
•
|
The Fund is positioned to be overweight U.S. equity with a slight underweight to international equity and fixed income.
|
|
•
|
Top contributors from our asset allocation during came from an overweight to foreign large-cap value, and an foreign small/mid-cap blend. While detractors came from the overweight to mid-cap growth and an underweight to intermediate-term bond.
|
|
•
|
Top contributors within manager research was an outperformance from foreign large-cap growth and emerging market equity. While detractions came from U.S. large-cap growth and foreign large-cap value.
|
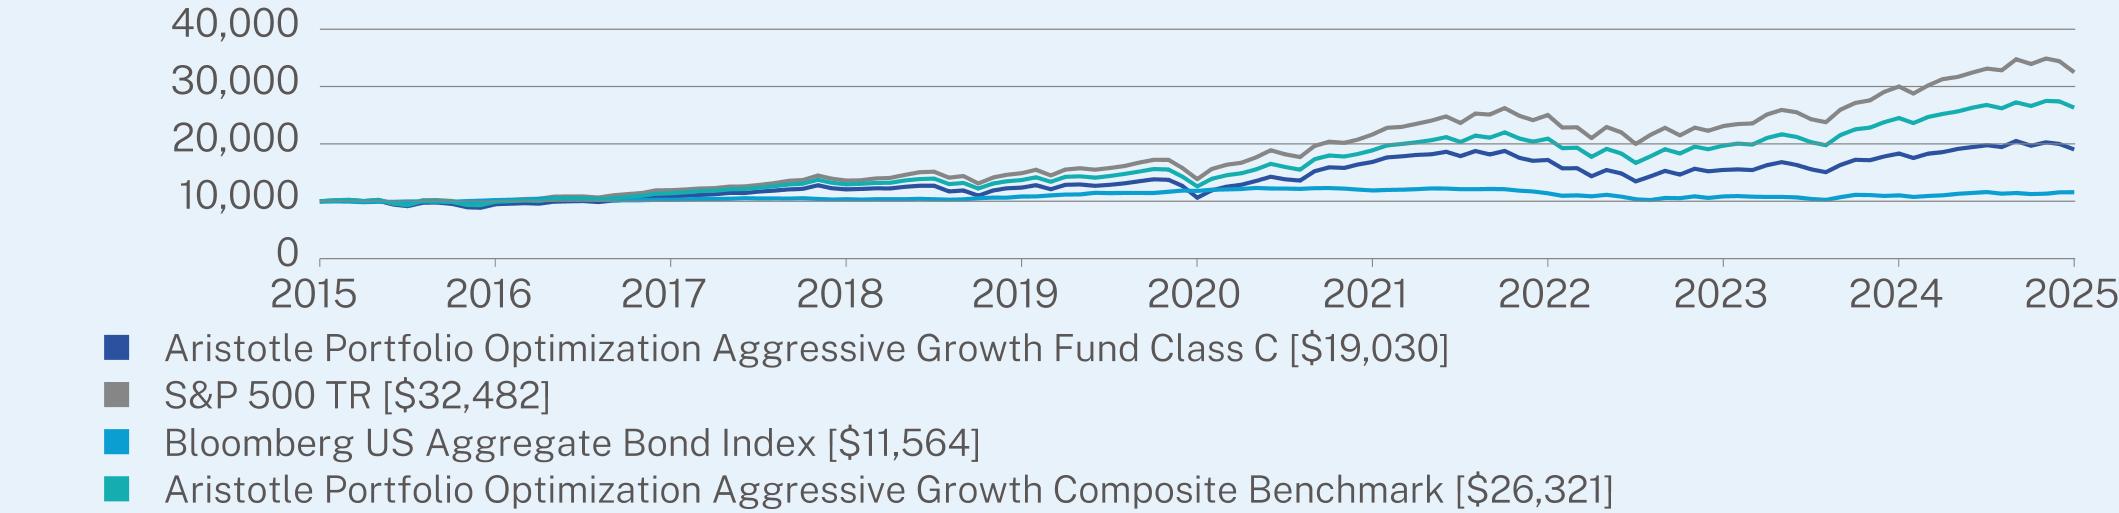
ANNUAL AVERAGE TOTAL RETURN (%)
|
|
1 Year
|
5 Year
|
10 Year
|
|
Class C (without sales charge)
|
3.89
|
12.39
|
6.65
|
|
Class C (with sales charge)
|
2.89
|
12.39
|
6.65
|
|
S&P 500 TR
|
8.25
|
18.59
|
12.50
|
|
Bloomberg US Aggregate Bond Index
|
4.88
|
-0.40
|
1.46
|
|
Aristotle Portfolio Optimization Aggressive Growth Composite Benchmark
|
7.35
|
15.91
|
10.16
|
Visit https://www.aristotlefunds.com/resources/prospectuses-reports for more recent performance information.
KEY FUND STATISTICS (as of March 31, 2025)
|
Net Assets
|
$254,529,693
|
|
Number of Holdings
|
15
|
|
Net Advisory Fee
|
$544,589
|
|
Portfolio Turnover Rate
|
69%
|
|
Top 10 Issuers
|
(%)
|
|
Aristotle Core Equity Fund
|
22.9%
|
|
Aristotle Growth Equity Fund
|
16.8%
|
|
iShares Russell 1000 Value ETF
|
13.8%
|
|
Aristotle International Equity Fund
|
10.9%
|
|
iShares Russell 2000 Value ETF
|
6.5%
|
|
iShares Russell Mid-Cap Growth ETF
|
6.5%
|
|
iShares Russell Mid-Cap Value ETF
|
4.6%
|
|
iShares MSCI EAFE Value ETF
|
3.5%
|
|
iShares Russell 2000 Growth ETF
|
3.4%
|
|
iShares Core U.S. REIT ETF
|
3.1%
|

Changes to the Fund’s Principal Investment Strategy:
The Fund’s Principal Investment Strategies were revised to reflect that the Fund’s investment in unaffiliated exchange-traded funds may include passively managed funds that seek to track the performance of a benchmark index.
Changes to Fund’s Principal Risks:
In the Fund’s Principal Risks, the description of Asset Allocation Fund of Funds Risk was revised and in the Principal Risks from Holdings In Underlying Funds, Debt Securities Risk, Leverage Risk, Credit Risk, Interest Rate Risk, Mortgage-Related and Other Asset-Backed Securities Risk, U.S. Government Securities Risk, Financial Sector Risk and Liquidity Risk were removed, and Information Technology Sector Risk, Non-Diversification Risk, REIT Investment Risk, Geographic Risk Related to Europe and Sector Focus Risk were added.
This report describes changes to the Fund that occurred during the reporting period.
WHAT WERE THE FUND COSTS FOR THE PAST YEAR? (based on a hypothetical $10,000 investment)
|
Class Name
|
Costs of a $10,000 investment
|
Costs paid as a percentage of a $10,000 investment
|
|
Class I-2
|
$46
|
0.45%
|
HOW DID THE FUND PERFORM LAST YEAR AND WHAT AFFECTED ITS PERFORMANCE?
|
•
|
For the 12-month period ended March 31, 2025, the Fund underperformed the Aristotle Portfolio Optimization Aggressive Growth Composite Benchmark1. The Fund is a “fund of funds” that seeks to achieve its investment goal by investing in a combination of underlying funds, including funds that are actively managed by an affiliate of the investment adviser and unaffiliated ETFs, including passively managed funds that seek to track the performance of a benchmark index.
|
|
•
|
For the 12-month period ending March 31, 2025, both equity and fixed income markets ended in positive territory, with equities pulling back in the first quarter of 2025.
|
|
•
|
The U.S. equity markets peaked after the U.S. presidential election prior to pulling back in the first quarter among uncertainty in trade and tariff discussions.
|
|
•
|
International equity performed well with the uncertainty in the U.S. market.
|
|
•
|
Fixed income had a strong start to 2025 and remained up for the 1-year period.
|
|
•
|
The Fund is positioned to be overweight U.S. equity with a slight underweight to international equity and fixed income.
|
|
•
|
Top contributors from our asset allocation during came from an overweight to foreign large-cap value, and an foreign small/mid-cap blend. While detractors came from the overweight to mid-cap growth and an underweight to intermediate-term bond.
|
|
•
|
Top contributors within manager research was an outperformance from foreign large-cap growth and emerging market equity. While detractions came from U.S. large-cap growth and foreign large-cap value.
|

ANNUAL AVERAGE TOTAL RETURN (%)
|
|
1 Year
|
5 Year
|
10 Year
|
|
Class I-2 (without sales charge)
|
4.81
|
13.49
|
7.71
|
|
S&P 500 TR
|
8.25
|
18.59
|
12.50
|
|
Bloomberg US Aggregate Bond Index
|
4.88
|
-0.40
|
1.46
|
|
Aristotle Portfolio Optimization Aggressive Growth Composite Benchmark
|
7.35
|
15.91
|
10.16
|
Visit https://www.aristotlefunds.com/resources/prospectuses-reports for more recent performance information.
KEY FUND STATISTICS (as of March 31, 2025)
|
Net Assets
|
$254,529,693
|
|
Number of Holdings
|
15
|
|
Net Advisory Fee
|
$544,589
|
|
Portfolio Turnover Rate
|
69%
|
|
Top 10 Issuers
|
(%)
|
|
Aristotle Core Equity Fund
|
22.9%
|
|
Aristotle Growth Equity Fund
|
16.8%
|
|
iShares Russell 1000 Value ETF
|
13.8%
|
|
Aristotle International Equity Fund
|
10.9%
|
|
iShares Russell 2000 Value ETF
|
6.5%
|
|
iShares Russell Mid-Cap Growth ETF
|
6.5%
|
|
iShares Russell Mid-Cap Value ETF
|
4.6%
|
|
iShares MSCI EAFE Value ETF
|
3.5%
|
|
iShares Russell 2000 Growth ETF
|
3.4%
|
|
iShares Core U.S. REIT ETF
|
3.1%
|

Changes to the Fund’s Principal Investment Strategy:
The Fund’s Principal Investment Strategies were revised to reflect that the Fund’s investment in unaffiliated exchange-traded funds may include passively managed funds that seek to track the performance of a benchmark index.
Changes to Fund’s Principal Risks:
In the Fund’s Principal Risks, the description of Asset Allocation Fund of Funds Risk was revised and in the Principal Risks from Holdings In Underlying Funds, Debt Securities Risk, Leverage Risk, Credit Risk, Interest Rate Risk, Mortgage-Related and Other Asset-Backed Securities Risk, U.S. Government Securities Risk, Financial Sector Risk and Liquidity Risk were removed, and Information Technology Sector Risk, Non-Diversification Risk, REIT Investment Risk, Geographic Risk Related to Europe and Sector Focus Risk were added.
This report describes changes to the Fund that occurred during the reporting period.
WHAT WERE THE FUND COSTS FOR THE PAST YEAR? (based on a hypothetical $10,000 investment)
|
Class Name
|
Costs of a $10,000 investment
|
Costs paid as a percentage of a $10,000 investment
|
|
Class A
|
$72
|
0.70%
|
HOW DID THE FUND PERFORM LAST YEAR AND WHAT AFFECTED ITS PERFORMANCE?
|
•
|
For the 12-month period ended March 31, 2025, the Fund underperformed the Aristotle Portfolio Optimization Conservative Composite Benchmark1. The Fund is a “fund of funds” that seeks to achieve its investment goal by investing in a combination of underlying funds, including funds that are actively managed by an affiliate of the investment adviser and unaffiliated ETFs, including passively managed funds that seek to track the performance of a benchmark index.
|
|
•
|
For the 12-month period ending March 31, 2025, both equity and fixed markets ended in positive territory, with equities pulling back in the first quarter of 2025.
|
|
•
|
The U.S. equity markets peaked after the U.S. presidential election prior to pulling back in the first quarter among uncertainty in trade and tariff discussions.
|
|
•
|
International equity performed well with the uncertainty in the U.S. market.
|
|
•
|
Fixed income had a strong start to 2025 and remained up for the 1-year period.
|
|
•
|
The Fund is positioned to be overweight US equity with a slight underweight to international equity and fixed income.
|
|
•
|
Top contributors from asset allocation came from an overweight to foreign large value, and an underweight to small growth. While detractors came from the overweight to small-cap value and mid-cap growth.
|
|
•
|
Top contributors within manager research was an outperformance from foreign large-cap growth and emerging market bonds. While detractions came from U.S. large-cap growth and foreign large-cap value.
|
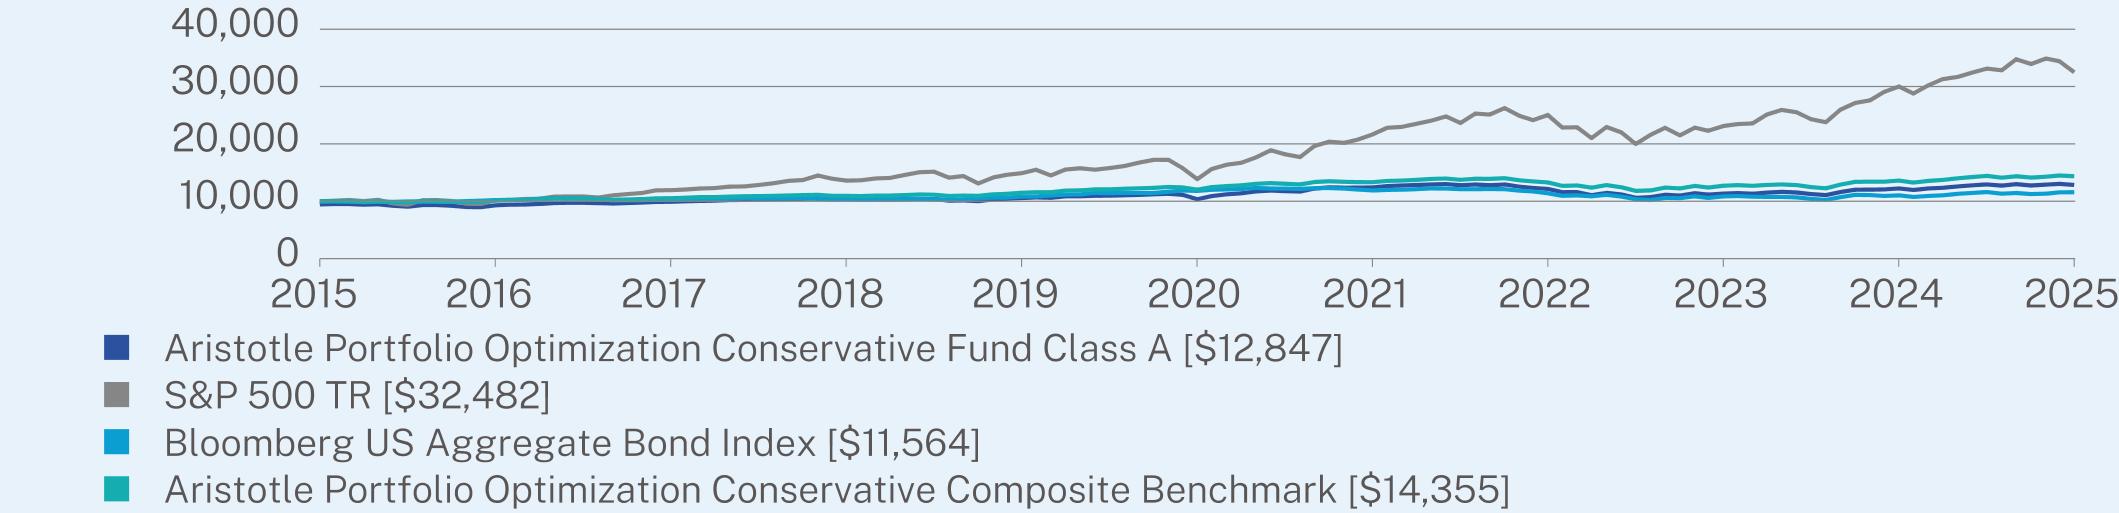
ANNUAL AVERAGE TOTAL RETURN (%)
|
|
1 Year
|
5 Year
|
10 Year
|
|
Class A (without sales charge)
|
4.98
|
4.43
|
3.12
|
|
Class A (with sales charge)
|
-0.78
|
3.26
|
2.54
|
|
S&P 500 TR
|
8.25
|
18.59
|
12.50
|
|
Bloomberg US Aggregate Bond Index
|
4.88
|
-0.40
|
1.46
|
|
Aristotle Portfolio Optimization Conservative Composite Benchmark
|
5.55
|
3.61
|
3.68
|
Visit https://www.aristotlefunds.com/resources/prospectuses-reports for more recent performance information.
KEY FUND STATISTICS (as of March 31, 2025)
|
Net Assets
|
$127,994,789
|
|
Number of Holdings
|
15
|
|
Net Advisory Fee
|
$274,091
|
|
Portfolio Turnover Rate
|
53%
|
|
Top 10 Issuers
|
(%)
|
|
Aristotle Core Income Fund
|
40.0%
|
|
Aristotle Short Duration Income Fund
|
10.5%
|
|
Aristotle Core Bond Fund
|
8.1%
|
|
Aristotle High Yield Bond Fund
|
6.5%
|
|
Aristotle Core Equity Fund
|
6.2%
|
|
iShares Russell 1000 Value ETF
|
5.9%
|
|
Aristotle Growth Equity Fund
|
4.7%
|
|
iShares TIPS Bond ETF
|
3.6%
|
|
Aristotle Floating Rate Income Fund
|
3.5%
|
|
iShares MSCI EAFE Value ETF
|
3.5%
|

Changes to the Fund’s Principal Investment Strategy:
The Fund’s Principal Investment Strategies were revised to reflect that the Fund’s investment in unaffiliated exchange-traded funds may include passively managed funds that seek to track the performance of a benchmark index.
Changes to Fund’s Principal Risks:
In the Fund’s Principal Risks, the description of Asset Allocation Fund of Funds Risk and Conflicts of Interest Risk were revised and in the Principal Risks from Holdings In Underlying Funds, Leverage Risk, Convertible Securities Risk, Geographic Focus Risk, Growth Companies Risk, Inflation-Indexed Debt Securities Risk, REIT Investment Risk and Sector Focus Risk were added.
This report describes changes to the Fund that occurred during the reporting period.
WHAT WERE THE FUND COSTS FOR THE PAST YEAR? (based on a hypothetical $10,000 investment)
|
Class Name
|
Costs of a $10,000 investment
|
Costs paid as a percentage of a $10,000 investment
|
|
Class C
|
$148
|
1.45%
|
HOW DID THE FUND PERFORM LAST YEAR AND WHAT AFFECTED ITS PERFORMANCE?
|
•
|
For the 12-month period ended March 31, 2025, the Fund underperformed the Aristotle Portfolio Optimization Conservative Composite Benchmark1. The Fund is a “fund of funds” that seeks to achieve its investment goal by investing in a combination of underlying funds, including funds that are actively managed by an affiliate of the investment adviser and unaffiliated ETFs, including passively managed funds that seek to track the performance of a benchmark index.
|
|
•
|
For the 12-month period ending March 31, 2025, both equity and fixed markets ended in positive territory, with equities pulling back in the first quarter of 2025.
|
|
•
|
The U.S. equity markets peaked after the U.S. presidential election prior to pulling back in the first quarter among uncertainty in trade and tariff discussions.
|
|
•
|
International equity performed well with the uncertainty in the U.S. market.
|
|
•
|
Fixed income had a strong start to 2025 and remained up for the 1-year period.
|
|
•
|
The Fund is positioned to be overweight US equity with a slight underweight to international equity and fixed income.
|
|
•
|
Top contributors from asset allocation came from an overweight to foreign large value, and an underweight to small growth. While detractors came from the overweight to small-cap value and mid-cap growth.
|
|
•
|
Top contributors within manager research was an outperformance from foreign large-cap growth and emerging market bonds. While detractions came from U.S. large-cap growth and foreign large-cap value.
|
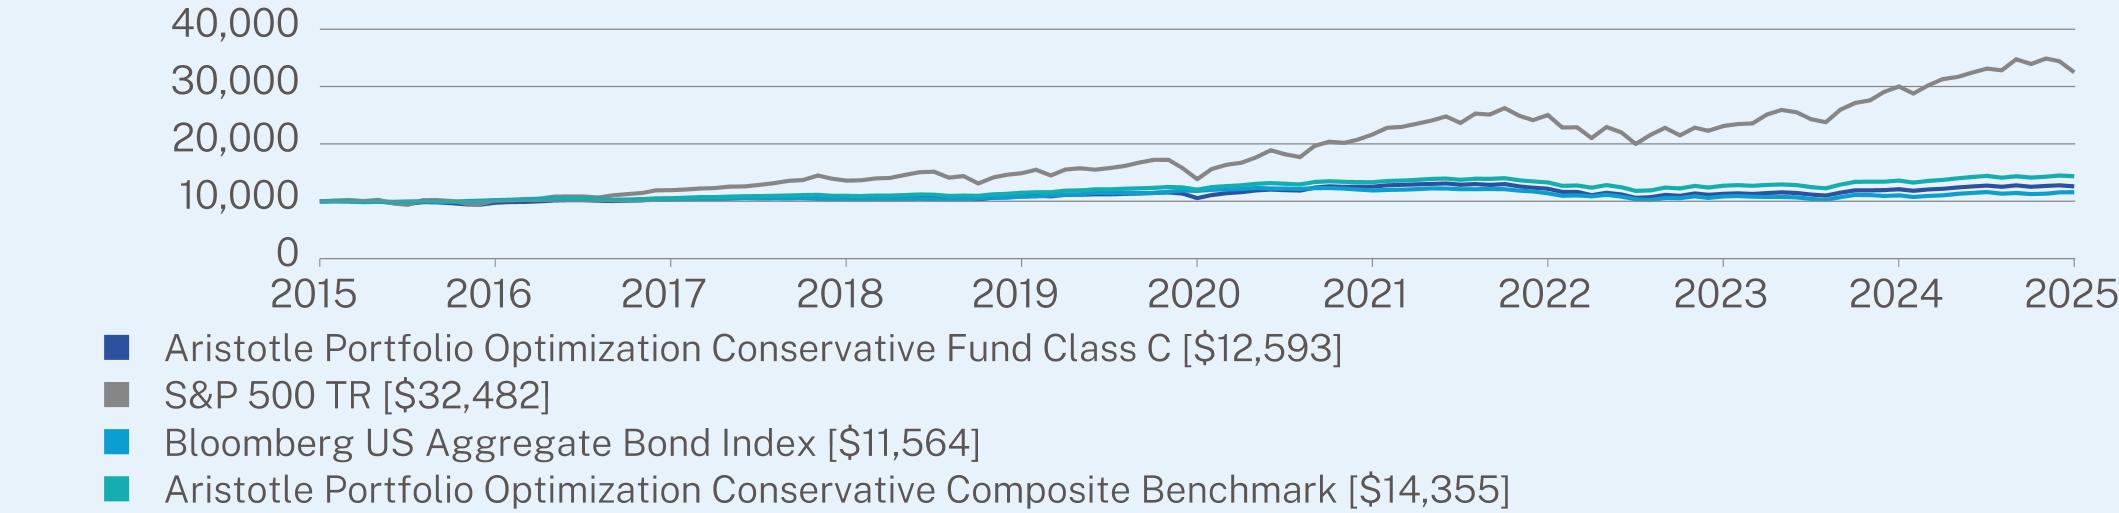
ANNUAL AVERAGE TOTAL RETURN (%)
|
|
1 Year
|
5 Year
|
10 Year
|
|
Class C (without sales charge)
|
4.15
|
3.62
|
2.33
|
|
Class C (with sales charge)
|
3.15
|
3.62
|
2.33
|
|
S&P 500 TR
|
8.25
|
18.59
|
12.50
|
|
Bloomberg US Aggregate Bond Index
|
4.88
|
-0.40
|
1.46
|
|
Aristotle Portfolio Optimization Conservative Composite Benchmark
|
5.55
|
3.61
|
3.68
|
Visit https://www.aristotlefunds.com/resources/prospectuses-reports for more recent performance information.
KEY FUND STATISTICS (as of March 31, 2025)
|
Net Assets
|
$127,994,789
|
|
Number of Holdings
|
15
|
|
Net Advisory Fee
|
$274,091
|
|
Portfolio Turnover Rate
|
53%
|
|
Top 10 Issuers
|
(%)
|
|
Aristotle Core Income Fund
|
40.0%
|
|
Aristotle Short Duration Income Fund
|
10.5%
|
|
Aristotle Core Bond Fund
|
8.1%
|
|
Aristotle High Yield Bond Fund
|
6.5%
|
|
Aristotle Core Equity Fund
|
6.2%
|
|
iShares Russell 1000 Value ETF
|
5.9%
|
|
Aristotle Growth Equity Fund
|
4.7%
|
|
iShares TIPS Bond ETF
|
3.6%
|
|
Aristotle Floating Rate Income Fund
|
3.5%
|
|
iShares MSCI EAFE Value ETF
|
3.5%
|

Changes to the Fund’s Principal Investment Strategy:
The Fund’s Principal Investment Strategies were revised to reflect that the Fund’s investment in unaffiliated exchange-traded funds may include passively managed funds that seek to track the performance of a benchmark index.
Changes to Fund’s Principal Risks:
In the Fund’s Principal Risks, the description of Asset Allocation Fund of Funds Risk and Conflicts of Interest Risk were revised and in the Principal Risks from Holdings In Underlying Funds, Leverage Risk, Convertible Securities Risk, Geographic Focus Risk, Growth Companies Risk, Inflation-Indexed Debt Securities Risk, REIT Investment Risk and Sector Focus Risk were added.
This report describes changes to the Fund that occurred during the reporting period.
WHAT WERE THE FUND COSTS FOR THE PAST YEAR? (based on a hypothetical $10,000 investment)
|
Class Name
|
Costs of a $10,000 investment
|
Costs paid as a percentage of a $10,000 investment
|
|
Class I-2
|
$46
|
0.45%
|
HOW DID THE FUND PERFORM LAST YEAR AND WHAT AFFECTED ITS PERFORMANCE?
|
•
|
For the 12-month period ended March 31, 2025, the Fund underperformed the Aristotle Portfolio Optimization Conservative Composite Benchmark1. The Fund is a “fund of funds” that seeks to achieve its investment goal by investing in a combination of underlying funds, including funds that are actively managed by an affiliate of the investment adviser and unaffiliated ETFs, including passively managed funds that seek to track the performance of a benchmark index.
|
|
•
|
For the 12-month period ending March 31, 2025, both equity and fixed markets ended in positive territory, with equities pulling back in the first quarter of 2025.
|
|
•
|
The U.S. equity markets peaked after the U.S. presidential election prior to pulling back in the first quarter among uncertainty in trade and tariff discussions.
|
|
•
|
International equity performed well with the uncertainty in the U.S. market.
|
|
•
|
Fixed income had a strong start to 2025 and remained up for the 1-year period.
|
|
•
|
The Fund is positioned to be overweight US equity with a slight underweight to international equity and fixed income.
|
|
•
|
Top contributors from asset allocation came from an overweight to foreign large value, and an underweight to small growth. While detractors came from the overweight to small-cap value and mid-cap growth.
|
|
•
|
Top contributors within manager research was an outperformance from foreign large-cap growth and emerging market bonds. While detractions came from U.S. large-cap growth and foreign large-cap value.
|
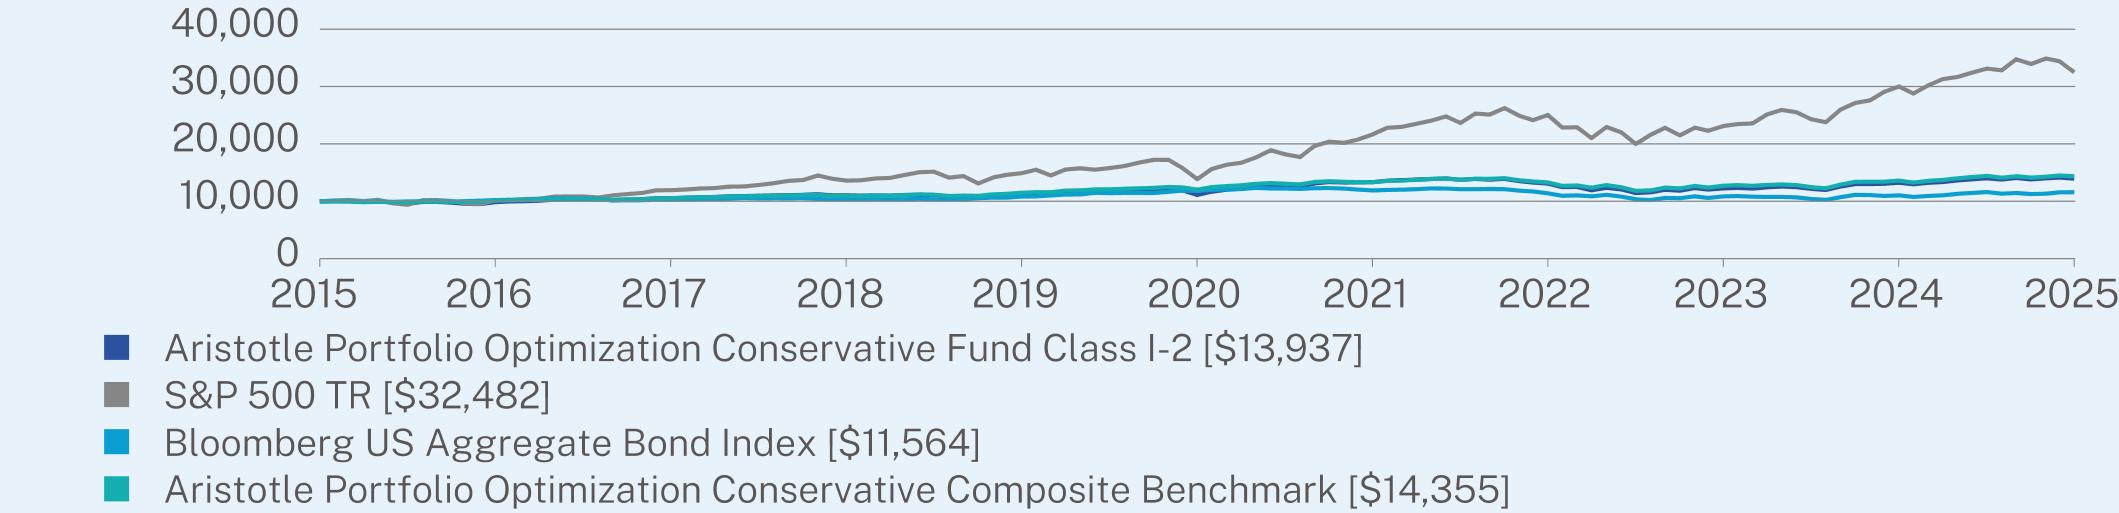
ANNUAL AVERAGE TOTAL RETURN (%)
|
|
1 Year
|
5 Year
|
10 Year
|
|
Class I-2 (without sales charge)
|
5.20
|
4.68
|
3.38
|
|
S&P 500 TR
|
8.25
|
18.59
|
12.50
|
|
Bloomberg US Aggregate Bond Index
|
4.88
|
-0.40
|
1.46
|
|
Aristotle Portfolio Optimization Conservative Composite Benchmark
|
5.55
|
3.61
|
3.68
|
Visit https://www.aristotlefunds.com/resources/prospectuses-reports for more recent performance information.
KEY FUND STATISTICS (as of March 31, 2025)
|
Net Assets
|
$127,994,789
|
|
Number of Holdings
|
15
|
|
Net Advisory Fee
|
$274,091
|
|
Portfolio Turnover Rate
|
53%
|
|
Top 10 Issuers
|
(%)
|
|
Aristotle Core Income Fund
|
40.0%
|
|
Aristotle Short Duration Income Fund
|
10.5%
|
|
Aristotle Core Bond Fund
|
8.1%
|
|
Aristotle High Yield Bond Fund
|
6.5%
|
|
Aristotle Core Equity Fund
|
6.2%
|
|
iShares Russell 1000 Value ETF
|
5.9%
|
|
Aristotle Growth Equity Fund
|
4.7%
|
|
iShares TIPS Bond ETF
|
3.6%
|
|
Aristotle Floating Rate Income Fund
|
3.5%
|
|
iShares MSCI EAFE Value ETF
|
3.5%
|

Changes to the Fund’s Principal Investment Strategy:
The Fund’s Principal Investment Strategies were revised to reflect that the Fund’s investment in unaffiliated exchange-traded funds may include passively managed funds that seek to track the performance of a benchmark index.
Changes to Fund’s Principal Risks:
In the Fund’s Principal Risks, the description of Asset Allocation Fund of Funds Risk and Conflicts of Interest Risk were revised and in the Principal Risks from Holdings In Underlying Funds, Leverage Risk, Convertible Securities Risk, Geographic Focus Risk, Growth Companies Risk, Inflation-Indexed Debt Securities Risk, REIT Investment Risk and Sector Focus Risk were added.
This report describes changes to the Fund that occurred during the reporting period.
WHAT WERE THE FUND COSTS FOR THE PAST YEAR? (based on a hypothetical $10,000 investment)
|
Class Name
|
Costs of a $10,000 investment
|
Costs paid as a percentage of a $10,000 investment
|
|
Class A
|
$72
|
0.70%
|
HOW DID THE FUND PERFORM LAST YEAR AND WHAT AFFECTED ITS PERFORMANCE?
|
•
|
For the 12-month period ended March 31, 2025, the Fund underperformed the Aristotle Portfolio Optimization Growth Composite Benchmark1. The Fund is a “fund of funds” that seeks to achieve its investment goal by investing in a combination of underlying funds, including funds that are actively managed by an affiliate of the investment adviser and unaffiliated ETFs, including passively managed funds that seek to track the performance of a benchmark index.
|
|
•
|
For the 12-month period ending March 31, 2025, both equity and fixed income markets ended in positive territory, with equities pulling back in the first quarter of 2025.
|
|
•
|
The U.S. equity markets peaked after the U.S. presidential election prior to pulling back in the first quarter among uncertainty in trade and tariff discussions.
|
|
•
|
International equity performed well with the uncertainty in the U.S. market.
|
|
•
|
Fixed income had a strong start to 2025 and remained up for the 1-year period.
|
|
•
|
The Fund is positioned to be overweight U.S. equity with a slight underweight to international equity and fixed income.
|
|
•
|
Top contributors from asset allocation came from an overweight to foreign large-cap value, and an underweight to short-term bond. While detractors came from the overweight to small-cap value and emerging market equity.
Top contributors within manager research was an outperformance from foreign large-cap growth and emerging market equity. While detractions came from U.S. large-cap growth and foreign large-cap value. |
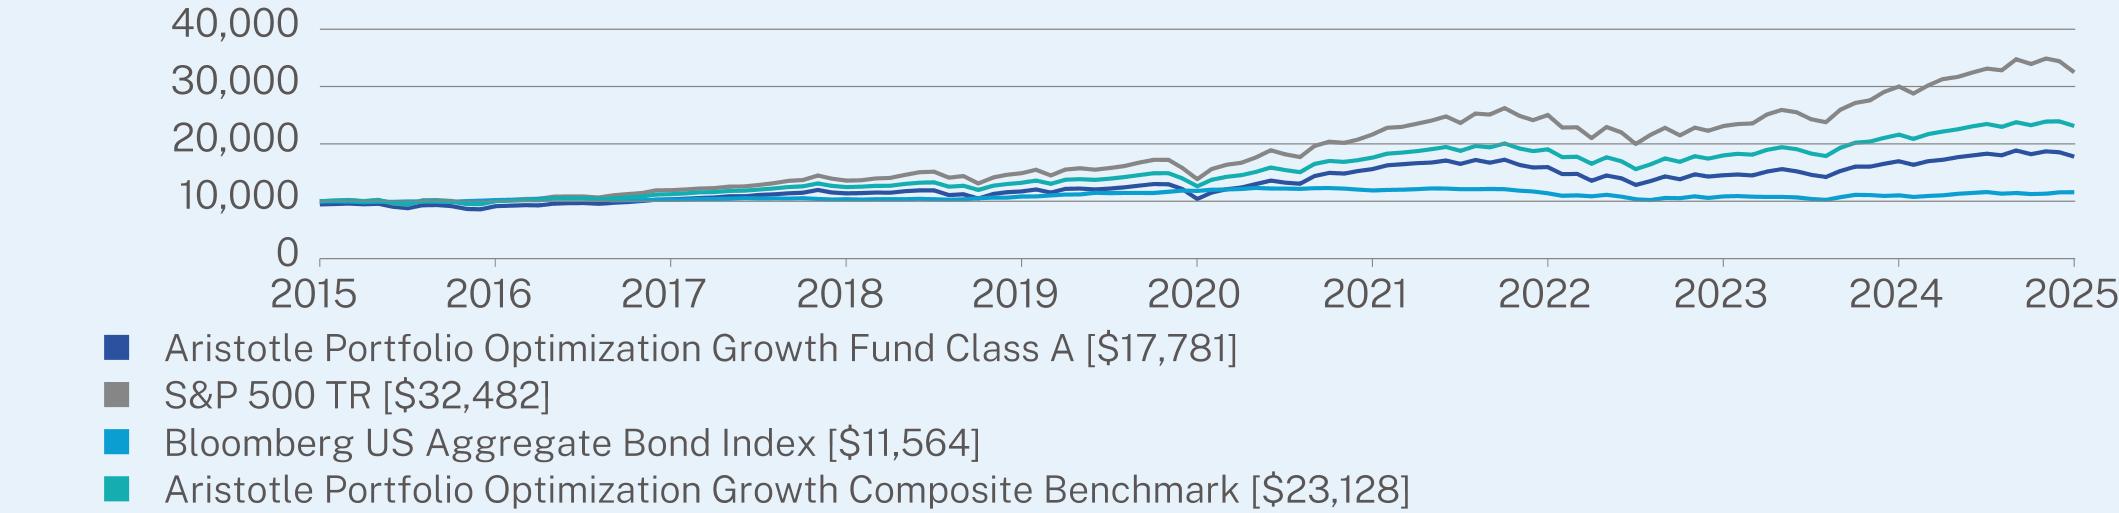
ANNUAL AVERAGE TOTAL RETURN (%)
|
|
1 Year
|
5 Year
|
10 Year
|
|
Class A (without sales charge)
|
4.74
|
11.34
|
6.52
|
|
Class A (with sales charge)
|
-0.98
|
10.09
|
5.92
|
|
S&P 500 TR
|
8.25
|
18.59
|
12.50
|
|
Bloomberg US Aggregate Bond Index
|
4.88
|
-0.40
|
1.46
|
|
Aristotle Portfolio Optimization Growth Composite Benchmark
|
6.99
|
12.90
|
8.75
|
Visit https://www.aristotlefunds.com/resources/prospectuses-reports for more recent performance information.
KEY FUND STATISTICS (as of March 31, 2025)
|
Net Assets
|
$600,093,310
|
|
Number of Holdings
|
18
|
|
Net Advisory Fee
|
$1,302,976
|
|
Portfolio Turnover Rate
|
65%
|
|
Top 10 Issuers
|
(%)
|
|
Aristotle Core Equity Fund
|
19.1%
|
|
iShares Russell 1000 Value ETF
|
15.7%
|
|
Aristotle Growth Equity Fund
|
14.6%
|
|
Aristotle International Equity Fund
|
9.9%
|
|
Aristotle Core Income Fund
|
9.6%
|
|
iShares Russell 2000 Value ETF
|
5.5%
|
|
iShares Russell Mid-Cap Growth ETF
|
4.5%
|
|
iShares Russell Mid-Cap Value ETF
|
4.1%
|
|
Aristotle High Yield Bond Fund
|
4.0%
|
|
iShares MSCI EAFE Value ETF
|
3.5%
|

Changes to the Fund’s Principal Investment Strategy:
The Fund’s Principal Investment Strategies were revised to reflect that the Fund’s investment in unaffiliated exchange-traded funds may include passively managed funds that seek to track the performance of a benchmark index.
Changes to Fund’s Principal Risks:
In the Fund’s Principal Risks, the description of Asset Allocation Fund of Funds Risk and Conflicts of Interest Risk were revised and in the Principal Risks from Holdings In Underlying Funds, Leverage Risk, Financial Sector Risk, Information Technology Sector Risk, REIT Investment Risk, Non-Diversification Risk, Floating Rate Loan Risk, Geographic Risk Related to Europe and Sector Focus Risk were added.
This report describes changes to the Fund that occurred during the reporting period.
WHAT WERE THE FUND COSTS FOR THE PAST YEAR? (based on a hypothetical $10,000 investment)
|
Class Name
|
Costs of a $10,000 investment
|
Costs paid as a percentage of a $10,000 investment
|
|
Class C
|
$148
|
1.45%
|
HOW DID THE FUND PERFORM LAST YEAR AND WHAT AFFECTED ITS PERFORMANCE?
|
•
|
For the 12-month period ended March 31, 2025, the Fund underperformed the Aristotle Portfolio Optimization Growth Composite Benchmark1. The Fund is a “fund of funds” that seeks to achieve its investment goal by investing in a combination of underlying funds, including funds that are actively managed by an affiliate of the investment adviser and unaffiliated ETFs, including passively managed funds that seek to track the performance of a benchmark index.
|
|
•
|
For the 12-month period ending March 31, 2025, both equity and fixed income markets ended in positive territory, with equities pulling back in the first quarter of 2025.
|
|
•
|
The U.S. equity markets peaked after the U.S. presidential election prior to pulling back in the first quarter among uncertainty in trade and tariff discussions.
|
|
•
|
International equity performed well with the uncertainty in the U.S. market.
|
|
•
|
Fixed income had a strong start to 2025 and remained up for the 1-year period.
|
|
•
|
The Fund is positioned to be overweight U.S. equity with a slight underweight to international equity and fixed income.
|
|
•
|
Top contributors from asset allocation came from an overweight to foreign large-cap value, and an underweight to short-term bond. While detractors came from the overweight to small-cap value and emerging market equity.
Top contributors within manager research was an outperformance from foreign large-cap growth and emerging market equity. While detractions came from U.S. large-cap growth and foreign large-cap value. |

ANNUAL AVERAGE TOTAL RETURN (%)
|
|
1 Year
|
5 Year
|
10 Year
|
|
Class C (without sales charge)
|
3.98
|
10.50
|
5.73
|
|
Class C (with sales charge)
|
2.98
|
10.50
|
5.73
|
|
S&P 500 TR
|
8.25
|
18.59
|
12.50
|
|
Bloomberg US Aggregate Bond Index
|
4.88
|
-0.40
|
1.46
|
|
Aristotle Portfolio Optimization Growth Composite Benchmark
|
6.99
|
12.90
|
8.75
|
Visit https://www.aristotlefunds.com/resources/prospectuses-reports for more recent performance information.
KEY FUND STATISTICS (as of March 31, 2025)
|
Net Assets
|
$600,093,310
|
|
Number of Holdings
|
18
|
|
Net Advisory Fee
|
$1,302,976
|
|
Portfolio Turnover Rate
|
65%
|
|
Top 10 Issuers
|
(%)
|
|
Aristotle Core Equity Fund
|
19.1%
|
|
iShares Russell 1000 Value ETF
|
15.7%
|
|
Aristotle Growth Equity Fund
|
14.6%
|
|
Aristotle International Equity Fund
|
9.9%
|
|
Aristotle Core Income Fund
|
9.6%
|
|
iShares Russell 2000 Value ETF
|
5.5%
|
|
iShares Russell Mid-Cap Growth ETF
|
4.5%
|
|
iShares Russell Mid-Cap Value ETF
|
4.1%
|
|
Aristotle High Yield Bond Fund
|
4.0%
|
|
iShares MSCI EAFE Value ETF
|
3.5%
|

Changes to the Fund’s Principal Investment Strategy:
The Fund’s Principal Investment Strategies were revised to reflect that the Fund’s investment in unaffiliated exchange-traded funds may include passively managed funds that seek to track the performance of a benchmark index.
Changes to Fund’s Principal Risks:
In the Fund’s Principal Risks, the description of Asset Allocation Fund of Funds Risk and Conflicts of Interest Risk were revised and in the Principal Risks from Holdings In Underlying Funds, Leverage Risk, Financial Sector Risk, Information Technology Sector Risk, REIT Investment Risk, Non-Diversification Risk, Floating Rate Loan Risk, Geographic Risk Related to Europe and Sector Focus Risk were added.
This report describes changes to the Fund that occurred during the reporting period.
WHAT WERE THE FUND COSTS FOR THE PAST YEAR? (based on a hypothetical $10,000 investment)
|
Class Name
|
Costs of a $10,000 investment
|
Costs paid as a percentage of a $10,000 investment
|
|
Class I-2
|
$46
|
0.45%
|
HOW DID THE FUND PERFORM LAST YEAR AND WHAT AFFECTED ITS PERFORMANCE?
|
•
|
For the 12-month period ended March 31, 2025, the Fund underperformed the Aristotle Portfolio Optimization Growth Composite Benchmark1. The Fund is a “fund of funds” that seeks to achieve its investment goal by investing in a combination of underlying funds, including funds that are actively managed by an affiliate of the investment adviser and unaffiliated ETFs, including passively managed funds that seek to track the performance of a benchmark index.
|
|
•
|
For the 12-month period ending March 31, 2025, both equity and fixed income markets ended in positive territory, with equities pulling back in the first quarter of 2025.
|
|
•
|
The U.S. equity markets peaked after the U.S. presidential election prior to pulling back in the first quarter among uncertainty in trade and tariff discussions.
|
|
•
|
International equity performed well with the uncertainty in the U.S. market.
|
|
•
|
Fixed income had a strong start to 2025 and remained up for the 1-year period.
|
|
•
|
The Fund is positioned to be overweight U.S. equity with a slight underweight to international equity and fixed income.
|
|
•
|
Top contributors from asset allocation came from an overweight to foreign large-cap value, and an underweight to short-term bond. While detractors came from the overweight to small-cap value and emerging market equity.
Top contributors within manager research was an outperformance from foreign large-cap growth and emerging market equity. While detractions came from U.S. large-cap growth and foreign large-cap value. |
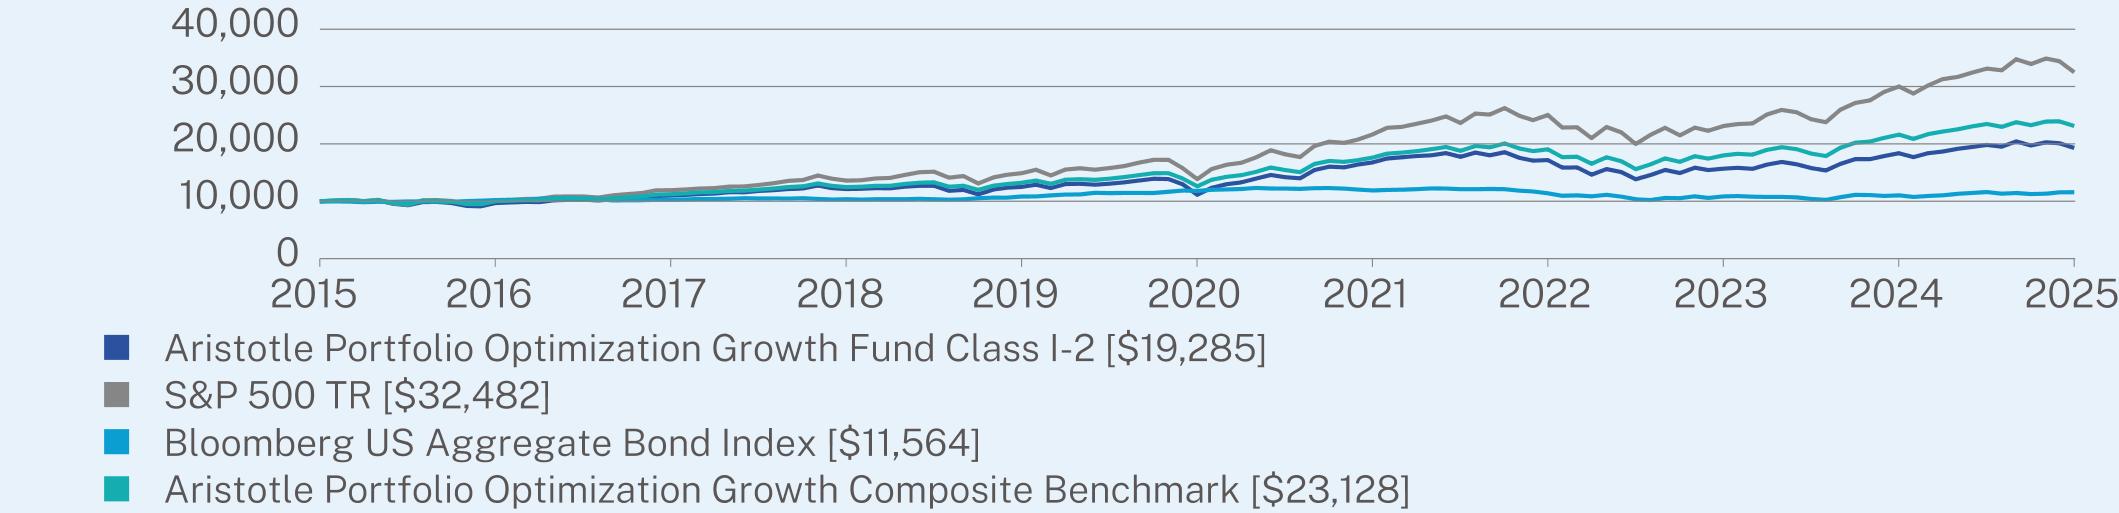
ANNUAL AVERAGE TOTAL RETURN (%)
|
|
1 Year
|
5 Year
|
10 Year
|
|
Class I-2 (without sales charge)
|
4.97
|
11.62
|
6.79
|
|
S&P 500 TR
|
8.25
|
18.59
|
12.50
|
|
Bloomberg US Aggregate Bond Index
|
4.88
|
-0.40
|
1.46
|
|
Aristotle Portfolio Optimization Growth Composite Benchmark
|
6.99
|
12.90
|
8.75
|
Visit https://www.aristotlefunds.com/resources/prospectuses-reports for more recent performance information.
KEY FUND STATISTICS (as of March 31, 2025)
|
Net Assets
|
$600,093,310
|
|
Number of Holdings
|
18
|
|
Net Advisory Fee
|
$1,302,976
|
|
Portfolio Turnover Rate
|
65%
|
|
Top 10 Issuers
|
(%)
|
|
Aristotle Core Equity Fund
|
19.1%
|
|
iShares Russell 1000 Value ETF
|
15.7%
|
|
Aristotle Growth Equity Fund
|
14.6%
|
|
Aristotle International Equity Fund
|
9.9%
|
|
Aristotle Core Income Fund
|
9.6%
|
|
iShares Russell 2000 Value ETF
|
5.5%
|
|
iShares Russell Mid-Cap Growth ETF
|
4.5%
|
|
iShares Russell Mid-Cap Value ETF
|
4.1%
|
|
Aristotle High Yield Bond Fund
|
4.0%
|
|
iShares MSCI EAFE Value ETF
|
3.5%
|

Changes to the Fund’s Principal Investment Strategy:
The Fund’s Principal Investment Strategies were revised to reflect that the Fund’s investment in unaffiliated exchange-traded funds may include passively managed funds that seek to track the performance of a benchmark index.
Changes to Fund’s Principal Risks:
In the Fund’s Principal Risks, the description of Asset Allocation Fund of Funds Risk and Conflicts of Interest Risk were revised and in the Principal Risks from Holdings In Underlying Funds, Leverage Risk, Financial Sector Risk, Information Technology Sector Risk, REIT Investment Risk, Non-Diversification Risk, Floating Rate Loan Risk, Geographic Risk Related to Europe and Sector Focus Risk were added.
This report describes changes to the Fund that occurred during the reporting period.
WHAT WERE THE FUND COSTS FOR THE PAST YEAR? (based on a hypothetical $10,000 investment)
|
Class Name
|
Costs of a $10,000 investment
|
Costs paid as a percentage of a $10,000 investment
|
|
Class A
|
$72
|
0.70%
|
HOW DID THE FUND PERFORM LAST YEAR AND WHAT AFFECTED ITS PERFORMANCE?
|
•
|
For the 12-month period ended March 31, 2025, the Fund underperformed the Aristotle Portfolio Optimization Moderate Conservative Composite Benchmark1. The Fund is a “fund of funds” that seeks to achieve its investment goal by investing in a combination of underlying funds, including funds that are actively managed by an affiliate of the investment adviser and unaffiliated ETFs, including passively managed funds that seek to track the performance of a benchmark index.
|
|
•
|
For the 12-month period ending March 31, 2025, both equity and fixed income markets ended in positive territory, with equities pulling back in the first quarter of 2025.
|
|
•
|
The U.S. equity markets peaked after the U.S. presidential election prior to pulling back in the first quarter among uncertainty in trade and tariff discussions.
|
|
•
|
International equity performed well with the uncertainty in the U.S. market.
|
|
•
|
Fixed income had a strong start to 2025 and remained up for the 1-year period.
|
|
•
|
The Fund is positioned to be overweight U.S. equity with a slight underweight to international equity and fixed income.
|
|
•
|
Top contributors from asset allocation came from an overweight to foreign large-cap value, and an underweight to small-cap growth. While detractors came from the overweight to small-cap value and mid-cap growth.
|
|
•
|
Top contributors within manager research was an outperformance from foreign large-cap growth and emerging market equity. While detractions came from U.S. large-cap growth and foreign large-cap value.
|
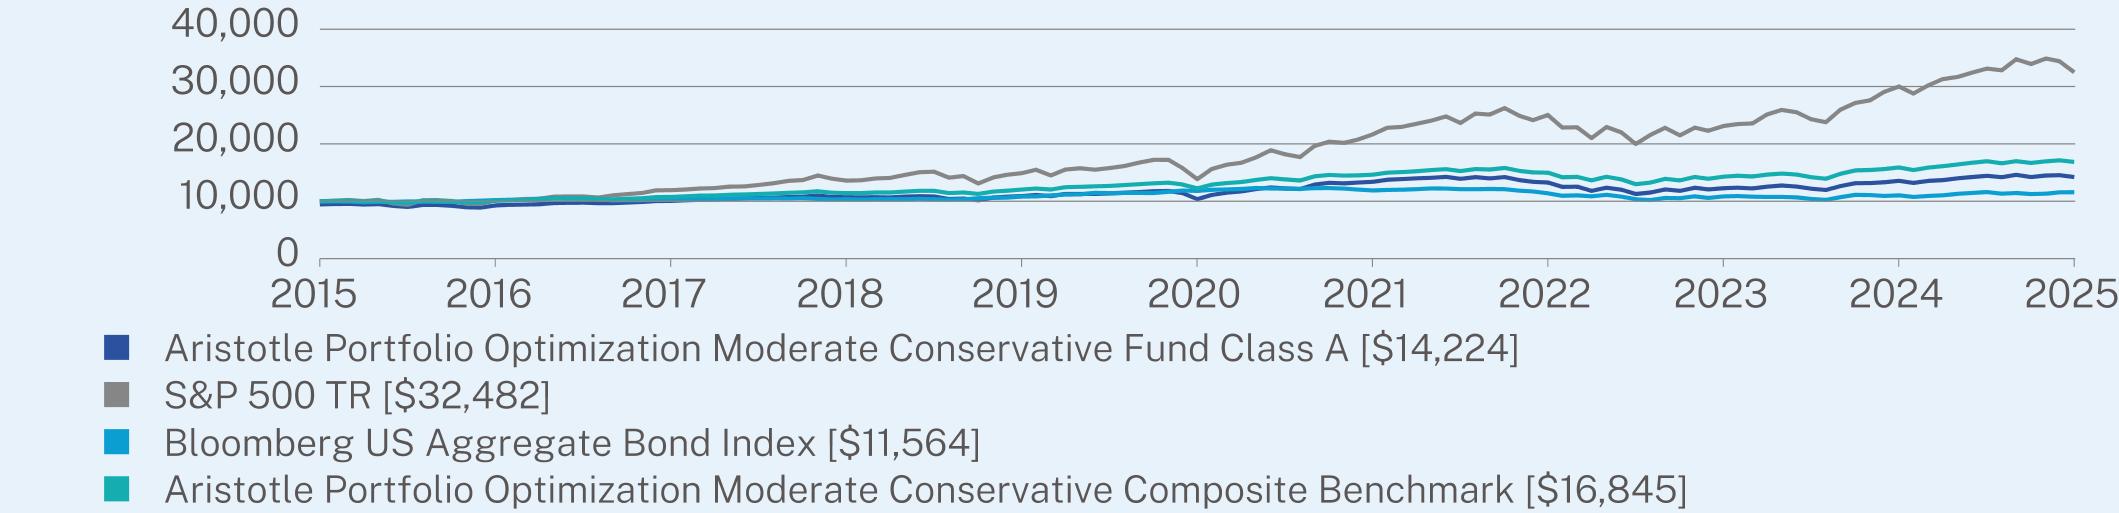
ANNUAL AVERAGE TOTAL RETURN (%)
|
|
1 Year
|
5 Year
|
10 Year
|
|
Class A (without sales charge)
|
4.89
|
6.53
|
4.17
|
|
Class A (with sales charge)
|
-0.85
|
5.33
|
3.59
|
|
S&P 500 TR
|
8.25
|
18.59
|
12.50
|
|
Bloomberg US Aggregate Bond Index
|
4.88
|
-0.40
|
1.46
|
|
Aristotle Portfolio Optimization Moderate Conservative Composite Benchmark
|
6.03
|
6.61
|
5.35
|
Visit https://www.aristotlefunds.com/resources/prospectuses-reports for more recent performance information.
KEY FUND STATISTICS (as of March 31, 2025)
|
Net Assets
|
$187,000,820
|
|
Number of Holdings
|
19
|
|
Net Advisory Fee
|
$407,511
|
|
Portfolio Turnover Rate
|
55%
|
|
Top 10 Issuers
|
(%)
|
|
Aristotle Core Income Fund
|
34.1%
|
|
iShares Russell 1000 Value ETF
|
9.5%
|
|
Aristotle Core Equity Fund
|
9.2%
|
|
Aristotle Growth Equity Fund
|
7.2%
|
|
Aristotle High Yield Bond Fund
|
7.0%
|
|
Aristotle Short Duration Income Fund
|
5.0%
|
|
Aristotle International Equity Fund
|
4.9%
|
|
iShares Russell Mid-Cap Growth ETF
|
4.0%
|
|
iShares MSCI EAFE Value ETF
|
3.5%
|
|
Aristotle Floating Rate Income Fund
|
3.0%
|

Changes to the Fund’s Principal Investment Strategy:
The Fund’s Principal Investment Strategies were revised to reflect that the Fund’s investment in unaffiliated exchange-traded funds may include passively managed funds that seek to track the performance of a benchmark index.
Changes to Fund’s Principal Risks:
In the Fund’s Principal Risks, the description of Asset Allocation Fund of Funds Risk and Conflicts of Interest Risk were revised and in the Principal Risks from Holdings In Underlying Funds, Leverage Risk, Convertible Securities Risk, Inflation-Indexed Debt Securities Risk, REIT Investment Risk, Warrants and Rights Risk and Sector Focus Risk were added.
This report describes changes to the Fund that occurred during the reporting period.
WHAT WERE THE FUND COSTS FOR THE PAST YEAR? (based on a hypothetical $10,000 investment)
|
Class Name
|
Costs of a $10,000 investment
|
Costs paid as a percentage of a $10,000 investment
|
|
Class C
|
$148
|
1.45%
|
HOW DID THE FUND PERFORM LAST YEAR AND WHAT AFFECTED ITS PERFORMANCE?
|
•
|
For the 12-month period ended March 31, 2025, the Fund underperformed the Aristotle Portfolio Optimization Moderate Conservative Composite Benchmark1. The Fund is a “fund of funds” that seeks to achieve its investment goal by investing in a combination of underlying funds, including funds that are actively managed by an affiliate of the investment adviser and unaffiliated ETFs, including passively managed funds that seek to track the performance of a benchmark index.
|
|
•
|
For the 12-month period ending March 31, 2025, both equity and fixed income markets ended in positive territory, with equities pulling back in the first quarter of 2025.
|
|
•
|
The U.S. equity markets peaked after the U.S. presidential election prior to pulling back in the first quarter among uncertainty in trade and tariff discussions.
|
|
•
|
International equity performed well with the uncertainty in the U.S. market.
|
|
•
|
Fixed income had a strong start to 2025 and remained up for the 1-year period.
|
|
•
|
The Fund is positioned to be overweight U.S. equity with a slight underweight to international equity and fixed income.
|
|
•
|
Top contributors from asset allocation came from an overweight to foreign large-cap value, and an underweight to small-cap growth. While detractors came from the overweight to small-cap value and mid-cap growth.
|
|
•
|
Top contributors within manager research was an outperformance from foreign large-cap growth and emerging market equity. While detractions came from U.S. large-cap growth and foreign large-cap value.
|
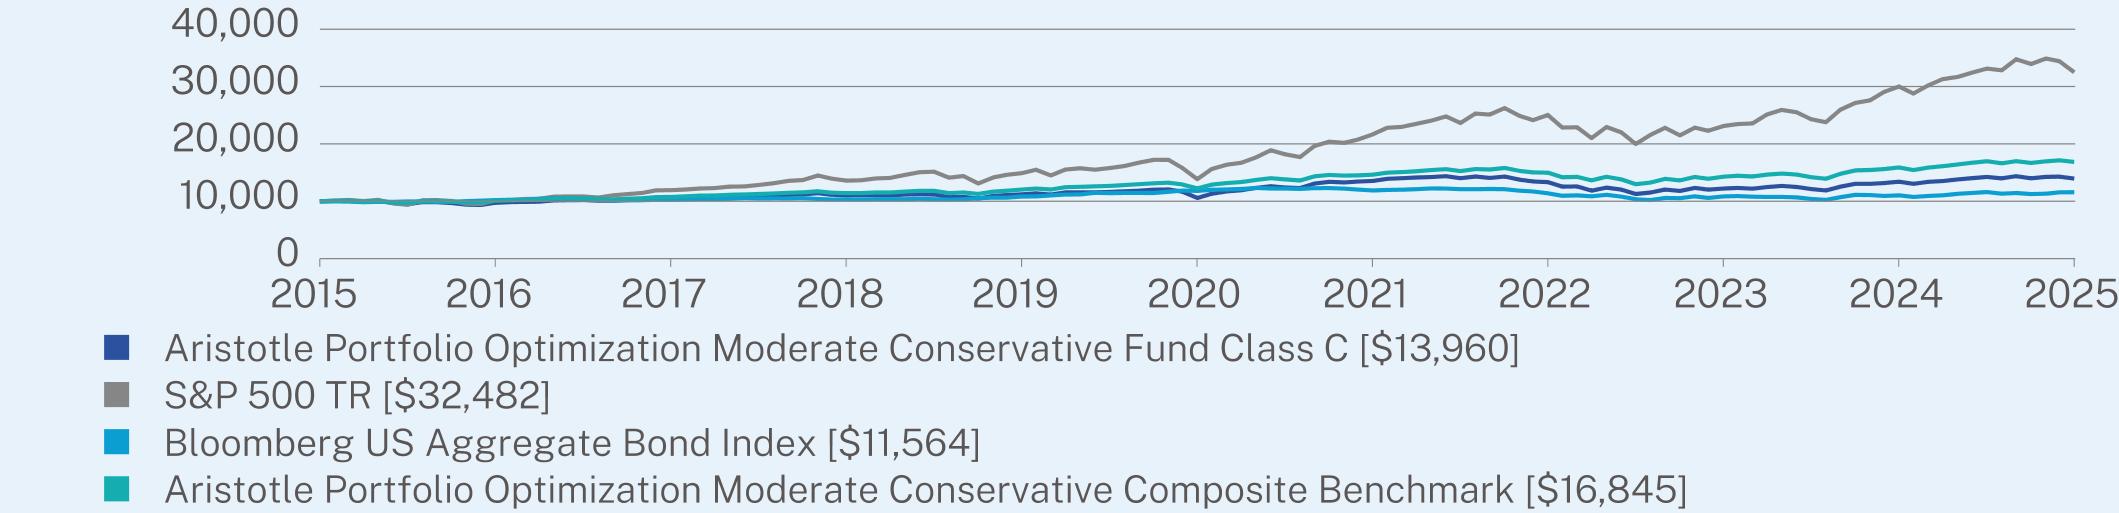
ANNUAL AVERAGE TOTAL RETURN (%)
|
|
1 Year
|
5 Year
|
10 Year
|
|
Class C (without sales charge)
|
4.12
|
5.72
|
3.39
|
|
Class C (with sales charge)
|
3.12
|
5.72
|
3.39
|
|
S&P 500 TR
|
8.25
|
18.59
|
12.50
|
|
Bloomberg US Aggregate Bond Index
|
4.88
|
-0.40
|
1.46
|
|
Aristotle Portfolio Optimization Moderate Conservative Composite Benchmark
|
6.03
|
6.61
|
5.35
|
Visit https://www.aristotlefunds.com/resources/prospectuses-reports for more recent performance information.
KEY FUND STATISTICS (as of March 31, 2025)
|
Net Assets
|
$187,000,820
|
|
Number of Holdings
|
19
|
|
Net Advisory Fee
|
$407,511
|
|
Portfolio Turnover Rate
|
55%
|
|
Top 10 Issuers
|
(%)
|
|
Aristotle Core Income Fund
|
34.1%
|
|
iShares Russell 1000 Value ETF
|
9.5%
|
|
Aristotle Core Equity Fund
|
9.2%
|
|
Aristotle Growth Equity Fund
|
7.2%
|
|
Aristotle High Yield Bond Fund
|
7.0%
|
|
Aristotle Short Duration Income Fund
|
5.0%
|
|
Aristotle International Equity Fund
|
4.9%
|
|
iShares Russell Mid-Cap Growth ETF
|
4.0%
|
|
iShares MSCI EAFE Value ETF
|
3.5%
|
|
Aristotle Floating Rate Income Fund
|
3.0%
|

Changes to the Fund’s Principal Investment Strategy:
The Fund’s Principal Investment Strategies were revised to reflect that the Fund’s investment in unaffiliated exchange-traded funds may include passively managed funds that seek to track the performance of a benchmark index.
Changes to Fund’s Principal Risks:
In the Fund’s Principal Risks, the description of Asset Allocation Fund of Funds Risk and Conflicts of Interest Risk were revised and in the Principal Risks from Holdings In Underlying Funds, Leverage Risk, Convertible Securities Risk, Inflation-Indexed Debt Securities Risk, REIT Investment Risk, Warrants and Rights Risk and Sector Focus Risk were added.
This report describes changes to the Fund that occurred during the reporting period.
WHAT WERE THE FUND COSTS FOR THE PAST YEAR? (based on a hypothetical $10,000 investment)
|
Class Name
|
Costs of a $10,000 investment
|
Costs paid as a percentage of a $10,000 investment
|
|
Class I-2
|
$46
|
0.45%
|
HOW DID THE FUND PERFORM LAST YEAR AND WHAT AFFECTED ITS PERFORMANCE?
|
•
|
For the 12-month period ended March 31, 2025, the Fund underperformed the Aristotle Portfolio Optimization Moderate Conservative Composite Benchmark1. The Fund is a “fund of funds” that seeks to achieve its investment goal by investing in a combination of underlying funds, including funds that are actively managed by an affiliate of the investment adviser and unaffiliated ETFs, including passively managed funds that seek to track the performance of a benchmark index.
|
|
•
|
For the 12-month period ending March 31, 2025, both equity and fixed income markets ended in positive territory, with equities pulling back in the first quarter of 2025.
|
|
•
|
The U.S. equity markets peaked after the U.S. presidential election prior to pulling back in the first quarter among uncertainty in trade and tariff discussions.
|
|
•
|
International equity performed well with the uncertainty in the U.S. market.
|
|
•
|
Fixed income had a strong start to 2025 and remained up for the 1-year period.
|
|
•
|
The Fund is positioned to be overweight U.S. equity with a slight underweight to international equity and fixed income.
|
|
•
|
Top contributors from asset allocation came from an overweight to foreign large-cap value, and an underweight to small-cap growth. While detractors came from the overweight to small-cap value and mid-cap growth.
|
|
•
|
Top contributors within manager research was an outperformance from foreign large-cap growth and emerging market equity. While detractions came from U.S. large-cap growth and foreign large-cap value.
|
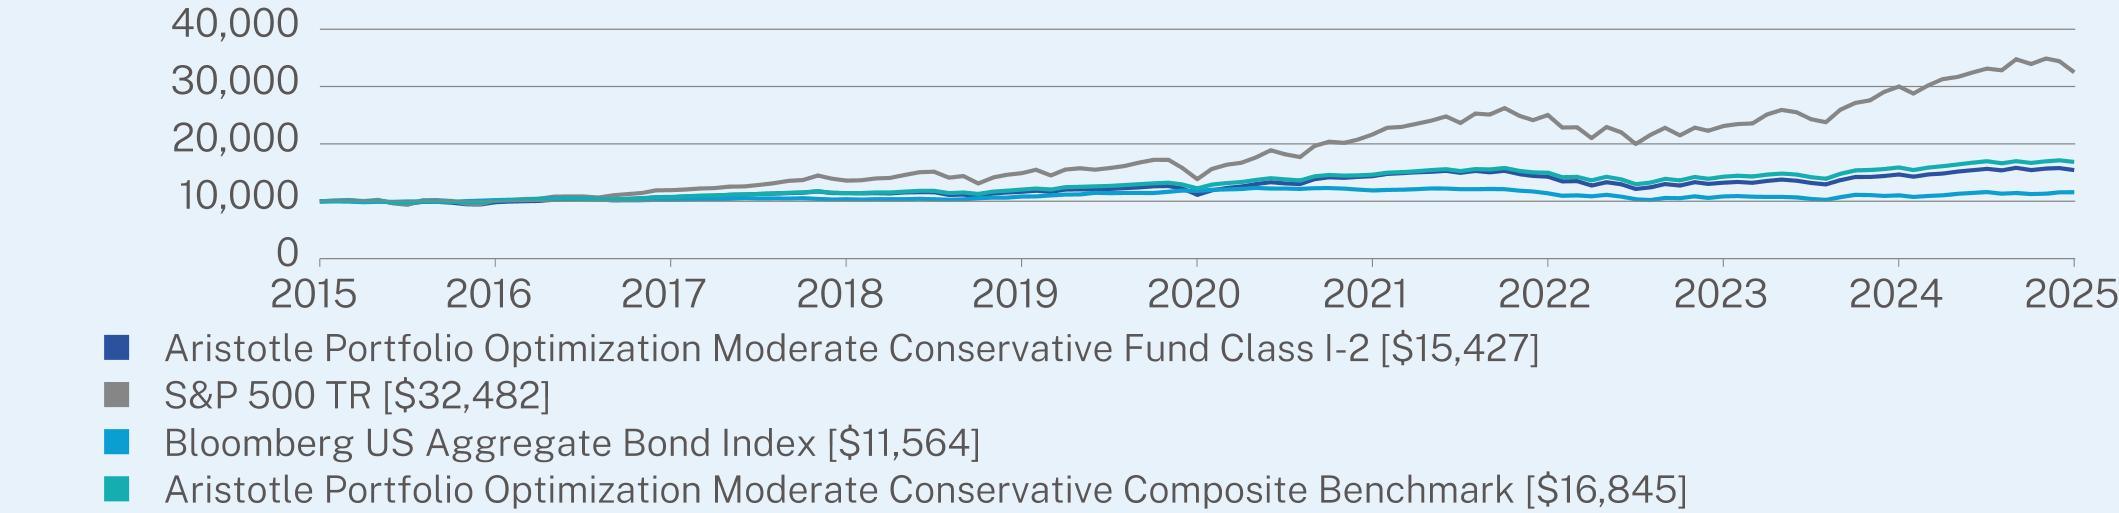
ANNUAL AVERAGE TOTAL RETURN (%)
|
|
1 Year
|
5 Year
|
10 Year
|
|
Class I-2 (without sales charge)
|
5.15
|
6.79
|
4.43
|
|
S&P 500 TR
|
8.25
|
18.59
|
12.50
|
|
Bloomberg US Aggregate Bond Index
|
4.88
|
-0.40
|
1.46
|
|
Aristotle Portfolio Optimization Moderate Conservative Composite Benchmark
|
6.03
|
6.61
|
5.35
|
Visit https://www.aristotlefunds.com/resources/prospectuses-reports for more recent performance information.
KEY FUND STATISTICS (as of March 31, 2025)
|
Net Assets
|
$187,000,820
|
|
Number of Holdings
|
19
|
|
Net Advisory Fee
|
$407,511
|
|
Portfolio Turnover Rate
|
55%
|
|
Top 10 Issuers
|
(%)
|
|
Aristotle Core Income Fund
|
34.1%
|
|
iShares Russell 1000 Value ETF
|
9.5%
|
|
Aristotle Core Equity Fund
|
9.2%
|
|
Aristotle Growth Equity Fund
|
7.2%
|
|
Aristotle High Yield Bond Fund
|
7.0%
|
|
Aristotle Short Duration Income Fund
|
5.0%
|
|
Aristotle International Equity Fund
|
4.9%
|
|
iShares Russell Mid-Cap Growth ETF
|
4.0%
|
|
iShares MSCI EAFE Value ETF
|
3.5%
|
|
Aristotle Floating Rate Income Fund
|
3.0%
|

Changes to the Fund’s Principal Investment Strategy:
The Fund’s Principal Investment Strategies were revised to reflect that the Fund’s investment in unaffiliated exchange-traded funds may include passively managed funds that seek to track the performance of a benchmark index.
Changes to Fund’s Principal Risks:
In the Fund’s Principal Risks, the description of Asset Allocation Fund of Funds Risk and Conflicts of Interest Risk were revised and in the Principal Risks from Holdings In Underlying Funds, Leverage Risk, Convertible Securities Risk, Inflation-Indexed Debt Securities Risk, REIT Investment Risk, Warrants and Rights Risk and Sector Focus Risk were added.
This report describes changes to the Fund that occurred during the reporting period.
WHAT WERE THE FUND COSTS FOR THE PAST YEAR? (based on a hypothetical $10,000 investment)
|
Class Name
|
Costs of a $10,000 investment
|
Costs paid as a percentage of a $10,000 investment
|
|
Class A
|
$72
|
0.70%
|
HOW DID THE FUND PERFORM LAST YEAR AND WHAT AFFECTED ITS PERFORMANCE?
|
•
|
For the 12-month period ended March 31, 2025, the Fund underperformed the Aristotle Portfolio Optimization Moderate Composite Benchmark1. The Fund is a “fund of funds” that seeks to achieve its investment goal by investing in a combination of underlying funds, including funds that are actively managed by an affiliate of the investment adviser and unaffiliated ETFs, including passively managed funds that seek to track the performance of a benchmark index.
|
|
•
|
For the 12-month period ending March 31, 2025, both equity and fixed income markets ended in positive territory, with equities pulling back in the first quarter of 2025.
|
|
•
|
The U.S. equity markets peaked after the U.S. presidential election prior to pulling back in the first quarter among uncertainty in trade and tariff discussions.
|
|
•
|
International equity performed well with the uncertainty in the U.S. market.
|
|
•
|
Fixed income had a strong start to 2025 and remained up for the 1-year period.
|
|
•
|
The Fund is positioned to be overweight U.S. equity with a slight underweight to international
|
|
•
|
Top contributors from asset allocation came from an overweight to foreign large-cap value, and an underweight to small-cap growth. While detractors came from the overweight to small-cap value and mid-cap growth.
|
|
•
|
Top contributors within manager research was an outperformance from foreign large-cap growth and mid-cap growth. While detractions came from U.S. large-cap growth and foreign large-cap value.
|
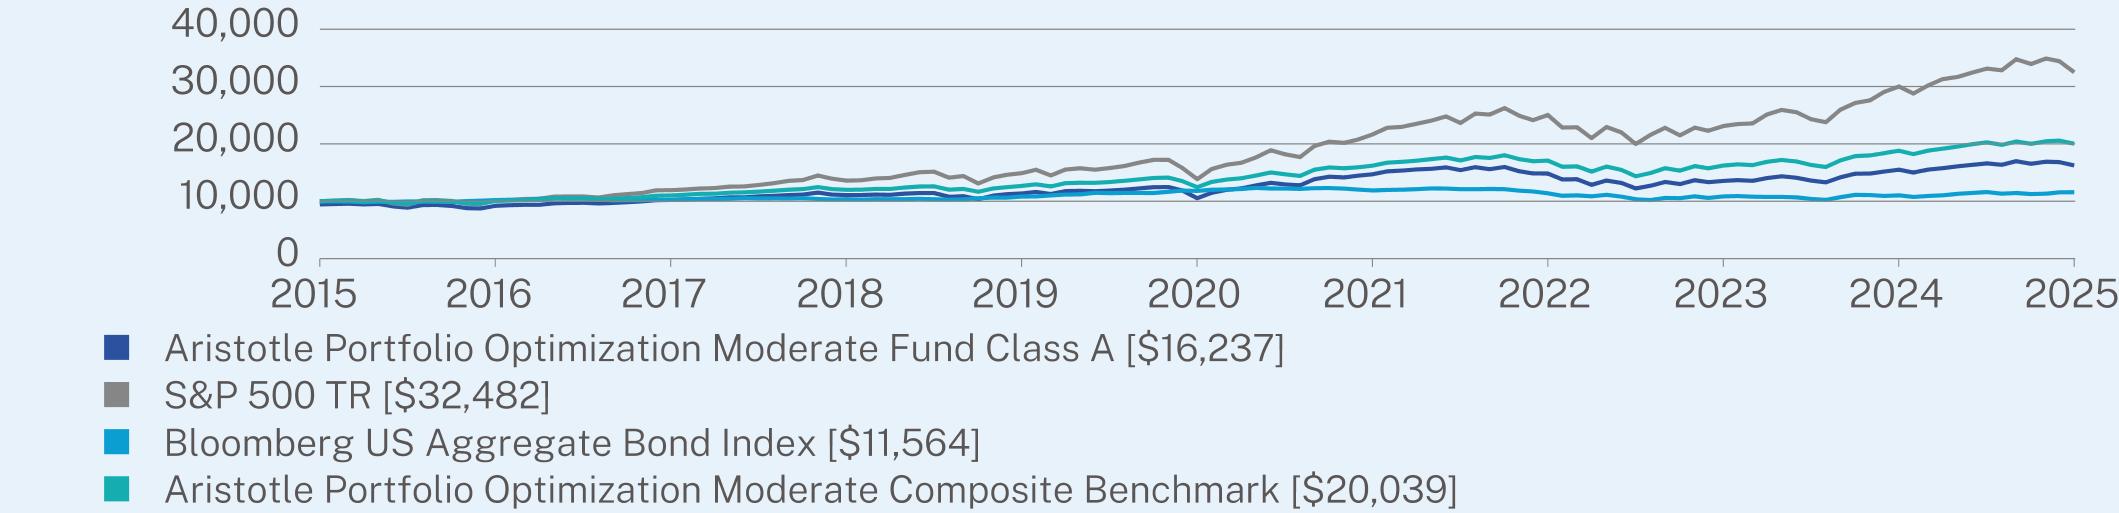
ANNUAL AVERAGE TOTAL RETURN (%)
|
|
1 Year
|
5 Year
|
10 Year
|
|
Class A (without sales charge)
|
4.71
|
9.05
|
5.56
|
|
Class A (with sales charge)
|
-1.04
|
7.82
|
4.97
|
|
S&P 500 TR
|
8.25
|
18.59
|
12.50
|
|
Bloomberg US Aggregate Bond Index
|
4.88
|
-0.40
|
1.46
|
|
Aristotle Portfolio Optimization Moderate Composite Benchmark
|
6.55
|
9.98
|
7.20
|
Visit https://www.aristotlefunds.com/resources/prospectuses-reports for more recent performance information.
KEY FUND STATISTICS (as of March 31, 2025)
|
Net Assets
|
$657,781,286
|
|
Number of Holdings
|
18
|
|
Net Advisory Fee
|
$1,442,304
|
|
Portfolio Turnover Rate
|
62%
|
|
Top 10 Issuers
|
(%)
|
|
Aristotle Core Income Fund
|
21.6%
|
|
Aristotle Core Equity Fund
|
15.5%
|
|
Aristotle Growth Equity Fund
|
12.4%
|
|
iShares Russell 1000 Value ETF
|
11.9%
|
|
Aristotle International Equity Fund
|
6.9%
|
|
Aristotle High Yield Bond Fund
|
5.5%
|
|
iShares Russell Mid-Cap Growth ETF
|
5.5%
|
|
Aristotle Short Duration Income Fund
|
5.0%
|
|
iShares Russell 2000 Value ETF
|
3.0%
|
|
Aristotle Floating Rate Income Fund
|
2.5%
|

Changes to the Fund’s Principal Investment Strategy:
The Fund’s Principal Investment Strategies were revised to reflect that the Fund’s investment in unaffiliated exchange-traded funds may include passively managed funds that seek to track the performance of a benchmark index.
Changes to Fund’s Principal Risks:
In the Fund’s Principal Risks, the description of Asset Allocation Fund of Funds Risk and Conflicts of Interest Risk were revised and in the Principal Risks from Holdings in Underlying Funds, Leverage Risk, Convertible Securities Risk and Financial Sector Risk were removed, and Information Technology Sector Risk REIT Investment Risk, Non-Diversification Risk and Sector Focus Risk were added.
This report describes changes to the Fund that occurred during the reporting period.
WHAT WERE THE FUND COSTS FOR THE PAST YEAR? (based on a hypothetical $10,000 investment)
|
Class Name
|
Costs of a $10,000 investment
|
Costs paid as a percentage of a $10,000 investment
|
|
Class C
|
$148
|
1.45%
|
HOW DID THE FUND PERFORM LAST YEAR AND WHAT AFFECTED ITS PERFORMANCE?
|
•
|
For the 12-month period ended March 31, 2025, the Fund underperformed the Aristotle Portfolio Optimization Moderate Composite Benchmark1. The Fund is a “fund of funds” that seeks to achieve its investment goal by investing in a combination of underlying funds, including funds that are actively managed by an affiliate of the investment adviser and unaffiliated ETFs, including passively managed funds that seek to track the performance of a benchmark index.
|
|
•
|
For the 12-month period ending March 31, 2025, both equity and fixed income markets ended in positive territory, with equities pulling back in the first quarter of 2025.
|
|
•
|
The U.S. equity markets peaked after the U.S. presidential election prior to pulling back in the first quarter among uncertainty in trade and tariff discussions.
|
|
•
|
International equity performed well with the uncertainty in the U.S. market.
|
|
•
|
Fixed income had a strong start to 2025 and remained up for the 1-year period.
|
|
•
|
The Fund is positioned to be overweight U.S. equity with a slight underweight to international
|
|
•
|
Top contributors from asset allocation came from an overweight to foreign large-cap value, and an underweight to small-cap growth. While detractors came from the overweight to small-cap value and mid-cap growth.
|
|
•
|
Top contributors within manager research was an outperformance from foreign large-cap growth and mid-cap growth. While detractions came from U.S. large-cap growth and foreign large-cap value.
|

ANNUAL AVERAGE TOTAL RETURN (%)
|
|
1 Year
|
5 Year
|
10 Year
|
|
Class C (without sales charge)
|
3.93
|
8.25
|
4.78
|
|
Class C (with sales charge)
|
2.93
|
8.25
|
4.78
|
|
S&P 500 TR
|
8.25
|
18.59
|
12.50
|
|
Bloomberg US Aggregate Bond Index
|
4.88
|
-0.40
|
1.46
|
|
Aristotle Portfolio Optimization Moderate Composite Benchmark
|
6.55
|
9.98
|
7.20
|
Visit https://www.aristotlefunds.com/resources/prospectuses-reports for more recent performance information.
KEY FUND STATISTICS (as of March 31, 2025)
|
Net Assets
|
$657,781,286
|
|
Number of Holdings
|
18
|
|
Net Advisory Fee
|
$1,442,304
|
|
Portfolio Turnover Rate
|
62%
|
|
Top 10 Issuers
|
(%)
|
|
Aristotle Core Income Fund
|
21.6%
|
|
Aristotle Core Equity Fund
|
15.5%
|
|
Aristotle Growth Equity Fund
|
12.4%
|
|
iShares Russell 1000 Value ETF
|
11.9%
|
|
Aristotle International Equity Fund
|
6.9%
|
|
Aristotle High Yield Bond Fund
|
5.5%
|
|
iShares Russell Mid-Cap Growth ETF
|
5.5%
|
|
Aristotle Short Duration Income Fund
|
5.0%
|
|
iShares Russell 2000 Value ETF
|
3.0%
|
|
Aristotle Floating Rate Income Fund
|
2.5%
|
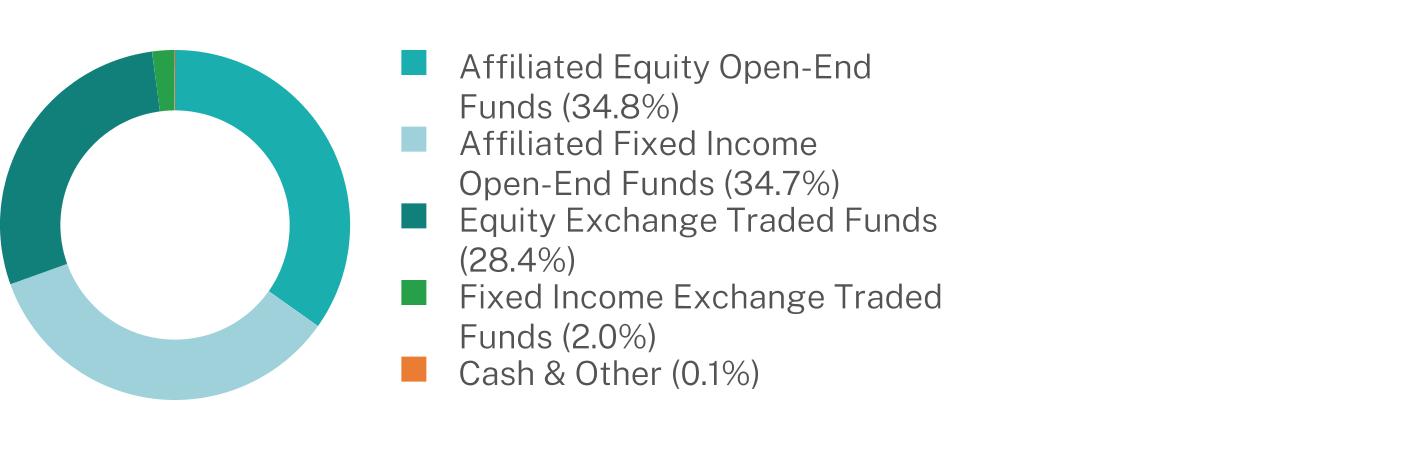
Changes to the Fund’s Principal Investment Strategy:
The Fund’s Principal Investment Strategies were revised to reflect that the Fund’s investment in unaffiliated exchange-traded funds may include passively managed funds that seek to track the performance of a benchmark index.
Changes to Fund’s Principal Risks:
In the Fund’s Principal Risks, the description of Asset Allocation Fund of Funds Risk and Conflicts of Interest Risk were revised and in the Principal Risks from Holdings in Underlying Funds, Leverage Risk, Convertible Securities Risk and Financial Sector Risk were removed, and Information Technology Sector Risk REIT Investment Risk, Non-Diversification Risk and Sector Focus Risk were added.
This report describes changes to the Fund that occurred during the reporting period.
WHAT WERE THE FUND COSTS FOR THE PAST YEAR? (based on a hypothetical $10,000 investment)
|
Class Name
|
Costs of a $10,000 investment
|
Costs paid as a percentage of a $10,000 investment
|
|
Class I-2
|
$46
|
0.45%
|
HOW DID THE FUND PERFORM LAST YEAR AND WHAT AFFECTED ITS PERFORMANCE?
|
•
|
For the 12-month period ended March 31, 2025, the Fund underperformed the Aristotle Portfolio Optimization Moderate Composite Benchmark1. The Fund is a “fund of funds” that seeks to achieve its investment goal by investing in a combination of underlying funds, including funds that are actively managed by an affiliate of the investment adviser and unaffiliated ETFs, including passively managed funds that seek to track the performance of a benchmark index.
|
|
•
|
For the 12-month period ending March 31, 2025, both equity and fixed income markets ended in positive territory, with equities pulling back in the first quarter of 2025.
|
|
•
|
The U.S. equity markets peaked after the U.S. presidential election prior to pulling back in the first quarter among uncertainty in trade and tariff discussions.
|
|
•
|
International equity performed well with the uncertainty in the U.S. market.
|
|
•
|
Fixed income had a strong start to 2025 and remained up for the 1-year period.
|
|
•
|
The Fund is positioned to be overweight U.S. equity with a slight underweight to international
|
|
•
|
Top contributors from asset allocation came from an overweight to foreign large-cap value, and an underweight to small-cap growth. While detractors came from the overweight to small-cap value and mid-cap growth.
|
|
•
|
Top contributors within manager research was an outperformance from foreign large-cap growth and mid-cap growth. While detractions came from U.S. large-cap growth and foreign large-cap value.
|
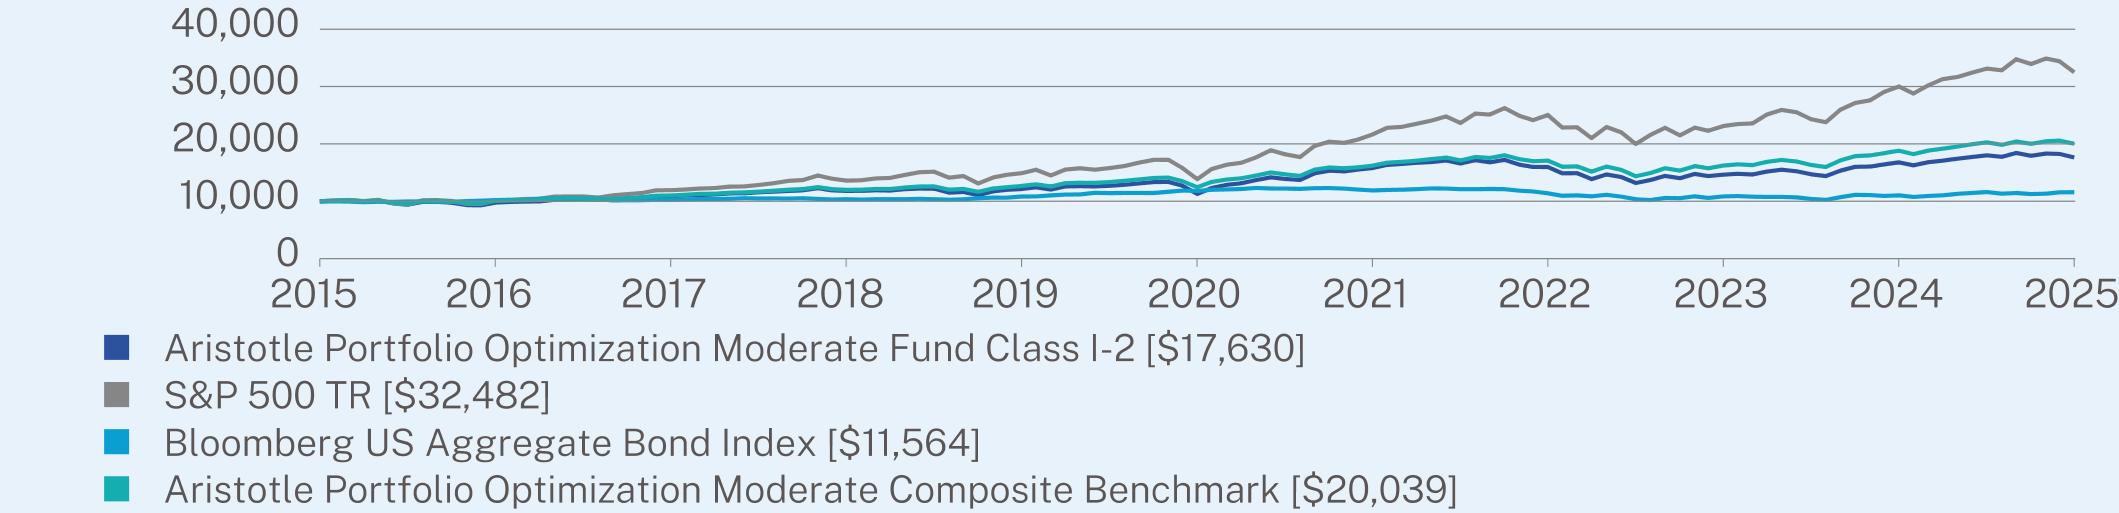
ANNUAL AVERAGE TOTAL RETURN (%)
|
|
1 Year
|
5 Year
|
10 Year
|
|
Class I-2 (without sales charge)
|
5.07
|
9.35
|
5.83
|
|
S&P 500 TR
|
8.25
|
18.59
|
12.50
|
|
Bloomberg US Aggregate Bond Index
|
4.88
|
-0.40
|
1.46
|
|
Aristotle Portfolio Optimization Moderate Composite Benchmark
|
6.55
|
9.98
|
7.20
|
Visit https://www.aristotlefunds.com/resources/prospectuses-reports for more recent performance information.
KEY FUND STATISTICS (as of March 31, 2025)
|
Net Assets
|
$657,781,286
|
|
Number of Holdings
|
18
|
|
Net Advisory Fee
|
$1,442,304
|
|
Portfolio Turnover Rate
|
62%
|
|
Top 10 Issuers
|
(%)
|
|
Aristotle Core Income Fund
|
21.6%
|
|
Aristotle Core Equity Fund
|
15.5%
|
|
Aristotle Growth Equity Fund
|
12.4%
|
|
iShares Russell 1000 Value ETF
|
11.9%
|
|
Aristotle International Equity Fund
|
6.9%
|
|
Aristotle High Yield Bond Fund
|
5.5%
|
|
iShares Russell Mid-Cap Growth ETF
|
5.5%
|
|
Aristotle Short Duration Income Fund
|
5.0%
|
|
iShares Russell 2000 Value ETF
|
3.0%
|
|
Aristotle Floating Rate Income Fund
|
2.5%
|

Changes to the Fund’s Principal Investment Strategy:
The Fund’s Principal Investment Strategies were revised to reflect that the Fund’s investment in unaffiliated exchange-traded funds may include passively managed funds that seek to track the performance of a benchmark index.
Changes to Fund’s Principal Risks:
In the Fund’s Principal Risks, the description of Asset Allocation Fund of Funds Risk and Conflicts of Interest Risk were revised and in the Principal Risks from Holdings in Underlying Funds, Leverage Risk, Convertible Securities Risk and Financial Sector Risk were removed, and Information Technology Sector Risk REIT Investment Risk, Non-Diversification Risk and Sector Focus Risk were added.
| [1] |
|
||
| [2] |
|
||
| [3] |
|
||
| [4] |
|
||
| [5] |
|
||
| [6] |
|
||
| [7] |
|
||
| [8] |
|
||
| [9] |
|
||
| [10] |
|
||
| [11] |
|
||
| [12] |
|
||
| [13] |
|
||
| [14] |
|
||
| [15] |
|