Shareholder Report
|
12 Months Ended |
|
Mar. 31, 2025
USD ($)
Holding
|
|---|
| Shareholder Report [Line Items] |
|
| Document Type |
N-CSR
|
| Amendment Flag |
false
|
| Registrant Name |
Columbia ETF Trust II
|
| Entity Central Index Key |
0001450501
|
| Entity Investment Company Type |
N-1A
|
| Document Period End Date |
Mar. 31, 2025
|
| C000159357 |
|
| Shareholder Report [Line Items] |
|
| Fund Name |
Columbia EM Core ex-China ETF
|
| Trading Symbol |
XCEM
|
| Security Exchange Name |
NYSEArca
|
| Annual or Semi-Annual Statement [Text Block] |
This annual shareholder report contains important information about Columbia EM Core ex-China ETF (the Fund) for the period of April 1, 2024 to March 31, 2025.
|
| Shareholder Report Annual or Semi-Annual |
Annual Shareholder Report
|
| Additional Information [Text Block] |
You can find additional information about the Fund at columbiathreadneedleus.com/resources/literature. You can also request this information by contacting us at 1-800-426-3750.
|
| Additional Information Phone Number |
1-800-426-3750
|
| Additional Information Website |
columbiathreadneedleus.com/resources/literature
|
| Expenses [Text Block] |
What were the Fund costs for the reporting period?(Based on a hypothetical $10,000 investment) Fund | Cost of a $10,000 investment | Cost paid as a percentage of a $10,000 investment |
|---|
Columbia EM Core ex-China ETF | $16 | 0.16% |
|---|
|
| Expenses Paid, Amount |
$ 16
|
| Expense Ratio, Percent |
0.16%
|
| Factors Affecting Performance [Text Block] |
Management's Discussion of Fund PerformanceThe performance of the Fund for the period presented is shown in the Average Annual Total Returns table. Top Performance ContributorsStock selection | Selections in the semiconductors, banks and aerospace & defense sub-sectors, and from a country perspective South Africa and Taiwan, boosted the Fund’s results most during the annual period. Allocations | Larger allocations to banks, electric utilities and aerospace and defense and smaller allocations to broadline retail buoyed Fund results during the annual period. Individual holdings | Positions in Taiwan-based semiconductor company Taiwan Semiconductor Manufacturing Co., Ltd.; India-based bank and financial services companies ICICI Bank Ltd. and HDFC Bank Ltd.; multinational internet, technology and multimedia holding company Naspers Ltd.; and Saudi Arabian Al Rahji Bank, were among the top contributors to Fund performance. Top Performance DetractorsStock selection | Selections in the information technology, communication services and chemicals, and from a country perspective South Korea, Mexico and Indonesia, hurt the Fund’s results during the annual period. Allocations | Large weightings in technology hardware storage & peripherals and oil, gas and consumable fuels and small allocations to electrical equipment and automobiles detracted. Individual holdings | Fund positions in Samsung Electronics Co. Ltd., a South Korea-based consumer electronics company; Reliance Industries, Ltd., an India-based multinational conglomerate; South Korea-based plasma display manufacturer Samsung SDI Co. Ltd.; Taiwan-based plastic products and chemical fiber manufacturer Nan Ya Plastics Corp.; and Indonesia-based Bank PT Bank Mandiri Persero Tbk, were top detractors during the period. |
| Performance Past Does Not Indicate Future [Text] |
The Fund's past performance is not a good predictor of the Fund's future performance.
|
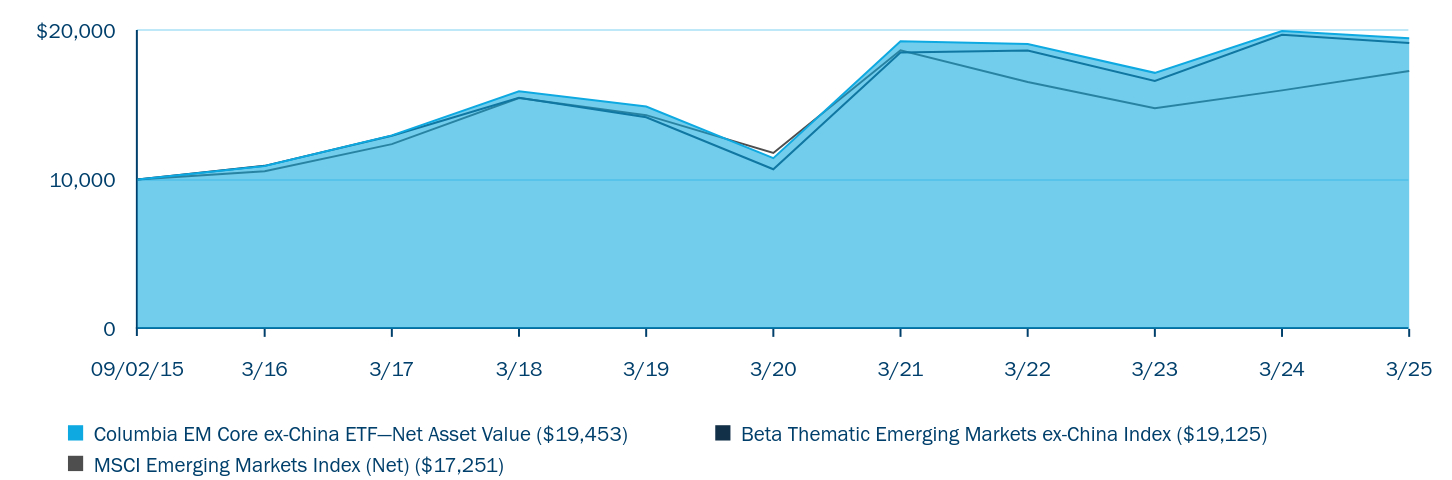
| Line Graph [Table Text Block] |
| Columbia EM Core ex-China ETF—Net Asset Value
(19,453) | Beta Thematic Emerging Markets ex-China Index (19,125) | MSCI Emerging Markets Index (Net) (17,251) |
|---|
09/02/15 | 10,000 | 10,000 | 10,000 |
|---|
3/16 | 10,898 | 10,908 | 10,547 |
|---|
3/17 | 12,949 | 12,921 | 12,363 |
|---|
3/18 | 15,896 | 15,462 | 15,445 |
|---|
3/19 | 14,881 | 14,157 | 14,301 |
|---|
3/20 | 11,422 | 10,681 | 11,772 |
|---|
3/21 | 19,253 | 18,494 | 18,645 |
|---|
3/22 | 19,068 | 18,625 | 16,526 |
|---|
3/23 | 17,133 | 16,594 | 14,757 |
|---|
3/24 | 19,929 | 19,683 | 15,960 |
|---|
3/25 | 19,453 | 19,125 | 17,251 |
|---|
|
| Average Annual Return [Table Text Block] |
Average Annual Total Return (%) | 1 year | 5 years | Since Fund Inception |
|---|
Columbia EM Core ex-China ETF—Net Asset ValueFootnote Reference(a) | -2.39 | 11.24 | 7.19 |
|---|
Beta Thematic Emerging Markets ex-China Index | -2.84 | 12.36 | 7.00 |
|---|
MSCI Emerging Markets Index (Net) | 8.09 | 7.94 | 5.85 |
|---|
| Footnote | Description | Footnote(a) | Columbia Management has been the Fund’s investment manager since September 1, 2016. Performance prior to September 1, 2016 is attributable to the Fund’s previous investment manager. |
|
| No Deduction of Taxes [Text Block] |
Performance does not reflect the deduction of taxes that a shareholder may pay on fund distributions or on the redemptions of fund shares.
|
| Updated Performance Information Location [Text Block] |
Visit columbiathreadneedleus.com/investment-products/exchange-traded-funds/ for the most recent performance information.
|
| AssetsNet |
$ 1,051,073,928
|
| Holdings Count | Holding |
332
|
| Advisory Fees Paid, Amount |
$ 1,809,027
|
| InvestmentCompanyPortfolioTurnover |
20.00%
|
| Additional Fund Statistics [Text Block] |
Fund net assets | $1,051,073,928 |
|---|
Total number of portfolio holdings | 332 |
|---|
Investment management fees
(represents 0.16% of Fund average net assets) | $1,809,027 |
|---|
Portfolio turnover for the reporting period | 20% |
|---|
|
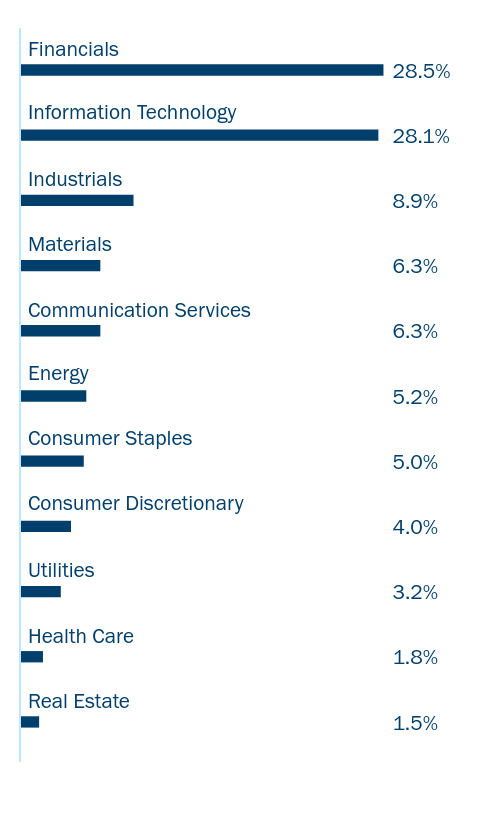
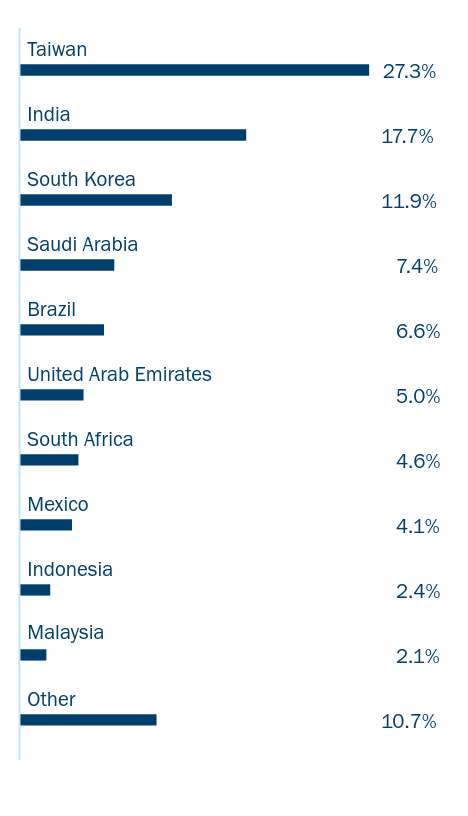
| Holdings [Text Block] |
Graphical Representation of Fund Holdings The tables below show the investment makeup of the Fund represented as a percentage of the Fund net assets. Derivatives are excluded from the tables unless otherwise noted. The Fund’s portfolio composition is subject to change. Taiwan Semiconductor Manufacturing Co. Ltd. (Taiwan) | 12.1% |
|---|
Samsung Electronics Co. Ltd. (South Korea) | 3.9% |
|---|
HDFC Bank Ltd. (India) | 2.2% |
|---|
ICICI Bank Ltd. (India) | 2.2% |
|---|
Infosys Ltd. (India) | 1.6% |
|---|
International Holding Co. PJSC (United Arab Emirates) | 1.5% |
|---|
Al Rajhi Bank (Saudi Arabia) | 1.4% |
|---|
Reliance Industries, Ltd. (India) | 1.4% |
|---|
SK Hynix, Inc. (South Korea) | 1.3% |
|---|
MediaTek, Inc. (Taiwan) | 1.3% |
|---|
Value | Value |
|---|
Real Estate | 1.5% | Health Care | 1.8% | Utilities | 3.2% | Consumer Discretionary | 4.0% | Consumer Staples | 5.0% | Energy | 5.2% | Communication Services | 6.3% | Materials | 6.3% | Industrials | 8.9% | Information Technology | 28.1% | Financials | 28.5% |
Value | Value |
|---|
Other | 10.7% | Malaysia | 2.1% | Indonesia | 2.4% | Mexico | 4.1% | South Africa | 4.6% | United Arab Emirates | 5.0% | Brazil | 6.6% | Saudi Arabia | 7.4% | South Korea | 11.9% | India | 17.7% | Taiwan | 27.3% |
|
| Largest Holdings [Text Block] |
Taiwan Semiconductor Manufacturing Co. Ltd. (Taiwan) | 12.1% |
|---|
Samsung Electronics Co. Ltd. (South Korea) | 3.9% |
|---|
HDFC Bank Ltd. (India) | 2.2% |
|---|
ICICI Bank Ltd. (India) | 2.2% |
|---|
Infosys Ltd. (India) | 1.6% |
|---|
International Holding Co. PJSC (United Arab Emirates) | 1.5% |
|---|
Al Rajhi Bank (Saudi Arabia) | 1.4% |
|---|
Reliance Industries, Ltd. (India) | 1.4% |
|---|
SK Hynix, Inc. (South Korea) | 1.3% |
|---|
MediaTek, Inc. (Taiwan) | 1.3% |
|---|
|
| Material Fund Change [Text Block] |
|
| C000101379 |
|
| Shareholder Report [Line Items] |
|
| Fund Name |
Columbia India Consumer ETF
|
| Trading Symbol |
INCO
|
| Security Exchange Name |
NYSEArca
|
| Annual or Semi-Annual Statement [Text Block] |
This annual shareholder report contains important information about Columbia India Consumer ETF (the Fund) for the period of April 1, 2024 to March 31, 2025.
|
| Shareholder Report Annual or Semi-Annual |
Annual Shareholder Report
|
| Additional Information [Text Block] |
You can find additional information about the Fund at columbiathreadneedleus.com/resources/literature. You can also request this information by contacting us at 1-800-426-3750.
|
| Material Fund Change Notice [Text Block] |
This report describes changes to the Fund that occurred during the reporting period.
|
| Additional Information Phone Number |
1-800-426-3750
|
| Additional Information Website |
columbiathreadneedleus.com/resources/literature
|
| Expenses [Text Block] |
What were the Fund costs for the reporting period?(Based on a hypothetical $10,000 investment) Fund | Cost of a $10,000 investment | Cost paid as a percentage of a $10,000 investment |
|---|
Columbia India Consumer ETF | $74 | 0.75% |
|---|
|
| Expenses Paid, Amount |
$ 74
|
| Expense Ratio, Percent |
0.75%
|
| Factors Affecting Performance [Text Block] |
Management's Discussion of Fund PerformanceThe performance of the Fund for the period presented is shown in the Average Annual Total Returns table. Top Performance ContributorsStock selection | Selections in the specialty retail, hotels, restaurants & leisure sub-sectors boosted the Fund’s results most during the annual period. Allocations | Larger allocations to specialty retail, hotels, restaurants & leisure and smaller allocations to oil, gas and consumable fuels sub-sectors buoyed Fund results during the annual period. Individual holdings | Positions in Mahindra & Mahindra Ltd. and Eicher Motors Ltd., both automobile manufacturers; Trent Ltd., a fashion and lifestyle retail company; Indian Hotels Co. Ltd.; and Marico Ltd., a leading consumer goods company, were among the top contributors to Fund performance. Top Performance DetractorsStock selection | Selections in the automobile components, textiles, apparel & luxury goods sub-sectors hurt the Fund’s results during the annual period. Allocations | Large weightings in automobiles and automobile components and a small allocation to textiles, apparel & luxury goods detracted. Individual holdings | Fund positions in Tata Motors Ltd., parent company of British Jaguar Land Rover and South Korean Tata Daewoo; Titan Co. Ltd., which manufactures jewelry, watches and eyewear; Bajaj Auto Ltd. and Hero MotoCorp Ltd., which manufacture motorcycles and scooters; and bicycle manufacturer Tube Investments of India Ltd., were top detractors during the period. |
| Performance Past Does Not Indicate Future [Text] |
The Fund's past performance is not a good predictor of the Fund's future performance.
|
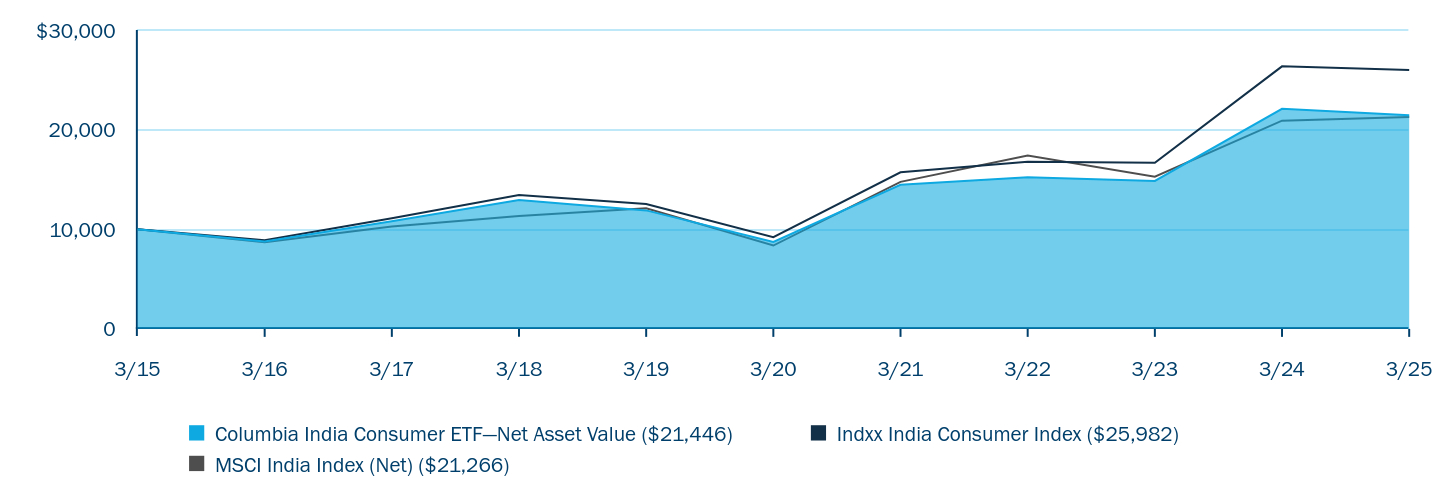
| Line Graph [Table Text Block] |
| Columbia India Consumer ETF—Net Asset Value
(21,446) | Indxx India Consumer Index (25,982) | MSCI India Index (Net) (21,266) |
|---|
3/15 | 10,000 | 10,000 | 10,000 |
|---|
3/16 | 8,782 | 8,908 | 8,685 |
|---|
3/17 | 10,808 | 11,104 | 10,282 |
|---|
3/18 | 12,931 | 13,434 | 11,335 |
|---|
3/19 | 11,892 | 12,532 | 12,100 |
|---|
3/20 | 8,729 | 9,209 | 8,366 |
|---|
3/21 | 14,461 | 15,711 | 14,754 |
|---|
3/22 | 15,216 | 16,771 | 17,390 |
|---|
3/23 | 14,854 | 16,681 | 15,274 |
|---|
3/24 | 22,094 | 26,353 | 20,899 |
|---|
3/25 | 21,446 | 25,982 | 21,266 |
|---|
|
| Average Annual Return [Table Text Block] |
Average Annual Total Return (%) | 1 year | 5 years | 10 Years |
|---|
Columbia India Consumer ETF—Net Asset ValueFootnote Reference(a) | -2.93 | 19.70 | 7.93 |
|---|
Indxx India Consumer Index | -1.41 | 23.05 | 10.02 |
|---|
MSCI India Index (Net) | 1.75 | 20.51 | 7.84 |
|---|
| Footnote | Description | Footnote(a) | Columbia Management has been the Fund’s investment manager since September 1, 2016. Performance prior to September 1, 2016 is attributable to the Fund’s previous investment manager. |
|
| No Deduction of Taxes [Text Block] |
Performance does not reflect the deduction of taxes that a shareholder may pay on fund distributions or on the redemptions of fund shares.
|
| Updated Performance Information Location [Text Block] |
Visit columbiathreadneedleus.com/investment-products/exchange-traded-funds/ for the most recent performance information.
|
| AssetsNet |
$ 317,805,293
|
| Holdings Count | Holding |
31
|
| Advisory Fees Paid, Amount |
$ 2,753,186
|
| InvestmentCompanyPortfolioTurnover |
41.00%
|
| Additional Fund Statistics [Text Block] |
Fund net assets | $317,805,293 |
|---|
Total number of portfolio holdings | 31 |
|---|
Investment management fees
(represents 0.75% of Fund average net assets) | $2,753,186 |
|---|
Portfolio turnover for the reporting period | 41% |
|---|
|
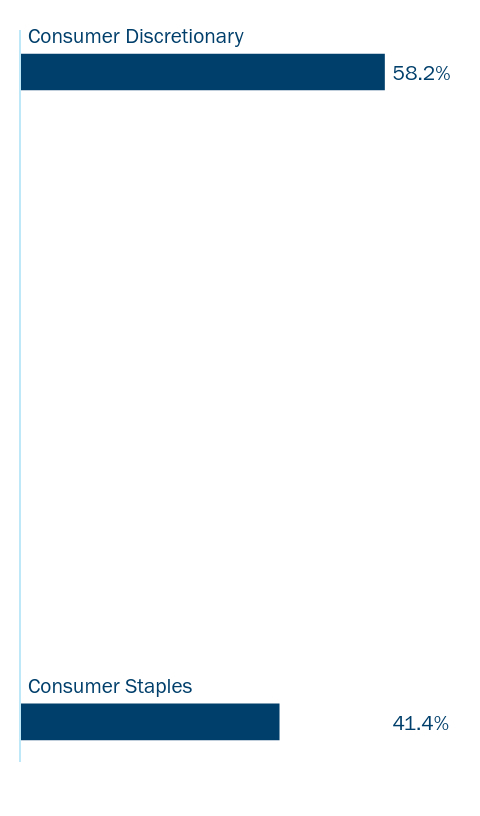
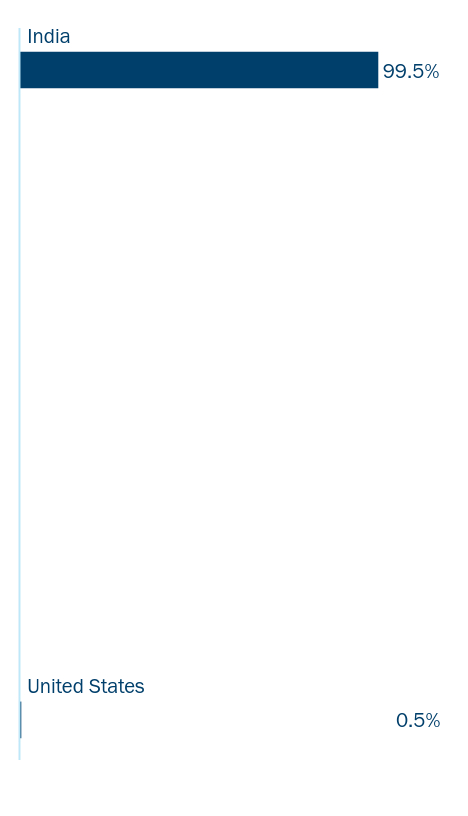
| Holdings [Text Block] |
Graphical Representation of Fund Holdings The tables below show the investment makeup of the Fund represented as a percentage of the Fund net assets. Derivatives are excluded from the tables unless otherwise noted. The Fund’s portfolio composition is subject to change. Bajaj Auto Ltd. (India) | 5.0% |
|---|
Tata Motors Ltd. (India) | 5.0% |
|---|
Trent Ltd. (India) | 5.0% |
|---|
Hindustan Unilever Ltd. (India) | 4.8% |
|---|
ITC Ltd. (India) | 4.8% |
|---|
Nestle India Ltd. (India) | 4.8% |
|---|
Maruti Suzuki India Ltd. (India) | 4.7% |
|---|
Titan Co. Ltd. (India) | 4.7% |
|---|
Mahindra & Mahindra Ltd. (India) | 4.6% |
|---|
Zomato Ltd. (India) | 4.2% |
|---|
Value | Value |
|---|
Consumer Staples | 41.4% | Consumer Discretionary | 58.2% |
Value | Value |
|---|
United States | 0.5% | India | 99.5% |
|
| Largest Holdings [Text Block] |
Bajaj Auto Ltd. (India) | 5.0% |
|---|
Tata Motors Ltd. (India) | 5.0% |
|---|
Trent Ltd. (India) | 5.0% |
|---|
Hindustan Unilever Ltd. (India) | 4.8% |
|---|
ITC Ltd. (India) | 4.8% |
|---|
Nestle India Ltd. (India) | 4.8% |
|---|
Maruti Suzuki India Ltd. (India) | 4.7% |
|---|
Titan Co. Ltd. (India) | 4.7% |
|---|
Mahindra & Mahindra Ltd. (India) | 4.6% |
|---|
Zomato Ltd. (India) | 4.2% |
|---|
|
| Material Fund Change [Text Block] |
This is a summary of the changes to the Fund. For more complete information, you may review the Fund’s prospectus, which is available at columbiathreadneedleus.com/investment-products/exchange-traded-funds or upon request at 1‑800‑426‑3750. The Fund is passively managed to invest in Indian consumer companies. Prior to November 2024, the Fund invested assets through a wholly owned subsidiary (the Subsidiary) located in the Republic of Mauritius, which in turn invested in Indian securities. This structure enabled the Fund to obtain certain benefits under a tax treaty between Mauritius and India. However, such benefits are no longer available and therefore there are no material advantages to the Fund to invest in Indian securities via the Subsidiary. As a result, the Fund no longer holds Indian securities in the Subsidiary and the Fund’s Principal Investment Strategies and Principal Risks are revised to remove all references and discussions of the Subsidiary. |
| Material Fund Change Risks Change [Text Block] |
The Fund is passively managed to invest in Indian consumer companies. Prior to November 2024, the Fund invested assets through a wholly owned subsidiary (the Subsidiary) located in the Republic of Mauritius, which in turn invested in Indian securities. This structure enabled the Fund to obtain certain benefits under a tax treaty between Mauritius and India. However, such benefits are no longer available and therefore there are no material advantages to the Fund to invest in Indian securities via the Subsidiary. As a result, the Fund no longer holds Indian securities in the Subsidiary and the Fund’s Principal Investment Strategies and Principal Risks are revised to remove all references and discussions of the Subsidiary.
|
| Summary of Change Legend [Text Block] |
This is a summary of the changes to the Fund.
|
| Updated Prospectus Phone Number |
1‑800‑426‑3750
|
| C000088095 |
|
| Shareholder Report [Line Items] |
|
| Fund Name |
Columbia Research Enhanced Emerging Economies ETF
|
| Trading Symbol |
ECON
|
| Security Exchange Name |
NYSEArca
|
| Annual or Semi-Annual Statement [Text Block] |
This annual shareholder report contains important information about Columbia Research Enhanced Emerging Economies ETF (the Fund) for the period of April 1, 2024 to March 31, 2025.
|
| Shareholder Report Annual or Semi-Annual |
Annual Shareholder Report
|
| Additional Information [Text Block] |
You can find additional information about the Fund at columbiathreadneedleus.com/resources/literature. You can also request this information by contacting us at 1-800-426-3750.
|
| Material Fund Change Notice [Text Block] |
This report describes changes to the Fund that occurred during the reporting period.
|
| Additional Information Phone Number |
1-800-426-3750
|
| Additional Information Website |
columbiathreadneedleus.com/resources/literature
|
| Expenses [Text Block] |
What were the Fund costs for the reporting period?(Based on a hypothetical $10,000 investment) Fund | Cost of a $10,000 investment | Cost paid as a percentage of a $10,000 investment |
|---|
Columbia Research Enhanced Emerging Economies ETF | $51 | 0.49% |
|---|
|
| Expenses Paid, Amount |
$ 51
|
| Expense Ratio, Percent |
0.49%
|
| Factors Affecting Performance [Text Block] |
Management's Discussion of Fund PerformanceThe performance of the Fund for the period presented is shown in the Average Annual Total Returns table. Top Performance ContributorsStock selection | Selections in the consumer discretionary, consumer staples and automobiles sub-sectors and, from a country perspective China and South Africa, boosted the Fund’s results most during the annual period. Allocations | Larger allocations to the automobiles and smaller allocations to banks and technology hardware sub-sectors buoyed Fund results during the annual period. Individual holdings | Positions in Alibaba Group Holding Ltd., a Chinese online and mobile e-commerce company; Mahindra & Mahindra Ltd., an India-based automobile manufacturer; Xiaomi Corp., a Chinese technology company that manufactures smartphones and lifestyle products; Tencent Holdings Ltd., a Chinese e-commerce and diversified media company; and Meituan, a Chinese web-based shopping platform, were among the top contributors to Fund performance. Top Performance DetractorsStock selection | Selections in the communication services, specialty retail and textiles, apparel & luxury goods sub-sectors and, from a country perspective Taiwan and Brazil, hurt the Fund’s results during the annual period. Allocations | Large weightings in diversified telecommunication services and beverages and a small allocation to semiconductors and interactive media & services detracted. Individual holdings | Fund positions in Samsung Electronics Co. Ltd., a South Korea-based consumer electronics company; Vibra Energia SA, a Brazil-based energy distribution company; Reliance Industries, Ltd., an India-based multinational conglomerate; SK Hynix, Inc., a South Korean supplier of memory chips; and Titan Co. Ltd., an India-based company that manufactures jewelry, watches and eyewear, were top detractors during the period. |
| Performance Past Does Not Indicate Future [Text] |
The Fund's past performance is not a good predictor of the Fund's future performance.
|
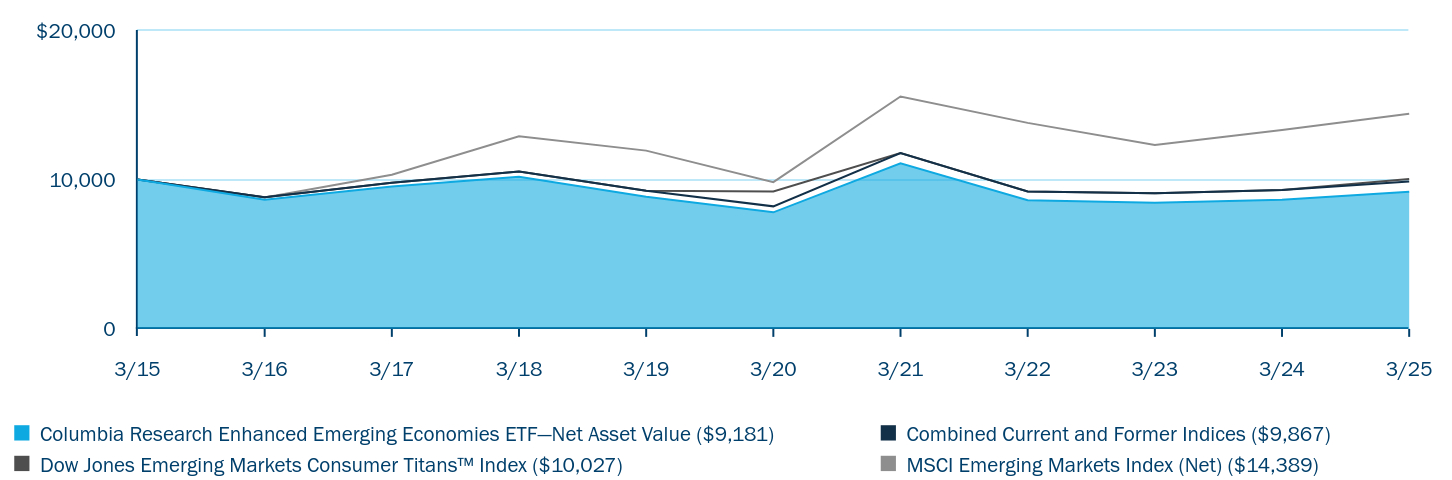
| Line Graph [Table Text Block] |
| Columbia Research Enhanced Emerging Economies ETF—Net Asset Value
(9,181) | Combined Current and Former Indices (9,867) | Dow Jones Emerging Markets Consumer Titans™ Index (10,027) | MSCI Emerging Markets Index (Net) (14,389) |
|---|
3/15 | 10,000 | 10,000 | 10,000 | 10,000 |
|---|
3/16 | 8,637 | 8,809 | 8,809 | 8,797 |
|---|
3/17 | 9,530 | 9,780 | 9,780 | 10,312 |
|---|
3/18 | 10,180 | 10,534 | 10,534 | 12,883 |
|---|
3/19 | 8,848 | 9,241 | 9,241 | 11,928 |
|---|
3/20 | 7,798 | 8,198 | 9,198 | 9,818 |
|---|
3/21 | 11,075 | 11,770 | 11,770 | 15,551 |
|---|
3/22 | 8,613 | 9,196 | 9,196 | 13,784 |
|---|
3/23 | 8,447 | 9,071 | 9,071 | 12,309 |
|---|
3/24 | 8,641 | 9,285 | 9,285 | 13,312 |
|---|
3/25 | 9,181 | 9,867 | 10,027 | 14,389 |
|---|
|
| Average Annual Return [Table Text Block] |
Average Annual Total Return (%) | 1 year | 5 years | 10 Years |
|---|
Columbia Research Enhanced Emerging Economies ETF—Net Asset ValueFootnote Reference(a)Footnote Reference(b) | 6.25 | 3.32 | -0.85 |
|---|
Beta Advantage® Research Enhanced Solactive Emerging Economies IndexFootnote Reference(c) | N/A | N/A | 4.16 |
|---|
Combined Current and Former IndicesFootnote Reference(d) | 6.27 | 3.77 | -0.13 |
|---|
Dow Jones Emerging Markets Consumer Titans™ Index | 8.00 | 4.11 | 0.03 |
|---|
MSCI Emerging Markets Index (Net) | 8.09 | 7.94 | 3.71 |
|---|
| Footnote | Description | Footnote(a) | Columbia Management has been the Fund’s investment manager since September 1, 2016. Performance prior to September 1, 2016 is attributable to the Fund’s previous investment manager. | Footnote(b) | Effective June 28, 2024 (Index Change Date), the Fund tracks and compares its performance to that of the Beta Advantage® Research Enhanced Solactive Emerging Economies Index (the New Index). Prior to the Index Change Date, the Fund tracked and compared its performance to that of the Dow Jones Emerging Markets Consumer Titans™ Index (the Former Index). If the Fund's strategies effective at the Index Change Date had been in place for the prior periods, results shown may have been different. The New Index commenced operations on May 2, 2024. For periods prior to February 3, 2025, the Fund sought to track the performance of its index, which was not calculated in the manner that the New Index is currently calculated. As a result, the performance of the Fund and the New Index for periods prior to that date is not representative of the performance they would have achieved had the Fund sought to track the performance of the New Index as currently calculated. | Footnote(c) | The Index performance is cumulative and for the period from June 28, 2024 through March 31, 2025. | Footnote(d) | The Combined Current and Former Indices performance represents the Fund's Former Index performance until June 28, 2024 and the Fund's New Index performance for the period from June 28, 2024 through March 31, 2025. |
|
| No Deduction of Taxes [Text Block] |
Performance does not reflect the deduction of taxes that a shareholder may pay on fund distributions or on the redemptions of fund shares.
|
| Updated Performance Information Location [Text Block] |
Visit columbiathreadneedleus.com/investment-products/exchange-traded-funds/ for the most recent performance information.
|
| AssetsNet |
$ 87,079,285
|
| Holdings Count | Holding |
204
|
| Advisory Fees Paid, Amount |
$ 336,994
|
| InvestmentCompanyPortfolioTurnover |
150.00%
|
| Additional Fund Statistics [Text Block] |
Fund net assets | $87,079,285 |
|---|
Total number of portfolio holdings | 204 |
|---|
Investment management fees
(represents 0.49% of Fund average net assets) | $336,994 |
|---|
Portfolio turnover for the reporting period | 150% |
|---|
|
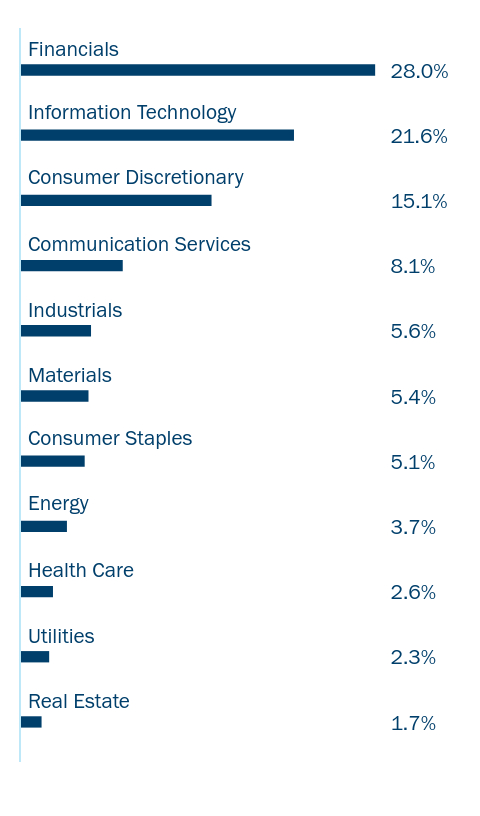
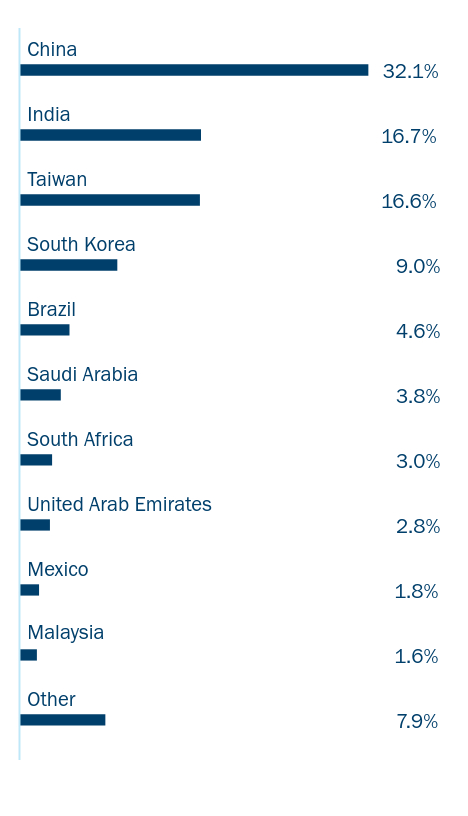
| Holdings [Text Block] |
Graphical Representation of Fund Holdings The tables below show the investment makeup of the Fund represented as a percentage of the Fund net assets. Derivatives are excluded from the tables unless otherwise noted. The Fund’s portfolio composition is subject to change. Alibaba Group Holding Ltd. (China) | 4.4% |
|---|
Tencent Holdings Ltd. (China) | 4.2% |
|---|
Taiwan Semiconductor Manufacturing Co. Ltd. (Taiwan) | 3.6% |
|---|
Samsung Electronics Co. Ltd. (South Korea) | 3.6% |
|---|
ICICI Bank Ltd. (India) | 2.1% |
|---|
Meituan Class B (China) | 1.7% |
|---|
Xiaomi Corp. Class B (China) | 1.7% |
|---|
MediaTek, Inc. (Taiwan) | 1.7% |
|---|
Hon Hai Precision Industry Co. Ltd. (Taiwan) | 1.4% |
|---|
China Construction Bank Corp. Class H (China) | 1.4% |
|---|
Value | Value |
|---|
Real Estate | 1.7% | Utilities | 2.3% | Health Care | 2.6% | Energy | 3.7% | Consumer Staples | 5.1% | Materials | 5.4% | Industrials | 5.6% | Communication Services | 8.1% | Consumer Discretionary | 15.1% | Information Technology | 21.6% | Financials | 28.0% |
Value | Value |
|---|
Other | 7.9% | Malaysia | 1.6% | Mexico | 1.8% | United Arab Emirates | 2.8% | South Africa | 3.0% | Saudi Arabia | 3.8% | Brazil | 4.6% | South Korea | 9.0% | Taiwan | 16.6% | India | 16.7% | China | 32.1% |
|
| Largest Holdings [Text Block] |
Alibaba Group Holding Ltd. (China) | 4.4% |
|---|
Tencent Holdings Ltd. (China) | 4.2% |
|---|
Taiwan Semiconductor Manufacturing Co. Ltd. (Taiwan) | 3.6% |
|---|
Samsung Electronics Co. Ltd. (South Korea) | 3.6% |
|---|
ICICI Bank Ltd. (India) | 2.1% |
|---|
Meituan Class B (China) | 1.7% |
|---|
Xiaomi Corp. Class B (China) | 1.7% |
|---|
MediaTek, Inc. (Taiwan) | 1.7% |
|---|
Hon Hai Precision Industry Co. Ltd. (Taiwan) | 1.4% |
|---|
China Construction Bank Corp. Class H (China) | 1.4% |
|---|
|
| Material Fund Change [Text Block] |
This is a summary of the changes to the Fund. For more complete information, you may review the Fund’s prospectus, which is available at columbiathreadneedleus.com/investment-products/exchange-traded-funds or upon request at 1‑800‑426‑3750. On June 28, 2024 (Effective Date), the Fund’s name was changed to Columbia Research Enhanced Emerging Economies ETF. Also, as of the Effective Date, the Fund changed its objective and the Fund’s principal investment strategies were revised to reflect the Fund’s new tracked Index. The Fund amended its Prospectus’ Principal Risks by removing Non-Diversified Fund Risk and by revising Index Methodology and Provider Risk. |
| Material Fund Change Name [Text Block] |
On June 28, 2024 (Effective Date), the Fund’s name was changed to Columbia Research Enhanced Emerging Economies ETF.
|
| Material Fund Change Strategies [Text Block] |
Also, as of the Effective Date, the Fund changed its objective and the Fund’s principal investment strategies were revised to reflect the Fund’s new tracked Index.
|
| Material Fund Change Risks Change [Text Block] |
The Fund amended its Prospectus’ Principal Risks by removing Non-Diversified Fund Risk and by revising Index Methodology and Provider Risk.
|
| Summary of Change Legend [Text Block] |
This is a summary of the changes to the Fund.
|
| Updated Prospectus Phone Number |
1‑800‑426‑3750
|