Shareholder Report
Mar. 31, 2025
USD ($)
Holding
This report describes changes to the Trust that occurred during the reporting period.
What were the Trust costs for the last year?
(Based on a hypothetical $10,000 investment)
| Trust (Class) | Costs of a $10,000 investment | Costs paid as a percentage of a $10,000 investment |
| Hawaiian Tax-Free Trust (Class A / HULAX) |
$99 | 0.98% |
Management’s Discussion of Trust Performance
Over the one-year period ended March 31, 2025, the Hawaiian Tax-Free Trust’s Class A shares returned 1.08% (without sales charge). This performance lagged the 1.22% return of the Trust’s primary benchmark, the Bloomberg Municipal Bond Index. Additionally, the Bloomberg Hawaii Municipal Bond Index, the Trust’s secondary benchmark, returned 1.41% during the same period. The market has remained volatile within a trading range of approximately 100 bps. Several key events have triggered the rates outlook for the market. First, there was a 100 bps cut in the Fed Funds rate in the third and fourth quarter of 2024. Second, the Presidential election ushered in a new Trump administration which got to work quickly altering legacy policies. Both are a source of uncertainty for the market to digest, leading to market volatility.
During the one-year period ended March 31, 2025:
- Municipal securities with lower credit qualities generally outperformed securities with higher credit qualities. The Trust’s performance relative to its primary benchmark was primarily attributable to the higher quality bias of the Hawaii based municipal securities held by the Trust relative to securities making up the Trust’s primary benchmark index.
- The Trust’s longer maturity relative to the primary benchmark provided a positive tailwind for the Trust’s relative performance.
- Security selection was a positive contributor to the Trust’s relative performance for the annual period.
Trust Performance
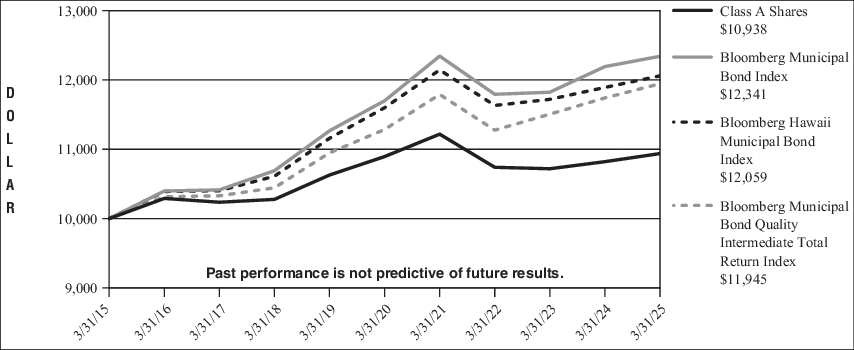
The following is a comparison of the change in value of a $10,000 investment in Hawaiian Tax-Free Trust’s Class A vs. the Bloomberg Municipal Bond Index, the Bloomberg Hawaii Municipal Bond Index and the Bloomberg Municipal Bond Quality Intermediate Total Return Index.
Growth of $10,000
For the years March 31, 2015 through March 31, 2025
| Average Annual Total Returns | 1 Year | 5 Years | 10 Years |
| Class A (with maximum 3.00% sales charge) | -2.00% | -0.73% | 0.49% |
| Class A (without sales charge) | 1.08% | 0.08% | 0.90% |
| Bloomberg Municipal Bond Index* | 1.22% | 1.07% | 2.13% |
| Bloomberg Hawaii Municipal Bond Index | 1.41% | 0.78% | 1.89% |
| Bloomberg Municipal Bond Quality Intermediate Total Return Index | 1.74% | 1.14% | 1.79% |
| * |
The Trust has designated the Bloomberg Municipal Bond Index as its new broad-based securities market index in accordance with the SEC’s revised definition for such an index. |
Please visit https://www.hawaiiantaxfreetrust.com for performance data current to the most recent month-end.
Key Trust Statistics
The following table outlines key Trust statistics that you should pay attention to.
| Trust net assets | $397,161,655 |
| Total number of portfolio holdings | 131 |
| Total advisory fee paid | $999,677 |
| Portfolio turnover rate as of the end of the reporting period | 18% |
Portfolio Holdings Summary Table (as of March 31, 2025)
The following table presents a summary by credit quality of the portfolio holdings of the Trust as a percentage of net assets:
CREDIT QUALITY
| Pre-refunded/Escrowed to Maturity | 2.1% |
| AAA | 7.7% |
| AA | 82.7% |
| A | 5.8% |
| BBB | 0.7% |
| BB | 0.0% |
| Cash | 1.0% |
Credit quality ratings are primarily sourced from Moody’s but in the event that Moody’s has not assigned a rating, the Trust will use S&P or Fitch. If these ratings are in conflict, S&P will be used before Fitch. If none of the major rating agencies have assigned a rating, the Trust will assign a rating of NR (non-rated security). The ratings represent their (Moody’s, S&P, and Fitch) opinions as to the quality of the underlying securities in the Trust, and not the Trust itself. The ratings range from AAA (extremely strong capacity to meet financial commitment) to D (in default). Ratings are relative and subjective and are not absolute standards of quality. A pre-refunded bond is secured by an escrow fund of U.S. government obligations (i.e. Treasury securities) and assumes the superior credit rating of the government obligation. The ratings do not predict performance and are subject to change.
Credit quality ratings are primarily sourced from Moody’s but in the event that Moody’s has not assigned a rating, the Trust will use S&P or Fitch. If these ratings are in conflict, S&P will be used before Fitch. If none of the major rating agencies have assigned a rating, the Trust will assign a rating of NR (non-rated security). The ratings represent their (Moody’s, S&P, and Fitch) opinions as to the quality of the underlying securities in the Trust, and not the Trust itself. The ratings range from AAA (extremely strong capacity to meet financial commitment) to D (in default). Ratings are relative and subjective and are not absolute standards of quality. A pre-refunded bond is secured by an escrow fund of U.S. government obligations (i.e. Treasury securities) and assumes the superior credit rating of the government obligation. The ratings do not predict performance and are subject to change.
Material Trust changes during the period
Following is a summary of material changes made to the Trust during the reporting period:
Effective September 1, 2024: Foreside Funds Distributors LLC acts as the principal underwriter of the Trust; The Bank of New York Mellon serves as the Trust's administrator; Asset Management Group of Bank of Hawaii, the Trust's investment Adviser, provides certain administrative services to the Trust; and Chenery Compliance Group, LLC and JW Fund Management LLC provide compliance, fund officer and related administrative services to the Trust.
Prior to September 1, 2024, Aquila Investment Management LLC served as the Administrator/Business Manager for the Trust and Aquila Distributors LLC acted as the principal underwriter of the Trust.
Changes in and Disagreements with Accountants
During the fiscal year ended March 31, 2025, there were no changes in and/or disagreements with Accountants.
This report describes changes to the Trust that occurred during the reporting period.
What were the Trust costs for the last year?
(Based on a hypothetical $10,000 investment)
| Trust (Class) | Costs of a $10,000 investment | Costs paid as a percentage of a $10,000 investment |
| Hawaiian Tax-Free Trust (Class C / HULCX) |
$177 | 1.77% |
Management’s Discussion of Trust Performance
Over the one-year period ended March 31, 2025, the Hawaiian Tax-Free Trust’s Class C shares returned 0.18% (without contingent deferred sales charge). This performance lagged the 1.22% return of the Trust’s primary benchmark, the Bloomberg Municipal Bond Index. Additionally, the Bloomberg Hawaii Municipal Bond Index, the Trust’s secondary benchmark, returned 1.41% during the same period. The market has remained volatile within a trading range of approximately 100 bps. Several key events have triggered the rates outlook for the market. First, there was a 100 bps cut in the Fed Funds rate in the third and fourth quarter of 2024. Second, the Presidential election ushered in a new Trump administration which got to work quickly altering legacy policies. Both are a source of uncertainty for the market to digest, leading to market volatility.
During the one-year period ended March 31, 2025:
- Municipal securities with lower credit qualities generally outperformed securities with higher credit qualities. The Trust’s performance relative to its primary benchmark was primarily attributable to the higher quality bias of the Hawaii based municipal securities held by the Trust relative to securities making up the Trust’s primary benchmark index.
- The Trust’s longer maturity relative to the primary benchmark provided a positive tailwind for the Trust’s relative performance.
- Security selection was a positive contributor to the Trust’s relative performance for the annual period.
Trust Performance
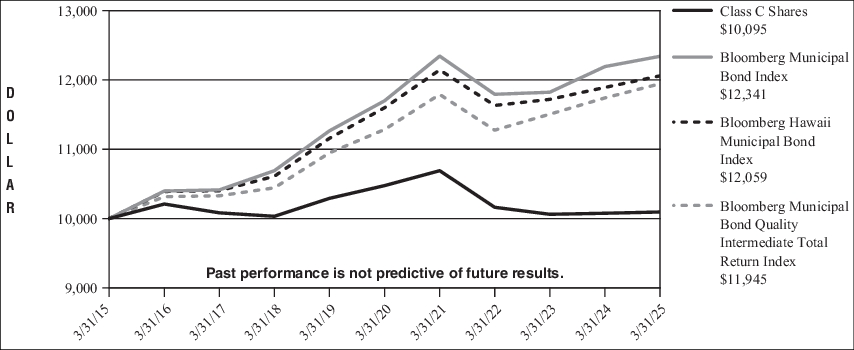
The following is a comparison of the change in value of a $10,000 investment in Hawaiian Tax-Free Trust’s Class C vs. the Bloomberg Municipal Bond Index, the Bloomberg Hawaii Municipal Bond Index and the Bloomberg Municipal Bond Quality Intermediate Total Return Index.
Growth of $10,000
For the years March 31, 2015 through March 31, 2025
| Average Annual Total Returns | 1 Year | 5 Years | 10 Years |
| Class C (with maximum 1.00% contingent deferred sales charge) | -0.81% | -0.74% | 0.09% |
| Class C (without contingent deferred sales charge) | 0.18% | -0.74% | 0.09% |
| Bloomberg Municipal Bond Index* | 1.22% | 1.07% | 2.13% |
| Bloomberg Hawaii Municipal Bond Index | 1.41% | 0.78% | 1.89% |
| Bloomberg Municipal Bond Quality Intermediate Total Return Index | 1.74% | 1.14% | 1.79% |
| * |
The Trust has designated the Bloomberg Municipal Bond Index as its new broad-based securities market index in accordance with the SEC’s revised definition for such an index. |
Please visit https://www.hawaiiantaxfreetrust.com for performance data current to the most recent month-end.
Key Trust Statistics
The following table outlines key Trust statistics that you should pay attention to.
| Trust net assets | $397,161,655 |
| Total number of portfolio holdings | 131 |
| Total advisory fee paid | $999,677 |
| Portfolio turnover rate as of the end of the reporting period | 18% |
Portfolio Holdings Summary Table (as of March 31, 2025)
The following table presents a summary by credit quality of the portfolio holdings of the Trust as a percentage of net assets:
CREDIT QUALITY
| Pre-refunded/Escrowed to Maturity | 2.1% |
| AAA | 7.7% |
| AA | 82.7% |
| A | 5.8% |
| BBB | 0.7% |
| BB | 0.0% |
| Cash | 1.0% |
Credit quality ratings are primarily sourced from Moody’s but in the event that Moody’s has not assigned a rating, the Trust will use S&P or Fitch. If these ratings are in conflict, S&P will be used before Fitch. If none of the major rating agencies have assigned a rating, the Trust will assign a rating of NR (non-rated security). The ratings represent their (Moody’s, S&P, and Fitch) opinions as to the quality of the underlying securities in the Trust, and not the Trust itself. The ratings range from AAA (extremely strong capacity to meet financial commitment) to D (in default). Ratings are relative and subjective and are not absolute standards of quality. A pre-refunded bond is secured by an escrow fund of U.S. government obligations (i.e. Treasury securities) and assumes the superior credit rating of the government obligation. The ratings do not predict performance and are subject to change.
Credit quality ratings are primarily sourced from Moody’s but in the event that Moody’s has not assigned a rating, the Trust will use S&P or Fitch. If these ratings are in conflict, S&P will be used before Fitch. If none of the major rating agencies have assigned a rating, the Trust will assign a rating of NR (non-rated security). The ratings represent their (Moody’s, S&P, and Fitch) opinions as to the quality of the underlying securities in the Trust, and not the Trust itself. The ratings range from AAA (extremely strong capacity to meet financial commitment) to D (in default). Ratings are relative and subjective and are not absolute standards of quality. A pre-refunded bond is secured by an escrow fund of U.S. government obligations (i.e. Treasury securities) and assumes the superior credit rating of the government obligation. The ratings do not predict performance and are subject to change.
Material Trust changes during the period
Following is a summary of material changes made to the Trust during the reporting period:
Effective September 1, 2024: Foreside Funds Distributors LLC acts as the principal underwriter of the Trust; The Bank of New York Mellon serves as the Trust's administrator; Asset Management Group of Bank of Hawaii, the Trust's investment Adviser, provides certain administrative services to the Trust; and Chenery Compliance Group, LLC and JW Fund Management LLC provide compliance, fund officer and related administrative services to the Trust.
Prior to September 1, 2024, Aquila Investment Management LLC served as the Administrator/Business Manager for the Trust and Aquila Distributors LLC acted as the principal underwriter of the Trust.
Changes in and Disagreements with Accountants
During the fiscal year ended March 31, 2025, there were no changes in and/or disagreements with Accountants.
This report describes changes to the Trust that occurred during the reporting period.
What were the Trust costs for the last year?
(Based on a hypothetical $10,000 investment)
| Trust (Class) | Costs of a $10,000 investment | Costs paid as a percentage of a $10,000 investment |
| Hawaiian Tax-Free Trust (Class F / HULFX) |
$76 | 0.76% |
Management’s Discussion of Trust Performance
Over the one-year period ended March 31, 2025, the Hawaiian Tax-Free Trust’s Class F shares returned 1.20%. This performance lagged the 1.22% return of the Trust’s primary benchmark, the Bloomberg Municipal Bond Index. Additionally, the Bloomberg Hawaii Municipal Bond Index, the Trust’s secondary benchmark, returned 1.41% during the same period. The market has remained volatile within a trading range of approximately 100 bps. Several key events have triggered the rates outlook for the market. First, there was a 100 bps cut in the Fed Funds rate in the third and fourth quarter of 2024. Second, the Presidential election ushered in a new Trump administration which got to work quickly altering legacy policies. Both are a source of uncertainty for the market to digest, leading to market volatility.
During the one-year period ended March 31, 2025:
- Municipal securities with lower credit qualities generally outperformed securities with higher credit qualities. The Trust’s performance relative to its primary benchmark was primarily attributable to the higher quality bias of the Hawaii based municipal securities held by the Trust relative to securities making up the Trust’s primary benchmark index.
- The Trust’s longer maturity relative to the primary benchmark provided a positive tailwind for the Trust’s relative performance.
- Security selection was a positive contributor to the Trust’s relative performance for the annual period.
Trust Performance
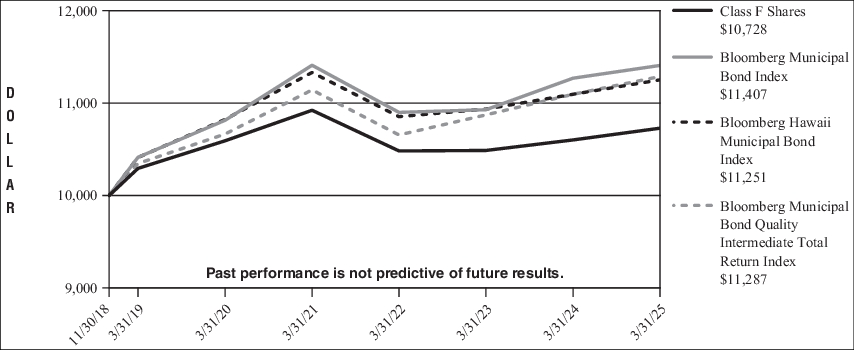
The following is a comparison of the change in value of a $10,000 investment in Hawaiian Tax-Free Trust’s Class F vs. the Bloomberg Municipal Bond Index, the Bloomberg Hawaii Municipal Bond Index and the Bloomberg Municipal Bond Quality Intermediate Total Return Index.
Growth of $10,000
For the period November 30, 2018* through March 31, 2025
| Average Annual Total Returns | 1 Year | 5 Years | Since inception |
| Class F | 1.20% | 0.25% | 1.12%* |
| Bloomberg Municipal Bond Index** | 1.22% | 1.07% | 2.10%*** |
| Bloomberg Hawaii Municipal Bond Index | 1.41% | 0.78% | 1.88%*** |
| Bloomberg Municipal Bond Quality Intermediate Total Return Index | 1.74% | 1.14% | 1.93%*** |
| * |
Class F Shares commenced operations on November 30, 2018. |
| ** |
The Trust has designated the Bloomberg Municipal Bond Index as its new broad-based securities market index in accordance with the SEC’s revised definition for such an index. |
| *** |
Benchmark performance is from the commencement date of the Fund Class only and is not the commencement date of the benchmark itself. |
Please visit https://www.hawaiiantaxfreetrust.com for performance data current to the most recent month-end.
Key Trust Statistics
The following table outlines key Trust statistics that you should pay attention to.
| Trust net assets | $397,161,655 |
| Total number of portfolio holdings | 131 |
| Total advisory fee paid | $999,677 |
| Portfolio turnover rate as of the end of the reporting period | 18% |
Portfolio Holdings Summary Table (as of March 31, 2025)
The following table presents a summary by credit quality of the portfolio holdings of the Trust as a percentage of net assets:
CREDIT QUALITY
| Pre-refunded/Escrowed to Maturity | 2.1% |
| AAA | 7.7% |
| AA | 82.7% |
| A | 5.8% |
| BBB | 0.7% |
| BB | 0.0% |
| Cash | 1.0% |
Credit quality ratings are primarily sourced from Moody’s but in the event that Moody’s has not assigned a rating, the Trust will use S&P or Fitch. If these ratings are in conflict, S&P will be used before Fitch. If none of the major rating agencies have assigned a rating, the Trust will assign a rating of NR (non-rated security). The ratings represent their (Moody’s, S&P, and Fitch) opinions as to the quality of the underlying securities in the Trust, and not the Trust itself. The ratings range from AAA (extremely strong capacity to meet financial commitment) to D (in default). Ratings are relative and subjective and are not absolute standards of quality. A pre-refunded bond is secured by an escrow fund of U.S. government obligations (i.e. Treasury securities) and assumes the superior credit rating of the government obligation. The ratings do not predict performance and are subject to change.
Credit quality ratings are primarily sourced from Moody’s but in the event that Moody’s has not assigned a rating, the Trust will use S&P or Fitch. If these ratings are in conflict, S&P will be used before Fitch. If none of the major rating agencies have assigned a rating, the Trust will assign a rating of NR (non-rated security). The ratings represent their (Moody’s, S&P, and Fitch) opinions as to the quality of the underlying securities in the Trust, and not the Trust itself. The ratings range from AAA (extremely strong capacity to meet financial commitment) to D (in default). Ratings are relative and subjective and are not absolute standards of quality. A pre-refunded bond is secured by an escrow fund of U.S. government obligations (i.e. Treasury securities) and assumes the superior credit rating of the government obligation. The ratings do not predict performance and are subject to change.
Material Trust changes during the period
Following is a summary of material changes made to the Trust during the reporting period:
Effective September 1, 2024: Foreside Funds Distributors LLC acts as the principal underwriter of the Trust; The Bank of New York Mellon serves as the Trust's administrator; Asset Management Group of Bank of Hawaii, the Trust's investment Adviser, provides certain administrative services to the Trust; and Chenery Compliance Group, LLC and JW Fund Management LLC provide compliance, fund officer and related administrative services to the Trust.
Prior to September 1, 2024, Aquila Investment Management LLC served as the Administrator/Business Manager for the Trust and Aquila Distributors LLC acted as the principal underwriter of the Trust.
Changes in and Disagreements with Accountants
During the fiscal year ended March 31, 2025, there were no changes in and/or disagreements with Accountants.
This report describes changes to the Trust that occurred during the reporting period.
What were the Trust costs for the last year?
(Based on a hypothetical $10,000 investment)
| Trust (Class) | Costs of a $10,000 investment | Costs paid as a percentage of a $10,000 investment |
| Hawaiian Tax-Free Trust (Class Y / HULYX) |
$77 | 0.77% |
Management’s Discussion of Trust Performance
Over the one-year period ended March 31, 2025, the Hawaiian Tax-Free Trust’s Class Y shares returned 1.28%. This performance was slightly higher than the 1.22% return of the Trust’s primary benchmark, the Bloomberg Municipal Bond Index. Additionally, the Bloomberg Hawaii Municipal Bond Index, the Trust’s secondary benchmark, returned 1.41% during the same period. The market has remained volatile within a trading range of approximately 100 bps. Several key events have triggered the rates outlook for the market. First, there was a 100 bps cut in the Fed Funds rate in the third and fourth quarter of 2024. Second, the Presidential election ushered in a new Trump administration which got to work quickly altering legacy policies. Both are a source of uncertainty for the market to digest, leading to market volatility.
During the one-year period ended March 31, 2025:
- Municipal securities with lower credit qualities generally outperformed securities with higher credit qualities. The Trust’s performance relative to its primary benchmark was primarily attributable to the higher quality bias of the Hawaii based municipal securities held by the Trust relative to securities making up the Trust’s primary benchmark index.
- The Trust’s longer maturity relative to the primary benchmark provided a positive tailwind for the Trust’s relative performance.
- Security selection was a positive contributor to the Trust’s relative performance for the annual period.
Trust Performance
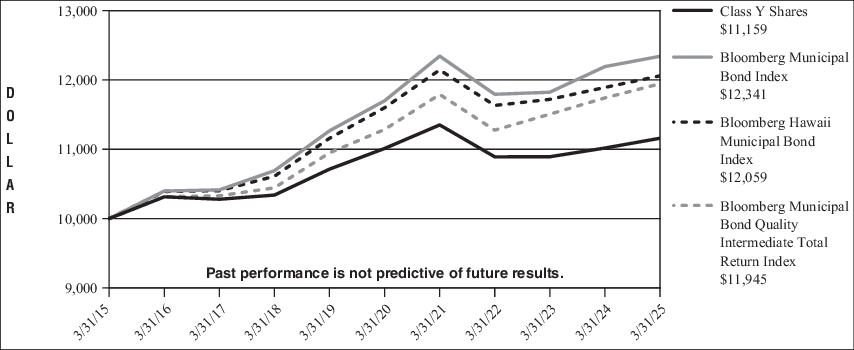
The following is a comparison of the change in value of a $10,000 investment in Hawaiian Tax-Free Trust’s Class Y vs. the Bloomberg Municipal Bond Index, the Bloomberg Hawaii Municipal Bond Index and the Bloomberg Municipal Bond Quality Intermediate Total Return Index.
Growth of $10,000
For the years March 31, 2015 through March 31, 2025
| Average Annual Total Returns | 1 Year | 5 Years | 10 Years |
| Class Y | 1.28% | 0.27% | 1.10% |
| Bloomberg Municipal Bond Index* | 1.22% | 1.07% | 2.13% |
| Bloomberg Hawaii Municipal Bond Index | 1.41% | 0.78% | 1.89% |
| Bloomberg Municipal Bond Quality Intermediate Total Return Index | 1.74% | 1.14% | 1.79% |
| * |
The Trust has designated the Bloomberg Municipal Bond Index as its new broad-based securities market index in accordance with the SEC’s revised definition for such an index. |
Please visit https://www.hawaiiantaxfreetrust.com for performance data current to the most recent month-end.
Key Trust Statistics
The following table outlines key Trust statistics that you should pay attention to.
| Trust net assets | $397,161,655 |
| Total number of portfolio holdings | 131 |
| Total advisory fee paid | $999,677 |
| Portfolio turnover rate as of the end of the reporting period | 18% |
Portfolio Holdings Summary Table (as of March 31, 2025)
The following table presents a summary by credit quality of the portfolio holdings of the Trust as a percentage of net assets:
CREDIT QUALITY
| Pre-refunded/Escrowed to Maturity | 2.1% |
| AAA | 7.7% |
| AA | 82.7% |
| A | 5.8% |
| BBB | 0.7% |
| BB | 0.0% |
| Cash | 1.0% |
Credit quality ratings are primarily sourced from Moody’s but in the event that Moody’s has not assigned a rating, the Trust will use S&P or Fitch. If these ratings are in conflict, S&P will be used before Fitch. If none of the major rating agencies have assigned a rating, the Trust will assign a rating of NR (non-rated security). The ratings represent their (Moody’s, S&P, and Fitch) opinions as to the quality of the underlying securities in the Trust, and not the Trust itself. The ratings range from AAA (extremely strong capacity to meet financial commitment) to D (in default). Ratings are relative and subjective and are not absolute standards of quality. A pre-refunded bond is secured by an escrow fund of U.S. government obligations (i.e. Treasury securities) and assumes the superior credit rating of the government obligation. The ratings do not predict performance and are subject to change.
Credit quality ratings are primarily sourced from Moody’s but in the event that Moody’s has not assigned a rating, the Trust will use S&P or Fitch. If these ratings are in conflict, S&P will be used before Fitch. If none of the major rating agencies have assigned a rating, the Trust will assign a rating of NR (non-rated security). The ratings represent their (Moody’s, S&P, and Fitch) opinions as to the quality of the underlying securities in the Trust, and not the Trust itself. The ratings range from AAA (extremely strong capacity to meet financial commitment) to D (in default). Ratings are relative and subjective and are not absolute standards of quality. A pre-refunded bond is secured by an escrow fund of U.S. government obligations (i.e. Treasury securities) and assumes the superior credit rating of the government obligation. The ratings do not predict performance and are subject to change.
Material Trust changes during the period
Following is a summary of material changes made to the Trust during the reporting period:
Effective September 1, 2024: Foreside Funds Distributors LLC acts as the principal underwriter of the Trust; The Bank of New York Mellon serves as the Trust's administrator; Asset Management Group of Bank of Hawaii, the Trust's investment Adviser, provides certain administrative services to the Trust; and Chenery Compliance Group, LLC and JW Fund Management LLC provide compliance, fund officer and related administrative services to the Trust.
Prior to September 1, 2024, Aquila Investment Management LLC served as the Administrator/Business Manager for the Trust and Aquila Distributors LLC acted as the principal underwriter of the Trust.
Changes in and Disagreements with Accountants
During the fiscal year ended March 31, 2025, there were no changes in and/or disagreements with Accountants.