Shareholder Report
Mar. 31, 2025
USD ($)
Holding
This report describes changes to the Fund that occurred during the reporting period.
Fund Expenses for the Last Six Months
(Based on a hypothetical $10,000 investment)
| Fund (Class) | Cost of a $10,000 Investment | Costs paid as a percentage of a $10,000 investment |
| Barrow Hanley Concentrated Emerging Markets ESG Opportunities Fund (Institutional Shares) |
$54 | 1.13% |
Key Fund Statistics
The following table outlines key fund statistics that you should pay attention to.
| Fund net assets | $5,464,914 |
| Total number of portfolio holdings | 40 |
| Portfolio turnover rate as of the end of the reporting period | 27.08% |
Graphical Representation of Holdings
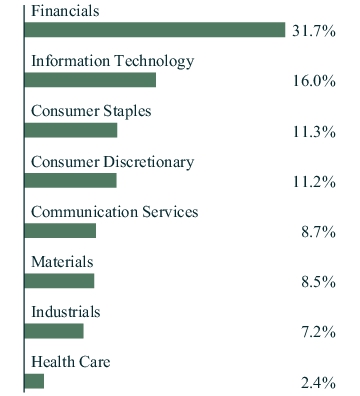
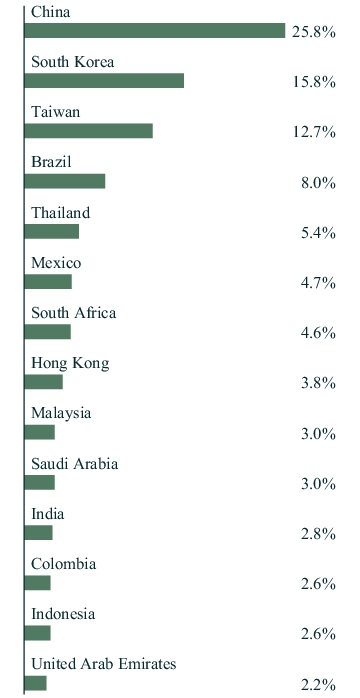
The tables below show the investment makeup of the Fund, excluding short-term investments, represented as a percentage of the total net assets of the Fund.
TOP TEN HOLDINGS
| MediaTek, Inc. | 4.6% |
| Kasikornbank PCL - REG | 4.4% |
| JD.com, Inc. - Class A | 4.0% |
| Ping An Insurance Group Co. of China Ltd. - Class H | 3.8% |
| Hiwin Technologies Corp. | 3.5% |
| SK Hynix, Inc. | 3.4% |
| Tingyi Cayman Islands Holding Corp. | 3.4% |
| Samsung Electro-Mechanics Co. Ltd. | 3.4% |
| Great Wall Motor Co. Ltd. - Class H | 3.2% |
| B3 S.A. - Brasil Bolsa Balcao | 3.1% |
SECTOR ALLOCATION
GEOGRAPHICAL ALLOCATION
TOP TEN HOLDINGS
| MediaTek, Inc. | 4.6% |
| Kasikornbank PCL - REG | 4.4% |
| JD.com, Inc. - Class A | 4.0% |
| Ping An Insurance Group Co. of China Ltd. - Class H | 3.8% |
| Hiwin Technologies Corp. | 3.5% |
| SK Hynix, Inc. | 3.4% |
| Tingyi Cayman Islands Holding Corp. | 3.4% |
| Samsung Electro-Mechanics Co. Ltd. | 3.4% |
| Great Wall Motor Co. Ltd. - Class H | 3.2% |
| B3 S.A. - Brasil Bolsa Balcao | 3.1% |
Material Fund Changes
Effective February 1, 2025, to comply with recent Securities and Exchange Commission rule amendments relating to a fund's name, the Fund modified its investment policy as follows:
Under normal circumstances, the Fund invests at least 80% of its net assets, plus any borrowings for investment purposes, in securities that are (1) issued by companies located in emerging market countries and (2) consistent with the environmental, social and governance (“ESG”) criteria of Barrow, Hanley, Mewhinney & Strauss, LLC, the Fund’s sub-adviser.
A more detailed explanation of how the Fund defines “emerging market countries” and “ESG criteria” can be found in the Fund's prospectus. In order to satisfy notice requirements related to an investment policy change, the Fund continued to comply with both its old and new investment policies concurrently through May 1, 2025, after which time only the new investment policy applied.
This is a summary of certain changes to the Fund since October 1, 2024. For more complete information, you may review the Fund's prospectus dated February 1, 2025, at connect.rightprospectus.com/BarrowHanley or upon request at 866-260-9549 (toll free) or 312-557-5913.
This is a summary of certain changes to the Fund since October 1, 2024. For more complete information, you may review the Fund's prospectus dated February 1, 2025, at connect.rightprospectus.com/BarrowHanley or upon request at 866-260-9549 (toll free) or 312-557-5913.
Fund Expenses for the Last Six Months
(Based on a hypothetical $10,000 investment)
| Fund (Class) | Cost of a $10,000 Investment | Costs paid as a percentage of a $10,000 investment |
| Barrow Hanley Total Return Bond Fund (Institutional Shares) |
$17 | 0.35% |
Key Fund Statistics
The following table outlines key fund statistics that you should pay attention to.
| Fund net assets | $173,632,687 |
| Total number of portfolio holdings | 249 |
| Portfolio turnover rate as of the end of the reporting period | 37.21% |
Graphical Representation of Holdings
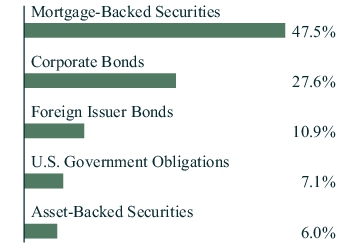
The tables below show the investment makeup of the Fund, excluding short-term investments, represented as a percentage of the total net assets of the Fund.
TOP TEN HOLDINGS
| U.S. Treasury Notes, 0.25%, 05/31/25 | 5.3% |
| U.S. Treasury Notes, 4.88%, 04/30/26 | 1.8% |
| Freddie Mac Pool #SD8267, 5.00%, 11/01/52 | 1.7% |
| Fannie Mae Pool #CB1384, 2.50%, 08/01/51 | 1.6% |
| Citigroup, Inc., 5.83%, 02/13/35 | 1.5% |
| Fannie Mae Pool #FM8787, 2.50%, 10/01/51 | 1.4% |
| Ginnie Mae II Pool #MA9017, 5.50%, 07/20/53 | 1.3% |
| Freddie Mac Pool #RJ1265, 5.50%, 04/01/54 | 1.3% |
| Fannie Mae Pool #FS3744, 2.00%, 07/01/51 | 1.3% |
| Fannie Mae Pool #MA4841, 5.00%, 12/01/52 | 1.3% |
ASSET TYPE ALLOCATION
TOP TEN HOLDINGS
| U.S. Treasury Notes, 0.25%, 05/31/25 | 5.3% |
| U.S. Treasury Notes, 4.88%, 04/30/26 | 1.8% |
| Freddie Mac Pool #SD8267, 5.00%, 11/01/52 | 1.7% |
| Fannie Mae Pool #CB1384, 2.50%, 08/01/51 | 1.6% |
| Citigroup, Inc., 5.83%, 02/13/35 | 1.5% |
| Fannie Mae Pool #FM8787, 2.50%, 10/01/51 | 1.4% |
| Ginnie Mae II Pool #MA9017, 5.50%, 07/20/53 | 1.3% |
| Freddie Mac Pool #RJ1265, 5.50%, 04/01/54 | 1.3% |
| Fannie Mae Pool #FS3744, 2.00%, 07/01/51 | 1.3% |
| Fannie Mae Pool #MA4841, 5.00%, 12/01/52 | 1.3% |
Fund Expenses for the Last Six Months
(Based on a hypothetical $10,000 investment)
| Fund (Class) | Cost of a $10,000 Investment | Costs paid as a percentage of a $10,000 investment |
| Barrow Hanley Credit Opportunities Fund (Institutional Shares) |
$32 | 0.64% |
Key Fund Statistics
The following table outlines key fund statistics that you should pay attention to.
| Fund net assets | $92,914,356 |
| Total number of portfolio holdings | 118 |
| Portfolio turnover rate as of the end of the reporting period | 18.05% |
Graphical Representation of Holdings
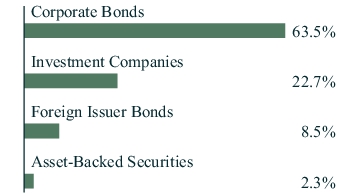
The tables below show the investment makeup of the Fund, excluding short-term investments, represented as a percentage of the total net assets of the Fund.
TOP TEN HOLDINGS
| Barrow Hanley Floating Rate Fund, 0.88%, | 22.7% |
| ILFC E-Capital Trust I, 6.12%, 12/21/65 | 2.2% |
| Total Play Telecomunicaciones S.A. de C.V., 11.13%, 12/31/32 | 2.1% |
| Burford Capital Global Finance LLC, 9.25%, 07/01/31 | 2.0% |
| PROG Holdings, Inc., 6.00%, 11/15/29 | 2.0% |
| Howard Hughes (The) Corp., 4.38%, 02/01/31 | 1.9% |
| Enviri Corp., 5.75%, 07/31/27 | 1.6% |
| Mativ Holdings, Inc., 8.00%, 10/01/29 | 1.6% |
| Interface, Inc., 5.50%, 12/01/28 | 1.4% |
| Chemours (The) Co., 4.63%, 11/15/29 | 1.4% |
ASSET TYPE ALLOCATION
TOP TEN HOLDINGS
| Barrow Hanley Floating Rate Fund, 0.88%, | 22.7% |
| ILFC E-Capital Trust I, 6.12%, 12/21/65 | 2.2% |
| Total Play Telecomunicaciones S.A. de C.V., 11.13%, 12/31/32 | 2.1% |
| Burford Capital Global Finance LLC, 9.25%, 07/01/31 | 2.0% |
| PROG Holdings, Inc., 6.00%, 11/15/29 | 2.0% |
| Howard Hughes (The) Corp., 4.38%, 02/01/31 | 1.9% |
| Enviri Corp., 5.75%, 07/31/27 | 1.6% |
| Mativ Holdings, Inc., 8.00%, 10/01/29 | 1.6% |
| Interface, Inc., 5.50%, 12/01/28 | 1.4% |
| Chemours (The) Co., 4.63%, 11/15/29 | 1.4% |
Fund Expenses for the Last Six Months
(Based on a hypothetical $10,000 investment)
| Fund (Class) | Cost of a $10,000 Investment | Costs paid as a percentage of a $10,000 investment |
| Barrow Hanley Floating Rate Fund (Institutional Shares) |
$30 | 0.59% |
Key Fund Statistics
The following table outlines key fund statistics that you should pay attention to.
| Fund net assets | $101,911,176 |
| Total number of portfolio holdings | 165 |
| Portfolio turnover rate as of the end of the reporting period | 56.66% |
Graphical Representation of Holdings
The tables below show the investment makeup of the Fund, excluding short-term investments, represented as a percentage of the total net assets of the Fund.
TOP TEN HOLDINGS
| TMS International Corp., Term B-7 Loan, 7.79%, 03/02/30 | 2.1% |
| BCPE Empire Holdings, Inc., Amendment No. 8 Incremental Term Loan, 7.57%, 12/11/30 | 2.0% |
| Nexus Buyer LLC, Initial Term Loan, 7.82%, 07/31/31 | 1.9% |
| Magnite, Inc., Amendment No.2 Initial Term Loan, 7.32%, 02/06/31 | 1.6% |
| Russell Investments U.S. Institutional Holdco, Inc., 2027 Term Loan, 9.29%, 05/30/27 | 1.5% |
| Global IID Parent LLC, 2025 Refinancing Term B Loan, 8.55%, 12/16/28 | 1.5% |
| Chemours (The) Co., Tranche B-3 US$ Term Loan, 7.32%, 08/18/28 | 1.4% |
| LifePoint Health, Inc., 2024-1 Refinancing Term Loan, 8.05%, 05/17/31 | 1.4% |
| MH Sub I LLC, 2023 May Incremental Term Loan, 8.57%, 05/03/28 | 1.4% |
| Proofpoint, Inc., 2024 Refinancing Term Loan, 7.32%, 08/31/28 | 1.2% |
ASSET TYPE ALLOCATION
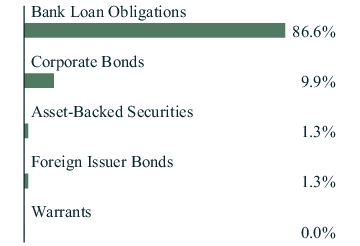
TOP TEN HOLDINGS
| TMS International Corp., Term B-7 Loan, 7.79%, 03/02/30 | 2.1% |
| BCPE Empire Holdings, Inc., Amendment No. 8 Incremental Term Loan, 7.57%, 12/11/30 | 2.0% |
| Nexus Buyer LLC, Initial Term Loan, 7.82%, 07/31/31 | 1.9% |
| Magnite, Inc., Amendment No.2 Initial Term Loan, 7.32%, 02/06/31 | 1.6% |
| Russell Investments U.S. Institutional Holdco, Inc., 2027 Term Loan, 9.29%, 05/30/27 | 1.5% |
| Global IID Parent LLC, 2025 Refinancing Term B Loan, 8.55%, 12/16/28 | 1.5% |
| Chemours (The) Co., Tranche B-3 US$ Term Loan, 7.32%, 08/18/28 | 1.4% |
| LifePoint Health, Inc., 2024-1 Refinancing Term Loan, 8.05%, 05/17/31 | 1.4% |
| MH Sub I LLC, 2023 May Incremental Term Loan, 8.57%, 05/03/28 | 1.4% |
| Proofpoint, Inc., 2024 Refinancing Term Loan, 7.32%, 08/31/28 | 1.2% |
This report describes changes to the Fund that occurred during the reporting period.
Fund Expenses for the Last Six Months
(Based on a hypothetical $10,000 investment)
| Fund (Class) | Cost of a $10,000 Investment | Costs paid as a percentage of a $10,000 investment |
| Barrow Hanley US Value Opportunities Fund (Institutional Shares) |
$34 | 0.70% |
Key Fund Statistics
The following table outlines key fund statistics that you should pay attention to.
| Fund net assets | $96,250,045 |
| Total number of portfolio holdings | 71 |
| Portfolio turnover rate as of the end of the reporting period | 31.59% |
Graphical Representation of Holdings
The tables below show the investment makeup of the Fund, excluding short-term investments, represented as a percentage of the total net assets of the Fund.
TOP TEN HOLDINGS
| UnitedHealth Group, Inc. | 2.4% |
| Exxon Mobil Corp. | 2.3% |
| Wells Fargo & Co. | 1.9% |
| Entergy Corp. | 1.9% |
| Elevance Health, Inc. | 1.9% |
| Keurig Dr. Pepper, Inc. | 1.9% |
| Medtronic PLC | 1.8% |
| Willis Towers Watson PLC | 1.8% |
| Carnival Corp. | 1.8% |
| Xcel Energy, Inc. | 1.7% |
SECTOR ALLOCATION
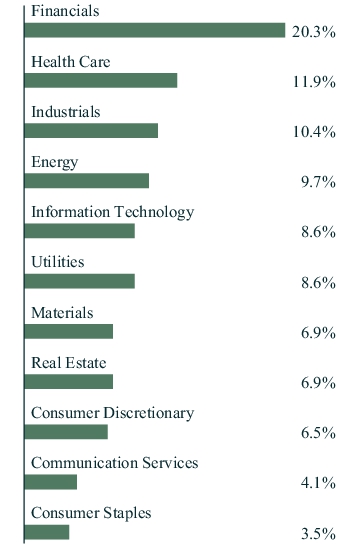
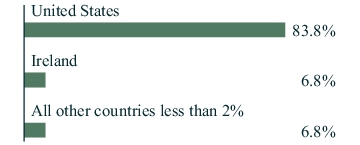
GEOGRAPHICAL ALLOCATION
TOP TEN HOLDINGS
| UnitedHealth Group, Inc. | 2.4% |
| Exxon Mobil Corp. | 2.3% |
| Wells Fargo & Co. | 1.9% |
| Entergy Corp. | 1.9% |
| Elevance Health, Inc. | 1.9% |
| Keurig Dr. Pepper, Inc. | 1.9% |
| Medtronic PLC | 1.8% |
| Willis Towers Watson PLC | 1.8% |
| Carnival Corp. | 1.8% |
| Xcel Energy, Inc. | 1.7% |
Material Fund Changes
Effective February 1, 2025, to comply with recent Securities and Exchange Commission rule amendments relating to a fund's name, the Fund modified its investment policy as follows:
Under normal circumstances, the Fund invests at least 80% of its net assets, plus any borrowings for investment purposes, in securities issued by “value companies” located in the United States.
A more detailed explanation of how the Fund defines “value companies” can be found in the Fund's prospectus. In order to satisfy notice requirements related to an investment policy change, the Fund continued to comply with both its old and new investment policies concurrently through May 1, 2025, after which time only the new investment policy applied.
This is a summary of certain changes to the Fund since October 1, 2024. For more complete information, you may review the Fund's prospectus dated February 1, 2025, at connect.rightprospectus.com/BarrowHanley or upon request at 866-260-9549 (toll free) or 312-557-5913.
This is a summary of certain changes to the Fund since October 1, 2024. For more complete information, you may review the Fund's prospectus dated February 1, 2025, at connect.rightprospectus.com/BarrowHanley or upon request at 866-260-9549 (toll free) or 312-557-5913.
This report describes changes to the Fund that occurred during the reporting period.
Fund Expenses for the Last Six Months
(Based on a hypothetical $10,000 investment)
| Fund (Class) | Cost of a $10,000 Investment | Costs paid as a percentage of a $10,000 investment |
| Barrow Hanley Emerging Markets Value Fund (Institutional Shares) |
$47 | 0.98% |
Key Fund Statistics
The following table outlines key fund statistics that you should pay attention to.
| Fund net assets | $2,958,918 |
| Total number of portfolio holdings | 62 |
| Portfolio turnover rate as of the end of the reporting period | 15.50% |
Graphical Representation of Holdings
The tables below show the investment makeup of the Fund, excluding short-term investments, represented as a percentage of the total net assets of the Fund.
TOP TEN HOLDINGS
| MediaTek, Inc. | 4.3% |
| SK Hynix, Inc. | 4.1% |
| Samsung Electro-Mechanics Co. Ltd. | 3.3% |
| China Merchants Bank Co. Ltd. - Class H | 2.8% |
| JD.com, Inc. - Class A | 2.8% |
| UPL Ltd. | 2.6% |
| Ping An Insurance Group Co. of China Ltd. - Class H | 2.6% |
| Hiwin Technologies Corp. | 2.4% |
| PTT Exploration & Production PCL - REG | 2.2% |
| Great Wall Motor Co. Ltd. - Class H | 2.1% |
SECTOR ALLOCATION
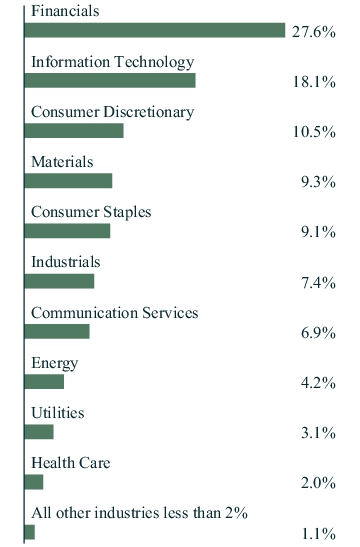
GEOGRAPHICAL ALLOCATION
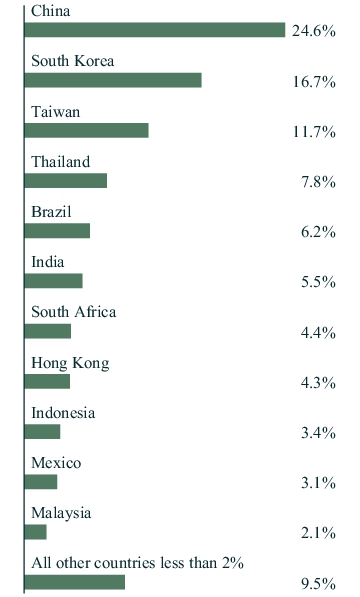
TOP TEN HOLDINGS
| MediaTek, Inc. | 4.3% |
| SK Hynix, Inc. | 4.1% |
| Samsung Electro-Mechanics Co. Ltd. | 3.3% |
| China Merchants Bank Co. Ltd. - Class H | 2.8% |
| JD.com, Inc. - Class A | 2.8% |
| UPL Ltd. | 2.6% |
| Ping An Insurance Group Co. of China Ltd. - Class H | 2.6% |
| Hiwin Technologies Corp. | 2.4% |
| PTT Exploration & Production PCL - REG | 2.2% |
| Great Wall Motor Co. Ltd. - Class H | 2.1% |
Material Fund Changes
Effective February 1, 2025, to comply with recent Securities and Exchange Commission rule amendments relating to a fund's name, the Fund modified its investment policy as follows:
Under normal circumstances, the Fund invests at least 80% of its net assets, plus any borrowings for investment purposes, in securities of “value companies” located in emerging market countries and instruments with economic characteristics similar to such securities.
A more detailed explanation of how the Fund defines “value companies” and “emerging market countries” can be found in the Fund's prospectus. In order to satisfy notice requirements related to an investment policy change, the Fund continued to comply with both its old and new investment policies concurrently through May 1, 2025, after which time only the new investment policy applied.
This is a summary of certain changes to the Fund since October 1, 2024. For more complete information, you may review the Fund's prospectus dated February 1, 2025, at connect.rightprospectus.com/BarrowHanley or upon request at 866-260-9549 (toll free) or 312-557-5913.
This is a summary of certain changes to the Fund since October 1, 2024. For more complete information, you may review the Fund's prospectus dated February 1, 2025, at connect.rightprospectus.com/BarrowHanley or upon request at 866-260-9549 (toll free) or 312-557-5913.
This report describes changes to the Fund that occurred during the reporting period.
Fund Expenses for the Last Six Months
(Based on a hypothetical $10,000 investment)
| Fund (Class) | Cost of a $10,000 Investment | Costs paid as a percentage of a $10,000 investment |
| Barrow Hanley International Value Fund (Institutional Shares) |
$47 | 0.94% |
Key Fund Statistics
The following table outlines key fund statistics that you should pay attention to.
| Fund net assets | $13,838,806 |
| Total number of portfolio holdings | 64 |
| Portfolio turnover rate as of the end of the reporting period | 19.35% |
Graphical Representation of Holdings
The tables below show the investment makeup of the Fund, excluding short-term investments, represented as a percentage of the total net assets of the Fund.
TOP TEN HOLDINGS
| Rheinmetall A.G. | 3.3% |
| Julius Baer Group Ltd. | 3.0% |
| Standard Chartered PLC | 2.8% |
| BNP Paribas S.A. | 2.8% |
| Thales S.A. | 2.4% |
| Sanofi S.A. | 2.1% |
| Snam S.p.A. | 2.0% |
| BASF S.E. | 2.0% |
| Enel S.p.A. | 2.0% |
| SCOR S.E. | 1.9% |
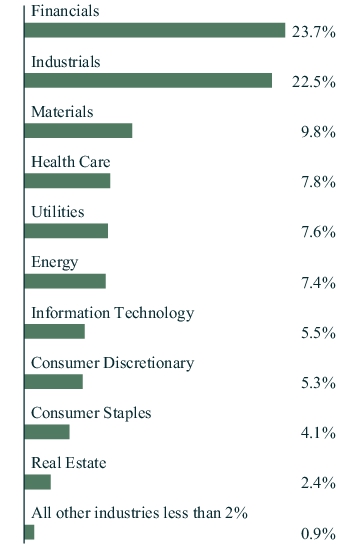
SECTOR ALLOCATION
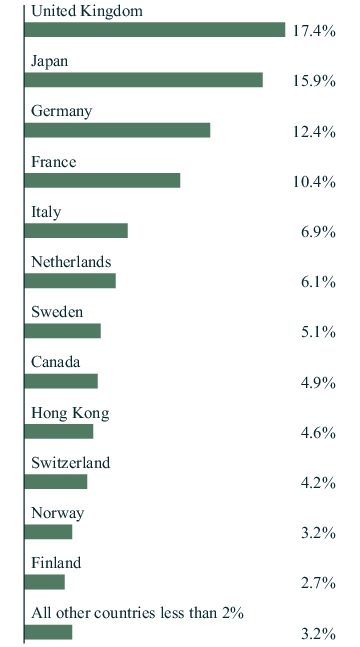
GEOGRAPHICAL ALLOCATION
TOP TEN HOLDINGS
| Rheinmetall A.G. | 3.3% |
| Julius Baer Group Ltd. | 3.0% |
| Standard Chartered PLC | 2.8% |
| BNP Paribas S.A. | 2.8% |
| Thales S.A. | 2.4% |
| Sanofi S.A. | 2.1% |
| Snam S.p.A. | 2.0% |
| BASF S.E. | 2.0% |
| Enel S.p.A. | 2.0% |
| SCOR S.E. | 1.9% |
Material Fund Changes
Effective February 1, 2025, in connection with recent Securities and Exchange Commission rule amendments relating to a fund's name, the Fund adopted a new investment policy as follows:
Under normal circumstances, the Fund invests at least 80% of its net assets, plus any borrowings for investment purposes, in securities of “value companies”.
A more detailed explanation of how the Fund defines “value companies” can be found in the Fund's prospectus.
This is a summary of certain changes to the Fund since October 1, 2024. For more complete information, you may review the Fund's prospectus dated February 1, 2025, at connect.rightprospectus.com/BarrowHanley or upon request at 866-260-9549 (toll free) or 312-557-5913.
This is a summary of certain changes to the Fund since October 1, 2024. For more complete information, you may review the Fund's prospectus dated February 1, 2025, at connect.rightprospectus.com/BarrowHanley or upon request at 866-260-9549 (toll free) or 312-557-5913.