Shareholder Report
Mar. 31, 2025
USD ($)
Holding
Fund Expenses for the Last Six Months
(Based on a hypothetical $10,000 investment)
| Fund (Class) | Cost of a $10,000 investment | Costs paid as a percentage of a $10,000 investment |
| TSW Emerging Markets Fund (Institutional Shares) |
$49 | 0.99% |
Key Fund Statistics
The following table outlines key fund statistics that you should pay attention to.
| Fund net assets | $7,929,501 |
| Total number of portfolio holdings | 64 |
| Portfolio turnover rate as of the end of the reporting period | 19.20% |
Graphical Representation of Holdings
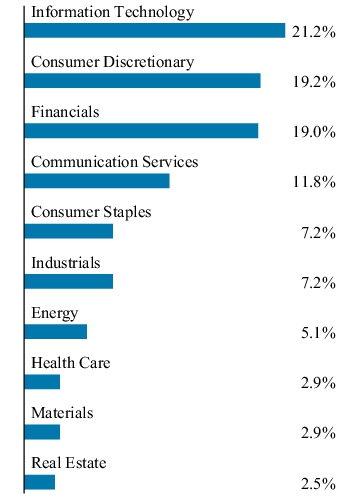
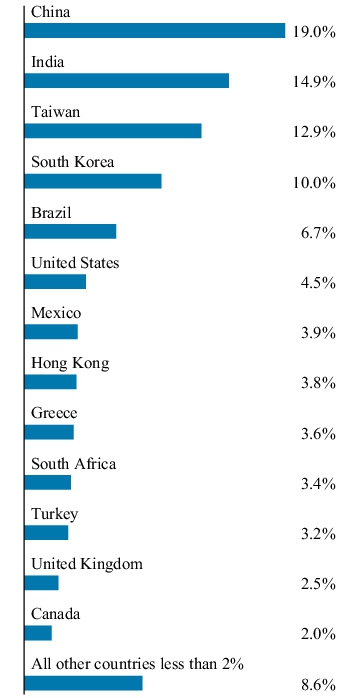
The tables below show the investment makeup of the Fund, excluding short-term investments, represented as a percentage of the total net assets of the Fund.
TOP TEN HOLDINGS
| Taiwan Semiconductor Manufacturing Co. Ltd. | 8.6% |
| Tencent Holdings Ltd. | 5.7% |
| Alibaba Group Holding Ltd. | 4.6% |
| Naspers Ltd. - Class N | 3.4% |
| ICICI Bank Ltd. - ADR | 3.3% |
| Samsung Electronics Co. Ltd. | 3.2% |
| NetEase, Inc. | 3.2% |
| HDFC Bank Ltd. | 2.1% |
| AIA Group Ltd. | 2.1% |
| Fairfax India Holdings Corp. | 2.0% |
SECTOR ALLOCATION
GEOGRAPHICAL ALLOCATION
TOP TEN HOLDINGS
| Taiwan Semiconductor Manufacturing Co. Ltd. | 8.6% |
| Tencent Holdings Ltd. | 5.7% |
| Alibaba Group Holding Ltd. | 4.6% |
| Naspers Ltd. - Class N | 3.4% |
| ICICI Bank Ltd. - ADR | 3.3% |
| Samsung Electronics Co. Ltd. | 3.2% |
| NetEase, Inc. | 3.2% |
| HDFC Bank Ltd. | 2.1% |
| AIA Group Ltd. | 2.1% |
| Fairfax India Holdings Corp. | 2.0% |
Fund Expenses for the Last Six Months
(Based on a hypothetical $10,000 investment)
| Fund (Class) | Cost of a $10,000 investment | Costs paid as a percentage of a $10,000 investment |
| TSW High Yield Bond Fund (Institutional Shares) |
$33 | 0.65% |
Key Fund Statistics
The following table outlines key fund statistics that you should pay attention to.
| Fund net assets | $9,543,942 |
| Total number of portfolio holdings | 63 |
| Portfolio turnover rate as of the end of the reporting period | 25.01% |
Graphical Representation of Holdings
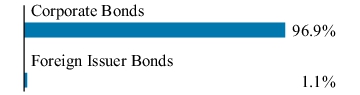
The tables below show the investment makeup of the Fund, excluding short-term investments, represented as a percentage of the total net assets of the Fund.
TOP TEN HOLDINGS
| Fortress Transportation and Infrastructure Investors LLC, 7.00%, 06/15/32 | 3.2% |
| Bath & Body Works, Inc., 6.88%, 11/01/35 | 3.2% |
| Gen Digital, Inc., 6.25%, 04/01/33 | 2.6% |
| Markel Group, Inc., 6.00%, 06/01/25 | 2.6% |
| Iron Mountain, Inc., 6.25%, 01/15/33 | 2.6% |
| StoneX Group, Inc., 7.88%, 03/01/31 | 2.5% |
| JB Poindexter & Co., Inc., 8.75%, 12/15/31 | 2.1% |
| Burford Capital Global Finance LLC, 6.25%, 04/15/28 | 2.1% |
| Installed Building Products, Inc., 5.75%, 02/01/28 | 2.1% |
| Post Holdings, Inc., 6.38%, 03/01/33 | 2.1% |
ASSET TYPE ALLOCATION
TOP TEN HOLDINGS
| Fortress Transportation and Infrastructure Investors LLC, 7.00%, 06/15/32 | 3.2% |
| Bath & Body Works, Inc., 6.88%, 11/01/35 | 3.2% |
| Gen Digital, Inc., 6.25%, 04/01/33 | 2.6% |
| Markel Group, Inc., 6.00%, 06/01/25 | 2.6% |
| Iron Mountain, Inc., 6.25%, 01/15/33 | 2.6% |
| StoneX Group, Inc., 7.88%, 03/01/31 | 2.5% |
| JB Poindexter & Co., Inc., 8.75%, 12/15/31 | 2.1% |
| Burford Capital Global Finance LLC, 6.25%, 04/15/28 | 2.1% |
| Installed Building Products, Inc., 5.75%, 02/01/28 | 2.1% |
| Post Holdings, Inc., 6.38%, 03/01/33 | 2.1% |
This report describes changes to the Fund that occurred during the reporting period.
Fund Expenses for the Last Six Months
(Based on a hypothetical $10,000 investment)
| Fund (Class) | Cost of a $10,000 investment | Costs paid as a percentage of a $10,000 investment |
| TSW Large Cap Value Fund (Institutional Shares) |
$37 | 0.73% |
Key Fund Statistics
The following table outlines key fund statistics that you should pay attention to.
| Fund net assets | $37,758,677 |
| Total number of portfolio holdings | 41 |
| Portfolio turnover rate as of the end of the reporting period | 26.80% |
Graphical Representation of Holdings
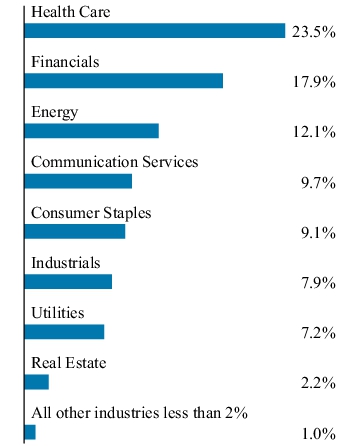
The tables below show the investment makeup of the Fund, excluding short-term investments, represented as a percentage of the total net assets of the Fund.
TOP TEN HOLDINGS
| Anheuser-Busch InBev S.A./N.V. - ADR | 4.7% |
| Kraft Heinz (The) Co. | 4.4% |
| Dominion Energy, Inc. | 4.3% |
| CVS Health Corp. | 3.4% |
| Hess Corp. | 3.4% |
| Liberty Broadband Corp. - Class C | 3.4% |
| McKesson Corp. | 3.2% |
| Bayer A.G. - ADR | 3.2% |
| Evergy, Inc. | 2.9% |
| Kinder Morgan, Inc. | 2.8% |
SECTOR ALLOCATION
GEOGRAPHICAL ALLOCATION
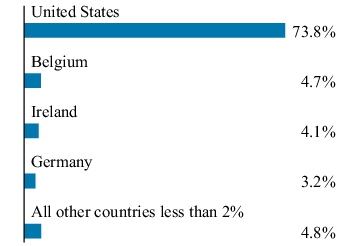
TOP TEN HOLDINGS
| Anheuser-Busch InBev S.A./N.V. - ADR | 4.7% |
| Kraft Heinz (The) Co. | 4.4% |
| Dominion Energy, Inc. | 4.3% |
| CVS Health Corp. | 3.4% |
| Hess Corp. | 3.4% |
| Liberty Broadband Corp. - Class C | 3.4% |
| McKesson Corp. | 3.2% |
| Bayer A.G. - ADR | 3.2% |
| Evergy, Inc. | 2.9% |
| Kinder Morgan, Inc. | 2.8% |
Material Fund Changes
Effective February 1, 2025, to comply with recent Securities and Exchange Commission rule amendments relating to a fund's name, the TSW Large Cap Value Fund modified its investment policy as follows:
The Fund invests, under normal circumstances, at least 80% of its net assets (plus the amount of any borrowings for investment purposes) in equity securities of “value companies” with large market capitalizations.
A more detailed explanation of how the Fund defines “value companies” and “large market capitalizations” can be found in the Fund's prospectus. In order to satisfy notice requirements related to an investment policy change, the Fund continued to comply with both its old and new investment policies concurrently through May 1, 2025, after which time only the new investment policy applied.
This is a summary of certain changes to the Fund since September 30, 2024. For more complete information, you may review the Fund's prospectus dated February 1, 2025, at connect.rightprospectus.com/JOHCM/ or upon request at 866-260-9549 (toll free) or 312-557-5913.
This is a summary of certain changes to the Fund since September 30, 2024. For more complete information, you may review the Fund's prospectus dated February 1, 2025, at connect.rightprospectus.com/JOHCM/ or upon request at 866-260-9549 (toll free) or 312-557-5913.
Fund Expenses for the Last Six Months
(Based on a hypothetical $10,000 investment)
| Fund (Class) | Cost of a $10,000 investment | Costs paid as a percentage of a $10,000 investment |
| TSW Core Plus Bond Fund (Institutional Shares) |
$25 | 0.50% |
Key Fund Statistics
The following table outlines key fund statistics that you should pay attention to.
| Fund net assets | $67,427,776 |
| Total number of portfolio holdings | 121 |
| Portfolio turnover rate as of the end of the reporting period | 13.60% |
Graphical Representation of Holdings
The tables below show the investment makeup of the Fund, excluding short-term investments, represented as a percentage of the total net assets of the Fund.
TOP TEN HOLDINGS
| U.S. Treasury Notes, 3.88%, 08/15/34 | 4.7% |
| Fannie Mae Pool #MA5313, 5.50%, 03/01/44 | 4.3% |
| U.S. Treasury Bonds, 4.13%, 08/15/44 | 3.3% |
| U.S. Treasury Notes, 4.13%, 11/15/32 | 3.1% |
| Fannie Mae Pool #MA5498, 6.00%, 10/01/54 | 3.0% |
| U.S. Treasury Notes, 4.00%, 01/15/27 | 2.5% |
| U.S. Treasury Notes, 4.13%, 10/31/31 | 2.4% |
| Freddie Mac Pool #SD8233, 5.00%, 07/01/52 | 2.3% |
| U.S. Treasury Notes, 3.50%, 09/30/26 | 2.2% |
| U.S. Treasury Bonds, 4.25%, 08/15/54 | 2.1% |
ASSET TYPE ALLOCATION
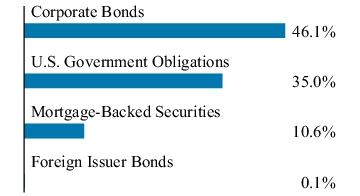
TOP TEN HOLDINGS
| U.S. Treasury Notes, 3.88%, 08/15/34 | 4.7% |
| Fannie Mae Pool #MA5313, 5.50%, 03/01/44 | 4.3% |
| U.S. Treasury Bonds, 4.13%, 08/15/44 | 3.3% |
| U.S. Treasury Notes, 4.13%, 11/15/32 | 3.1% |
| Fannie Mae Pool #MA5498, 6.00%, 10/01/54 | 3.0% |
| U.S. Treasury Notes, 4.00%, 01/15/27 | 2.5% |
| U.S. Treasury Notes, 4.13%, 10/31/31 | 2.4% |
| Freddie Mac Pool #SD8233, 5.00%, 07/01/52 | 2.3% |
| U.S. Treasury Notes, 3.50%, 09/30/26 | 2.2% |
| U.S. Treasury Bonds, 4.25%, 08/15/54 | 2.1% |