| Energy Fuels Inc. | Bullfrog Project | May 9, 2025 |
| Technical Report | SLR Project No.: 123.V02544.00008 |
Technical Report, Bullfrog Project, Garfield County, Utah, USA
SLR Project No.: 123.V02544.00008
Prepared by
SLR International Corporation
1658 Cole Blvd, Suite 100
Lakewood, CO 80401
for
Energy Fuels Inc.
225 Union Blvd., Suite 600
Lakewood, CO 80229
USA
Effective Date - December 31, 2024
Signature Date - May 9, 2025
| Prepared by: Stuart Collins, P.E. Jeffrey L. Woods, MMSA QP Lee (Pat) Gochnour, MMSA (QP) Mark B. Mathisen, C.P.G. Grant Malensek, M.Eng., P.Eng. Tedros Tesfay, Ph.D, SME (RM). Peer Reviewed by: Murray Dunn, P.Eng. Grant Malensek, M.Eng., P.Eng. |
Approved by: Project Manager Mark B. Mathisen, C.P.G. Project Director Grant Malensek, M.Eng., P.Eng. |
 |
| Energy Fuels Inc. | Bullfrog Project | May 9, 2025 |
| Technical Report | SLR Project No.: 123.V02544.00008 |
Table of Contents
| 1.0 Summary | 1-1 |
| 1.1 Executive Summary | 1-1 |
| 1.2 Economic Analysis | 1-8 |
| 1.3 Technical Summary | 1-15 |
| 2.0 Introduction | 2-1 |
| 2.1 Sources of Information | 2-2 |
| 2.2 List of Abbreviations | 2-4 |
| 3.0 Reliance on Other Experts | 3-1 |
| 3.1 Reliance on Information Provided by the Registrant | 3-1 |
| 4.0 Property Description and Location | 4-1 |
| 4.1 Location | 4-1 |
| 4.2 Land Tenure | 4-1 |
| 4.3 Required Permits and Status | 4-12 |
| 4.4 Royalties | 4-12 |
| 4.5 Other Significant Risks | 4-12 |
| 5.0 Accessibility, Climate, Local Resources, Infrastructure and Physiography | 5-1 |
| 5.1 Accessibility | 5-1 |
| 5.2 Vegetation | 5-1 |
| 5.3 Climate | 5-1 |
| 5.4 Local Resources | 5-1 |
| 5.5 Infrastructure | 5-1 |
| 5.6 Physiography | 5-1 |
| 6.0 History | 6-1 |
| 6.1 Prior Ownership | 6-1 |
| 6.2 Exploration and Development History | 6-2 |
| 6.3 Past Production | 6-3 |
| 7.0 Geological Setting and Mineralization | 7-1 |
| 7.1 Regional Geology | 7-1 |
| 7.2 Local Geology | 7-1 |
| 7.3 Mineralization | 7-7 |
| 8.0 Deposit Types | 8-1 |
| 9.0 Exploration | 9-1 |
| 9.1 Hydrogeology | 9-1 |
| i | |
| Energy Fuels Inc. | Bullfrog Project | May 9, 2025 |
| Technical Report | SLR Project No.: 123.V02544.00008 |
| 10.0 Drilling | 10-1 |
| 10.1 Historical Bullfrog Drilling | 10-1 |
| 10.2 Core Drilling | 10-1 |
| 11.0 Sample Preparation, Analyses, and Security | 11-1 |
| 11.1 Sample Preparation, Analyses, and Security | 11-1 |
| 11.2 Sample Security | 11-4 |
| 11.3 Quality Assurance and Quality Control | 11-4 |
| 11.4 Conclusions | 11-5 |
| 12.0 Data Verification | 12-1 |
| 12.1 RPA Henry Mountain Complex Data Review (2012) | 12-1 |
| 12.2 EFR-AMEC Bullfrog Deposit Data Review (2016) | 12-2 |
| 12.3 SLR Data Verification (2021) | 12-3 |
| 12.4 SLR Data Verification (2024) | 12-3 |
| 12.5 Limitations | 12-4 |
| 13.0 Mineral Processing and Metallurgical Testing | 13-1 |
| 13.1 Metallurgical Testing | 13-1 |
| 13.2 Opinion of Adequacy | 13-2 |
| 14.0 Mineral Resource Estimates | 14-1 |
| 14.1 Summary | 14-1 |
| 14.2 Resource Database | 14-2 |
| 14.3 Geological Interpretation | 14-3 |
| 14.4 Exploratory Data Analysis | 14-8 |
| 14.5 Treatment of High-Grade Assays | 14-8 |
| 14.6 Compositing | 14-8 |
| 14.7 Trend Analysis | 14-10 |
| 14.8 Bulk Density | 14-12 |
| 14.9 Block Model | 14-13 |
| 14.10 Search Strategy and Grade Interpolation Parameters | 14-13 |
| 14.11 Reasonable Prospects for Eventual Economic Extraction for Mineral Resources | 14-15 |
| 14.12 Classification | 14-18 |
| 14.13 Estimation Validation | 14-20 |
| 14.14 Grade Tonnage Sensitivity | 14-25 |
| 14.15 Mineral Resource Reporting | 14-28 |
| 15.0 Mineral Reserve Estimates | 15-1 |
| ii | |
| Energy Fuels Inc. | Bullfrog Project | May 9, 2025 |
| Technical Report | SLR Project No.: 123.V02544.00008 |
| 16.0 Mining Methods | 16-1 |
| 16.1 Mine Design | 16-1 |
| 16.2 Mining Method | 16-13 |
| 16.3 Life of Mine Plan | 16-17 |
| 16.4 Mine Ventilation | 16-24 |
| 16.4.1 Radon Gas | 16-24 |
| 16.4.2 Stope Access and Ventilation Sequencing | 16-24 |
| 16.5 Mine Infrastructure | 16-27 |
| 16.6 Mine Equipment | 16-30 |
| 17.0 Recovery Methods | 17-1 |
| 17.1 Introduction | 17-1 |
| 17.2 Ore Receiving | 17-1 |
| 17.3 Grinding | 17-1 |
| 17.4 Leaching | 17-1 |
| 17.5 Counter Current Decantation | 17-2 |
| 17.6 Solvent Extraction | 17-2 |
| 17.7 Precipitation, Drying and Packaging | 17-3 |
| 17.8 Mill Upgrades | 17-7 |
| 17.9 Process Design Criteria | 17-7 |
| 17.10 Mill Water Supply | 17-7 |
| 17.11 Power | 17-7 |
| 18.0 Project Infrastructure | 18-1 |
| 18.1 Mine Access Roads | 18-1 |
| 18.2 Power | 18-1 |
| 18.3 Water | 18-1 |
| 18.4 Accommodation Camp | 18-1 |
| 19.0 Market Studies and Contracts | 19-1 |
| 19.1 Markets | 19-1 |
| 19.2 Contracts | 19-3 |
| 20.0 Environmental Studies, Permitting, and Social or Community Impact | 20-1 |
| 20.1 Environmental Studies | 20-1 |
| 20.2 Project Permitting | 20-5 |
| 20.3 Social or Community Requirements | 20-7 |
| 20.4 Mine Closure Requirements | 20-8 |
| iii | |
| Energy Fuels Inc. | Bullfrog Project | May 9, 2025 |
| Technical Report | SLR Project No.: 123.V02544.00008 |
| 20.5 QP Opinion | 20-8 |
| 21.0 Capital and Operating Costs | 21-1 |
| 21.1 Capital Costs | 21-1 |
| 21.2 Operating Costs | 21-3 |
| 22.0 Economic Analysis | 22-1 |
| 22.1 Base Case - Indicated and Inferred Resources | 22-1 |
| 22.2 Alternative Case - Indicated Only | 22-6 |
| 23.0 Adjacent Properties | 23-1 |
| 23.1 Tony M Property | 23-1 |
| 23.2 Frank M Deposit | 23-1 |
| 23.3 Lucky Strike 10 Deposit | 23-2 |
| 24.0 Other Relevant Data and Information | 24-1 |
| 25.0 Interpretation and Conclusions | 25-1 |
| 25.1 Geology and Mineral Resources | 25-1 |
| 25.2 Mining and Mineral Reserves | 25-1 |
| 25.3 Mineral Processing | 25-2 |
| 25.4 Infrastructure | 25-3 |
| 25.5 Environment | 25-3 |
| 25.6 Capital and Operating Costs | 25-4 |
| 26.0 Recommendations | 26-1 |
| 26.1 Geology and Mineral Resources | 26-1 |
| 26.2 Mining and Mineral Reserves | 26-2 |
| 26.3 Mineral Processing | 26-2 |
| 26.4 Infrastructure | 26-2 |
| 26.5 Environment | 26-3 |
| 26.6 Capital and Operating Costs | 26-3 |
| 27.0 References | 27-1 |
| 28.0 Date and Signature Date | 28-1 |
| 29.0 Certificate of Qualified Person | 29-1 |
| 29.1 Grant A. Malensek | 29-1 |
| 29.2 Mark B. Mathisen | 29-3 |
| 29.3 Stuart Collins, P.E. | 29-4 |
| 29.4 Jeffrey L. Woods | 29-6 |
| 29.5 Lee (Pat) Gochnour | 29-8 |
| iv | |
| Energy Fuels Inc. | Bullfrog Project | May 9, 2025 |
| Technical Report | SLR Project No.: 123.V02544.00008 |
| 29.6 Tedros Tesfay | 29-9 |
| 30.0 Appendix | 30-1 |
Tables
| Table 1-1: Proposed Energy Fuels 2025 Budget - Bullfrog Project | 1-5 |
| Table 1-2: Base Case After-Tax Cash Flow Summary | 1-9 |
| Table 1-3: Alternative Case After-Tax Cash Flow Summary | 1-12 |
| Table 1-4: Summary of Mineral Resources - Bullfrog Project - December 31, 2024 | 1-17 |
| Table 1-5: Key Bullfrog Life of Mine Production Statistics | 1-20 |
| Table 1-6: LOM Capital Cost Summary | 1-22 |
| Table 1-7: LOM Operating Unit Costs Summary | 1-22 |
| Table 2-1: Summary of QP Responsibilities | 2-2 |
| Table 4-1: List of Claims held by Energy Fuels | 4-2 |
| Table 7-1: Naming Convention of the Mineralized Sands for the Henry Mountains Complex | 7-7 |
| Table 7-2: Minor Element Concentrations of Various Rock Composites | 7-9 |
| Table 11-1: Plateau Disequilibrium Study | 11-3 |
| Table 11-2: Statistics for Project and Twin Database Holes | 11-5 |
| Table 13-1: Comparison of Composite Head Analyses with Calculated Head Grade Analyses | 13-1 |
| Table 14-1: Summary of Mineral Resources as at December 31, 2024 | 14-2 |
| Table 14-2: Summary of Drill Hole Data used in Mineral Resource Estimation | 14-3 |
| Table 14-3: Assays for Bullfrog (% eU3O8) | 14-8 |
| Table 14-4: Summary of Uranium Composite Data by Area | 14-9 |
| Table 14-5: Variogram Values | 14-10 |
| Table 14-6: Summary of Block Model Setup | 14-13 |
| Table 14-7: Summary of Block Model Variables | 14-13 |
| Table 14-8: Sample Selection Parameters Employed in the Estimation by Domain | 14-14 |
| Table 14-9: Stope Optimization Parameters | 14-15 |
| Table 14-10: Assumptions for Underground RPEEE | 14-15 |
| Table 14-11: Mean Composite Grades Compared to the Mean Block Estimates | 14-20 |
| Table 14-12: Indicated Mineral Resource Grade versus Tons at Various Cut-Off Grades | 14-26 |
| Table 14-13: Inferred Mineral Resource Grade versus Tons at Various Cut-Off Grades | 14-27 |
| Table 14-14: Summary of Mineral Resources - Bullfrog Project -December 31, 2024 | 14-29 |
| v | |
| Energy Fuels Inc. | Bullfrog Project | May 9, 2025 |
| Technical Report | SLR Project No.: 123.V02544.00008 |
| Table 16-1: Maximum Allowable Hydraulic Radius For Unsupported And Supported Open Rooms For Various Strength Roof Rocks | 16-6 |
| Table 16-2: Recommended Rock Bolt Parameters in Low Strength Ground Conditions | 16-6 |
| Table 16-3: Summary of Ground Support Parameters for Long-Term Primary and Stope Access Development | 16-11 |
| Table 16-4: Assumed Distribution Of Anticipated Ground Condition For Different Operational Conditions | 16-12 |
| Table 16-5: Summary Cycle Time for 12-ft x 12-ft Heading (Single-Face Decline) | 16-15 |
| Table 16-7: Base Case LOM Mining Schedule | 16-20 |
| Table 16-8: Alternative Case LOM Mining Schedule | 16-23 |
| Table 16-9: Mine Surface Infrastructure Space Requirements - Buildings/Areas | 16-27 |
| Table 16-10: Bullfrog Mine Equipment Summary | 16-30 |
| Table 17-1: Principal Process Operation Criteria | 17-7 |
| Table 17-3: White Mesa Mill Operating Load Rating | 17-8 |
| Table 20-1: Federally Listed Potential Threatened and Endangered Species Which May Impact the Bullfrog Mine | 20-2 |
| Table 20-2: State of Utah, Garfield County, Sensitive Species with Potential Habitat in the Project Area | 20-4 |
| Table 21-1: LOM Direct Capital Cost Summary | 21-2 |
| Table 21-2: LOM Capital Cost Summary | 21-2 |
| Table 21-3: LOM Operating Unit Costs Summary | 21-4 |
| Table 21-4: Staff Requirements | 21-4 |
| Table 22-1: Base Case After-Tax Cash Flow Summary | 22-2 |
| Table 22-2: Base Case After-Tax Sensitivity Analyses | 22-5 |
| Table 22-3: Alternative Case After-Tax Cash Flow Summary | 22-7 |
| Table 22-4: Alternative Case (Indicated Only) After-Tax Sensitivity Analyses | 22-10 |
| Table 26-1: Proposed Energy Fuels 2025 Budget - Bullfrog Project | 26-1 |
Figures
| Figure 1-1: Base Case Payable U3O8 | 1-11 |
| Figure 1-2: Alternative Case Payable U3O8 | 1-15 |
| Figure 4-1: Location Map | 4-10 |
| Figure 4-2: Land Tenure Map | 4-11 |
| Figure 7-1: Regional Geologic Map | 7-4 |
| Figure 7-2: Regional Stratigraphic Column | 7-5 |
| vi | |
| Energy Fuels Inc. | Bullfrog Project | May 9, 2025 |
| Technical Report | SLR Project No.: 123.V02544.00008 |
| Figure 7-3: Detail of the Lower Portion of the Lower Rim of the Salt Wash Member | 7-6 |
| Figure 9-1: Potentiometric Surface of the Navajo Sandston | 9-4 |
| Figure 10-1: Bullfrog Drill Hole Location Map | 10-2 |
| Figure 14-1: Bullfrog Numerical Grade Contour Model | 14-4 |
| Figure 14-2: Bullfrog Numerical Grade Contour Model showing 0.01% U3O8 Cut-off Boundary | 14-5 |
| Figure 14-3: Bullfrog Final AOI (0.01% eU3O8) Mineralized Domain Model | 14-7 |
| Figure 14-4: Bullfrog Histogram of Sample Lengths in the Estimation Domains | 14-9 |
| Figure 14-5: Major Axis Variogram | 14-11 |
| Figure 14-6: Semi-Major Axis Variogram | 14-11 |
| Figure 14-7: Minor Axis Variogram | 14-12 |
| Figure 14-8: Bullfrog MSO Shapes | 14-17 |
| Figure 14-9: Upper Cross Section 1873400 E | 14-21 |
| Figure 14-10: Upper Long Section 10259300 N | 14-22 |
| Figure 14-11: Trend Plot X (East) Direction | 14-23 |
| Figure 14-12: Trend Plot Y (North) Direction | 14-24 |
| Figure 14-13: Trend Plot Z (Vertical) Direction | 14-24 |
| Figure 14-14: Indicated Grade versus Tonnage | 14-26 |
| Figure 14-15: Inferred Grade versus Tonnage | 14-27 |
| Figure 16-1: Hydraulic Radius versus Modified Stability Number (N′) for Unsupported Case Histories | 16-4 |
| Figure 16-2: Hydraulic Radius versus Modified Stability Number (N′) for Supported Case Histories | 16-5 |
| Figure 16-3: Estimated Support Categories Based on the Tunnelling Quality Index Q | 16-8 |
| Figure 16-4: Critical Span Curve for Weak Rock Mass | 16-9 |
| Figure 16-5: Relationship Between Stand-up Time, Span and RMR Classification | 16-10 |
| Figure 16-6: Bullfrog MSO Shapes | 16-19 |
| Figure 16-7: Base Case LOM Schedule of Activities | 16-22 |
| Figure 16-9: Surface Facilities Layout | 16-29 |
| Figure 17-1: White Mesa Mill Location | 17-4 |
| Figure 17-2: White Mesa Mill Facility Layout | 17-5 |
| Figure 17-3: White Mesa Mill Flowsheet | 17-6 |
| Figure 19-1: Long Term Uranium Price Forecast | 19-2 |
| Figure 22-1: Base Case Payable U3O8 | 22-3 |
| Figure 22-2: Base Case After-Tax Sensitivity Analysis | 22-6 |
| vii | |
| Energy Fuels Inc. | Bullfrog Project | May 9, 2025 |
| Technical Report | SLR Project No.: 123.V02544.00008 |
| Figure 22-3: Alternative Case Payable U3O8 | 22-9 |
| Figure 22-4: Alternative Case After-Tax Sensitivity Analysis | 22-11 |
Appendix Tables
| Table 30-1: Base Case After-Tax Cash Flow Summary | 30-2 |
| Table 30-2: Alternative Case After-Tax Cash Flow Summary | 30-4 |
| viii | |
| Energy Fuels Inc. | Bullfrog Project | May 9, 2025 |
| Technical Report | SLR Project No.: 123.V02544.00008 |
1.0 Summary
1.1 Executive Summary
SLR International Corporation (SLR) was retained by Energy Fuels Inc. (Energy Fuels) to prepare an independent Technical Report on the Bullfrog Project (Bullfrog or the Project), located in Garfield County, Utah, USA. Energy Fuels is the parent company of Energy Fuels Resources (USA) Inc. (EFR), which owns 100% of the Project. EFR is a US-based uranium and vanadium exploration and mine development company. Energy Fuels is listed on the NYSE American Stock Exchange (symbol: UUUU) and the Toronto Stock Exchange (symbol: EFR).
This Technical Report satisfies the requirements of Canadian National Instrument 43-101 Standards of Disclosure for Mineral Projects (NI 43-101) and United States Securities and Exchange Commission's (SEC) Modernized Property Disclosure Requirements for Mining Registrants as described in Subpart 229.1300 of Regulation S-K, Disclosure by Registrants Engaged in Mining Operations (S-K 1300) and Item 601 (b)(96) Technical Report Summary.
The purpose of this report is to disclose the results of a Preliminary Economic Assessment (PEA). The term PEA is used throughout this Technical Report and is consistent with an Initial Assessment (IA) under S-K 1300.
This report was prepared by Stuart Collins, P.E., Jeffrey L. Woods, MMSA QP, Lee (Pat) Gochnour, MMSA QP, Mark B. Mathisen, C.P.G., Grant A. Malensek, M.Eng., P.Eng., and Tedros Tesfay, SME (RM), all of whom are Qualified Persons (QP) within the meaning of both S-K 1300 and NI 43-101 (SLR QP). Messrs. Mathisen, Miranda, and Collins visited the Project on July 15 to 18, 2024.
Bullfrog consists of two contiguous sandstone-type uranium deposits, Copper Bench and Indian Bench, within the Colorado Plateau physiographic province in southwestern Utah. The Colorado Plateau has been a relatively stable structural province since the end of the Precambrian. During the Paleozoic and Mesozoic eras, the Colorado Plateau was a stable shelf without major geosynclinal areas of deposition, except during the Pennsylvanian when several thousand feet of black shales and evaporates accumulated in the Paradox Basin of southwestern Colorado and adjacent Utah.
The Project is situated in the southeastern flank of the Henry Mountains Basin, a subprovince of the Colorado Plateau physiographic province. The Henry Mountains Basin is an elongate north-south trending doubly plunging syncline in the form of a closed basin. It is surrounded by the Monument Uplift to the southeast, Circle Cliffs Uplift to the southwest, and the San Rafael Swell to the north.
The Project is currently being developed in preparation for production as an underground operation, from which the mineralized material will be processed based on a toll milling agreement at Energy Fuels' White Mesa Mill, located near Blanding, Utah, approximately 127 road miles (mi) south of the Project. Environmental permitting and compliance activities are being developed to start mining operations.
| 1-1 | |
| Energy Fuels Inc. | Bullfrog Project | May 9, 2025 |
| Technical Report | SLR Project No.: 123.V02544.00008 |
1.1.1 Conclusions
The SLR QPs offer the following conclusions by area:
1.1.1.1 Geology and Mineral Resources
• The Bullfrog deposit is considered a tabular sandstone hosted uranium deposit.
• The Project is an advanced exploration stage property, 100% owned by EFR. The Project is in a region with a well-developed mining industry and is close to necessary infrastructure and resources.
• As of the effective date of this Technical Report, historical records of EFR predecessors indicate that approximately 1,694 drill holes have been completed on the Bullfrog deposit. Of the 1,694 drill holes, 949 drill holes totaling 910,780 ft of drilling were used in this Mineral Resource estimate Historical surface holes missing collar information, lithology information, or corresponding radiometric logs, i.e., assay data, were excluded.
• In the SLR QP's opinion, the drill hole logging and sampling procedures meet industry standards and are adequate for Mineral Resource estimation. The SLR QP is not aware of any drilling, sampling, or recovery factors that could materially impact the accuracy and reliability of the results.
• Mineral Resources have been classified in accordance with the definitions for Mineral Resources in S-K 1300, which are consistent with Canadian Institute of Mining, Metallurgy and Petroleum (CIM) Definition Standards for Mineral Resources and Mineral Reserves dated May 10, 2014 (CIM, 2014) definitions which are incorporated by reference in NI 43-101.
• In the SLR QP's opinion, the assumptions, parameters, and methodology used for the Bullfrog Mineral Resource estimate is appropriate for the style of mineralization and mining methods.
• The SLR QP considers the estimation procedures employed at Bullfrog, including compositing, top-cutting, variography, block model construction, and interpolation to be reasonable and in line with industry standard practice.
• The SLR QP is of the opinion the block models are adequate for public disclosure and to support mining activities. The effective date of the Mineral Resource estimate is December 31, 2024.
• The SLR QP considers that the knowledge of the deposit setting, lithologies, structural controls on mineralization, and the mineralization style and setting, is sufficient to support the MRE to the level of classification assigned.
• The SLR QP considers that the resource cut-off grade and mining shapes used to identify those portions of the Mineral Resource that meet the requirement for the reasonable prospects for economic extraction to be appropriate for this style of uranium deposit and mineralization.
1.1.1.2 Mining and Mineral Reserves
• There are no current Mineral Reserves at the Project.
• Mineralization is hosted in the relatively flat laying Salt Wash Member of the Westwater formation at depths below the surface of 500 ft to 1,200 ft.
| 1-2 | |
| Energy Fuels Inc. | Bullfrog Project | May 9, 2025 |
| Technical Report | SLR Project No.: 123.V02544.00008 |
• The Bullfrog Project is composed of the Copper Bench (southeast) and the Indian Bench (northwest) mining areas.
• The mining areas will be accessed by a 13,520-ft long adit decline to the underground mine.
• The mine life comprises a four-year pre-production period and a 15-year active mine life (Base Case) across eight intertwined mining zones (zone 1 through zone 8). The Alternative Case active mine life is 12 years.
• The primary mining methods to employed at Bullfrog will be room and pillar, drift and fill, and split-shot. EFR is acutely aware of the need to keep dilution low given the high cost of transportation and treatment. EFR has many mines with similar geological and mining attributes to Bullfrog. EFR has employed the above-mentioned mining methods at their other underground operations.
• A minimum mining thickness of four feet was applied to two-foot-thick mining blocks.
• Stope dilution was calculated to be 28%.
• An 85% mining recovery was applied to the Mineral Resource mining stopes.
• Groundwater inflow to the mine workings is expected to be between 20 gallons per minute (gpm) to 50 gpm; further hydrogeological modelling and analysis is required to confirm this. The SLR QP has accounted for dewatering wells for depressurization of the mine workings in the capital and operating costs.
• The Base Case mine plan includes 1.8 million tons (Mton) at an average grade of 0.28% eU3O8, containing 9.7 million pounds (Mlb) of eU3O8. Approximately 20% of the tonnage included in the Base Case is categorized as Inferred Resources. The Alternative Case, which comprises Indicated Resources only, includes 1.5 Mton at an average grade of 0.27 eU3O8, containing 7.7 Mlb of eU3O8.
• It is envisioned that Bullfrog will supply approximately 10,000 tons of mineralized material a month (120,000 tons per year (tpa)) to EFR's White Mesa Mill located six miles south of Blanding, Utah, approximately 127 miles south of the Bullfrog mine. The White Mesa Mill is the only active, operating uranium mill in the United States.
1.1.1.3 Mineral Processing
• The Bullfrog mineralized material will be toll milled at the existing White Mesa Mill in Utah. Mineralized material will be transported by haul trucks to the White Mesa Mill.
• The Mill has been in operation since 1981 and is equipped with the required equipment using a proven process for the production of uranium oxide (U3O8) product, called "yellowcake". In addition, although it is not part of the production schedule in this Technical Report, the Mill also has the capacity to produce vanadium pentoxide (V2O5).
• Mill operations can receive run-of-mine (ROM) material from the Bullfrog Project and various other EFR mines. Material will be dumped from trucks onto a mineralized material pad at the Mill and stockpiled by type to be blended as needed. Material will be weighed, sampled, and probed for uranium grade. The mineralized material pad area has an approximate capacity of 450,000 tons.
| 1-3 | |
| Energy Fuels Inc. | Bullfrog Project | May 9, 2025 |
| Technical Report | SLR Project No.: 123.V02544.00008 |
• The Mill utilizes agitated hot acid leach and solvent extraction to recover uranium. Historical metallurgical tests and Mill production records on similar mineralized material confirm this processing method will recover 95% of the contained uranium.
• The Mill has historically run on a campaign basis and processes uranium bearing materials as they become available.
1.1.1.4 Infrastructure
• The Project will have diesel-generated electric power for the underground operation, ventilation fans, surface infrastructure, and dewatering wells.
• Water for the Project will be supplied from dewatering wells, which are needed to depressurize the underground mine.
• The primary surface infrastructure buildings and areas that are required to efficiently operate the Bullfrog mine include the following:
o Underground mine equipment maintenance shop
o Equipment wash bay
o Warehouse facilities
o Mine dry for the workers,
o Offices
o Emergency Medical Services (EMS) facilities
o Guard shack and parking
o Water treatment plant and evaporation ponds
o Fuel depot
o Waste storage facilities
o Ore stockpile area
o Explosive storage facilities
o Underground communications
o Dewatering wells
o Ventilation shafts and fans
o Electrical generators, substation, and site distribution powerlines
o Project access road and site roads
o Fencing
1.1.1.5 Environment
• EFR has a comprehensive understanding of regulatory requirements, permits, authorizations, and the applicable agencies for each. They have initiated select environmental baseline gathering for select disciplines to comply with these requirements.
• The environmental baseline studies that have been performed for the Project area were established between 2014 and 2016 to support permitting. This baseline serves as an excellent benchmark for documenting existing site conditions (and changes that have occurred since) and can be used to assess success of proposed reclamation practices.
• The Project is in a regulatory jurisdiction that has recent experience in permitting similar project activities.
| 1-4 | |
| Energy Fuels Inc. | Bullfrog Project | May 9, 2025 |
| Technical Report | SLR Project No.: 123.V02544.00008 |
1.1.1.6 Capital and Operating Costs
The initial direct capital cost estimate is estimated to be US$36 million. Indirect costs and Owner's costs are estimated to total 20% of direct costs. The contingency has been estimated at 25% of direct, indirect, and Owner's costs. Total initial capital costs over the four year pre-production period are estimated to be US$55 million.
The initial capital cost estimate has an accuracy of +50% / -50%.
Sustaining capital costs are estimated to be US$38 million. Permitting and closure costs are estimated to be US$4 million.
The average life of mine operating costs is estimated to be US$307.63 per ton milled.
1.1.2 Recommendations
SLR has proposed a two-phase exploration program with a total budget of approximately US$2,203,000 to advance the Project, beginning in 2025 (Table 1-1). Phase 2 is contingent on the successful completion of Phase 1.
Table 1-1: Proposed Energy Fuels 2025 Budget - Bullfrog Project
| Category | Budget (US$) |
| Phase 1 | |
| Surface Delineation Drilling | 418,500 |
| Downhole Radiometrics | 279,000 |
| Update Mineral Resource Estimate | 60,000 |
| Phase 1 Subtotal | 757,500 |
| Contingency (10%) | 75,750 |
| Phase 1 Total | 833,250 |
| Phase 2 | |
| Engineering Studies | 307,500 |
| Geotechnical Holes | 232,500 |
| Hydrogeology Study | 75,000 |
| Mine Zone Developmental Drilling | 248,000 |
| Environmental Studies | 250,000 |
| Prepare PFS | 440,000 |
| Update Mine Plan | 20,000 |
| Investigate Alternative Mining Methods | 20,000 |
| PFS | 400,000 |
| Phase 2 Subtotal | 1,245,500 |
| Contingency (10%) | 124,550 |
| Phase 2 Total | 1,370,050 |
| 1-5 | |
| Energy Fuels Inc. | Bullfrog Project | May 9, 2025 |
| Technical Report | SLR Project No.: 123.V02544.00008 |
| Category | Budget (US$) |
| Sub-Total Phase 1 + Phase 2 | 2,003,000 |
| Contingency (10%) | 200,300 |
| Total Phase 1 + Phase 2 | 2,203,300 |
The objectives of the exploration program are summarized below.
1.1.2.1 Geology and Mineral Resources
The SLR QP offers the following recommendations related to the geology and Mineral Resources aspects of the Project:
Phase 1: Development Drilling Program
1 Conduct a 20 to 30 drill hole development drilling program aiming to upgrade Inferred Resources to Indicated Resource and verify historical reported equilibrium values. Average depth per hole is projected to be approximately 930 ft.
2 Utilize Prompt Fission Neutron (PFN) drill hole geophysical logging as an alternative to collecting core to save costs on equilibrium analysis. PFN logging has proven to be a reliable methodology for equilibrium analysis and has a strong performance record on similar uranium deposits in the USA.
3 Update the Mineral Resource estimate for the Project using Deswik Stope Optimizer (Deswik.SO) shape optimization.
The SLR QP estimated costs per drill foot is US$25/ft, which includes the equilibrium analysis costs using the PFN tool.
Phase 2: Updated Resource Estimate and Pre-Feasibility Study
1 Following the Phase 1 drilling and Mineral Resource update, complete a Prefeasibility Study (PFS) of the Project.
1.1.2.2 Mining and Mineral Reserves
1 As part of a PFS, conduct the necessary work to estimate Mineral Reserves. The following tasks, included in the work program budget, will need to be part of the PFS.
o Conduct development drilling of the first mining zones to be encountered.
o Conduct drilling and analysis of geotechnical holes in the first mining zones to be encountered and along the decline route to support ground control design.
o Conduct a hydrology study to quantify the amount of mine depressurization and dewatering needed for the Project.
o Update the mine plan designs and schedule, including equipment and site service requirements to support the target production rates.
2 Investigate the alternative mining methods, like the use of roadheaders in soft ground.
| 1-6 | |
| Energy Fuels Inc. | Bullfrog Project | May 9, 2025 |
| Technical Report | SLR Project No.: 123.V02544.00008 |
1.1.2.3 Mineral Processing
1 Continue the White Mesa Mill intermittent operations with maintenance program.
2 Evaluate historical operating data to determine possible flowsheet improvements or modifications to improve the mill production rate/economics and make these changes before commencing production.
3 Conduct bench tests on the Bullfrog mineralized material to define process parameters.
1.1.2.4 Infrastructure
1 Design and estimate costs for a surface infrastructure to support future mining activities, including Project access road, surface facilities, water treatment plant, settling ponds, and evaporation ponds.
1.1.2.5 Environment
Hydrology
1 Given the absence of site-specific boring logs, monitoring wells, and data on transmissivity and storage, install wells to improve understanding of the groundwater system beneath the proposed Project site. Pumping tests should also be conducted to determine extraction rates, as well as the transmissivity and storage coefficient of the Navajo Sandstone aquifer near the production wells.
2 Using site-specific boring logs and permeability data, develop 3D geologic models, followed by numerical models, to verify the water budget of the Navajo Sandstone and assess its hydraulic connectivity, both laterally and vertically, with adjacent formations. Mine inflow estimates for the underground workings should be confirmed through the groundwater monitoring program, incorporating seepage water collection and the numerical modeling process for the Project.
Baseline Studies, Permits, Reclamation.
1 Review and document the previous environmental baseline studies, supplement or update these studies as required for current and anticipated permitting efforts, and document changes in the baseline since initial permitting efforts.
2 Complete additional studies for the socio-economic impacts, air quality, and meteorology.
3 Track (and where appropriate participate in) new legislation that may have impact(s) on permitting and environmental requirements for the Project.
4 As Permits are applied for and secured, begin development of an environmental management system that captures and describes environmental plans and requirements.
5 Even though opportunity may be limited, look for opportunities for concurrent reclamation to minimize financial obligation(s) during mining and at closure.
6 Once construction is complete, stabilize new disturbances with mulch, surface armoring and/or and vegetation to minimize erosion.
7 Develop revegetation test plots to finalize reclamation seed mix(es).
| 1-7 | |
| Energy Fuels Inc. | Bullfrog Project | May 9, 2025 |
| Technical Report | SLR Project No.: 123.V02544.00008 |
1.1.2.6 Capital and Operating Costs
1 For the next phase of study, complete detailed capital cost estimates based on PFS-level designs.
1.2 Economic Analysis
1.2.1 Base Case - Indicated and Inferred Resources
The economic analysis contained in this Technical Report is based, in part, on Inferred Mineral Resources, and is preliminary in nature. Inferred Mineral Resources are considered too geologically speculative to have the economic considerations applied to them that would enable them to be categorized as Mineral Reserves. There is no certainty that economic forecasts on which this PEA is based will be realized. Inferred Mineral Resource tonnage represents approximately 20% of the Mineral Resources used in this Base Case economic analysis. It is important to note that, unlike Mineral Reserves, Mineral Resources do not have demonstrated economic viability.
An after-tax Cash Flow Projection has been generated from the Life of Mine production schedule and capital and operating cost estimates. A summary of the key criteria is provided below.
1.2.1.1 Economic Criteria
Revenue
• Total mill feed processed: 1,765 kt
• Percent of Inferred Mineral Resource tonnage in LOM: 20%
• Average head grade: 0.28% eU3O8
• Average mining rate: 10,000 tons per month mining from underground (120,000 tons per year).
• Cut-off grade of 0.15% applied to diluted stope shapes.
• eU3O8 is sold at 100% payable.
• All prices are in US dollars, the Project is located in Utah, and all products produced are sold domestically.
• Metal Price: US$90/lb eU3O8.
• Net Smelter Return includes refining, transport, and insurance costs.
• Revenue is recognized at the time of production.
• Average mill recovery: 95%
• Total Recovered U3O8: 9,226 llb
Costs
Pre-production period: four years (Year -4 through Year -1).
Mine life: 15 years.
| 1-8 | |
| Energy Fuels Inc. | Bullfrog Project | May 9, 2025 |
| Technical Report | SLR Project No.: 123.V02544.00008 |
Mine life capital totals $97 million, initial capital totals $55 million, permitting and closure totals $4 million, and sustaining capital totals $38 million.
Average operating cost over the mine life is $307.63 per ton milled.
Taxation and Royalties
There are no royalties on the Bullfrog production other than the state of Utah has a 2.6% Severance mineral tax. Income tax assumptions include a 21% Federal Income tax rate and a Utah Income tax rate of 4.50%. Unit of Production (UoP) depreciation was used along with percentage depletion of 22% versus cost depletion.
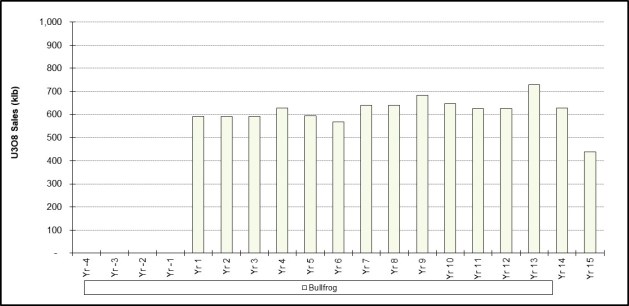
1.2.1.2 Cash Flow Analysis
Considering the Project on a stand-alone basis, the undiscounted after-tax cash flow totals $147 million over the mine life, and simple payback occurs approximately 5.8 years from start of production. The after-tax Net Present Value (NPV) at an 8% discount rate is $31 million, and the after-tax Internal Rate of Return (IRR) is 14%.
The amount of Inferred Mineral Resources included in this study represents approximately 20% of the total Mineral Resources tons. Inferred Mineral Resources are geologically speculative, and there is no certainty that economic forecasts on which this PEA is based will be realized.
A summary of the after-tax cash flow is provided in Table 1-2. Figure 1-1 presents the payable metal by year.
Table 1-2: Base Case After-Tax Cash Flow Summary
| Description | US$ million |
| Realized Market Prices | |
| U3O8 ($/lb) | $90 |
| Payable Metal | |
| U3O8 (klb) | 9,226 |
| Total Gross Revenue | 830 |
| Mining Cost | (238) |
| Mill Feed Transport Cost | (53) |
| Process Cost | (194) |
| Surface Facility Maintenance Cost | 0 |
| G & A Cost | (58) |
| Product Transport to Market | 0 |
| Royalties | 0 |
| Severance Tax | (20) |
| Total Operating Costs | (563) |
| Operating Margin (EBITDA) | 267 |
| Operating Margin % | 32% |
| Corporate Income Tax | (23) |
| 1-9 | |
| Energy Fuels Inc. | Bullfrog Project | May 9, 2025 |
| Technical Report | SLR Project No.: 123.V02544.00008 |
| Description | US$ million |
| Working Capital* | 0 |
| Operating Cash Flow | 245 |
| Development Capital | (55) |
| Exploration | 0 |
| Sustaining Capital | (38) |
| Closure/Reclamation | (4) |
| Total Capital | (97) |
| Pre-tax Free Cash Flow | 169.8 |
| Pre-tax NPV @ 5% | 72.5 |
| Pre-tax NPV @ 8% | 40.5 |
| Pre-tax NPV @ 12% | 14.0 |
| Pre-tax IRR | 15.6% |
| After-tax Free Cash Flow | 147.6 |
| After-tax NPV @ 5% | 59.8 |
| After-tax NPV @ 8% | 31.2 |
| After-tax NPV @ 12% | 7.6 |
| After-tax IRR | 14.0% |
| Notes: *Includes Working Capital of $24.7 million through first two years of production |
|
Figure 1-1: Base Case Payable U3O8
| 1-10 | |
| Energy Fuels Inc. | Bullfrog Project | May 9, 2025 |
| Technical Report | SLR Project No.: 123.V02544.00008 |
1.2.1.3 Sensitivity Analysis
Project risks can be identified in both economic and non-economic terms. Key economic risks were examined by running cash flow sensitivities:
• eU3O8 price
• Mill Recovery
• Head grade
• Operating costs
• Pre-production capital costs
• Mine life
The sensitivity analysis reveals the variations in key economic factors-such as metal prices, operating costs, and recovery rates-that can significantly impact the Project's net present value (NPV) and internal rate of return (IRR). Understanding these sensitivities is crucial for effective risk management and strategic decision-making.
1.2.2 Alternative Case - Indicated Only
The SLR QP also undertook an analysis of an alternative case that considers only Indicated Mineral Resources, which account for approximately 1.42 million tons, or 80%, of the 1.76 million tons in the base case production schedule. The Project has no estimated Measured Resource. The SLR QP has determined that a stand-alone alternative case with only Indicated Mineral Resource tonnage is economic using the assumptions and inputs outlined in the Base Case at an Internal Rate of Return of approximately 12%. The SLR QP notes that while the alternative case does not contain Inferred Mineral Resources, Indicated Mineral Resources are not Reserves and do not have demonstrated economic viability. There is no certainty that economic forecasts included in this PEA will be realized.
EFR plans to conduct additional definition drilling of the known mineralized material to convert the Inferred Mineral Resources to Indicated Mineral Resources.
1.2.2.1 Economic Criteria
Revenue
• Total mill feed processed: 1,419 kt
• Average head grade: 0.27% eU3O8
• Average mining rate: 10,000 tons per month mining from underground (120,000 tons per year).
• Cut-off grade of 0.15% applied to diluted stope shapes.
• eU3O8 is sold at 100% payable.
• All prices are in US dollars, the Project is located in Utah, and all products produced are sold domestically.
• Metal Price: US$90/lb eU3O8.
• Net Smelter Return includes refining, transport, and insurance costs.
| 1-11 | |
| Energy Fuels Inc. | Bullfrog Project | May 9, 2025 |
| Technical Report | SLR Project No.: 123.V02544.00008 |
• Revenue is recognized at the time of production.
• Average mill recovery: 95%
• Total Recovered U3O8: 7,324 llb
Costs
Pre-production period: four years (Year -4 through Year -1).
Mine life: 12 years.
Mine life capital totals $97 million, initial capital totals $55 million, permitting and closure totals $4 million, and sustaining capital totals $38 million.
Average operating cost over the mine life is $307.63 per ton milled.
Taxation and Royalties
There are no royalties on the Bullfrog production other than the state of Utah has a 2.6% Severance mineral tax. Income tax assumptions include a 21% Federal Income tax rate and a Utah Income tax rate of 4.50%. Unit of Production (UoP) depreciation was used along with percentage depletion of 22% versus cost depletion.
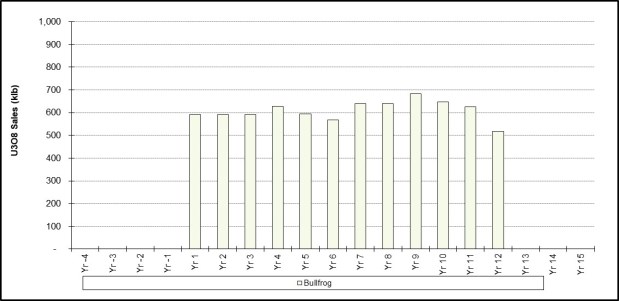
1.2.2.2 Cash Flow Analysis
Considering the Project on a stand-alone basis, the undiscounted after-tax cash flow totals $97.6 million over the mine life, and simple payback occurs approximately 5.7 years from start of production. The after-tax Net Present Value (NPV) at an 8% discount rate is $18.7 million, and the after-tax Internal Rate of Return (IRR) is 12.4%.
The cash flow analysis for the Alternative Case is summarized in Table 1-3. Figure 1-2 presents the payable metal by year.
Table 1-3: Alternative Case After-Tax Cash Flow Summary
| Description | US$ million |
| Realized Market Prices | |
| U3O8 ($/lb) | $90 |
| Payable Metal | |
| U3O8 (klb) | 7,324 |
| Total Gross Revenue | 659 |
| Mining Cost | (190) |
| Mill Feed Transport Cost | (42) |
| Process Cost | (156) |
| Surface Facility Maintenance Cost | 0 |
| G & A Cost | (47) |
| Product Transport to Market | 0 |
| Royalties | 0 |
| 1-12 | |
| Energy Fuels Inc. | Bullfrog Project | May 9, 2025 |
| Technical Report | SLR Project No.: 123.V02544.00008 |
| Description | US$ million |
| Severance Tax | (16) |
| Total Operating Costs | (452) |
| Operating Margin (EBITDA) | 207 |
| Operating Margin % | 31% |
| Corporate Income Tax | (15) |
| Working Capital* | 0 |
| Operating Cash Flow | 192 |
| Development Capital | (55) |
| Exploration | 0 |
| Sustaining Capital | (35) |
| Closure/Reclamation | (4) |
| Total Capital | (94) |
| Pre-tax Free Cash Flow | 112.7 |
| Pre-tax NPV @ 5% | 48.4 |
| Pre-tax NPV @ 8% | 25.8 |
| Pre-tax NPV @ 12% | 6.4 |
| Pre-tax IRR | 13.9% |
| After-tax Free Cash Flow | 97.8 |
| After-tax NPV @ 5% | 39.2 |
| After-tax NPV @ 8% | 18.8 |
| After-tax NPV @ 12% | 1.4 |
| After-tax IRR | 12.4% |
| Notes: *Includes Working Capital of $24.7 million through first two years of production |
|
| 1-13 | |
| Energy Fuels Inc. | Bullfrog Project | May 9, 2025 |
| Technical Report | SLR Project No.: 123.V02544.00008 |
Figure 1-2: Alternative Case Payable U3O8
1.2.2.3 Sensitivity Analysis
Project risks can be identified in both economic and non-economic terms. Key economic risks were examined by running cash flow sensitivities:
• eU3O8 price
• Mill Recovery
• Head grade
• Operating costs
• Pre-production capital costs
• Mine life
The sensitivity analysis reveals the variations in key economic factors-such as metal prices, operating costs, and recovery rates—that can significantly impact the Project's net present value (NPV) and internal rate of return (IRR). Understanding these sensitivities is crucial for effective risk management and strategic decision-making.
1.3 Technical Summary
1.3.1 Property Description and Location
The Bullfrog Project consists of two separate contiguous deposits, also known as Copper Bench and Indian Bench. The Project is located in eastern Garfield County, Utah, 17 mi north of Bullfrog Basin Marina on Lake Powell and approximately 40 mi south of the town of Hanksville, Utah. It is situated three miles west of Utah State Highway 276 and approximately five miles north of Ticaboo, Utah.
The approximate center of the of the Project has the following coordinates:
• Universal Transverse Mercato (UTM): 526,649.08 mE, 4,184861.5m N zone 12S
| 1-14 | |
| Energy Fuels Inc. | Bullfrog Project | May 9, 2025 |
| Technical Report | SLR Project No.: 123.V02544.00008 |
• Geographic: 37°48'38.71"N latitude and110°41'50.09"W longitude (decimal degrees 37.810753, -110.697247)
• State Plane 1983 Utah South FIPS 4303 (US feet) system: 1,872,319.926 E, 10,260,078.280 N
1.3.2 Land Tenure
EFR's property position at the Project consists of 168 unpatented mining claims located on U.S. Bureau of Land Management (BLM) land, encompassing approximately 2,344 acres. Surface access to conduct exploration, development and mining activities on unpatented mining claims is granted by the BLM if National Environmental Protection Act (NEPA) regulations are met. The Project is 100% owned by EFR and all claims are in good standing.
1.3.3 History
During World War I, vanadium was mined from small deposits outcropping in Salt Wash exposures on the eastern and southern flanks of the Henry Mountains. In the 1940s and 1950s, interest increased in both vanadium and uranium, and numerous small mines developed along the exposed Salt Wash outcrops.
In the late 1960s, Gulf Minerals (Gulf) acquired a significant land position southwest of the Henry Mountains Complex property and drilled approximately 70 holes with little apparent success. In 1970 and 1971, Rioamex Corporation conducted a 40-hole drilling program in an east-west zone extending across the southerly end of the Bullfrog property and the northerly end of the Tony M-Frank M property. Some of these holes intercepted significant uranium mineralization.
The ownership history of the Bullfrog and Southwest deposits and the Tony M deposit evolved independently from the mid-1970s until early 2005. The Bullfrog and Southwest deposits were initially explored by Exxon Minerals Company (Exxon), while the Tony M deposit was explored and developed by Plateau, a subsidiary of Consumers Power Company (Consumers) of Michigan. In 2005, International Uranium Corporation (IUC) combined the three deposits into a larger land package. In 2021, EFR divested of the Tony M property and Southwest deposit, retaining the mineral claims associated with the Bullfrog deposits (Copper Bench and Indian Bench).
Exxon conducted reconnaissance in the area in 1974 and 1975, resulting in staking of the first "Bullfrog" claims in 1975 and 1976. The first drilling program in 1977 resulted in the discovery of what became the Southwest deposit. Additional claims were subsequently staked, and drilling continued, first by Exxon's Exploration Group, and then by its Pre-Development Group. Several uranium and vanadium zones were discovered in the Southwest and Copper Bench areas, and mineralization exhibiting potential economic grade was also discovered in the Indian Bench area. With the declining uranium markets of the early 1980s, Exxon prepared a prefeasibility report and then discontinued development of the property. Subsequently, Exxon offered the property to Atlas Minerals Corporation (Atlas) in January 1982.
Atlas entered into an agreement to purchase the Bullfrog property from Exxon in July 1982. From July 1982 to July 1983, Atlas completed 112 drill holes delineating the Southwest and Copper Bench deposits on approximately 100 ft centers. In August 1983, Atlas commissioned Pincock, Allen and Holt, Inc. (PAH), to conduct a feasibility study for development of the Southwest and Copper Bench deposits. From July 1983 to March 1984, Atlas completed a core drilling program throughout the Bullfrog property, as well as a rotary drill hole program to delineate the Indian Bench deposit. In November 1983, Atlas renamed the Bullfrog deposits as the "Edward R. Farley Jr. Deposit", but that name is no longer used.
| 1-15 | |
| Energy Fuels Inc. | Bullfrog Project | May 9, 2025 |
| Technical Report | SLR Project No.: 123.V02544.00008 |
Atlas continued to hold the Bullfrog property until 1990 when a corporate decision was made to consider its sale. During that year, Mine Reserves Associates, Inc. (MRA) of Tucson, Arizona, was retained to prepare mineral inventory and mineable reserve estimates for the Indian Bench deposit and incorporate the results into a project-wide reserve base. Steve Milne of Milne and Associates (Milne), a principal engineer for the PAH study, was engaged in November 1990 to update the PAH feasibility study and to complete an optimization study on selected mining/milling scenarios. The completed Milne study was submitted to Atlas in December 1990.
Atlas did not sell the Bullfrog property, and in 1991 returned it to Exxon. In late 1992, Energy Fuels Nuclear Inc. (EFNI), no relation to EFR, acting through its subsidiary Energy Fuels Exploration Company, purchased the property from Exxon. EFNI conducted a geologic review and internal economic analysis of the Bullfrog property. In 1997, IUC became the owner of the Bullfrog property as part of an acquisition in which IUC acquired all of EFNI's assets. IUC performed no exploration activities on the properties.
On December 1, 2006, IUC combined its operations with those of Denison Mines Inc. (DMI) and DMI became a subsidiary of IUC. IUC was then renamed Denison.
In June 2012, Energy Fuels acquired 100% of the Henry Mountains Complex through the acquisition of Denison and its affiliates' U.S. Mining Division.
In October 2021, EFR divested of the Tony M property and Southwest deposit to Consolidated Uranium, Inc. (CUR), retaining the mineral claims associated with the Bullfrog (Copper Bench and Indian Bench) Deposits.
1.3.4 Geology and Mineralization
The Copper Bench and Indian Bench Deposits are classified as sandstone hosted uranium deposits. Sandstone-type uranium deposits typically occur in fine to coarse grained sediments deposited in a continental fluvial environment. The uranium may be derived from a weathered rock containing anomalously high concentrations of uranium, leached from the sandstone itself or an adjacent stratigraphic unit. It is then transported in oxygenated groundwater until it is precipitated from solution under reducing conditions at an oxidation-reduction interface. The reducing conditions may be caused by such reducing agents in the sandstone as carbonaceous material, sulfides, hydrocarbons, hydrogen sulfide, or brines.
Uranium mineralization on the Bullfrog property is hosted by favorable sandstone horizons in the lowermost portion of the Salt Wash Member of the Jurassic age Morrison Formation, where detrital organic debris is present. Mineralization primarily consists of coffinite, with minor uraninite, which usually occurs in close association with vanadium mineralization. Uranium mineralization occurs as intergranular disseminations, as well as coatings and/or cement on and between sand grains and organic debris. Vanadium occurs as montroseite (hydrous vanadium oxide) and vanadium chlorite in primary mineralized zones located below the water table.
The vanadium content of the Henry Mountains Basin deposits is relatively low compared to many other Salt Wash hosted deposits on the Colorado Plateau. Furthermore, the Henry Mountains Basin deposits occur in broad alluvial sand accumulations, rather than in major sandstone channels as is typical of the Uravan Mineral Belt deposits of western Colorado. The Henry Mountains Basin deposits do, however, have the same general characteristic geochemistry of the Uravan deposits, and are therefore classified as Salt Wash type deposits.
| 1-16 | |
| Energy Fuels Inc. | Bullfrog Project | May 9, 2025 |
| Technical Report | SLR Project No.: 123.V02544.00008 |
1.3.5 Exploration Status
Energy Fuels has carried out no exploration work on the Project since acquiring the Bullfrog property in 2012.
1.3.6 Mineral Resources
Mineral Resources have been classified in accordance with SEC S-K 1300 definitions, which are consistent with the Canadian Institute of Mining, Metallurgy and Petroleum (CIM) Definition Standards for Mineral Resources and Mineral Reserves dated May 10, 2014 (CIM (2014) definitions), which are incorporated by reference in NI 43-101.
The Mineral Resource estimate was completed using a conventional block modeling approach. The general workflow used by SLR included the construction of a geological or stratigraphic model representing the Jurassic Morrison Formation (Jm) in Seequent's Leapfrog Geo (Leapfrog Geo) from mapping, drill hole logging, and sampling data, which was used to define discrete domain and surfaces representing the upper and lower zones uranium mineralization contacts of the middle portion of the lower Salt Wash Sandstone Member (Jms). The geologic models were then used to constrain resource estimation completed using Seequent's Leapfrog Edge (Leapfrog Edge) software. The resource estimate used a regularized, unrotated whole block approach, inverse distance cubed (ID3) methodology, and 1.0 ft, uncapped composites to estimate the equivalent uranium (eU3O8) grade in a three-pass search approach. Hard boundaries were used with ellipsoidal search ranges, and search ellipse orientation was informed by geology and mineralization wireframing. Density values were assigned based on historical bulk density records.
Estimates were validated using standard industry techniques including statistical comparisons with composite samples and parallel inverse distance squared (ID2), ordinary kriging (OK) and nearest neighbor (NN) estimates, swath plots, and visual reviews in cross section and plan. A visual review comparing blocks to drill holes was completed after the block modeling work was performed to ensure general lithologic and analytical conformance and was peer reviewed prior to finalization.
Table 1-4 summarizes the Mineral Resource estimate based on a $90/lb uranium price using a cut-off grade of 0.150% eU3O8, with an effective date of December 31, 2024.
Table 1-4: Summary of Mineral Resources - Bullfrog Project - December 31, 2024
| Classification | Grade Cut-off (% eU3O8) |
Tonnage (Mton) |
Grade (% eU3O8) |
Contained Metal (Mlb eU3O8) |
EFR Basis (%) |
Recovery U3O8 (%) |
| Indicated | 0.150 | 1.74 | 0.303 | 10.51 | 100 | 95 |
| Inferred | 0.150 | 0.61 | 0.279 | 3.42 | 100 | 95 |
| Notes: 1. SEC S-K 1300 definitions were followed for all Mineral Resource categories. These definitions are also consistent with CIM (2014) definitions in NI 43-101. 2. Cut-off grade is 0.150% eU3O8 3. Cut-off grade is calculated using a metal price of $90/lb U3O8. 4. No minimum mining width was used in determining Mineral Resources. 5. Mineral Resources based on a tonnage factory of 15.0 ft3/ton (Bulk density 0.0667 ton/ft3 or 2.13 t/m3). 6. Mineral Resources have not been demonstrated to be economically viable. 7. Metallurgical recovery is 95%. 8. Totals may not add due to rounding. 9. Mineral Resources are 100% attributable to EFR and are in situ. |
||||||
| 1-17 | |
| Energy Fuels Inc. | Bullfrog Project | May 9, 2025 |
| Technical Report | SLR Project No.: 123.V02544.00008 |
The SLR QP is of the opinion that with consideration of the recommendations summarized in Sections 1 and 26 of this report, any issues relating to all relevant technical and economic factors likely to influence the prospect of economic extraction can be resolved with further work. There are no other known environmental, permitting, legal, social, or other factors that would affect the development of the Mineral Resources.
Based on the similarity of the Bullfrog deposit to other past producing uranium deposits in the Colorado Plateau and the Henry Mountain Mining District, the proposed mining methods at Bullfrog will include a combination of random room and pillar operation with pillar extraction by a retreat system, split shot, and drift and fill.
While the estimate of Mineral Resources is based on the SLR QP's judgment that there are reasonable prospects for eventual economic extraction, no assurance can be given that Mineral Resources will eventually convert to Mineral Reserves.
1.3.7 Mineral Reserves
There are no current Mineral Reserves at the Project.
1.3.8 Mining Method
The Salt Wash Member, which hosts the mineralized horizons, is comprised primarily of sandstones with interbedded shales and mudstones. The Copper Bench and Indian Bench horizons are located in the Upper area of the Salt Wash Member.
It is proposed that the deposit will be developed and mined by two methods: 1) modified room-and-pillar methods using ground support during development to ensure roof stability, especially in weak ground conditions, and 2) drift and fill (DF) for areas of poor rock quality.
Room-and-pillar mining is a simple, low-capital cost mining method in which mining recoveries of 70% to 90% can be expected, dependent upon the rock strengths and geological structures encountered. Although pillars are anticipated to remain unmined, even with tight backfilling and artificial support, the method is sufficiently flexible to achieve required production rates, control cut-off grades, and maintain safe working conditions. The operational sequence must be modified when mining heights are high (>12 ft) since multi-cuts and stacked pillars (low width-to-height ratios) are required and backfilling must be used to ensure pillar stability. This method becomes a hybrid of the cut-and-fill method in areas where the mineralization is thick (12 ft to 16 ft high), because slender pillars are ineffective for roof support and strong global backfill support must enhance local roof support.
With the wide range of mineralized zone stope thicknesses (from 4 ft to 16 ft) and dips/plunges (from flat to 15°), one of the mining methods selected for the Project for this study is step room and pillar (SRP). Permanent pillars will be left in a pre-designed pattern and cemented rockfill (CRF) will be placed in mined-out areas as backfill. This method, recommended for the lower grade mineralized lenses, allows for mobile equipment to be used effectively in the range of dips/plunges encountered at Bullfrog.
Drift and Fill (DF) mining methods are well suited for selective precision mining in variable-grade areas and are quite flexible, resulting in high extraction ratios. The volume of open ground at any one time is small since drifts are mined and immediately backfilled before adjacent drifts are mined. The development can be placed in the mineralized areas, minimizing waste rock. This method is not well suited for high production rates, unless many stopes are simultaneously opened, which requires a laterally extensive mineralized zone. The cost of local support (roof cabling through multi-cuts) is high because all cuts must be fully supported. DF mining is recommended for the higher-grade mineralized lenses at Bullfrog, where maximum recovery is desired. This method is widely used in other mines with similar ground conditions and will result in higher mining recoveries as the need to leave permanent pillars will be significantly reduced. This method, however, requires a high quality, high strength engineered backfill in order to be successful. For the DF method, a high-strength CRF will be placed in the mined-out areas.
| 1-18 | |
| Energy Fuels Inc. | Bullfrog Project | May 9, 2025 |
| Technical Report | SLR Project No.: 123.V02544.00008 |
Bulk mining methods were investigated, particularly for the thick (up to 20 ft) zones. One method considered involved mining of the thick zones in staggered primary and secondary panels using engineered cemented backfill. After the evaluation, this method was considered inapplicable due to the weak rock conditions. The low rock strengths and limited stand-up time made this method impractical given the relatively high stope walls, which would be exposed during the benching process.
The minimum thickness used in the development of the Mineral Resource estimate was three feet. The mineralized zones range exceeding thickness of 3 ft to 16 ft, the Deswik.SO used conservative 4 ft height stopes. Mineralized zones with thicknesses from 3 ft to 8 ft will be mined in one pass. Mineralized zones exceeding 12 ft in thickness will be mined in two sequential overhand cuts with each cut being approximately one-half of the overall zone thickness.
In both the Copper Bench and Indian Bench, the mineralized horizons will be further defined using longhole drills from a dedicated drilling horizon located below the mineralized zones.
The proposed Life of Mine (LOM) schedule was developed based on initiating development from the production decline located adjacent to the mineralized mining zones. The mining areas in Copper Bench and Indian Bench will be connected by means of a 5,400 ft twin decline haulage way. The last section of the decline will become a single haulage way.
Secondary development connecting the shaft to the various mineralized zones (including the twin decline) will be driven 10 ft wide by 12 ft high with 10 ft rounds. Production development connecting the primary development to the mining areas will be individual stopes and will be driven 10 ft wide by 8 ft high with 10 ft rounds.
The mining sequence in each of the eight mining zones is dependent upon the development schedule. Generally, the extraction schedule is sequenced to prioritize the mining of the largest and highest-grade zones in each section of the mine. Where mineralized zones are stacked, they will be mined in a top-down sequence.
Stope mining begins approximately four years after the start of construction and the operating mine life spans 15 years. The production rate averages approximately 10,000 short tons per month over the life of the mine, assuming 350 operating days per year.
Depressurization of the three main aquifers in the mine area will be accomplished using 11 depressurization wells and underground longholes that will supply water to a couple of underground pumping stations that will ultimately feed water to the Copper Bench sump pumps located in one of the declines. It has been estimated that the mine will discharge a nominal 20 gpm of water at temperatures between 70°F and 80°F. An additional 100 gpm will be produced by surface wells, resulting in a total discharge rate as high as 150 gpm.
The deposit will be developed and mined based on single-pass ventilation using a series of separate and independent intake and exhaust networks. The design requires a total of 10 ventilation raises and the twin declines. Intake air will be sourced from the two declines and two of the seven ventilation raises; the fresh air intake raise in Indian Bench will be equipped with emergency evacuation hoisting equipment. The decline to and along the mineralization is approximately 13,500-ft long.
| 1-19 | |
| Energy Fuels Inc. | Bullfrog Project | May 9, 2025 |
| Technical Report | SLR Project No.: 123.V02544.00008 |
The LOM statistics for the Project are summarized in Table 1-5.
Table 1-5: Key Bullfrog Life of Mine Production Statistics
| Area | Heading Dimensions (ft x ft x ft) |
Units | Life of Mine Quantity |
| Development - Primary | 12 x 12 x 8 | ft 000 | 27.04 |
| Secondary Development | 10 x 12 x 8 | ft 000 | 21.65 |
| Production Development - Stope Access | 10 x 8 x 8 | ft 000 | 13.70 |
| Vertical Development - Ventilation Shafts | 8-ft dia. | ft 000 | 8.67 |
| Stope Mineralization Recovered | 8 x 10 x 6 | 000 tons | 1,765 |
| Total Waste | 8 x 10 x 6 | 000 tons | 679 |
| Total Production | 000 tons | 2,444 | |
| Approximate Backfill Required | % | 90% | |
| Preproduction Period | yr | 4 | |
| Mine Life | yr | 15 | |
| Total U3O8 Pounds Mined | Mlb | 9.711 | |
| Notes: Tables may not add due to rounding. |
|||
1.3.9 Mineral Processing
The White Mesa Mill is currently on a reduced operating schedule processing materials as they become available.
The Mill uses a Semi Autogenous (SAG) mill operating in closed circuit with vibratory screens for comminution. Mill feed is fed to the comminution circuit via front end loader. The nameplate production rate for the circuit is 150 short tons per hour (stph).
The Mill uses an atmospheric hot acid leach followed by counter current decantation (CCD) and a clarifier stage to remove suspended solids. Clarified pregnant leach solution (PLS) reports to the solvent extraction (SX) circuit where uranium and vanadium are extracted from the aqueous solution to an organic phase. Salt and sulfuric acid are then used to strip the uranium from the organic phase.
After stripping of the uranium from the organic in SX, uranium is precipitated with anhydrous ammonia, dissolved, and re-precipitated to improve product quality. The resulting precipitate is then washed and dewatered using centrifuges to produce a final U3O8 product called "yellowcake". The yellowcake is dried in a multiple hearth dryer and packaged in drums weighing approximately 800 lb to 1,000 lb for shipping to uranium converters.
Tailings from the acid leach plant are stored in permitted 40 acre tailing cells located in the southwest and southern portion of the mill site. Spent process solutions are stored in the evaporation cells for reuse with excess solutions allowed to evaporate.
| 1-20 | |
| Energy Fuels Inc. | Bullfrog Project | May 9, 2025 |
| Technical Report | SLR Project No.: 123.V02544.00008 |
1.3.10 Project Infrastructure
The Project is currently a 'Greenfield' site, i.e., there currently exists no mine infrastructure. Required infrastructure for the site will include surface facilities to support mining operations, such as warehouses, fuel depot, explosive storage facilities, and offices; ventilation shafts and fans; a water treatment plant and evaporation ponds; dewatering wells; mineralized material stockpiles; and waste rock storage facilities. It is planned that electricity will be supplied by an on-site diesel generator, and a substation will be required. Water for the site will be supplied from on site dewatering wells.
Cellular telephone coverage and Starlink satellite services are currently available at the Project.
A 3-mi long access road from Utah Highway 76 west to the Project will be required.
1.3.11 Market Studies
Uranium does not trade on the open market, and many of the private sales contracts are not publicly disclosed since buyers and sellers negotiate contracts privately. Spot prices are generally driven by current inventories and speculative short-term buying. Monthly long-term industry average uranium prices based on the month-end prices are published by Ux Consulting, LLC, and Trade Tech, LLC. An accepted mining industry practice is to use Consensus Forecast Prices obtained by collating commodity price forecasts from credible sources.
Consensus forecasts collected by SLR show long-term averages of approximately $80.00/lb. General industry practice is to use a consensus long-term forecast price for estimating Mineral Reserves, and 10% to 20% higher prices for estimating Mineral Resources.
For Mineral Resource estimation and cash flow projections, the SLR QP selected a U3O8 price of $90.00/lb, on a Cost, Insurance, and Freight (CIF) basis to customer facility, based on independent forecasts. The SLR QP considers this price to be reasonable and consistent with industry practice based on independent long-term forecasts and a mark-up for use with Mineral Resource estimation.
Currently, EFR has not entered into any long-term agreements for the provision of materials, supplies, or labor for the Project. The construction and operations will require negotiation and execution of a few contracts for the supply of materials, services, and supplies.
1.3.12 Environmental, Permitting and Social Considerations
EFR has performed select environmental studies of the Project area, starting in 2014 and supplemented in 2015 and 2016. The methods and scope of work for these efforts were defined by EFR in coordination with the U.S. Bureau of Land Management (BLM) and the Utah Department of Natural Resources, Division of Oil, Gas and Mining (DOGM). The baseline studies serve as an excellent benchmark for documenting existing site conditions.
Permitting of the proposed Project will require approvals from federal, state and local (county) agencies. These approvals include:
• Plan of Operation and reclamation bond from the BLM
• Notice of Intention and reclamation bond from the Utah DOGM
• Conditional Use Permit from Garfield County
| 1-21 | |
| Energy Fuels Inc. | Bullfrog Project | May 9, 2025 |
| Technical Report | SLR Project No.: 123.V02544.00008 |
• Various other approvals from state agencies including an air quality permit, ground water and surface water discharge permits, pond construction and operating permits, a septic permit and water right(s).
A Memorandum of Understanding (MOU) has been developed between the BLM and the DOGM to facilitate a coordinated review and approval process where responsibilities overlap. EFR has a comprehensive understanding of regulatory requirements, permits, authorizations, and the applicable agencies for each.
The land encompassing the Project area is currently designated as multiple use and is used mostly for livestock grazing, wildlife habitat, and recreation (primarily off-road vehicles). Reclamation will return disturbed areas of the Project to the same pre-mining land use(s). Reclamation plans and performance bonds will be required and in place prior to the startup of mining in accordance with state and federal requirements.
1.3.13 Capital and Operating Cost Estimates
The life of mine (LOM) capital cost estimate is summarized in Table 1-6.
Table 1-6: LOM Capital Cost Summary
| Capital Cost Item | Initial Capital Preproduction Yr-4 to Yr-1 ($ 000) |
Sustaining Capital Mine Production Yr1 to Yr15 ($ 000) |
LOM Totals ($ 000) |
| Direct Capital Costs | $36,443 | $38,256 | $74,698 |
| Other Costs (20% of Direct) | $7,289 | 0 | 7,289 |
| Total Direct + Other Costs | $43,731 | 38,256 | $81,988 |
| Contingency (25%) | $10,933 | $10,933 | |
| Permitting and Closure | 4,322 | ||
| Total Capital Costs | $54,664 | $38,256 | $97,242 |
The LOM average operating cost, summarized in Table 1-7, includes mining, general and administration, freight of the product to a point of sale (White Mesa Mill), toll milling costs at White Mesa Mill, and various royalties and severance taxes. The Project operating costs were estimated in 2023 US dollars basis.
Table 1-7: LOM Operating Unit Costs Summary
| Unit Operating Cost Summary | Units | LOM Unit Operating Cost |
| Underground Mining Cost | $/ton milled | $135.05 |
| Milling & Processing | $/ton milled | $110.00 |
| G&A | $/ton milled | $32.733 |
| Transportation (Bullfrog Mine to White Mesa Mill; 127 miles) | $/ton milled | $29.85 |
| Total | $307.63 |
| 1-22 | |
| Energy Fuels Inc. | Bullfrog Project | May 9, 2025 |
| Technical Report | SLR Project No.: 123.V02544.00008 |
2.0 Introduction
SLR International Corporation (SLR) was retained by Energy Fuels Inc. (Energy Fuels) to prepare an independent Technical Report on the Bullfrog Project (Bullfrog or the Project), located in Garfield County, Utah, USA. Energy Fuels is the parent company of Energy Fuels Resources (USA) Inc. (EFR), which owns 100% of the Project. EFR is a US-based uranium and vanadium exploration and mine development company. Energy Fuels is listed on the NYSE American Stock Exchange (symbol: UUUU) and the Toronto Stock Exchange (symbol: EFR).
This Technical Report satisfies the requirements of Canadian National Instrument 43-101 Standards of Disclosure for Mineral Projects (NI 43-101) and United States Securities and Exchange Commission's (SEC) Modernized Property Disclosure Requirements for Mining Registrants as described in Subpart 229.1300 of Regulation S-K, Disclosure by Registrants Engaged in Mining Operations (S-K 1300) and Item 601 (b)(96) Technical Report Summary.
The purpose of this report is to disclose the results of a Preliminary Economic Assessment (PEA). The term PEA is used throughout this Technical Report and is consistent with an Initial Assessment (IA) under S-K 1300.
This report was prepared by Stuart Collins, P.E., Jeffrey L. Woods, MMSA QP, Lee (Pat) Gochnour, MMSA QP, Mark B. Mathisen, C.P.G., Grant A. Malensek, M.Eng., P.Eng., and Tedros Tesfay, SME (RM), all of whom are Qualified Person (QP) within the meaning of both S-K 1300 and NI 43-101 (SLR QP). Messrs. Mathisen, Miranda, and Collins visited the Project on July 15 to 18, 2024.
Bullfrog consists of two contiguous sandstone-type uranium deposits, Copper Bench and Indian Bench, within the Colorado Plateau physiographic province in southwestern Utah. The Colorado Plateau has been a relatively stable structural province since the end of the Precambrian. During the Paleozoic and Mesozoic, the Colorado Plateau was a stable shelf without major geosynclinal areas of deposition, except during the Pennsylvanian when several thousand feet of black shales and evaporates accumulated in the Paradox Basin of southwestern Colorado and adjacent Utah.
The Project is situated in the southeastern flank of the Henry Mountains Basin, a sub province of the Colorado Plateau physiographic province. The Henry Mountains Basin is an elongate north-south trending doubly plunging syncline in the form of a closed basin. It is surrounded by the Monument Uplift to the southeast, Circle Cliffs Uplift to the southwest, and the San Rafael Swell to the north.
The Project originally formed part of the Henry Mountains Complex, which consisted of the Tony M mine and deposit, collectively known as the Tony M property, and the Southwest, Copper Bench, and Indian Bench deposits, collectively known as the Bullfrog property. In October 2021, IsoEnegy Ltd. (formerly Consolidated Uranium Inc. (CUR)) acquired the Tony M property and Southwest deposit from EFR. The remaining deposits (Copper Bench and Indian Bench) that occur to the north as part of the historical Bullfrog property remain under EFR ownership.
The Project is currently being developed in preparation for production. Environmental permitting and compliance activities are being developed to start operations. EFR envisages an underground operation in which the mineralized material will be processed based on a toll milling agreement at Energy Fuels' White Mesa Mill, 127 road miles (mi) away in Blanding, Utah. The Mill has historically run on a campaign basis and processes uranium bearing materials as they become available.
| 2-1 | |
| Energy Fuels Inc. | Bullfrog Project | May 9, 2025 |
| Technical Report | SLR Project No.: 123.V02544.00008 |
2.1 Sources of Information
Sources of information and data contained in this Technical Report or used in its preparation are from publicly available sources in addition to private information owned by EFR, including that of past property owners.
This Technical Report was prepared by the SLR QPs with assistance from Yenlai Chee, M.Sc., SLR Senior Resource Geologist, and Hugo M. Miranda, M.Eng., MBA, SME(RM), SLR Principal Mining Engineer. The independent SLR QPs Mathisen and Collins, accompanied by Mr. Miranda, visited the Project under care and maintenance on July 15 to 18, 2024. The SLR QPs toured various parts of the Project, drill hole locations, and infrastructure, and conducted discussions with EFR Project personnel on current and future operations.
Table 2-1 presents a summary of the QP responsibilities for this Technical Report.
Table 2-1: Summary of QP Responsibilities
| Qualified Person | Company | Title/Position | Section |
| Grant A. Malensek, M.Eng., P. Eng. | SLR | Senior Principal Mining Engineer | 1.2, 22, 30 |
| Mark B. Mathisen, C.P.G. | SLR | Principal Geologist | 1.1, 1.1.1.1, 1.1.2.1, 1.3.1 to 1.3.6, 1.3.11, 2, 3, 4 excluding 4.3, 5 to 8, 9 excluding 9.1, 10 to 12, 14, 19, 23, 24, 25.1, 26.1 |
| Stuart Collins, P.E. | SLR | Principal Mining Engineer | 1.1.1.2, 1.1.1.4, 1.1.1.6, 1.1.2.2, 1.1.2.4, 1.1.2.6, 1.3.7, 1.3.8, 1.3.10, 1.3.13, 15, 16, 18, 21, 25.2, 25.4, 25.6, 26.2, 26.4, 26.6 |
| Jeffrey L. Woods, MMSA QP. | Woods Process Services | Principal Consulting Metallurgist | 1.1.1.3, 1.1.2.3, 1.3.9, 13, 17, 25.3, 26.3 |
| Lee (Pat) Gochnour, MMSA (QP) | Gochnour & Associate, Inc. | Associate Principal Environmental Specialist | 1.1.1.5, 1.1.2.5, 1.3.12, 4.3, 20, 25.5, 26.5.2 |
| Tedros Tesfay, Ph.D, SME (RM) | SLR | Senior Hydrogeologist | 9.1 and related disclosure in 1.1.2.5, and 26.5.2 |
| All | - | - | 27 |
During the preparation of this Technical Report, discussions were held with personnel from EFR:
• Daniel Kapostasy, P.G., Vice President, Technical Services, Energy Fuels Resources (USA) Inc.
• Race Fisher, Director of Conventional Mining, Energy Fuels Resources (USA) Inc.
• Scott Bakken, P.G., Vice President Regulatory Affairs, Energy Fuels Resources (USA) Inc.
| 2-2 | |
| Energy Fuels Inc. | Bullfrog Project | May 9, 2025 |
| Technical Report | SLR Project No.: 123.V02544.00008 |
This Technical Report supersedes the previous Technical Report completed by SLR, dated February 22, 2022 (the 2022 Technical Report).
The documentation reviewed, and other sources of information, are listed at the end of this Technical Report in Section 27 References.
| 2-3 | |
| Energy Fuels Inc. | Bullfrog Project | May 9, 2025 |
| Technical Report | SLR Project No.: 123.V02544.00008 |
2.2 List of Abbreviations
The U.S. System for weights and units has been used throughout this Technical Report. Tons are reported in short tons (ton) of 2,000 lb unless otherwise noted. All currency in this Technical Report is US dollars (US$) unless otherwise noted.
| μ | micron | L | liter |
| a | annum | lb | pound |
| A | ampere | m | meter |
| bbl | barrels | m3 | meter cubed |
| Btu | British thermal units | M | mega (million); molar |
| °C | degree Celsius | Ma | one million years |
| cm | centimeter | MBtu | thousand British thermal units |
| cm3 | centimeter cubed | MCF | million cubic feet |
| d | day | MCF/h | million cubic feet per hour |
| °F | degree Fahrenheit | mi | mile |
| ft ASL | feet above sea level | min | minute |
| ft | foot | MPa | megapascal |
| ft2 | square foot | mph | miles per hour |
| ft3 | cubic foot | MVA | megavolt-amperes |
| ft/s | foot per second | MW | megawatt |
| g | gram | MWh | megawatt-hour |
| G | giga (billion) | ppb | part per billion |
| Ga | one billion years | ppm | part per million |
| gal | US gallon | psia | pound per square inch absolute |
| gal/d | gallon per day | psig | pound per square inch gauge |
| g/L | gram per liter | rpm | revolutions per minute |
| g/y | gallon per year | RL | relative elevation |
| gpm | gallons per minute | s | second |
| hp | horsepower | ton | short ton |
| h | hour | stpa | short ton per year |
| Hz | hertz | stpd | short ton per day |
| in. | inch | t | metric tonne |
| in2 | square inch | US$ | United States dollar |
| J | joule | V | volt |
| k | kilo (thousand) | W | watt |
| kg/m3 | kilogram per cubic meter | wt% | weight percent |
| kVA | kilovolt-amperes | WLT | wet long ton |
| kW | kilowatt | y | year |
| kWh | kilowatt-hour | yd3 | cubic yard |
| 2-4 | |
| Energy Fuels Inc. | Bullfrog Project | May 9, 2025 |
| Technical Report | SLR Project No.: 123.V02544.00008 |
3.0 Reliance on Other Experts
This Technical Report has been prepared by the SLR QP for EFR's parent company, Energy Fuels. The information, conclusions, opinions, and estimates contained herein are based on:
• Information available to the SLR QP at the time of preparation of this Technical Report.
• Assumptions, conditions, and qualifications as set forth in this Technical Report.
3.1 Reliance on Information Provided by the Registrant
For the purpose of this Technical Report, the SLR QP has relied on ownership information provided by Energy Fuels in a legal opinion by Parsons Behle & Latimer dated February 7, 2022, entitled Mining Claim Status Report - Bullfrog Mine, Garfield County, Utah. The opinion was relied on in Section 4 Property Description and Location and the Summary of this Technical Report. The SLR QP has not researched property title or mineral rights for the Bullfrog Project as we consider it reasonable to rely on Energy Fuels' legal counsel who is responsible for maintaining this information.
The SLQ QP has relied on Energy Fuels for the legal aspects of royalties and other encumbrances for the Project, as described in Section 4 Property Description and Location and the relevant sections of the Summary, as confirmed by Daniel Kapostasy P.G., EFR, Vice President, Technical Services, in an email dated October 10, 2024. The reliance is considered reasonable because the information was supplied by a senior technical officer of the registrant with direct knowledge of the property rights and agreements. Mr. Kapostasy is a licensed professional geologist, and Energy Fuels is the project operator with access to and responsibility for legal and financial records. The SLR QP has reviewed the correspondence and supporting context and finds no reason to question the accuracy or completeness of the information relied upon.
The SLR QP has relied on Energy Fuels for guidance on applicable taxes and other government levies or interests, applicable to revenue or income, to evaluate the viability of the Mineral Reserves stated in Section 22 Economic Analysis, and the relevant sections of the Summary of this Technical Report. This information was confirmed by Kara Beck, Tax Manager for EFR, in an email dated May 7, 2025. The SLR QP is unaware of any changes to the US tax code since the date of confirmation. This reliance is considered reasonable as Ms. Beck is a qualified tax professional employed by Energy Fuels, with direct responsibility for tax matters relevant to the Project. Energy Fuels, as the project operator and registrant, maintains current knowledge of corporate tax liabilities applicable to its operations. The SLR QP has reviewed the correspondence and context provided and is satisfied that the information is reliable and appropriate for use in the economic evaluation of the Mineral Reserves.
The SLR QP has taken all appropriate steps, in their professional opinion, to ensure that the above information from Energy Fuels is sound.
| 3-1 | |
| Energy Fuels Inc. | Bullfrog Project | May 9, 2025 |
| Technical Report | SLR Project No.: 123.V02544.00008 |
4.0 Property Description and Location
4.1 Location
The Bullfrog Project consists of two separate contiguous deposits, also known as Copper Bench and Indian Bench. The Project is located in eastern Garfield County, Utah, 17 mi north of Bullfrog Basin Marina on Lake Powell and approximately 40 mi south of the town of Hanksville, Utah. It is situated three miles west of Utah State Highway 276, and approximately five miles north of Ticaboo, Utah (Figure 4-1).
The approximate center of the Project has the following coordinates:
• Universal Transverse Mercator (UTM): 526,649.08 mE, 4,184861.5m N zone 12S
• Geographic: 37°48'38.71"N latitude and110°41'50.09"W longitude (decimal degrees 37.810753, -110.697247)
• State Plane 1983 Utah South FIPS 4303 (US feet) system: 1,872,319.926 E, 10,260,078.280 N
4.2 Land Tenure
EFR's property position at the Project consists of 128 unpatented mining claims located on U.S. Bureau of Land Management (BLM) land, encompassing approximately 2,344 acres (Figure 4-2). Surface access to conduct exploration, development and mining activities on unpatented mining claims is granted by the BLM if the National Environmental Protection Act (NEPA) regulations are met. The Project is 100% owned by EFR and was acquired from Denison Mines Corp. and its affiliates in June 2012.
All claims, which are renewed annually in September of each year, are in good standing until September 1, 2025 (at which time they will be renewed for the following year as a matter of course). All unpatented mining claims are subject to an annual federal mining claim maintenance fee of $200 per claim to the BLM. Table 4-1 lists the mineral claims covering the Project.
| 4-1 | |
| Energy Fuels Inc. | Bullfrog Project | May 9, 2025 |
| Technical Report | SLR Project No.: 123.V02544.00008 |
Table 4-1: List of Claims held by Energy Fuels
| Claim Name | ¼ Sec | Sec-Twp-Rng1 | BLM Serial No | County | Location Date (DD-MM-YY) |
In Good Standing To (DD-MM-YY) |
| BF 12 | SW | 20-34S-11E | UT101373039 | Garfield | 21-Mar-05 | 31-Aug-25 |
| BF 14 | SW | 20-34S-11E | UT101373040 | Garfield | 21-Mar-05 | 31-Aug-25 |
| BF 16 | SW | 20-34S-11E | UT101373041 | Garfield | 21-Mar-05 | 31-Aug-25 |
| BF 18 | SW | 20-34S-11E | UT101373042 | Garfield | 21-Mar-05 | 31-Aug-25 |
| BF 18 | NW | 29-34S-11E | UT101373042 | Garfield | 21-Mar-05 | 31-Aug-25 |
| BF 20 | NW | 29-34S-11E | UT101373622 | Garfield | 21-Mar-05 | 31-Aug-25 |
| BF 22 | NW | 29-34S-11E | UT101373623 | Garfield | 21-Mar-05 | 31-Aug-25 |
| BF 24 | NW | 29-34S-11E | UT101373624 | Garfield | 21-Mar-05 | 31-Aug-25 |
| BF 26 | NW,SW | 29-34S-11E | UT101423817 | Garfield | 20-Dec-75 | 31-Aug-25 |
| BF 28 | SW | 29-34S-11E | UT101549846 | Garfield | 20-Dec-75 | 31-Aug-25 |
| BF 30 | SW | 29-34S-11E | UT101403725 | Garfield | 20-Dec-75 | 31-Aug-25 |
| BF 32 | SW | 29-34S-11E | UT101425838 | Garfield | 20-Dec-75 | 31-Aug-25 |
| BF 34 | SW | 29-34S-11E | UT101405180 | Garfield | 20-Dec-75 | 31-Aug-25 |
| BF 49 | SE,SW | 20-34S-11E | UT101373625 | Garfield | 21-Mar-05 | 31-Aug-25 |
| BF 51 | SE,SW | 20-34S-11E | UT101373626 | Garfield | 21-Mar-05 | 31-Aug-25 |
| BF 53 | SE,SW | 20-34S-11E | UT101373627 | Garfield | 21-Mar-05 | 31-Aug-25 |
| BF 55 | SE,SW | 20-34S-11E | UT101373801 | Garfield | 21-Mar-05 | 31-Aug-25 |
| BF 55 | NE,NW | 29-34S-11E | UT101373801 | Garfield | 21-Mar-05 | 31-Aug-25 |
| BF 57 | NE,NW | 29-34S-11E | UT101373802 | Garfield | 21-Mar-05 | 31-Aug-25 |
| BF 59 | NE,NW | 29-34S-11E | UT101373803 | Garfield | 21-Mar-05 | 31-Aug-25 |
| BF 60 | NE | 29-34S-11E | UT101373804 | Garfield | 21-Mar-05 | 31-Aug-25 |
| BF 61 | NE,NW | 29-34S-11E | UT101373805 | Garfield | 21-Mar-05 | 31-Aug-25 |
| 4-2 | |
| Energy Fuels Inc. | Bullfrog Project | May 9, 2025 |
| Technical Report | SLR Project No.: 123.V02544.00008 |
| Claim Name | ¼ Sec | Sec-Twp-Rng1 | BLM Serial No | County | Location Date (DD-MM-YY) |
In Good Standing To (DD-MM-YY) |
| BF 62 | NE | 29-34S-11E | UT101373806 | Garfield | 21-Mar-05 | 31-Aug-25 |
| BF 63 | NE,NW,SE,SW | 29-34S-11E | UT101479372 | Garfield | 18-Dec-75 | 31-Aug-25 |
| BF 64 | NE,SE | 29-34S-11E | UT101373807 | Garfield | 21-Mar-05 | 31-Aug-25 |
| BF 65 | SE,SW | 29-34S-11E | UT101477279 | Garfield | 18-Dec-75 | 31-Aug-25 |
| BF 66 | SE | 29-34S-11E | UT101373808 | Garfield | 21-Mar-05 | 31-Aug-25 |
| BF 67 | SE,SW | 29-34S-11E | UT101402400 | Garfield | 18-Dec-75 | 31-Aug-25 |
| BF 68 | SE | 29-34S-11E | UT101424826 | Garfield | 18-Dec-75 | 31-Aug-25 |
| BF 69 | SE,SW | 29-34S-11E | UT101403752 | Garfield | 18-Dec-75 | 31-Aug-25 |
| BF 70 | SE | 29-34S-11E | UT101455636 | Garfield | 18-Dec-75 | 31-Aug-25 |
| BF 71 | SE,SW | 29-34S-11E | UT101477582 | Garfield | 18-Dec-75 | 31-Aug-25 |
| BF 72 | SE | 29-34S-11E | UT101424457 | Garfield | 18-Dec-75 | 31-Aug-25 |
| BF 73 | SE,SW | 29-34S-11E | UT101600498 | Garfield | 18-Dec-75 | 31-Aug-25 |
| BF 73 | NE,NW | 32-34S-11E | UT101600498 | Garfield | 18-Dec-75 | 31-Aug-25 |
| BF 74 | SE | 29-34S-11E | UT101403733 | Garfield | 18-Dec-75 | 31-Aug-25 |
| BF 74 | NE | 32-34S-11E | UT101403733 | Garfield | 18-Dec-75 | 31-Aug-25 |
| BF 101 | NW,SW | 28-34S-11E | UT101373809 | Garfield | 21-Mar-05 | 31-Aug-25 |
| BF 102 | NE,NW,SE,SW | 28-34S-11E | UT101373810 | Garfield | 21-Mar-05 | 31-Aug-25 |
| BF 103 | SW | 28-34S-11E | UT101373811 | Garfield | 21-Mar-05 | 31-Aug-25 |
| BF 104 | SE,SW | 28-34S-11E | UT101373812 | Garfield | 21-Mar-05 | 31-Aug-25 |
| BF 105 | SW | 28-34S-11E | UT101403019 | Garfield | 19-Dec-75 | 31-Aug-25 |
| BF 106 | SE,SW | 28-34S-11E | UT101401717 | Garfield | 19-Dec-75 | 31-Aug-25 |
| BF 107 | SW | 28-34S-11E | UT101457165 | Garfield | 19-Dec-75 | 31-Aug-25 |
| BF 108 | SE,SW | 28-34S-11E | UT101424269 | Garfield | 19-Dec-75 | 31-Aug-25 |
| 4-3 | |
| Energy Fuels Inc. | Bullfrog Project | May 9, 2025 |
| Technical Report | SLR Project No.: 123.V02544.00008 |
| Claim Name | ¼ Sec | Sec-Twp-Rng1 | BLM Serial No | County | Location Date (DD-MM-YY) |
In Good Standing To (DD-MM-YY) |
| BF 109 | SW | 28-34S-11E | UT101500930 | Garfield | 19-Dec-75 | 31-Aug-25 |
| BF 110 | SE,SW | 28-34S-11E | UT101404310 | Garfield | 19-Dec-75 | 31-Aug-25 |
| BF 111 | SW | 28-34S-11E | UT101404135 | Garfield | 16-Dec-75 | 31-Aug-25 |
| BF 111 | NW | 33-34S-11E | UT101404135 | Garfield | 16-Dec-75 | 31-Aug-25 |
| BF 112 | SE,SW | 28-34S-11E | UT101339916 | Garfield | 16-Dec-75 | 31-Aug-25 |
| BF 112 | NE,NW | 33-34S-11E | UT101339916 | Garfield | 16-Dec-75 | 31-Aug-25 |
| BF 113 | NW | 33-34S-11E | UT101314657 | Garfield | 23-Feb-06 | 31-Aug-25 |
| BF 114 | NE,NW | 33-34S-11E | UT101609654 | Garfield | 24-Dec-75 | 31-Aug-25 |
| BF 116 | NE,NW | 33-34S-11E | UT101423016 | Garfield | 16-Dec-75 | 31-Aug-25 |
| BF 118 | NE,NW | 33-34S-11E | UT101315585 | Garfield | 16-Feb-05 | 31-Aug-25 |
| BF 120 | NE,NW,SE,SW | 33-34S-11E | UT101315586 | Garfield | 16-Feb-05 | 31-Aug-25 |
| BF 122 | SE,SW | 33-34S-11E | UT101315587 | Garfield | 16-Feb-05 | 31-Aug-25 |
| BF 124 | SE,SW | 33-34S-11E | UT101315588 | Garfield | 16-Feb-05 | 31-Aug-25 |
| BF 126 | SE,SW | 33-34S-11E | UT101424928 | Garfield | 16-Dec-75 | 31-Aug-25 |
| BF 128 | SE,SW | 33-34S-11E | UT101402584 | Garfield | 16-Dec-75 | 31-Aug-25 |
| BF 130 | NE,NW | 4-35S-11E | UT101400733 | Garfield | 16-Dec-75 | 31-Aug-25 |
| BF 130 | SE,SW | 33-34S-11E | UT101400733 | Garfield | 16-Dec-75 | 31-Aug-25 |
| BF 181 | SE | 28-34S-11E | UT101373814 | Garfield | 21-Mar-05 | 31-Aug-25 |
| BF 183 | SE | 28-34S-11E | UT101373815 | Garfield | 21-Mar-05 | 31-Aug-25 |
| BF 185 | SE | 28-34S-11E | UT101408528 | Garfield | 20-Dec-75 | 31-Aug-25 |
| BF 186 | SW | 27-34S-11E | UT101374422 | Garfield | 21-Mar-05 | 31-Aug-25 |
| BF 186 | SE | 28-34S-11E | UT101374422 | Garfield | 21-Mar-05 | 31-Aug-25 |
| BF 187 | SE | 28-34S-11E | UT101339950 | Garfield | 20-Dec-75 | 31-Aug-25 |
| 4-4 | |
| Energy Fuels Inc. | Bullfrog Project | May 9, 2025 |
| Technical Report | SLR Project No.: 123.V02544.00008 |
| Claim Name | ¼ Sec | Sec-Twp-Rng1 | BLM Serial No | County | Location Date (DD-MM-YY) |
In Good Standing To (DD-MM-YY) |
| BF 188 | SW | 27-34S-11E | UT101374423 | Garfield | 21-Mar-05 | 31-Aug-25 |
| BF 188 | SE | 28-34S-11E | UT101374423 | Garfield | 21-Mar-05 | 31-Aug-25 |
| BF 189 | SE | 28-34S-11E | UT101402324 | Garfield | 18-Dec-75 | 31-Aug-25 |
| BF 189 | NE | 33-34S-11E | UT101402324 | Garfield | 18-Dec-75 | 31-Aug-25 |
| BF 190 | SW | 27-34S-11E | UT101374424 | Garfield | 21-Mar-05 | 31-Aug-25 |
| BF 190 | SE | 28-34S-11E | UT101374424 | Garfield | 21-Mar-05 | 31-Aug-25 |
| BF 190 | NE | 33-34S-11E | UT101374424 | Garfield | 21-Mar-05 | 31-Aug-25 |
| BF 190 | NW | 34-34S-11E | UT101374424 | Garfield | 21-Mar-05 | 31-Aug-25 |
| BF 191 | NE | 33-34S-11E | UT101479219 | Garfield | 18-Dec-75 | 31-Aug-25 |
| BF 192 | NE | 33-34S-11E | UT101424819 | Garfield | 18-Dec-75 | 31-Aug-25 |
| BF 192 | NW | 34-34S-11E | UT101424819 | Garfield | 18-Dec-75 | 31-Aug-25 |
| BF 193 | NE | 33-34S-11E | UT101403787 | Garfield | 18-Dec-75 | 31-Aug-25 |
| BF 194 | NE | 33-34S-11E | UT101601944 | Garfield | 18-Dec-75 | 31-Aug-25 |
| BF 194 | NW | 34-34S-11E | UT101601944 | Garfield | 18-Dec-75 | 31-Aug-25 |
| BF 195 | NE | 33-34S-11E | UT101409126 | Garfield | 18-Dec-75 | 31-Aug-25 |
| BF 196 | NE | 33-34S-11E | UT101601682 | Garfield | 18-Dec-75 | 31-Aug-25 |
| BF 196 | NW | 34-34S-11E | UT101601682 | Garfield | 18-Dec-75 | 31-Aug-25 |
| BF 197 | NE,SE | 33-34S-11E | UT101408563 | Garfield | 18-Dec-75 | 31-Aug-25 |
| BF 198 | NE,SE | 33-34S-11E | UT101602044 | Garfield | 18-Dec-75 | 31-Aug-25 |
| BF 198 | NW,SW | 34-34S-11E | UT101602044 | Garfield | 18-Dec-75 | 31-Aug-25 |
| BF 199 | SE | 33-34S-11E | UT101451969 | Garfield | 18-Dec-75 | 31-Aug-25 |
| BF 200 | SE | 33-34S-11E | UT101339009 | Garfield | 18-Dec-75 | 31-Aug-25 |
| BF 200 | SW | 34-34S-11E | UT101339009 | Garfield | 18-Dec-75 | 31-Aug-25 |
| 4-5 | |
| Energy Fuels Inc. | Bullfrog Project | May 9, 2025 |
| Technical Report | SLR Project No.: 123.V02544.00008 |
| Claim Name | ¼ Sec | Sec-Twp-Rng1 | BLM Serial No | County | Location Date (DD-MM-YY) |
In Good Standing To (DD-MM-YY) |
| BF 201 | SE | 33-34S-11E | UT101402710 | Garfield | 18-Dec-75 | 31-Aug-25 |
| BF 202 | SE | 33-34S-11E | UT101401658 | Garfield | 18-Dec-75 | 31-Aug-25 |
| BF 202 | SW | 34-34S-11E | UT101401658 | Garfield | 18-Dec-75 | 31-Aug-25 |
| BF 203 | SE | 33-34S-11E | UT101408214 | Garfield | 18-Dec-75 | 31-Aug-25 |
| BF 204 | SE | 33-34S-11E | UT101403717 | Garfield | 18-Dec-75 | 31-Aug-25 |
| BF 204 | SW | 34-34S-11E | UT101403717 | Garfield | 18-Dec-75 | 31-Aug-25 |
| BF 205 | SE | 33-34S-11E | UT101495307 | Garfield | 19-Dec-75 | 31-Aug-25 |
| BF 206 | SE | 33-34S-11E | UT101480304 | Garfield | 19-Dec-75 | 31-Aug-25 |
| BF 206 | SW | 34-34S-11E | UT101480304 | Garfield | 19-Dec-75 | 31-Aug-25 |
| BF 207 | NE | 4-35S-11E | UT101422475 | Garfield | 19-Dec-75 | 31-Aug-25 |
| BF 207 | SE | 33-34S-11E | UT101422475 | Garfield | 19-Dec-75 | 31-Aug-25 |
| BF 208 | NW | 3-35S-11E | UT101404987 | Garfield | 19-Dec-75 | 31-Aug-25 |
| BF 208 | NE | 4-35S-11E | UT101404987 | Garfield | 19-Dec-75 | 31-Aug-25 |
| BF 208 | SE | 33-34S-11E | UT101404987 | Garfield | 19-Dec-75 | 31-Aug-25 |
| BF 208 | SW | 34-34S-11E | UT101404987 | Garfield | 19-Dec-75 | 31-Aug-25 |
| BF 209 | NE | 4-35S-11E | UT101315590 | Garfield | 16-Feb-05 | 31-Aug-25 |
| BF 210 | NW | 3-35S-11E | UT101408496 | Garfield | 19-Dec-75 | 31-Aug-25 |
| BF 210 | NE | 4-35S-11E | UT101408496 | Garfield | 19-Dec-75 | 31-Aug-25 |
| BF 211 | NE | 4-35S-11E | UT101315591 | Garfield | 16-Feb-05 | 31-Aug-25 |
| BF 212 | NW | 3-35S-11E | UT101301844 | Garfield | 19-Dec-75 | 31-Aug-25 |
| BF 212 | NE | 4-35S-11E | UT101301844 | Garfield | 19-Dec-75 | 31-Aug-25 |
| BF 213 | NE | 4-35S-11E | UT101315592 | Garfield | 16-Feb-05 | 31-Aug-25 |
| BF 214 | NW | 3-35S-11E | UT101315593 | Garfield | 16-Feb-05 | 31-Aug-25 |
| 4-6 | |
| Energy Fuels Inc. | Bullfrog Project | May 9, 2025 |
| Technical Report | SLR Project No.: 123.V02544.00008 |
| Claim Name | ¼ Sec | Sec-Twp-Rng1 | BLM Serial No | County | Location Date (DD-MM-YY) |
In Good Standing To (DD-MM-YY) |
| BF 214 | NE | 4-35S-11E | UT101315593 | Garfield | 16-Feb-05 | 31-Aug-25 |
| BF 215 | NE,SE | 4-35S-11E | UT101315594 | Garfield | 16-Feb-05 | 31-Aug-25 |
| BF 216 | NW,SW | 3-35S-11E | UT101315595 | Garfield | 16-Feb-05 | 31-Aug-25 |
| BF 216 | NE,SE | 4-35S-11E | UT101315595 | Garfield | 16-Feb-05 | 31-Aug-25 |
| BF 217 | SE | 4-35S-11E | UT101315596 | Garfield | 16-Feb-05 | 31-Aug-25 |
| BF 218 | SW | 3-35S-11E | UT101315597 | Garfield | 16-Feb-05 | 31-Aug-25 |
| BF 218 | SE | 4-35S-11E | UT101315597 | Garfield | 16-Feb-05 | 31-Aug-25 |
| BF 219 | SE | 4-35S-11E | UT101316780 | Garfield | 16-Feb-05 | 31-Aug-25 |
| BF 220 | SW | 3-35S-11E | UT101316781 | Garfield | 16-Feb-05 | 31-Aug-25 |
| BF 220 | SE | 4-35S-11E | UT101316781 | Garfield | 16-Feb-05 | 31-Aug-25 |
| BF 279 | NW | 34-34S-11E | UT101374425 | Garfield | 21-Mar-05 | 31-Aug-25 |
| BF 281 | NW | 34-34S-11E | UT101374426 | Garfield | 21-Mar-05 | 31-Aug-25 |
| BF 283 | NW | 34-34S-11E | UT101455667 | Garfield | 21-Dec-75 | 31-Aug-25 |
| BF 285 | NW,SW | 34-34S-11E | UT101404393 | Garfield | 21-Dec-75 | 31-Aug-25 |
| BF 286 | NE,NW,SE,SW | 34-34S-11E | UT101374427 | Garfield | 21-Mar-05 | 31-Aug-25 |
| BF 287 | SW | 34-34S-11E | UT101404938 | Garfield | 21-Dec-75 | 31-Aug-25 |
| BF 288 | SE,SW | 34-34S-11E | UT101374428 | Garfield | 21-Mar-05 | 31-Aug-25 |
| BF 289 | SW | 34-34S-11E | UT101407797 | Garfield | 21-Dec-75 | 31-Aug-25 |
| BF 290 | SE,SW | 34-34S-11E | UT101374429 | Garfield | 21-Mar-05 | 31-Aug-25 |
| BF 291 | SW | 34-34S-11E | UT101493255 | Garfield | 21-Dec-75 | 31-Aug-25 |
| BF 292 | SE,SW | 34-34S-11E | UT101374430 | Garfield | 21-Mar-05 | 31-Aug-25 |
| BF 293 | SW | 34-34S-11E | UT101405785 | Garfield | 21-Dec-75 | 31-Aug-25 |
| BF 294 | SE,SW | 34-34S-11E | UT101374431 | Garfield | 21-Mar-05 | 31-Aug-25 |
| 4-7 | |
| Energy Fuels Inc. | Bullfrog Project | May 9, 2025 |
| Technical Report | SLR Project No.: 123.V02544.00008 |
| Claim Name | ¼ Sec | Sec-Twp-Rng1 | BLM Serial No | County | Location Date (DD-MM-YY) |
In Good Standing To (DD-MM-YY) |
| BF 295 | NW | 3-35S-11E | UT101404612 | Garfield | 21-Dec-75 | 31-Aug-25 |
| BF 295 | SW | 34-34S-11E | UT101404612 | Garfield | 21-Dec-75 | 31-Aug-25 |
| BF 296 | NE,NW | 3-35S-11E | UT101374432 | Garfield | 21-Mar-05 | 31-Aug-25 |
| BF 296 | SE,SW | 34-34S-11E | UT101374432 | Garfield | 21-Mar-05 | 31-Aug-25 |
| BF 297 | NW | 3-35S-11E | UT101494031 | Garfield | 21-Dec-75 | 31-Aug-25 |
| BF 298 | NE,NW | 3-35S-11E | UT101374433 | Garfield | 21-Mar-05 | 31-Aug-25 |
| BF 299 | NW | 3-35S-11E | UT101600496 | Garfield | 21-Dec-75 | 31-Aug-25 |
| BF 300 | NE,NW | 3-35S-11E | UT101374434 | Garfield | 21-Mar-05 | 31-Aug-25 |
| BULL 301 | NW | 3-35S-11E | UT101426244 | Garfield | 04-May-77 | 31-Aug-25 |
| BULL 303 | NW,SW | 3-35S-11E | UT101402325 | Garfield | 05-May-77 | 31-Aug-25 |
| BULL 305 | SW | 3-35S-11E | UT101374435 | Garfield | 21-Mar-05 | 31-Aug-25 |
| BULL 673 | NW,SW | 3-35S-11E | UT101302133 | Garfield | 04-Aug-77 | 31-Aug-25 |
| BULL 674 | NW | 3-35S-11E | UT101529442 | Garfield | 04-Aug-77 | 31-Aug-25 |
| BULL 675 | NW | 3-35S-11E | UT101401669 | Garfield | 03-Aug-77 | 31-Aug-25 |
| BULL 675 | SW | 34-34S-11E | UT101401669 | Garfield | 03-Aug-77 | 31-Aug-25 |
| BULL 676 | SW | 34-34S-11E | UT101405982 | Garfield | 03-Aug-77 | 31-Aug-25 |
| BULL 677 | NW,SW | 34-34S-11E | UT101407675 | Garfield | 02-Aug-77 | 31-Aug-25 |
| BULL 678 | NW | 34-34S-11E | UT101401720 | Garfield | 02-Aug-77 | 31-Aug-25 |
| BULL # 713 | SW | 28-34S-11E | UT101401745 | Garfield | 05-Jan-78 | 31-Aug-25 |
| BULL # 713 | SE | 29-34S-11E | UT101401745 | Garfield | 05-Jan-78 | 31-Aug-25 |
| BULL 714 | NW,SW | 28-34S-11E | UT101374436 | Garfield | 21-Mar-05 | 31-Aug-25 |
| BULL 714 | NE,SE | 29-34S-11E | UT101374436 | Garfield | 21-Mar-05 | 31-Aug-25 |
| BULL 774 | NE,NW | 29-34S-11E | UT101374437 | Garfield | 21-Mar-05 | 31-Aug-25 |
| 4-8 | |
| Energy Fuels Inc. | Bullfrog Project | May 9, 2025 |
| Technical Report | SLR Project No.: 123.V02544.00008 |
| Claim Name | ¼ Sec | Sec-Twp-Rng1 | BLM Serial No | County | Location Date (DD-MM-YY) |
In Good Standing To (DD-MM-YY) |
| BULL 792 | NW | 29-34S-11E | UT101374438 | Garfield | 22-Aug-78 | 31-Aug-25 |
| BULL 793 | SW | 29-34S-11E | UT101403721 | Garfield | 22-Aug-78 | 31-Aug-25 |
| FROG 679 | NW | 4-35S-11E | UT101374439 | Garfield | 21-Mar-05 | 31-Aug-25 |
| FROG 679 | SW | 27-34S-11E | UT101374439 | Garfield | 21-Mar-05 | 31-Aug-25 |
| FROG 679 | NW | 34-34S-11E | UT101374439 | Garfield | 21-Mar-05 | 31-Aug-25 |
| FROG # 690 | SW | 28-34S-11E | UT101421903 | Garfield | 12-Dec-77 | 31-Aug-25 |
| FROG # 690 | SE | 29-34S-11E | UT101421903 | Garfield | 12-Dec-77 | 31-Aug-25 |
| FROG # 690 | NE | 32-34S-11E | UT101421903 | Garfield | 12-Dec-77 | 31-Aug-25 |
| FROG # 690 | NW | 33-34S-11E | UT101421903 | Garfield | 12-Dec-77 | 31-Aug-25 |
Notes:
1. Section - Township - Range
| 4-9 | |
| Energy Fuels Inc. | Bullfrog Project | May 9, 2025 |
| Technical Report | SLR Project No.: 123.V02544.00008 |
Figure 4-1: Location Map
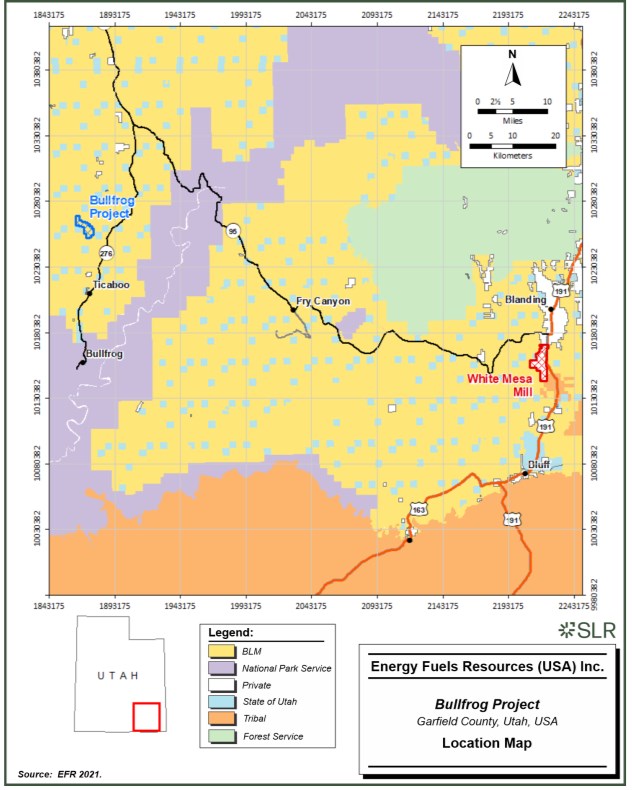
| 4-10 | |
| Energy Fuels Inc. | Bullfrog Project | May 9, 2025 |
| Technical Report | SLR Project No.: 123.V02544.00008 |
Figure 4-2: Land Tenure Map
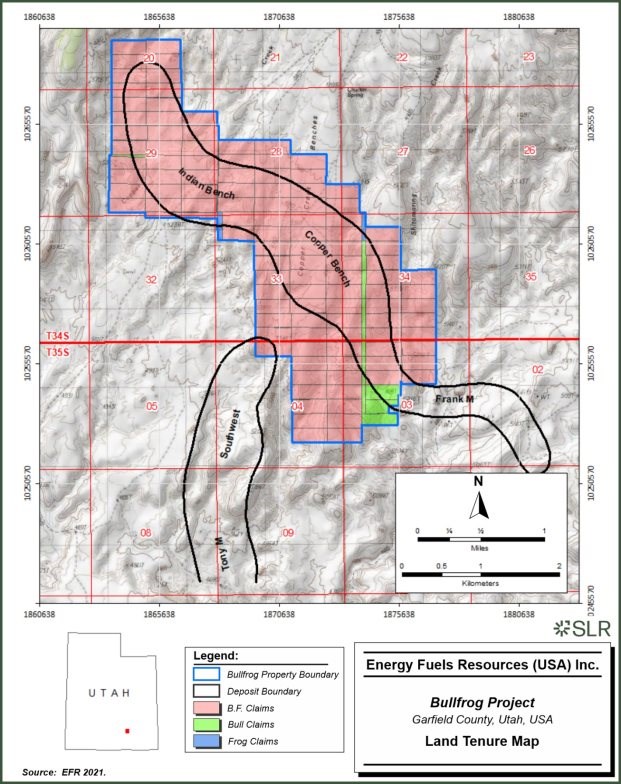
| 4-11 | |
| Energy Fuels Inc. | Bullfrog Project | May 9, 2025 |
| Technical Report | SLR Project No.: 123.V02544.00008 |
4.3 Required Permits and Status
The annual mining claim holding costs for the Project for 2024 was $25,600.
Environmental baseline studies have been completed. Permitting and compliance-related activities are currently ongoing in preparation for submittal of the appropriate permit applications to start operations, as further discussed in Section 20.
4.4 Royalties
There is no royalty burden for the 168 claims that comprise the Project.
4.5 Other Significant Risks
The SLR QP is not aware of any environmental liabilities on the Project. EFR has all required permits to conduct the proposed work on the Project. The SLR QP is not aware of any other significant factors and risks that may affect access, title, or the right or ability to perform the proposed work program on the Project.
| 4-12 | |
| Energy Fuels Inc. | Bullfrog Project | May 9, 2025 |
| Technical Report | SLR Project No.: 123.V02544.00008 |
5.0 Accessibility, Climate, Local Resources, Infrastructure and Physiography
5.1 Accessibility
Road access to the Project is by paved Utah State Highway 276, running between Hanksville, Utah, and Bullfrog Basin Marina, Utah. An unimproved gravel road maintained by Garfield County extends west from Highway 276 (just north of mile marker 19) to the Project. The northern end of the Project can be accessed by the Eggnog Star Spring County Road, approximately 10.4 mi north (near mile marker 17) of Ticaboo, Utah, along Highway 276. A network of unimproved, dirt exploration roads provide access over the Project except in the areas of rugged terrain.
5.2 Vegetation
The vegetation consists primarily of small plants including some of the major varieties of blackbrush, sagebrush, and rabbitbrush. A few small junipers are also present.
5.3 Climate
The climate is distinctly arid with an average annual precipitation of approximately eight inches, in addition to approximately 12 in. of snow. Local records indicate the temperature ranges from a minimum of -10°F to a maximum of 110°F. These conditions allow year-round exploration to occur.
5.4 Local Resources
Skilled labor can be recruited from the region, which has a tradition of uranium mining. Materials and supplies are transported to the site by truck approximately 275 mi from Salt Lake City, Utah, and approximately 190 mi from Grand Junction, Colorado. The distance to Energy Fuels' White Mesa Mill near Blanding, Utah, is 127 mi.
5.5 Infrastructure
The Project is in a relatively remote area of Utah with limited supporting infrastructure in the general vicinity. If the Project is developed, it is anticipated that power will be supplied by diesel generators and water will be supplied by a well. The town of Ticaboo, Utah, is located approximately five miles south of the Project. The next closest community is Hanksville, Utah, a small town of a few hundred people, located approximately 40 mi north of the Project. The Bullfrog Basin Marina airstrip is located approximately 15 mi south of the Project area.
5.6 Physiography
The Project is located on the lower southern flank of Mt. Hillers (10,723 ft elevation), and to the west and northwest of Mount Ellsworth and Mt. Holmes (7,930 ft elevation). The land surface slopes south-southwesterly from these mountains to Lake Powell, which has an average elevation of approximately 3,700 ft.
Relief over the area is approximately 400 ft. The elevation in the Project area ranges from 5,000 ft above sea level (ft ASL) to 5,400 ft ASL over the northern end of the Project. The terrain is typical canyon lands topography, with some areas deeply dissected by gullies and headwalls of canyons and the rest consisting of gently undulating gravel benches covering the northern part of the project area. The terrain in several parts of the Project is particularly rugged and inaccessible and is the primary reason for the irregular pattern of surface drill holes in parts of the Project.
| 5-1 | |
| Energy Fuels Inc. | Bullfrog Project | May 9, 2025 |
| Technical Report | SLR Project No.: 123.V02544.00008 |
There are no perennial streams in the vicinity of the Henry Mountains Complex area, but there are ephemeral streams all of which flow in response to snow melt and rainfall. In the western part of the property area, primary surface waters flow from a series of seeps and springs at the base of the Tununk shale, which is located above the Morrison Formation. The major regional water source is provided by wells developed in the Jurassic-Triassic Navajo sandstone aquifer. The Navajo Sandstone is located at a depth of about 1,800 ft in the Bullfrog property area, placing it about 1,000 ft below the Salt Wash (Jms) uraniferous zones.
| 5-2 | |
| Energy Fuels Inc. | Bullfrog Project | May 9, 2025 |
| Technical Report | SLR Project No.: 123.V02544.00008 |
6.0 History
During World War I, vanadium was mined from small deposits outcropping in Salt Wash exposures on the eastern and southern flanks of the Henry Mountains. In the 1940s and 1950s, interest increased in both vanadium and uranium, and numerous small mines developed along the exposed Salt Wash outcrops.
Prior to 2005, all exploration, mine development, and related activities for the two historical properties (Tony M and Bullfrog) were conducted independently. Many historical activities on the Bullfrog and Tony M properties are therefore discussed separately, except where correlations and comparisons are made.
In the late 1960s, Gulf Minerals (Gulf) acquired a significant land position southwest of the Henry Mountains Complex Property and drilled approximately 70 holes with little apparent success. In 1970 and 1971, Rioamex Corporation conducted a 40-hole drilling program in an east-west zone extending across the southerly end of the Bullfrog property and the northerly end of the Tony M-Frank M property. Some of these holes intercepted significant uranium mineralization.
The history of exploration and development of the Bullfrog property and former Tony M property evolved independently from the mid-1970s until early 2005. The Bullfrog property was initially explored by Exxon, while the former Tony M property was explored and developed by Plateau, a subsidiary of Consumers Power Company (Consumers) of Michigan.
6.1 Prior Ownership
In 1982, Atlas Minerals Corporation (Atlas) acquired the Bullfrog property from Exxon, subsequently returning it to Exxon in 1991. The Bullfrog property was then sold by Exxon to EFNI in 1992. In 1997, IUC became the owner of the Bullfrog property as part of an acquisition in which IUC acquired all of EFNI's assets.
Plateau commenced exploration east of Shootaring Canyon in 1974, and drilled the first holes west of the canyon on the former Tony M property in early 1977. Development of the Tony M decline and mine began on September 1, 1978. Under Plateau, the Shootaring Canyon Uranium Processing Facility (Ticaboo Mill) was developed approximately four miles south of the Tony M mine portals. Operational testing commenced at the Ticaboo Mill on April 13, 1982, with the mill declared ready for operation on June 1, 1982. Following extensive underground development, the Tony M mine was put on care and maintenance in mid-1984 as a result of the cancellation of construction of Consumers' dual-purpose nuclear plants in Midland, Michigan. Plateau's Tony M mine uranium production had been committed to the Midland plants.
Ownership of the former Tony M property was transferred from Plateau to Nuclear Fuels Services, Inc. (NFS) in mid-1990. During its tenure, NFS conducted various investigations including delineation drilling and geologic analysis of the former Tony M property. The report documenting "Geologic analysis of the uranium and vanadium ore reserves in the Tony M Orebody" was prepared for NFS by Nuclear Assurance Corporation (NAC, 1989). Drilling by NFS on the former Tony M property, consisting of 39 rotary holes, was targeted to delineate zones of high-grade uranium mineralization. In addition, with the cooperation of NFS, BP Exploration Inc. drilled one stratigraphic core hole (91-8-14c) on the northern former Tony M property in 1991 (Robinson & McCabe 1997).
In 1994, U.S. Energy Corporation (USEC) of Riverton, Wyoming, then owner of the Ticaboo Mill (which it had acquired from Plateau) entered into an agreement to acquire the Tony M mine and Frank M deposit from NFS. USEC held the mineral properties until the late 1990s when it abandoned them because of the continued low uranium market prices. During this period USEC also conducted a program to close the Tony M mine and reclaim disturbed surface areas, which included backfilling the portals and capping the mine ventilation holes. The buildings and structures were removed, and the terrain was reclaimed and recultivated.
| 6-1 | |
| Energy Fuels Inc. | Bullfrog Project | May 9, 2025 |
| Technical Report | SLR Project No.: 123.V02544.00008 |
In February 2005, the State of Utah offered the Utah State Mineral Lease covering Section 16 Township 35 South (T35S) Range 11 East (R11E), Salt Lake Meridian, for auction. Both the portal of the Tony M mine and the southern portion of the Tony M deposit are located on this State section. IUC was the successful bidder, and the State of Utah leased Section 16 to IUC. Subsequently, IUC entered into an agreement to acquire the Utah State Mineral Lease and 17 unpatented Federal lode mining claims (TIC) located between Section 16 and the Bullfrog property claims.
On December 1, 2006, IUC combined its operations with those of Denison Mines Inc. (DMI), acquiring all issued and outstanding shares of DMI and subsequently amending its name to Denison Mines Corp. (Denison). In February 2007, Denison acquired the former Plateau Tony M property, bringing it under common ownership with the Bullfrog property and renaming the properties the Henry Mountain Complex.
In 2007, the Ticaboo Mill was purchased by Uranium One Inc. from USEC. In 2015, Anfield Energy Inc. acquired the mill from Uranium One Inc. The mill is currently in care and maintenance.
In June 2012, EFR acquired 100% of the Henry Mountains Complex through the acquisition of Denison and its affiliates' U.S. Mining Division.
In October 2021, EFR divested of the Tony M property and Southwest deposit to IsoEnergy Ltd. (formerly CUR), retaining the mineral claims associated with the Bullfrog (Copper Bench and Indian Bench) deposits.
6.2 Exploration and Development History
The primary method of exploration used for Salt Wash uranium/vanadium deposits and for the Project specifically is rotary drilling into the host sandstone followed by logging of the drill hole using a gamma probe. Typically, core is only collected from a few holes to determine vanadium content and to determine if there are any disequilibrium issues.
Denison, and its predecessor IUC, carried out no physical work on the properties, with the exception of review of available data and critical evaluation, until the end of 2005, when certain activities including underground reconnaissance and permitting were initiated. A Notice of Intent to Conduct Exploration E/017/044 was issued by the Utah Division of Oil, Gas and Mining, Department of Natural Resources on December 2, 2005. In addition, IUC filed a Notice of Intent to Conduct Mineral Exploration, UTU-80017, with the BLM, on March 6, 2006. A notice of exploration activities was sent to the Utah State Institutional and Trust Land Administration (SITLA), the owner of Section 16, on September 7, 2005.
6.2.1 Bullfrog and Southwest Deposits Property History
Exxon conducted reconnaissance in the area in 1974 and 1975, resulting in staking of the first "Bullfrog" claims in 1975 and 1976. The first drilling program in 1977 resulted in the discovery of what became the Southwest deposit. Additional claims were subsequently staked, and drilling was continued, first by Exxon's Exploration Group, and then by its Pre-Development Group. Several uranium and vanadium zones were discovered in the Southwest and Copper Bench areas, and mineralization exhibiting potential economic grade was also discovered in the Indian Bench area. With the declining uranium markets of the early 1980s, Exxon prepared a prefeasibility report and then discontinued development of the Bullfrog property. Subsequently, Exxon offered the Bullfrog property to Atlas Minerals Corporation (Atlas) in January 1982.
| 6-2 | |
| Energy Fuels Inc. | Bullfrog Project | May 9, 2025 |
| Technical Report | SLR Project No.: 123.V02544.00008 |
Atlas entered into an agreement to purchase the Bullfrog property from Exxon in July 1982. From July 1982 to July 1983, Atlas completed 112 drill holes delineating the Southwest and Copper Bench deposits on approximately 100 ft centers. In August 1983, Atlas commissioned Pincock, Allen and Holt, Inc. (PAH), to conduct a feasibility study for development of the Southwest and Copper Bench deposits. From July 1983 to March 1984, Atlas completed a core drilling program throughout the Bullfrog property, as well as a rotary drill hole program to delineate the Indian Bench deposit. In November 1983, Atlas renamed the Bullfrog deposits as the "Edward R. Farley Jr. Deposit", but that name is no longer used.
Atlas continued to hold the Bullfrog property until 1990 when a corporate decision was made to consider its sale. During that year, Mine Reserves Associates, Inc. (MRA) of Tucson, Arizona, was retained to prepare mineral inventory and mineable reserve estimates for the Indian Bench deposit and incorporate the results into a project-wide reserve base. Steve Milne of Milne and Associates (Milne), a principal engineer for the PAH study, was engaged in November 1990 to update the PAH feasibility study and to complete an optimization study on selected mining/milling scenarios. The completed Milne study was submitted to Atlas in December 1990 (Milne & Associates, 1990).
Atlas did not sell the Bullfrog property, and in 1991 returned it to Exxon. In late 1992, EFNI, no relation to EFR, acting through its subsidiary Energy Fuels Exploration Company, purchased the Bullfrog property from Exxon. EFNI conducted a geologic review and internal economic analysis of the Bullfrog property. In 1997, International Uranium Corp. (IUC) became the owner of the Bullfrog property as part of an acquisition in which IUC acquired all of EFNI's assets. IUC performed no exploration activities on the properties.
On December 1, 2006, IUC combined its operations with those of DMI and DMI became a subsidiary of IUC. IUC was then renamed Denison.
EFR acquired all three deposits — Copper Bench, Indian Bench, and Southwest — through its acquisition of Denison's U.S. assets in June 2012. No mine development has been conducted on the Project and EFR has carried out no exploration work on the Project.
6.3 Past Production
No past production has occurred at the Project.
| 6-3 | |
| Energy Fuels Inc. | Bullfrog Project | May 9, 2025 |
| Technical Report | SLR Project No.: 123.V02544.00008 |
7.0 Geological Setting and Mineralization
7.1 Regional Geology
The Project is part of the Colorado Plateau physiographic province in southwestern Utah. The Colorado Plateau has been a relatively stable structural province since the end of the Precambrian. During the Paleozoic and Mesozoic, the Colorado Plateau was a stable shelf without major geosynclinal areas of deposition, except during the Pennsylvanian when several thousand feet of black shales and evaporates accumulated in the Paradox Basin of southwestern Colorado and adjacent Utah.
Folding and faulting of basement rocks during the Laramide orogeny of Late Cretaceous and Early Tertiary time produced the major structural features of the Colorado Plateau. Compared to the adjacent areas, however, it affected the plateau only slightly. The nearly horizontal strata were gently flexed, producing the uplifts and basins.
Early Tertiary fluvial and lacustrine sedimentation within the deeper parts of local basins was followed in mid-Tertiary time by laccolithic intrusion and extensive volcanism. Intrusions of diorite and monazite porphyry penetrated the sediments at several sites to form the laccolithic mountains of the central Colorado Plateau. Dikes and sills of similar composition were intruded along the eastern edge of the plateau, probably in Miocene time. Faulting along the south and west margins of the plateau was followed Henry Mountains Basin by epeirogenic uplift and northeastward tilting of the plateau and by continuing erosion which has shaped the present landforms.
7.2 Local Geology
The Project is situated in the southeastern flank of the Henry Mountain basin, a subprovince of the Colorado Plateau physiographic province. The Henry Mountains Basin is an elongate north-south trending doubly plunging syncline in the form of a closed basin. It is surrounded by the Monument Uplift to the southeast, Circle Cliffs Uplift to the southwest, and the San Rafael Swell to the north.
The Project is located to the south of Mt. Hillers (10,723 ft) and to the northwest of Mount Ellsworth and Mt. Holmes (7,930 ft). Exposed rocks in the Project area are Jurassic and Cretaceous in age. Host rocks at the Project are Lower sandstones of the Salt Wash Member (Jms) of the Jurassic Morrison Formation (Jm). In addition, a minor portion (i.e., a few percent) of the Tony M uranium mineralization occurs in the uppermost section of the underlying Tidwell Member (PAH 1985).
Figure 7-1 presents a geologic map of the Bullfrog area.
7.2.1 Stratigraphy
Surface outcrops at the Project include the Tununk Shale Member of the Mancos Shale in the northern portions of the Project area and the Dakota Sandstone and Morrison Formations in the southern portions. Detailed geologic descriptions of the stratigraphic sequence are given below. The stratigraphic section for the Project area is shown in Figure 7-2 and Figure 7-3.
7.2.1.1 Mancos Shale (Tununk Shale Member)
The Tununk Shale Member of the Mancos Shale is a dark gray to blue gray, thinly laminated, calcareous, marine shale that is locally fossiliferous. It contains minor fine-grained quartz sandstone beds. In the Henry Mountains Basin area, it is 440 ft to 720 ft thick (Doelling and Willis 2018).
| 7-1 | |
| Energy Fuels Inc. | Bullfrog Project | May 9, 2025 |
| Technical Report | SLR Project No.: 123.V02544.00008 |
7.2.1.2 Dakota Sandstone
The Dakota Sandstone is a grayish orange to light brown, locally fossiliferous sandstone interbedded with light-olive gray shale in the upper half of the formation. The Dakota contains mostly thin, but locally thick, coal beds in the middle of the formation and dark-brown to black carbonaceous claystone, gray shale, siltstone, and some beds of grayish orange to white coarse-grained sandstone in the lower have of the formation (Doelling and Willis 2018).
7.2.1.3 Morrison Formation
The Morrison Formation is a complex fluvial deposit of Late Jurassic age that occupies an area of approximately 600,000 square miles (mi2), including parts of 13 western states and small portions of three Canadian provinces, far to the north and east of the boundary of the Colorado Plateau.
In most areas of major Salt Wash uranium production in Colorado and Utah, the Morrison Formation consists of only the Salt Wash Member and the conformably overlying Brushy Basin Member. The Tidwell Member underlies the Salt Wash Member in some districts.
Morrison Formation (Brushy Basin Member - Jmb)
The Brushy Basin Member is comprised of variegated mudstone and claystone, minor sandstone, and conglomerate. In the Project area, the thickness of the Brushy Basin ranges between 0 ft and 300 ft (Doelling and Willis 2018).
Morrison Formation (Salt Wash Member - J)
The Salt Wash Member is subdivided into three major facies. Uranium-vanadium orebodies have been found in each of the three facies, but the great majority of ore has been mined from the interbedded sandstone and mudstone facies. In outcrop, the Salt Wash is exposed as one or more massive, ledge-forming sandstones, the number varying from one district to another. Closer to the source areas, as in Arizona, the Salt Wash is mainly a massive sandstone or conglomeratic sandstone broken only by a few, thin interbeds of siltstone or clay. Farther from the source areas, as in the area of the Uravan mineral belt, three or more discontinuous sandstone ledges are common, generally interbedded with approximately equal amounts of thick, laterally persistent siltstones or mudstones.
The sandstones of the Salt Wash have been classified as modified or impure quartzite, ranging from orthoquartzite to feldspathic or tuffaceous orthoquartzite. Carbonate cement is a relatively common component in the Salt Wash. The sandy strata of the Salt Wash Member contain many mineable concentrations of uranium throughout the Henry Basin, most of which are relatively small. The Henry Mountains deposits, together with adjoining deposits, constitute the largest Salt Wash-hosted uranium concentration on the Colorado Plateau.
In the southern Henry Mountains Basin, including the Project area, the Salt Wash Member ranges from 400 ft to 510 ft thick. In the northern part of the Tony M deposit, core hole 91-8-14c intersected 444 ft of the Salt Wash Member. The lower Salt Wash sandstones are finer grained, while the upper Salt Wash sandstones consist of more coarse-grained clastics. The lower Salt Wash is approximately 150 ft thick in the Project area, thinning and becoming less sandy northward from the Project area. Sandstones comprise 80% of the sequence, with siltstones and mudstones making up the remainder. Significant uranium mineralization occurs only in this lower unit.
| 7-2 | |
| Energy Fuels Inc. | Bullfrog Project | May 9, 2025 |
| Technical Report | SLR Project No.: 123.V02544.00008 |
Tidwell and Summerville Formations (Jt and Js)
The Tidwell Member of the Morrison Formation interbeds with the upper Summerville Formation making the contact difficult to define. The Tidwell is composed of alternating thin beds of light-gray and greenish gray, fine-grained, calcareous sandstone and calcareous moderate red or green shale. The Summerville Formation is a reddish brown, ribbed or thinly bedded siltstone and mudstone and brown to white, fine-grained sandstone. Locally it includes pink and white gypsum near the top. Near the top of the formation, the Summerville contains interbedded red and gray mudstone, pink and white gypsum, gray limestone, and gray sandstone that are part of the overlying Tidwell Formation (Doelling and Willis 2018).
7.2.2 Structural Geology
The structural geology of the Project reflects a gentle westward dip off the Monument Uplift, toward the axis of the Henry Mountains Basin, except where the strata have been influenced by the adjacent Mount Hillers and Mount Ellsworth intrusive igneous bodies. As a result, strata at Bullfrog dips a few degrees to the west and southwest.
| 7-3 | |
| Energy Fuels Inc. | Bullfrog Project | May 9, 2025 |
| Technical Report | SLR Project No.: 123.V02544.00008 |
Figure 7-1: Regional Geologic Map
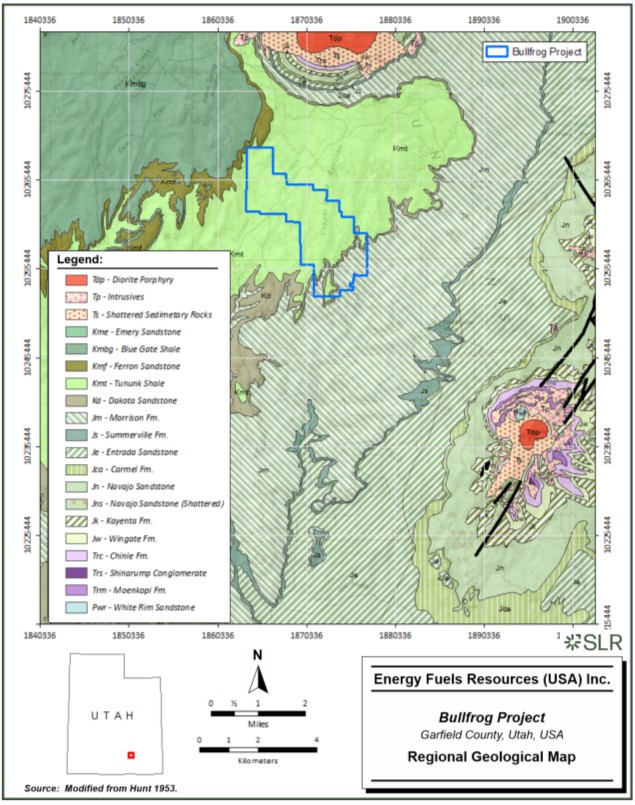
| 7-4 | |
| Energy Fuels Inc. | Bullfrog Project | May 9, 2025 |
| Technical Report | SLR Project No.: 123.V02544.00008 |
Figure 7-2: Regional Stratigraphic Column
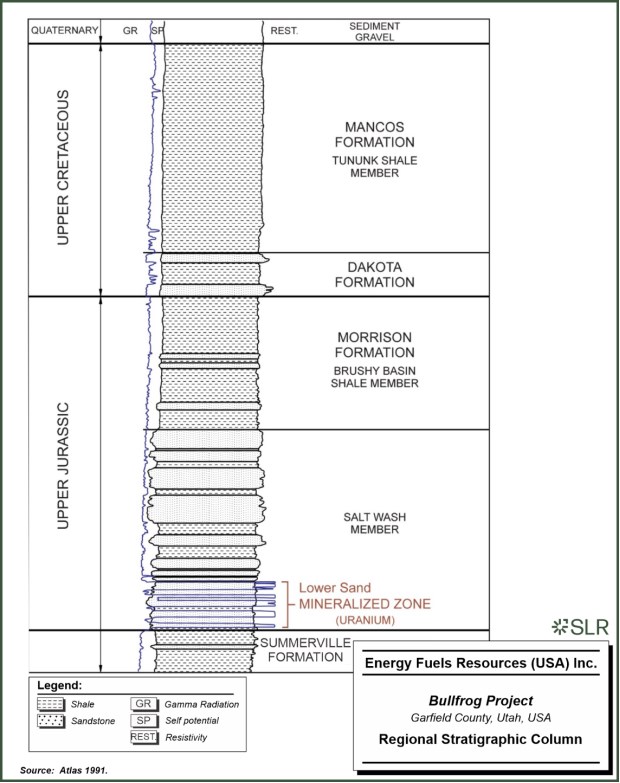
| 7-5 | |
| Energy Fuels Inc. | Bullfrog Project | May 9, 2025 |
| Technical Report | SLR Project No.: 123.V02544.00008 |
Figure 7-3: Detail of the Lower Portion of the Lower Rim of the Salt Wash Member
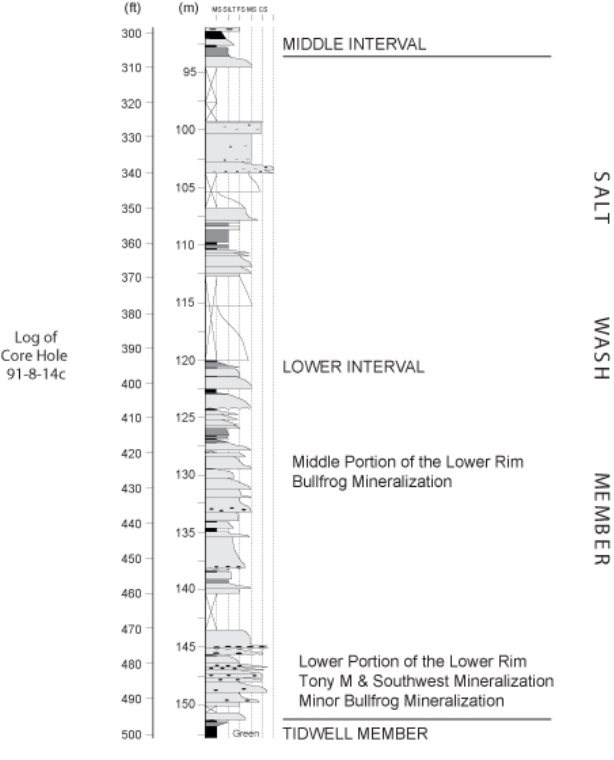
| 7-6 | |
| Energy Fuels Inc. | Bullfrog Project | May 9, 2025 |
| Technical Report | SLR Project No.: 123.V02544.00008 |
7.3 Mineralization
7.3.1 Uranium Mineralization
The uranium-vanadium mineralization in the Henry Mountains Basin area is similar to the mineralization observed elsewhere in the Colorado Plateau.
It occurs as intragranular disseminations within the lower fluvial sand facies (Lower Rim) of the Salt Wash Member containing detrital organic debris. Mineralization primarily consists of coffinite, with minor uraninite, which usually occurs in close association with vanadium mineralization. Mineralization occurs as intergranular disseminations, as well as coatings and/or cement on and between sand grains and organic debris (Northrop and Goldhaber, 1990).
The Lower Rim of the Salt Wash Member has been subdivided into an upper, middle, and a lower unit designated as the Upper-Lower, Middle-Lower, and Lower-Lower. Each of these subunits, in turn, have been subdivided into upper, middle, and lower horizons. The Bullfrog deposit primarily occurs in upper and lower portions of the Middle-Lower unit (i.e., 60 ft to 100 ft above the base) with minor mineralization found in the upper portion of the Lower-Lower unit. Minor mineralization is also seen in the underlying Tidwell formation.
Table 7-1 presents a summary of the naming conventions of the mineralized sands for the Henry Mountains Complex.
Table 7-1: Naming Convention of the Mineralized Sands for the Henry Mountains Complex
| Member | Rim | Unit | Horizon | Zone Abbreviation | Mineralization |
| Brushy Basin | N/A | N/A | N/A | - | None |
| Salt Wash | Top (Upper) | N/A | N/A | - | None |
| Middle | N/A | N/A | - | None | |
| Lower | Upper (Upper-Lower) |
Upper | - | None | |
| Middle | - | None | |||
| Lower | - | None | |||
| Middle (Middle-Lower) |
Upper | MU | Bullfrog | ||
| Middle | - | None | |||
| Lower | ML | Bullfrog | |||
| Lower (Lower-Lower) |
Upper | L | Tony M/Southwest/Bullfrog | ||
| Middle | - | Tony M/Southwest | |||
| Lower | - | Tony M/Southwest | |||
| Tidwell | N/A | N/A | N/A | - | Tony M/Southwest (minor) |
The framework minerals of the Salt Wash host beds for the Tony M deposit are predominantly quartz, (averaging 70% to 79% of the rock) with minor, variable amounts of feldspar (ranging from 1% to 14% and averaging 4%). Rock fragments average about 7% but range from 1% to 60%. Accessory minerals form about 2% or less of the rock. The sandstones are classified as modified or impure quartzite, ranging from orthoquartzite to feldspathic orthoquartzite.
| 7-7 | |
| Energy Fuels Inc. | Bullfrog Project | May 9, 2025 |
| Technical Report | SLR Project No.: 123.V02544.00008 |
The Salt Wash sandstone is cemented by carbonate and silica and/or clay minerals that average about 17% of the total volume of the samples studied. Calcite is the most common carbonate. In the mineralized zones, the proportionate of clay minerals increases and the amount of carbonate decreases. The carbonate in the mineralized zone is also marked by the presence of dolomite. Organic carbon commonly occurs in the concentration of 0.1 to 0.2 weight percent (wt%) but ranges up to 1 wt% or higher in some zones. The predominant type of organic matter is coalified detrital plant debris together with a trace amount (<1%) of unstructured organic matter. This detrital debris occurs as individual elongate fragments a few tens of micrometers to about 5 mm in length. Silicified logs, carbonized organic debris, and pyrite are locally abundant in the uranium-vanadium bearing zone.
Quartz overgrowths in amounts ranging from 1% to 12% are present with the highest concentrations associated directly with the mineralized zone(s).
Other "ore-stage" minerals identified in the U.S. Geologic Survey (USGS) study include pyrite (0% to 3.3%), quartz overgrowths (0% to 17%), dolomite and calcite (Wanty et al., 1990). The quartz overgrowths are often visible to the naked eye within the Tony M mine. While dolomite is associated with the mineralized zones, the abundance of calcite decreases in highly mineralized zones. This is thought to occur because calcite postdates the deposition of vanadium bearing chlorite and other "ore-stage" minerals that preferentially plug the pores of the mineralized zone.
The main uranium mineralized horizons appear as laterally discontinuous, horizontal bands of dark material separated vertically by lighter zones lacking uranium but enriched in vanadium. On a small scale (inches to feet), the dark material often exhibits lithologic control, following cross-bed laminae or closely associated with, though not concentrated directly within, pockets of detrital organic debris.
The Bullfrog deposit extends approximately 3.5 mi along a northwesterly trend to the northeast of the Tony M-Southwest deposit. Mineralization of the Bullfrog deposits ranges in thicknesses of three feet to six feet but occasionally is shown on radiometric logs exceeding 12 ft in some portions of the Project area.
The age of the deposit is 115 million years, indicating that the mineralization formed shortly after deposition of the Brush Basin Member of the Morrison Formation (Ludwig 1986 from Wanty et al. 1990).
7.3.2 Vanadium Mineralization
Vanadium occurs as montroseite (hydrous vanadium oxide) and vanadium chlorite in primary mineralized zones located below the water table (i.e., the northern portion of the Tony M deposit). Montroseite is the only vanadium oxide mineral identified in this interval. An unusual vanadium-bearing chlorite or an interlayered vanadium-bearing chlorite-smectite is the only authigenic clay mineral(s) recognized. The grain size and sorting characteristics of detrital quartz grains vary within the host rocks; cross-bed laminae with coarser grains and better sorting are invariably more highly mineralized (Wanty et al. 1990).
Above the water table vanadium chlorite is absent, while montroseite and a suite of secondary uranium-vanadium minerals are present. These include tyuyamunite, metatyuyamunite, rauvite, and carnotite all of which have been identified in samples from the southern part of the Tony M deposit. Carnotite is a secondary hydrous potassium-vanadium-uranium mineral, while the other three are similar minerals with calcium replacing potassium. The later minerals occur above the water table in the zone that has been subjected to near surface secondary oxidation.
| 7-8 | |
| Energy Fuels Inc. | Bullfrog Project | May 9, 2025 |
| Technical Report | SLR Project No.: 123.V02544.00008 |
The V2O5:U3O8 weight ratios in Salt Wash-type deposits range from about 1:1 to 20:1 with the V2O5:U3O8 routinely reported as 5:1 based on U.S. Atomic Energy Commission (AEC) production records of 18,300 tons for the period 1956 to 1965. Focusing only on the South Henry Mountains (also known as the Little Rockies) mining district, the V2O5:U3O8 ratio is markedly lower with ranges from approximately 1.3:1 to approximately 2.0:1. This value is also based on production records for the period 1956 to 1965, comprising about 6,900 tons produced from several small mines all located within a few miles of the Tony M mine (Doelling 1967).
Determining the concentration of vanadium in a deposit is much more costly and time-consuming than making the equivalent determination for uranium. While indirect determinations of the uranium content may be efficiently made at low cost using gamma logging, chemical analysis is the only way to determine the vanadium content.
Northrop and Goldhaber (1990) established that the relationship between the uranium and vanadium mineralization in the Henry Mountains Mining District is not a simple one. Vanadium enrichment in the mineralized intervals occurred over a thicker interval than uranium. Northrop and Goldhaber (1990) found that while uranium and vanadium often reached their maximum concentration at the top of each uranium-bearing horizon, the vertical distribution of vanadium was frequently distinct from uranium.
While there is a clear tendency for higher-grade uranium to be associated with higher-grade vanadium, the relationship is somewhat erratic and high-grade uranium samples frequently have low concentrations of vanadium.
7.3.3 Other Elements
Table 7-2 shows the concentration of several minor elements occurring with the uranium and vanadium.
Table 7-2: Minor Element Concentrations of Various Rock Composites
| Composite Area |
%Cu | %Zn | %Pb | %Mo | %Zr | %As | Ag (oz/ton) |
Au (oz/ton) |
| Copper Bench | 0.004 | 0.005 | 0.002 | 0.02 | 0.07 | 0.21 | 0.02 | ND |
| Indian Bench | 0.003 | 0.008 | 0.003 | 0.04 | 0.05 | 0.23 | 0.02 | ND |
The average concentration of CaCO3 is a consideration for processing cost and ranges from 5.4% to 11.1%. Northrop and Goldhaber (1990) observed that the character of the mineralized zones which contain significant concentrations of vanadium chlorite and other pore filling minerals effectively blocked the deposition of large amounts of carbonate and therefore the mineralized zones usually have a carbonate content that is less than the non-mineralized Salt Wash sandstone.
Molybdenum concentrations above detection levels were found to occur only close to mineralized horizons, and generally each mineralized horizon has an associated zone of molybdenum enrichment. Vanadium and chromium enrichment in the mineralized intervals occur over a thicker interval than uranium and/or molybdenum.
| 7-9 | |
| Energy Fuels Inc. | Bullfrog Project | May 9, 2025 |
| Technical Report | SLR Project No.: 123.V02544.00008 |
8.0 Deposit Types
Sandstone-type uranium deposits typically occur in fine- to coarse-grained sediments deposited in a continental fluvial environment. The uranium is either derived from a weathered rock containing anomalously high concentrations of uranium, leached from the sandstone itself, or leached from an adjacent stratigraphic unit. It is then transported in oxygenated water until it is precipitated from solution under reducing conditions at an oxidation-reduction front. The reducing conditions may be caused by such reducing agents in the sandstone as carbonaceous material, sulfides, hydrocarbons, hydrogen sulfide, or brines.
There are three major types of sandstone hosted uranium deposits: tabular vanadium-uranium Salt Wash type of the Colorado Plateau, uraniferous humate deposits of the Grants, New Mexico area, and the roll-type deposits of Wyoming. The differences between the Salt Wash deposits and other sandstone hosted uranium deposits are significant. Some of the distinctive differences are as follows:
• The deposits are dominantly vanadium, with accessory uranium.
• One of the mineralized phases is a vanadium-bearing clay mineral.
• The deposits are commonly associated with detrital plant trash, but not redistributed humic material.
• The deposits occur entirely within reduced sandstone, without adjacent tongues of oxidized sandstone.
The vanadium content of the Henry Mountains Basin deposits is relatively low compared to many Uravan deposits. Furthermore, the Henry Mountains Basin deposits occur in broad alluvial sand accumulations, rather than in major sandstone channels as is typical of the Uravan deposits of Colorado. The Henry Mountains Basin deposits do have the characteristic geochemistry of the Uravan deposits and are classified as Salt Wash type deposits.
Extensive research by Northrop and Goldhaber (1990) shows that the Henry Mountains Basin deposits were formed at the interface of an underlying brine with overlying oxygenated flowing waters carrying uranium and vanadium in solution. Reduction and deposition of the mineralization were enhanced where the interface occurred within sandstones containing carbonaceous debris. The multiple mineralized horizons developed at favourable intervals as the brine surface migrated upwards. Geochemical studies indicate the uranium and vanadium were leached either from the Salt Wash sandstone or the overlying Brushy Basin Member.
| 8-1 | |
| Energy Fuels Inc. | Bullfrog Project | May 9, 2025 |
| Technical Report | SLR Project No.: 123.V02544.00008 |
9.0 Exploration
EFR has not conducted any exploration or geotechnical activities on the Project, since acquiring the properties in 2012.
9.1 Hydrogeology
9.1.1 Overview
The proposed Bullfrog underground mine consists of two adjacent sandstone-type uranium deposits, Copper Bench and Indian Bench. The exposed rocks in the Project area date to the Jurassic and Cretaceous periods. The uranium deposit is situated within sandstone of the lower Salt Wash member of the Jurassic Morrison Formation (Jm), primarily composed of coffinite, along with smaller quantities of uraninite and vanadium. The mineralized zone found 60 ft to 100 ft above the base of the Salt Wash member(Western Water & Land 2015).
The SLR QP is not aware of any site-specific hydrogeologic data for the groundwater system in the Project area. However, due to the uniformity of the subsurface water resources, it is reasonable to utilize data from nearby regions. Three hydrogeological reports and additional relevant documents were reviewed, forming the basis for this section (Mower 1980; Blanchard 1986; Western Water & Land 2015). A detailed description of the geological formations in the Lake Powell area, along with hydraulic conductivity information based on grain size analysis for some of these formations, can be found in Blanchard (1986) and its referenced works, including Stokes (1964), Hackman and Wyant (1973), and Peterson and Pipiringos (1979).
During development of the Tony M mine by Plateau, water inflows in the order of 100 gpm were pumped to surface for disposal in an evaporation pond. Estimates of inflow indicated that simultaneous maximum inflows to the proposed Bullfrog mine should not exceed 126 gpm (Plateau 1981).
A 2015 search, confirmed by a recent inquiry by SLR QP, identified one surface water right and four to six groundwater well rights within a one-mile radius of the Project area, as noted by Mower (1980). In line with previous studies by Mower (1980), LASR Geo Consulting (2008), and Energy Fuels (Western Water & Land 2015), no springs were found within this radius. Although there are no perennial streams nearby, ephemeral flows do occur due to rainstorms and snowmelt. The Project is currently in the advanced exploration stage, with environmental permitting and compliance activities underway to commence operations.
No site-specific data has been collected by EFR or other parties; however, this section reviews the available hydrogeological data from the area surrounding the project site.
9.1.2 Main Findings
9.1.2.1 Primary Aquifers
The primary aquifers in the area include the Navajo Sandstone, Wingate Sandstone, and Entrada Sandstone, with the Navajo and Entrada Sandstones being the most frequently used (Blanchard 1986). The Navajo Sandstone, the oldest formation with hydrologic data available for evaluating drinking water and mill water sources, is a thick aquifer that holds significant quantities of high-quality water, making it suitable for both uses (Mower 1980; Blanchard 1986).
While the geologic formations above the Navajo Sandstone in the Project area do contain groundwater, their low yield and poor water quality render them unsuitable for supplying the mill or the town site. Generally, aquifers within the Glen Canyon Group, including these formations, are recharged by precipitation infiltrating directly in exposed bedrock areas, particularly in the southeastern region or at the base of the Henry Mountains, as well as through seepage from nearby bedrock.
| 9-1 | |
| Energy Fuels Inc. | Bullfrog Project | May 9, 2025 |
| Technical Report | SLR Project No.: 123.V02544.00008 |
In addition to the Navajo Sandstone, the following provides an overview of other aquifers within the alluvial and bedrock strata of the Henry Mountains area and the Project site (Western Water & Land, 2015).
9.1.2.2 Secondary Aquifers and Confining Layers
An overview of other aquifers within the alluvial and bedrock strata of the Henry Mountains area and the Project site (Western Water & Land, 2015) follows.
Alluvium and Pediment Gravels: - The uppermost water-bearing unit in the Henry Mountains area consists of unconsolidated Quaternary deposits. Water in these alluvial deposits is intermittent, originating from drainage flows, precipitation infiltration, and discharge from underlying bedrock. A spring and seep survey found several springs near the Bullfrog Project site, though none were within a one-mile radius of the proposed facilities.
Mancos Shale: Though typically a confining unit, the Manco Shale can yield small amounts of water from its sandstone layers, with springs and seeps found near the Bullfrog Project site.
Dakota Sandstone: Underlying the Mancos Shale, the Dakota Sandstone may yield small amounts of water but is not considered a significant aquifer.
Brushy Basin: A member of the Morrison Formation, the Brushy Basin is a confining unit beneath the Dakota Sandstone, generally does not yield water and forms the foundation of the Bullfrog Facilities Area.
Salt Wash Member: The shallowest groundwater at the Project area is found in the Salt Wash Member of the Morrison Formation, though it is not a major aquifer and yields poor-quality water in low amounts. Recharge likely occurs from precipitation infiltration or seepage from surrounding bedrock. Dewatering of the Tony M Mine, south of the Project, was required due to groundwater seepage from the Salt Wash Member, with pumping rates ranging from 15 gpm to 120 gpm.
Summerville Formation: Located beneath the Salt Wash Member, unlikely to yield water, and considered a confining layer.
Entrada Sandstone: It is a major aquifer in the area, likely recharged by precipitation where exposed bedrock and fractured strata exist, particularly near the Henry Mountains. Additional recharge may come from seepage through nearby bedrock and dune sands southwest of Mount Ellsworth. Wells that are screened in the Entrada Sandstone are detailed in the Western Water & Land (2015) report.
Carmel Formation: This formation provides limited water to springs and seeps east of Ticaboo; it primarily acts as a confining layer between the Entrada Sandstone and the Navajo Sandstone of the Glen Canyon Group.
9.1.3 Summary of Previous Permitting and Regulatory Documentation
The Project is currently in the advanced exploration stage, with environmental permitting and compliance activities in progress to begin operations. Western Water & Land (2015) produced a report to fulfill the Utah Department of Environmental Quality's requirements for a Groundwater Discharge Permit and to support EFR's mining and exploration permitting efforts. According to email correspondence (August 1, 2024) with EFR, no permits have been issued for the site at this time; however, a permitting matrix detailing the required permits has been completed.
| 9-2 | |
| Energy Fuels Inc. | Bullfrog Project | May 9, 2025 |
| Technical Report | SLR Project No.: 123.V02544.00008 |
9.1.4 Summary of Hydrogeological Understanding
The Navajo Sandstone, though not exposed at the Project site, lies between 1,000 ft and 2,999 ft below the surface and is estimated to be approximately 797 ft thick (Mower 1980). The potentiometric surface of the aquifer is at least 164 ft above the base of the Carmel Formation, indicating that the Carmel acts as a confining bed (Figure 9-1).
The SLR QP is unaware of any specific hydrogeologic data available for this formation in the Project area; however, the uniformity of the formation permits the use of hydrogeologic data from nearby locations. A pumping test in the Navajo Sandstone aquifer near the Plateau Resources Ltd. mill showed a transmissivity of 234 m²/day and a storage coefficient of about 3 x 10⁻³ (Mower 1980). These values can be applied to the Project due to the typically uniform nature of the Navajo Sandstone and the lack of evidence for significant changes in the sandstone between the two areas. However, the transmissivity and storage coefficient at the Bullfrog project could be slightly higher if the formation of Mount Hillers caused increased fracturing in the sandstone.
Inflow into the mine, necessitating dewatering from the underground workings, is estimated to be approximately 22 gallons per minute (1.4 liters per second) per 0.6 miles of the mine. Dewatering of the Tony M Mine, located south of the Project, recorded pumping rates varying between 15 gpm and 120 gpm (Mower 1980). The reported dewatering results. of Tony M is likely an indicator of the potential for dewatering at the Project site, due to their proximity and similar geological conditions, but further fieldwork and analysis to achieve greater refinement is required per the SLR QP.
No site-specific water quality data is available; within a one-mile radius of the Project area, historical monitoring wells data shows sodium sulfate/sodium carbonate water types that may be classified as "saline" on a Piper diagram. Uranium concentrations in the water ranged from 2.6 µg/L to 22.2 µg/L across three sampling dates (Western Water & Land 2015).
The report by Western Water & Land (2015) includes water quality data from the Tony M Mine and several wells beyond the one-mile radius. The groundwater quality analysis indicates that total dissolved solids (TDS) in well samples ranged from 237 to 808 mg/L, which meets Utah Class II protection standards. In contrast, TDS levels from the Tony M Mine are considerably higher, ranging from 1,970 to 3,660 mg/L. The report by Western Water & Land (2015) includes water quality data from the Tony M Mine (located outside the Project's property boundary) and several wells beyond the one-mile radius. Water from the Tony M Mine, collected from an underground sump, consistently shows a magnesium sulfate to calcium sulfate type, classified near "permanent hardness" on the Piper diagram. This composition differs from groundwater in the Lower Salt Wash unit due to mineral dissolution in the mine's stratigraphic rock layers (Western Water & Land 2015).
9.1.5 Potential Mine Impacts
The SLR QP recommends that the potential impacts of the proposed underground mine on both groundwater and surface water in the Project area should be assessed by gathering site-specific hydrogeological data and conducting numerical modeling.
The need for water treatment during dewatering is uncertain, given the absence of chemical data for the Project site. Once the mine becomes fully operational, a groundwater monitoring program will be essential to assess data from existing underground workings and newly installed monitoring wells.
| 9-3 | |
| Energy Fuels Inc. | Bullfrog Project | May 9, 2025 |
| Technical Report | SLR Project No.: 123.V02544.00008 |
Figure 9-1: Potentiometric Surface of the Navajo Sandston
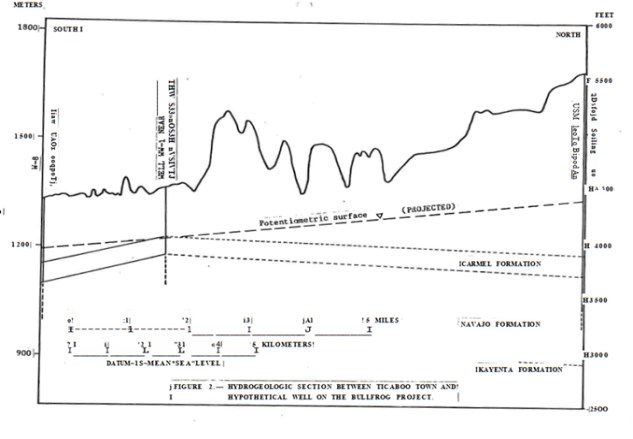
Source: adapted from Mower 1980.
| 9-4 | |
| Energy Fuels Inc. | Bullfrog Project | May 9, 2025 |
| Technical Report | SLR Project No.: 123.V02544.00008 |
10.0 Drilling
Historically the basic tool for exploring on the Project was conducted by rotary drilling using a tricone bit with a nominal diameter of 5.1 in., supplemented by diamond drilling (DD or Core) down to depths of 1,200 ft. Exploration holes at Bullfrog are used to determine lithology and uranium content using radiometric probes.
Drill hole collar locations are recorded on the original drill logs and radiometric logs created at the time of drilling, including easting and northing coordinates in local grid or modified NAD 1983 Utah State Plane FIBPS 4303 (US feet) and elevation of collar in feet above sea level. Due to the horizontally stratified nature of mineralization, downhole deviation surveys are not typically conducted as all drill holes are vertical.
Energy Fuels has not conducted any drilling since acquiring the Project.
10.1 Historical Bullfrog Drilling
Exxon commenced drilling on the Bullfrog property in 1977. Before it sold the Bullfrog property to Atlas in July 1982, Exxon reportedly drilled 1,782 holes. From July 1982 to July 1983, Atlas completed 112 drill holes delineating the Southwest and Copper Bench deposits on approximately 100 ft centers. After July 1983, Atlas completed an additional 49 core hole drilling program throughout the Bullfrog deposit, as well as a 133 rotary drill hole program to delineate the Indian Bench deposit on approximately 200 ft centers. Drill hole spacing in some areas is irregular and more widely spaced where rugged terrain does not allow access. Analysis indicated the Indian Bench deposit is similar to the Copper Bench deposit, and it is a northwesterly continuation of the Copper Bench deposit. The Indian Bench mineralization occurs in the same stratigraphic interval of the Salt Wash Member as the Copper Bench mineralization. The depth of mineralization in the Project is nearly 1,100 ft, with base elevation of the deposit at approximately 4,500 ft ASL.
As of the effective date of this Technical Report, a total of 2,232 drill holes were reportedly completed on the Bullfrog property by both Exxon and Atlas (Schafer 1991). This drilling includes drilling completed over the Southwest deposit which was acquired by CUR in October of 2021.
10.2 Core Drilling
Records indicate that a total of 81 core holes were drilled in the Southwest, Copper Bench, and Indian Bench deposits by EFR's predecessors. These holes were most likely used for equilibrium analysis work, as discussed in Section 11.1.5. No core from any of the deposits is known to exist and was therefore not available to analyze for this Technical Report, but this is nonmaterial to the resource estimation work.
| 10-1 | |
| Energy Fuels Inc. | Bullfrog Project | May 9, 2025 |
| Technical Report | SLR Project No.: 123.V02544.00008 |
Figure 10-1: Bullfrog Drill Hole Location Map
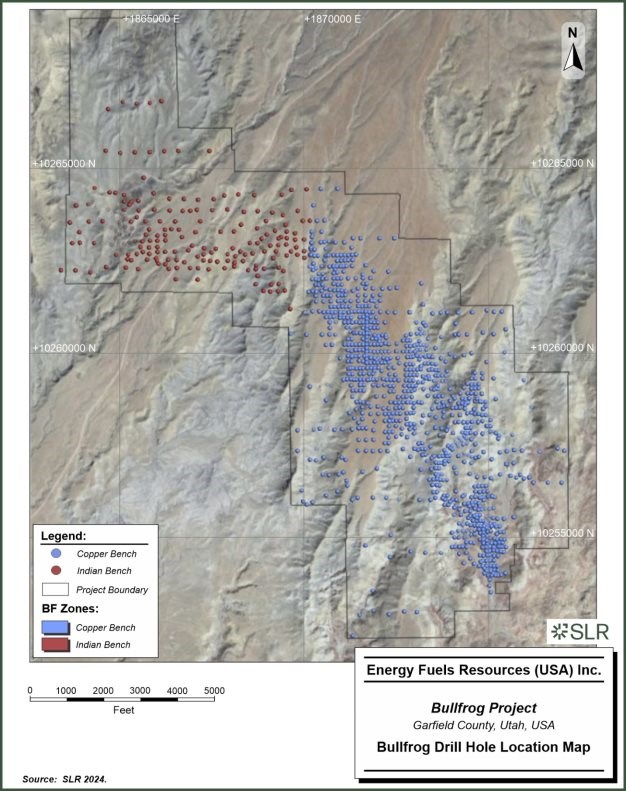
| 10-2 | |
| Energy Fuels Inc. | Bullfrog Project | May 9, 2025 |
| Technical Report | SLR Project No.: 123.V02544.00008 |
11.0 Sample Preparation, Analyses, and Security
11.1 Sample Preparation, Analyses, and Security
11.1.1 Gamma Logging
Exploration drilling for uranium is unique in that core does not need to be recovered from a hole to determine the metal content. Due to the radioactive nature of uranium, probes that measure the decay products or "daughters" can be measured with a downhole gamma probe; this process is referred to as gamma logging. While gamma probes do not measure the direct uranium content, the data collected (in counts per second or CPS) can be used along with probe calibration data to determine an equivalent U3O8 grade in percent (% eU3O8). These grades are very reliable if there is no disequilibrium problem in the area. Disequilibrium will be discussed below. Gamma logging is common in non-uranium drilling and is typically used to discern rock types.
The original downhole gamma logging of surface holes was done on the Bullfrog property by Century Geophysical Corp. (Century) and Professional Logging Services, Inc. (PLS) under contract to Exxon. Atlas also contracted Century for this service. Standard logging suites included radiometric gamma, resistivity, and self-potential measurements, supplemented by neutron-neutron surveys for dry holes. Deviation surveys were conducted for most of the holes. Century used its Compulog system consisting of truck-mounted radiometric logging equipment, including a digital computer. The natural gamma (counts per second, or cps), self potential (millivolts), and resistance (ohms) were recorded at 1/10th foot increments on magnetic tape and then processed by computer to graphically reproducible form. The data were transferred from the tape to computer for use in resource estimation.
Procedures followed by Exxon, Atlas, and Plateau, together with their contractors Century and PLS, were well documented and at the time followed best practices and standards of companies participating in uranium exploration and development. Onsite collection of the downhole gamma data and onsite data conversion limit the possibility of sample contamination or tampering.
11.1.1.1 Calibration
For the gamma probes to report accurate %eU3O8 values the gamma probes must be calibrated regularly. The probes are calibrated by running the probes in test pits maintained historically by the AEC and currently by the DOE. There are test pits in Grand Junction, Colorado, Grants, New Mexico, and Casper, Wyoming. The test pits have known %U3O8 values, which are measured by the probes. A dead time (DT) and K-factor can be calculated based on running the probes in the test pits. These values are necessary to convert CPS to %eU3O8. The dead time accounts for the size of the hole and the decay that occurs in the space between the probe and the wall rock. DT is measured in microseconds (μsec). The K-factor is simply a calibration coefficient used to convert the DT-corrected CPS to %eU3O8.
Quarterly or semi-annual calibration is usually sufficient. Calibration should be done more frequently if variations in data are observed, or the probe is damaged.
11.1.1.2 Method
Following the completion of a rotary hole, a geophysical logging truck will be positioned over the open hole and a probe will be lowered to the hole's total depth. Typically, these probes take multiple different readings. In uranium deposits, the holes are usually logged for gamma, resistivity, standard potential, and hole deviation. Only gamma is used in the grade calculation. Once the probe is at the bottom of the hole, the probe begins recording as the probe is raised. The quality of the data is impacted by the speed the probe is removed from the hole. Experience shows a speed of 20 feet per minute is adequate to obtain data for resource modeling. Data is recorded in CPS, which is a measurement of uranium decay of uranium daughter products, specifically Bismuth-24. That data is then processed using the calibration factors to calculate a eU3O8 grade. Historically, eU3O8 grades were calculated using the AEC half amplitude method, which gives a grade over a thickness. Currently, the eU3O8 grades tend to be calculated on 0.5-foot intervals by software. Depending on the manufacturer of the probe truck and instrumentation, different methods are used to calculate the eU3O8 grade, but all, including the AEC method, are based on the two equations given below.
| 11-1 | |
| Energy Fuels Inc. | Bullfrog Project | May 9, 2025 |
| Technical Report | SLR Project No.: 123.V02544.00008 |
The first equation converts CPS to CPS corrected for the dead time (DT) determined as part of the calibration process
![]()
The second equation converts the Dead Time Corrected CPS (N) to %eU3O8 utilizing the K-factor (K)
![]()
Depending on the drilling and logging environment, additional multipliers can be added to correct for various environmental factors. Typically, these include a water factor for drill hole mud, a pipe factor if the logging is done in the drill steel, and a disequilibrium factor if the deposit is known to be in disequilibrium. Tables for water and pipe factors are readily available.
11.1.2 Core Sampling
11.1.2.1 Sample Preparation
The following information is extracted from the 2012 Technical Report (Roscoe et al., 2012) as reported by the 1983 Report on Disequilibrium Variability (Bhatt 1983) and 1983 Report on Bullfrog Laboratory Studies (Rajala, 1983) as reported by EFR. EFR has not conducted any drilling at the Project since EFR acquired the property in 2012, and therefore no additional samples have been prepared for analysis. No data was available to the SLR QP for review, and the information is included for reference only.
Atlas drilled a number of core holes, from which core was sampled and analyzed. Below is a description of the method used for preparing the composites as reported by Rajala (1983).
Each of the composites consisted of 0.5 ft drill core intervals combined in such a manner as to give a composite head analysis exceeding 0.2% U3O8. Only one-half of the full core was available for composite preparation. The Indian Bench, Southwest, and Copper Bench composite samples contained 45, 104, and 90 core intervals, respectively. When possible, the composites were prepared using equal weights from each interval but, since the sample weight were small (e.g., approximately 50 g), for some of the intervals, the total weight of the composites was limited. Each minus 10-mesh interval was blended on a rolling mat prior to splitting out the appropriate weight for the composite.
The composites were stored in cylindrical containers and then placed on a set of rolls for at least eight hours to achieve complete blending of the intervals. The blended samples were placed on a rolling mat and flattened with a spatula. A head sample, along with 500 g test samples, was split out by random cuts of the primary samples. The head samples were pulverized to minus 100-mesh for chemical analysis.
| 11-2 | |
| Energy Fuels Inc. | Bullfrog Project | May 9, 2025 |
| Technical Report | SLR Project No.: 123.V02544.00008 |
11.1.2.2 Assaying and Analytical Procedure
Every interval was analyzed for U3O8, V2O5, and CaCO3. The initial U3O8 analyses were performed fluorometrically, with samples greater than 0.02% U3O8 being rerun volumetrically. The Atlas Fluorometric Laboratory also performed the initial V2O5 analyses and the Atlas Ore Lots Laboratory repeated V2O5 assays on samples that assayed greater than 0.2% V2O5. Most CaCO3 analyses were run only once in the Ore Lots Laboratory. Results of the analysis are presented in Section 10 Mineral Processing and Metallurgical Testing. Certification and accreditation of the Atlas Laboratory is unknown as the laboratory is no longer in existence. It was independent of EFR.
11.1.3 Radiometric Equilibrium
Disequilibrium in uranium deposits is the difference between equivalent eU3O8 grades and assayed U3O8 grades. Disequilibrium can be either positive, where the assayed grade is greater than the equivalent grades, or negative, where the assayed grade is less than the equivalent grade. A uranium deposit is in equilibrium when the daughter products of uranium decay accurately represent the uranium present. Equilibrium occurs after the uranium is deposited and has not been added to or removed by fluids after approximately one million years. Disequilibrium is determined during drilling when a piece of core is taken and measured by two different methods, a counting method (closed-can) and chemical assay. If a positive or negative disequilibrium is determined, a disequilibrium factor can be applied to eU3O8 grades to account for this issue.
Exxon conducted analyses of samples from core drilling in the Southwest and Copper Bench deposits, using results from Core Labs. Exxon found that the radioactive disequilibrium of potentially economic grade intercepts in cores, measured as the ratio of chemical % U3O8 to log radiometric equivalent (% eU3O8), varied from 0.80 to 1.35 and averaged 1.06, close to the equilibrium value of 1.0. Milne (1990) reported that, while the investigation by Atlas of samples from core from an additional 40 drill holes was incomplete at the time, Atlas had identified no significant disequilibrium problem.
The most comprehensive analysis of disequilibrium of uranium in the area was completed by Bhatt (1983) using the results from 2,354 composite samples collected from buggies coming from the Tony M mine over the period 1980 to 1982. Based on sampling records, Bhatt divided the analytical results according to various areas of origin in the mine. This provided the basis to estimate the relative state of disequilibrium for uranium in different areas of the deposit. A summary of Bhatt's results is given in Table 11-1.
Bhatt reports that the analyses of closed can uranium and chemical uranium were performed at the Plateau laboratory at the Ticaboo Mill. Certification and accreditation of the Plateau Laboratory is unknown as it is no longer operational, and it was independent of EFR. Bhatt also reports that many independent check analyses were sent to independent commercial laboratories as a Quality Assurance practice.
Table 11-1: Plateau Disequilibrium Study
| Mine Block |
No. of Samples | Avg. Probe (% eU3O8) |
Avg. Closed Can (% eU3O8) |
Avg. Chemical (% U3O8) |
Disequilibrium (Closed Can:Chem) |
| B | 426 | 0.104 | 0.117 | 0.114 | 0.98 |
| S | 323 | 0.090 | 0.116 | 0.129 | 1.11 |
| 11-3 | |
| Energy Fuels Inc. | Bullfrog Project | May 9, 2025 |
| Technical Report | SLR Project No.: 123.V02544.00008 |
| Mine Block | No. of Samples | Avg. Probe (% eU3O8) |
Avg. Closed Can (% eU3O8) |
Avg. Chemical (% U3O8) |
Disequilibrium (Closed Can:Chem) |
| E | 504 | 0.086 | 0.103 | 0.113 | 1.09 |
| F | 262 | 0.113 | 0.133 | 0.141 | 1.06 |
| L | 114 | 0.080 | 0.097 | 0.109 | 1.13 |
| Q | 21 | 0.094 | 0.105 | 0.064 | 0.61 |
| H | 60 | 0.044 | 0.055 | 0.072 | 1.31 |
| I | 53 | 0.035 | 0.041 | 0.048 | 1.17 |
| Mine Avg. | 1,763 | 0.092 | 0.109 | 0.116 | 1.06 |
| Protore1 | 265 | 0.047 | 0.065 | 0.058 | 0.89 |
| Source: Bhatt 1983 Notes: 1. Protore is defined as muck with a grade >0.04% eU3O8 and <0.06% eU3O8 |
|||||
Based on the analysis, Bhatt concluded:
• The state of disequilibrium varies from location to location within the deposit.
• With the exception of one small area in the southern part of the deposit, the disequilibrium factor is positive.
• Low-grade material with less than 0.06% U3O8 is depleted in uranium.
• Higher-grade material containing more than 0.06% U3O8 is enriched in uranium.
Bhatt also concluded that the overall weighted disequilibrium factor of chemical to radiometric uranium grade (at a grade x thickness (GT) cut-off of 0.28%-ft) for the Tony M deposit is about 1.06. The disequilibrium factor for Tony M is similar to the factor of 1.06 determined by Exxon for the Southwest and Copper Bench deposits of the Bullfrog property.
Based on the information available, the original gamma log data and subsequent conversion to % eU3O8 values are reliable but slightly conservative estimates of the uranium U3O8 grade. Furthermore, there is no evidence that radiometric disequilibrium would negatively affect the uranium resource estimates of the Copper Bench-Indian Bench deposits.
11.2 Sample Security
EFR has conducted no core sampling since acquiring the properties. All reported core sampling was performed by previous operators Exxon and Atlas. The reported sample preparation, handling of the historical coring, and sample security cannot be confirmed.
11.3 Quality Assurance and Quality Control
EFR Geologists identified 25 twinned drill holes (drilled by Exxon and Atlas) in the Bullfrog deposit, of which 23 were reviewed by AMEC (now Wood) in 2016 to determine the reason there was a large discrepancy between the "original" hole, which typically contained high-grade uranium and the "twin", which typically contained lower-grade uranium. Table 11-2 presents the statistics for both the non-twinned drill holes in the database and the twinned drill holes.
| 11-4 | |
| Energy Fuels Inc. | Bullfrog Project | May 9, 2025 |
| Technical Report | SLR Project No.: 123.V02544.00008 |
Table 11-2: Statistics for Project and Twin Database Holes
| Project Database (DB) | Twin Database (DB) | Twin DB:Project DP | ||||||
| No. Holes | Mean | Std. Dev. | No. Holes | Mean ("Original") | Mean ("Twin") | "Original" | "Twin" | |
| Grade (% eU3O8) | 680 | 0.260 | 0.150 | 23 | 0.406 | 0.262 | 1.563 | 1.008 |
| Thickness (ft) | 680 | 3.800 | 2.410 | 23 | 6.065 | 4.870 | 1.596 | 1.281 |
| GT (ft-%) | 680 | 1.050 | 0.990 | 23 | 2.486 | 2.368 | 2.368 | 1.136 |
AMEC attributed the decrease in thickness and grade between the "Original" and the "Twin" due to selection bias, i.e., the selection of holes with higher grades and thicker mineralized zones to twin as opposed to issues with the method of logging the original holes. The data for the "twin" is much more in line with the larger project database than the "original". In its recommendations, AMEC suggested EFR twin 20 additional holes with the "originals" coming evenly from every 5th percentile in the project database. As of the issuance of this Technical Report, EFR has not conducted any drilling at Bullfrog.
11.4 Conclusions
In the SLR QP's opinion, the historical radiometric logging, analysis, and security procedures at Bullfrog are adequate for use in the estimation of Mineral Resources. The SLR QP also opines that, based on the information available, the original gamma log data and subsequent conversion to % eU3O8 values are reliable. Furthermore, there is no evidence that radiometric disequilibrium would be expected to negatively affect the uranium resource estimates.
The SLR QP is of the opinion that the sample security, analytical procedures, and QA/QC procedures used by EFR meet industry best practices and are adequate to estimate Mineral Resources.
| 11-5 | |
| Energy Fuels Inc. | Bullfrog Project | May 9, 2025 |
| Technical Report | SLR Project No.: 123.V02544.00008 |
12.0 Data Verification
Data verification is the process of confirming that data has been generated with proper procedures, is transcribed accurately from its original source into the project database and is suitable for use as described in this Technical Report.
As part of the resource estimation procedure, drill data is spot checked by EFR personnel and audited by the SLR QP for completeness and validity. Specifically, any data which appears higher or lower than the surrounding data is confirmed by reviewing the original geophysical log. This data review includes confirming that the drill depth was adequate to reflect the mineralized horizon, that the geologic interpretation of host sand is correct, and that the thickness and grade of mineralization is correct.
The primary assay data used to calculate the Mineral Resource estimate for the Bullfrog property is downhole geophysical log data. While the resource estimate methodology has changed since the last Mineral Resource estimate was completed in 2012 (Roscoe et al., 2012), EFR has conducted no additional drilling on the Project or completed any additional data analysis, and the downhole geophysical database remains unchanged since 2012.
The drilling and radiometric logging data associated with the Bullfrog deposit was audited by RPA (now SLR) in 2012, and EFR staff and AMEC (now Wood) consultants in 2016. In all reviews of the Bullfrog data, audits of historical records were completed to assure that the grade, thickness, elevation, and location of uranium mineralization used in preparing the current Mineral Resource estimate corresponded to mineralization indicated by the original gamma logs of drill holes on the Project. EFR and its predecessors reviewed the available information to verify the reliability of the eU3O8 grade as determined by downhole gamma logging. The findings of those studies are provided below.
12.1 RPA Henry Mountain Complex Data Review (2012)
In 2012, RPA conducted audits of historical records to assure that the grade, thickness, elevation, and location of uranium mineralization correspond to mineralization indicated by the original gamma logs of drill holes on the Henry Mountains Complex. RPA reviewed the available information to verify the reliability of the eU3O8 grade as determined by downhole gamma logging.
Exxon and Plateau both conducted programs previously to investigate the state of chemical equilibrium of uranium in their respective deposits, and to verify the reliability of the eU3O8 grade as determined by downhole gamma logging. This was done by comparing the results of chemical analysis of drill core, closed can radiometric analysis of the core samples, and downhole gamma logs for the core intervals in question. Plateau also conducted a much more extensive sampling program from 189,332 tons of mine production, equal to about 80% of total mine production, of mineralized material extracted from the Tony M mine. Analyses of these samples were used to establish the relationship between chemical and radiometric uranium grade within most areas of the deposit (Bhatt, 1983).
While RPA reviewed the detailed results of this verification program as described in Bhatt's 1983 report, RPA did not have access to the original analyses for this investigation. The results of both the core analysis program for the Southwest deposit and Plateau's mine production sampling program indicate that, while the state of chemical equilibrium does vary from zone to zone in the deposits, taken overall, the gamma log estimates of grade are slightly conservative and underestimate the average U3O8 grade by up to 6%. RPA also concurred with Bhatt's conclusion that mineralized material with a grade of <0.06% U3O8 has a chemical uranium content that is lower than the radiometric uranium content and is in a negative state of disequilibrium. Atlas reportedly conducted a program of analysis of core samples, with similar results. RPA did not have access to any of the data from Atlas's investigation.
| 12-1 | |
| Energy Fuels Inc. | Bullfrog Project | May 9, 2025 |
| Technical Report | SLR Project No.: 123.V02544.00008 |
RPA did not verify any chemical analyses for Copper Bench or Indian Bench deposits because no core samples were available.
12.2 EFR-AMEC Bullfrog Deposit Data Review (2016)
In 2016, EFR contracted AMEC (now Wood) to conduct a review of a newly compiled drill hole database for the Copper Bench and Indian Bench portions of the Bullfrog deposit. The compilation of the database was completed as the first step in calculating an updated resource for the Copper Bench and Indian Bench portions of the Bullfrog deposit. That updated resource is provided in Section 11 of this Technical Report.
EFR geologists reviewed all the original drill logs for the Bullfrog deposit and the downhole gamma data was entered. The Upper-Lower, Middle-Lower, and Lower-Lower sands of the Salt Wash Member of the Morrison Formation were interpreted from the geophysical logs. AMEC geologists reviewed this work and provided a report detailing their report and findings. Recommendations included:
1 Thoroughly checking collar elevations for holes with respect to the surface topography wireframe
2 Thoroughly checking the x, y, z coordinates of desurveyed stratigraphic contacts versus coordinates on the wireframe surfaces where holes pierce the wireframes
3 Interpreting mineralized zones on fences as opposed to cross sections, snapping wireframe contacts to drill holes
4 Using the GAMLOGBF2 version to convert natural gamma to eU3O8 for PD series holes. Using Compulog eU3O8 values supplied by Century for the BF series holes.
Item 1 regarded survey busts in the z direction or errors in converting z elevations to the current coordinate system. All collars were tied to z values from an aerial survey conducted at the Project area in 2005 and have since been corrected. Items 2 and 3 refer to the generation of wireframes used to constrain a block model. As the new resource was completed using GT contours and not a block model, these two recommendations do not apply to the current Mineral Resource estimation. Item 4 refers to how counts per second (CPS) values from the gamma log are converted into % eU3O8 values. Century Geophysical has a proprietary software called COMPULOG that automatically converts CPS to % eU3O8 and Item 4 recommends using that data as is for those holes. For those holes not logged by Century (the later PD series holes were drilled by Professional Logging Services), AMEC recommended using an updated version of the GAMLOG algorithm developed by Scott (1962) to convert the CPS to % eU3O8. That conversion was done by AMEC and those values are what are used in the current Bullfrog deposit drill hole database.
Regarding the geologic picks from the geophysical logs done by EFR geologists, AMEC concluded that the picks were accurate and that it was not practical or necessary to subdivide the geologic units.
Based on these reviews of the grade and thickness of uranium mineralization indicated in the original gamma logs for the Bullfrog deposits and comparisons with the computer-generated GT composites, the SLR QP is of the opinion that the original gamma log data and subsequent conversion to eU3O8 values are reliable and suitable for a mineral resource estimate.
| 12-2 | |
| Energy Fuels Inc. | Bullfrog Project | May 9, 2025 |
| Technical Report | SLR Project No.: 123.V02544.00008 |
12.3 SLR Data Verification (2021)
The SLR QP visited the Project and the adjacent Tony M-Southwest property in July 2021 in support of CUR's acquisition of the Tony M and Southwest deposits from EFR in 2021. Discussions were held with the EFR technical team and found them to have a strong understanding of the mineralization types and their processing characteristics, and how the analytical results are tied to the results. The SLR QP received the project data from EFR for independent review as a series of MS Excel spreadsheets and ArcGIS digital files. The SLR QP used the information provided to validate the Mineral Resource interpolation, tons, grade, and classification.
12.3.1 Audit of Drill Hole Database
In preparing the 2022 Technical Report, the SLR QP revisited the work completed in 2012, conducted audits of historical records and a series of verification tests on the drill hole database to assure that the grade, thickness, elevation, and location of uranium mineralization used in preparing the current Mineral Resource estimate correspond to mineralization indicated by the original gamma logs of drill holes on the Project.
The SLR QP's tests included a search for unique, missing, and overlapping intervals, a total depth comparison, duplicate holes, property boundary limits, and verifying the reliability of the % eU3O8 grade conversion as determined by downhole gamma logging. No errors were encountered, and no significant issues were identified.
12.3.2 Audit of GT Contours
Based on its review of the grade and thickness of uranium mineralization indicated in the original gamma logs for the deposits, and comparisons with the computer-generated GT composites, the SLR QP is of the opinion that the original gamma log data and subsequent conversion to eU3O8 values are reliable for use in preparing a Mineral Resource estimate.
The SLR QP carried out check estimates of the historical polygonal models using the GT drill intercept contour method. The contour method has been described by Agnerian and Roscoe (2002) and has been used for many decades for estimation of uranium resources, particularly in the western U.S.
Total GT values for each drill hole intercept within the Middle-Upper (MU), Middle-Lower (ML), and Lower (L) horizon sandstones (zones) were plotted on plans and contoured. Results indicated that although continuity of mineralization is variable, local continuity exists within each sandstone unit in both plan and section as elongate tabular or irregular shapes. Mineralization also occurs in various horizons within the sandstone domains. The contained pounds of U3O8 estimated by the contour method are in the same general range as the historical polygon estimate.
12.4 SLR Data Verification (2024)
12.4.1 Audit of Drill hole Database
SLR audited and validated the drill hole database used for the previous resource estimation (2022) to assure that the grade, thickness, elevation, and location of uranium mineralization are reliable for use in preparing a Mineral Resource estimate. As no additional exploration or drilling activities have occurred since the previous Mineral Resource Estimate which could impact the integrity of the database, the SLR QP continues to accept the database as being accurate and appropriate for Mineral Resource estimates.
| 12-3 | |
| Energy Fuels Inc. | Bullfrog Project | May 9, 2025 |
| Technical Report | SLR Project No.: 123.V02544.00008 |
12.4.2 Audit of GT Contours
Using the validated drill hole database, a trend analysis was conducted in Leapfrog Geo to validate the zones identified by the polygonal models of the GT drill intercept contour method.
The trend analysis model yielded similar results to the GT contour method identifying zones of U3O8 like those defined previously as Middle-Upper (MU), Middle-Lower (ML), and Lower (L).
12.5 Limitations
There were no limitations in place restricting the ability to perform an independent verification of the Project drill hole database. There has been adequate drilling to develop the Mineral Resource models.
12.5.1 Conclusion
The SLR QP is of the opinion that the database contains valid data, the verification procedures for the Bullfrog property comply with industry standards, and the data is suitable for the purposes of Mineral Resource estimation.
| 12-4 | |
| Energy Fuels Inc. | Bullfrog Project | May 9, 2025 |
| Technical Report | SLR Project No.: 123.V02544.00008 |
13.0 Mineral Processing and Metallurgical Testing
The White Mesa Mill is located six miles south of Blanding in southeastern Utah. Construction commenced in June 1979 and was completed in May 1980. Its construction by EFNI was based on the anticipated reopening of many small low-grade mines on the Colorado Plateau, and the mill was designed to treat 2,000 tons of mineralized material per day. The mill has operated at rates in excess of the 2,000 tons per day design rate. The mill has been modified to treat higher grade ores from the Arizona Strip, as well as the common Colorado Plateau ores. Processing of Arizona Strip ores is typically at a lower rate of throughput than for the Colorado Plateau ores. The basic mill process is a sulfuric acid leach with solvent extraction recovery of uranium and vanadium.
Since 1980, the mill has operated intermittently in a series of campaigns to process ores from the Arizona Strip as well as from a few higher-grade mines of the Colorado Plateau. Overall, the mill has produced approximately 30 Mlb U3O8 and 33 Mlb V2O5.
13.1 Metallurgical Testing
The following information is extracted from the 2012 Technical Report (Roscoe et al. 2012) and 1983 Report on Bullfrog Laboratory Studies (Rajala 1983) as reported by EFR. No additional metallurgical testing has been completed on the Project since EFR acquired the Project in 2012 and no data was available to SLR for review.
Drill core from the Bullfrog deposits was tested by Atlas in 1983 to determine metallurgical parameters (Rajala, 1983). Amenability results for a strong acid leach indicated overall recoveries of 99% U3O8 and 90% V2O5. Additional testing of a mild acid leach and an alkaline leach gave recoveries of 97% U3O8 and 40% V2O5 for both. Acid consumption for the strong acid leach was 350 pounds per ton.
Samples from each deposit were combined to give representative composites. Each composite consisted of 0.5 ft drill core intervals combined in such a manner as to give a composite head analysis exceeding 0.2% U3O8. The Southwest, Copper Bench, and Indian Bench composite samples contained, respectively, 104 core intervals from 16 drill holes core intervals, 90 core intervals from seven drill holes, and 45 core intervals from four drill holes. The results of the analyses for uranium, vanadium, and calcium carbonate are compared with the values calculated based on the weighted value of each of the individual core samples included in the composite. Results of the analysis are given in Table 13-1.
Table 13-1: Comparison of Composite Head Analyses with Calculated Head Grade Analyses
| Composite Area | Composite Analysis | Calculated Head Grade | ||||
| %U3O8 | %V2O5 | %CaCO3 | %U3O8 | %V2O5 | %CaCO3 | |
| Southwest | 0.348 | 0.59 | 5.4 | 0.385 | 0.63 | 6.3 |
| Copper Bench | 0.252 | 0.28 | 7.8 | 0.253 | 0.32 | 9.5 |
| Indian Bench | 0.391 | 0.74 | 11.3 | 0.388 | 0.75 | 10.9 |
In 1982, the Shootaring Canyon mill processed some 27,000 tons of mineralized material from the Tony M mine; however, details were not available to SLR.
| 13-1 | |
| Energy Fuels Inc. | Bullfrog Project | May 9, 2025 |
| Technical Report | SLR Project No.: 123.V02544.00008 |
From November 2007 to December 2008, a total of 162,384 tons at 0.131% eU3O8, containing 429,112 lb U3O8, were trucked to the White Mesa Mill at Blanding, Utah, for processing. Of this material, 90,025 tons at 0.165% eU3O8 (297,465 lb) were extracted by Denison from the Tony M mine and 72,359 tons at 0.091% eU3O8 (131,647 lb) came from stockpiled material mined by previous operators. Based on this, the recovery for the Tony M material was estimated to be 95%. As the Copper Bench and Indian Bench deposits are similar to the Tony M deposit, similar recoveries should be expected for the Project.
13.2 Opinion of Adequacy
The QP supports the conclusions of the expected performance of the metallurgical processes based on historical test work.
| 13-2 | |
| Energy Fuels Inc. | Bullfrog Project | May 9, 2025 |
| Technical Report | SLR Project No.: 123.V02544.00008 |
14.0 Mineral Resource Estimates
14.1 Summary
Mineral Resources have been classified in accordance with SEC S-K 1300 definitions, which are consistent with the Canadian Institute of Mining, Metallurgy and Petroleum (CIM) Definition Standards for Mineral Resources and Mineral Reserves dated May 10, 2014 (CIM (2014) definitions), which are incorporated by reference in NI 43-101.
The Mineral Resource estimate was completed using a conventional block modeling approach. The general workflow used by SLR included the construction of a geological or stratigraphic model representing the Morrison Formation (Jm) in Seequent's Leapfrog Geo (Leapfrog Geo) from mapping, drill hole logging, and sampling data, which was then used to define discrete domain and surfaces representing the Lower Zone and the Upper Zone (which is the combination of the ML and MU zones as identified in Table 7-1) of the lower Salt Wash Sandstone Member (Jms). The geologic model was then used to constrain resource estimation completed using Seequent's Leapfrog Edge (Leapfrog Edge) software. The resource estimate used a regularized, unrotated whole block approach, inverse distance cubed (ID3) methodology, and 1.0 ft, uncapped composites to estimate the uranium (eU3O8) in a three-pass search approach. Hard boundaries were used with ellipsoidal search ranges, and search ellipse orientation was informed by geology and mineralization wireframing. Density values were assigned based on historical bulk density records.
Estimates were validated using standard industry techniques including statistical comparisons with composite samples and parallel inverse distance squared (ID2), ordinary kriging (OK), and nearest neighbor (NN) estimates, swath plots, and visual reviews in cross section and plan. A visual review comparing blocks to drill holes was completed after the block modeling work was performed to ensure general lithologic and analytical conformance and was peer reviewed prior to finalization.
Table 14-1 summarizes the Mineral Resource estimate based on a $90/lb uranium price using a cut-off grade of 0.150% eU3O8, with an effective date of December 31, 2024.
| 14-1 | |
| Energy Fuels Inc. | Bullfrog Project | May 9, 2025 |
| Technical Report | SLR Project No.: 123.V02544.00008 |
Table 14-1: Summary of Mineral Resources as at December 31, 2024
| Classification | Grade Cut-off (% eU3O8) |
Tonnage (Mton) |
Grade (% eU3O8) |
Contained Metal (Mlb eU3O8) |
EFR Basis (%) |
Recovery U3O8 (%) |
| Indicated | 0.150 | 1.74 | 0.303 | 10.51 | 100 | 95 |
| Inferred | 0.150 | 0.61 | 0.279 | 3.42 | 100 | 95 |
|
Notes: 1. SEC S-K 1300 definitions were followed for all Mineral Resource categories. These definitions are also consistent with CIM (2014) |
||||||
The SLR QP is of the opinion that with consideration of the recommendations summarized in Sections 1 and 26 of this report, any issues relating to all relevant technical and economic factors likely to influence the prospect of economic extraction can be resolved with further work. The SLR QP is not aware of any environmental, permitting, legal, social, or other factors that would affect the development of the Mineral Resources.
Based on the similarity of the Bullfrog deposit to other past producing uranium deposits in the Colorado Plateau and the Henry Mountain Mining District, the proposed mining methods at Bullfrog will include a combination of long-hole stoping, and a random room and pillar operation with pillar extraction by a retreat system.
While the estimate of Mineral Resources is based on the SLR QP's judgment that there are reasonable prospects for eventual economic extraction, no assurance can be given that Mineral Resources will eventually convert to Mineral Reserves.
14.2 Resource Database
As of the effective date of this Technical Report, historical records of EFR predecessors indicate that approximately 1,694 drill holes have been completed on the Bullfrog deposit. Of the 1,694 drill holes, 949 drill holes totaling 910,780 ft of drilling were used in this Mineral Resource estimate. Historical surface holes missing collar information, lithology information, or corresponding radiometric logs, i.e., assay data, were excluded. A summary of the available data used in the modeling of mineralization is presented in Table 14-2. Figure 10-1 shows the location of the drill holes.
| 14-2 | |
| Energy Fuels Inc. | Bullfrog Project | May 9, 2025 |
| Technical Report | SLR Project No.: 123.V02544.00008 |
Table 14-2: Summary of Drill Hole Data used in Mineral Resource Estimation
| Area | No. Holes | Total Depth |
Average Depth |
Number of Records | Drill Hole Fence Spacing1 |
Drill Hole Spacing Along Fence1 |
||||
| Rotary | DD | Total | (ft) | (ft) | Survey | Lithology | Probe | (ft) | (ft) | |
| Copper Bench | 789 | 36 | 825 | 779,790 | 945 | 825 | 141 | 814 | 100 | 100 |
| Indian Bench | 120 | 4 | 124 | 130,992 | 1,057 | 124 | 87 | 178 | 200 | 200 |
| Grand Total | 909 | 40 | 949 | 910,780 | 2,002 | 949 | 228 | 992 | ||
|
Notes: 1. Drill hole spacing in some areas is irregular and more widely spaced where rugged terrain does not allow access. |
||||||||||
Analysis indicates that the Indian Bench deposit is like the Copper Bench deposit, and it is a northwesterly continuation of the Copper Bench deposit. The Indian Bench mineralization occurs in the same stratigraphic interval of the Jms as the Copper Bench mineralization. The depth below the surface of mineralization is nearly 1,100 ft in the Copper Bench-Indian Bench deposit. The base elevation of the deposit is approximately 4,500 ft ASL.
14.3 Geological Interpretation
14.3.1 Lithological Model
The majority of the uranium mineralization on the Project site is hosted in medium to coarse grained sandstones that exhibit a high degree of large-scale tabular cross-stratification in the Salt Wash Member (Jms) of the Jurassic Morrison Formation (Jm). Strong mineralization appears to be concentrated in the mid-lower half portions of the Salt Wash, although anomalous concentrations of uranium are present throughout the vertical extent of the unit.
The geologic stratigraphy for the Bullfrog deposits were interpreted from either drill core or down hole geophysical logs. That mineralized zones are subdivided into two primary units, the Upper (U) and Lower (L) units. Tops and bottoms of the geologic units were input into the database and the radiometric downhole eU3O8 assay values were assigned a geologic unit based on this data.
14.3.2 Mineralization Model
14.3.2.1 Grade Contouring
Mineralization domains at Bullfrog have been constructed by SLR using the previous GT contour results (Agnerian and Roscoe 2003 as reported in the 2022 Technical Report) as a guide. The GT methodology is a technique best applied to estimate horizontal and vertical extension of relatively planar bodies, i.e., where the two dimensions of the mineralized body are much greater than the third dimension. For the Salt Wash sandstone unit, drill hole intercept using full length composite values of grade were plotted in plan view and contoured utilizing the numerical modeling routines in Leapfrog Geo (Figure 14-1). A minimum cut-off grade value of 0.01% was then established as the outward limit for uranium mineralization to be considered as resource, while the GT and Thickness contours were used for assessing grade continuity direction (Figure 14-2).
| 14-3 | |
| Energy Fuels Inc. | Bullfrog Project | May 9, 2025 |
| Technical Report | SLR Project No.: 123.V02544.00008 |
Figure 14-1: Bullfrog Numerical Grade Contour Model
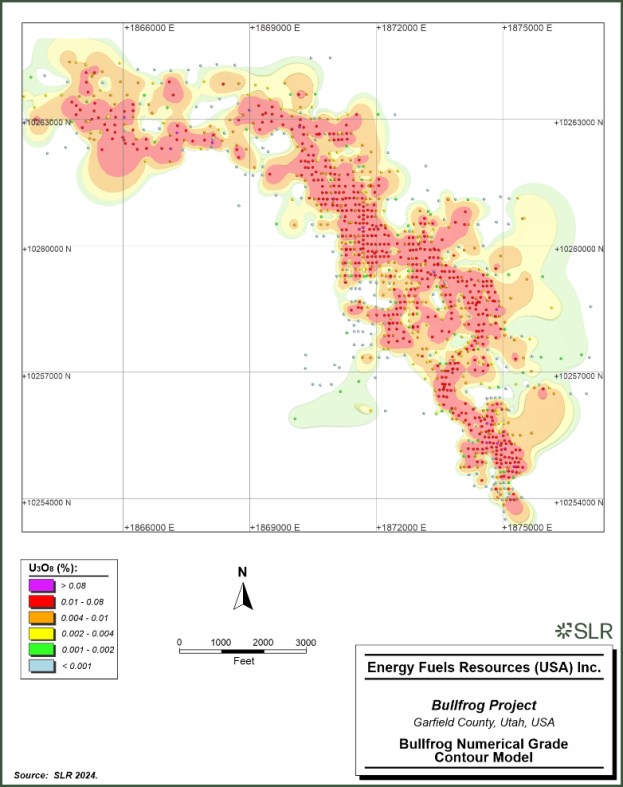
| 14-4 | |
| Energy Fuels Inc. | Bullfrog Project | May 9, 2025 |
| Technical Report | SLR Project No.: 123.V02544.00008 |
Figure 14-2: Bullfrog Numerical Grade Contour Model showing 0.01% U3O8 Cut-off Boundary
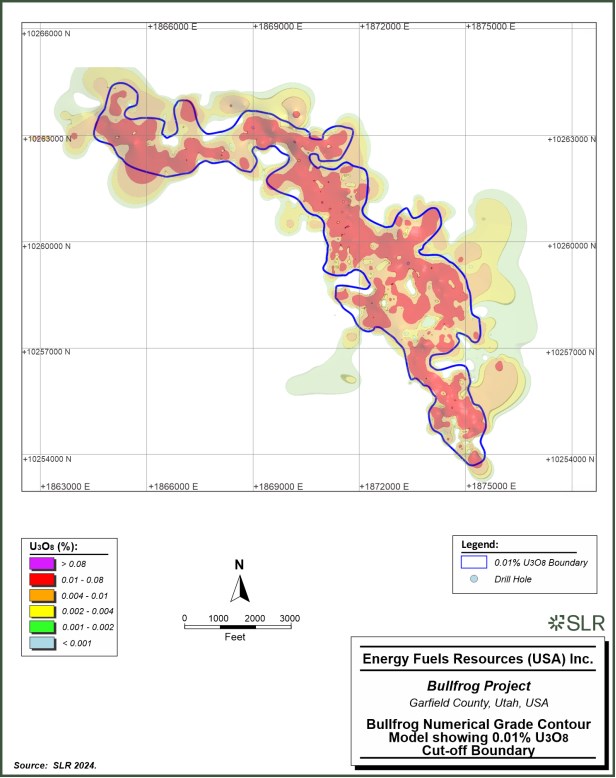
| 14-5 | |
| Energy Fuels Inc. | Bullfrog Project | May 9, 2025 |
| Technical Report | SLR Project No.: 123.V02544.00008 |
14.3.3 Final Estimation Domain Model
Mineralized wireframe domains were constructed using the natural uranium threshold grades of 0.004% U3O8 and 0.01% U3O8 to create an Area of Influence (AOI). In Salt Wash hosted uranium deposits, there is often a very sharp boundary between mineralized and barren material; at Bullfrog, that value is defined as the natural cut-off. The AOI was then used to cut or limit the mineralization in the Upper and Lower mineralized zones within the Salt Wash sandstone unit in the Mineral Resource estimation. Figure 14-3 shows the resulting mineralized wireframes for the U-zone and L-zone for the Salt Wash Member at Bullfrog.
| 14-6 | |
| Energy Fuels Inc. | Bullfrog Project | May 9, 2025 |
| Technical Report | SLR Project No.: 123.V02544.00008 |
Figure 14-3: Bullfrog Final AOI (0.01% eU3O8) Mineralized Domain Model
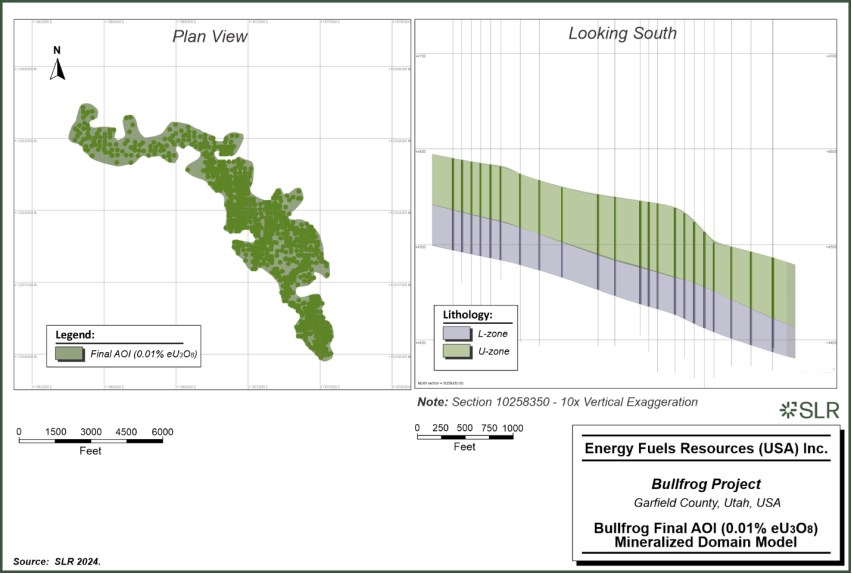
| 14-7 | |
| Energy Fuels Inc. | Bullfrog Project | May 9, 2025 |
| Technical Report | SLR Project No.: 123.V02544.00008 |
14.4 Exploratory Data Analysis
The geologic model was used to code the drill hole database and to identify samples within the mineralized zones. These samples were extracted from the database on a group-by-group basis, subjected to statistical analyses for their respective domains, and then analyzed by means of histograms and probability plots.
Grade statistics were generated for each of the two Lower Salt Wash horizons (U and L) to better understand the uranium mineralization. Representative samples contained within the mineralized wireframe models were selected. Some barren intervals (0.00% U3O8) were included in the wireframes to maintain continuity. General uranium statistics for each of the horizons are presented in Table 14-3.
Table 14-3: Assays for Bullfrog (% eU3O8)
| Zone | Count | Length | Mean | SD | CV | Variance | Min | Lower Quartile | Median | Upper Quartile |
Max |
| (ft) | % eU3O8 | % eU3O8 | % eU3O8 | % eU3O8 | % eU3O8 | % eU3O8 | % eU3O8 | ||||
| Upper (U) | 47,181 | 49,206 | 0.018 | 0.085 | 4.75 | 0.0072 | 0.00 | 0.00 | 0.000 | 0.005 | 4.0 |
| Lower (L) | 6,432 | 35,560 | 0.001 | 0.012 | 14.40 | 0.0001 | 0.00 | 0.00 | 0.00 | 0.0 | 0.9 |
14.5 Treatment of High-Grade Assays
14.5.1 Capping Levels
Where the assay distribution is skewed positively or approaches log-normal, erratic high grade assay values can have a disproportionate effect on the average grade of a deposit. One method of treating these outliers to reduce their influence on the average grade is to cut or cap them at a specific grade level.
Grade capping is a technique used to mitigate the potential effect that a small population of high grade sample outliers can have during grade estimation. These high grade samples are not considered to be representative of the general sample population and are therefore capped to a level that is more representative of the general data population. Although subjective, grade capping is a common industry practice when performing grade estimation for deposits that have significant grade variability. In the absence of production data to calibrate the capping level, inspection of the assay distribution can be used to estimate a "first pass" cutting level.
SLR employed several statistical analytical methods to investigate the presence of high grade outlier values for grade estimation, including preparation of frequency histograms, probability plots of % eU3O8 grade, decile analysis, as well as visualizing these composites and their distribution in space. All mineralization intercepts located inside the mineralized Salt Wash sandstone were used together to assess the risk and determine whether a cap of high-grade values was needed to limit their influence.
The SLR QP is of the opinion that high grade capping is not required for Mineral Resource estimation for this Project.
14.6 Compositing
Composites were created from the uncapped raw assay values using the downhole compositing function of the Leapfrog modeling software package.
| 14-8 | |
| Energy Fuels Inc. | Bullfrog Project | May 9, 2025 |
| Technical Report | SLR Project No.: 123.V02544.00008 |
The selected composite lengths used during interpolation were informed by the predominant sampling length, the minimum mining width, estimated block size, style of mineralization, and continuity of grade. All the radiometric samples (probe data) collected inside AOI mineralized estimation domains were collected at 0.5 ft. Drill holes that were missing and unsampled radiometric data were assigned an equivalent uranium grade value of zero. The average % eU3O8 grades were reviewed and compared at various composite sample lengths to assess the grade continuity at the different lengths. Given this distribution and considering the width of the mineralization, SLR chose to composite to one foot, starting at the mineralized domain wireframe pierce point and continuing to the point at which the hole exited the domain (hard boundaries). The composite statistics by area are summarized in Table 14-4.
Figure 14-4: Bullfrog Histogram of Sample Lengths in the Estimation Domains
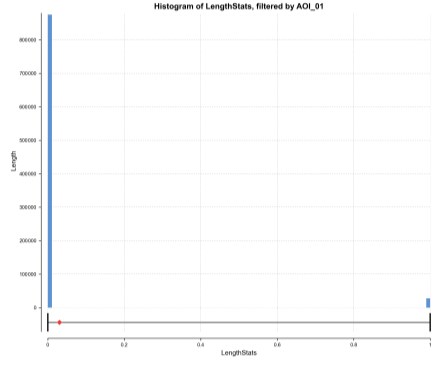
Source: SLR 2024
Table 14-4: Summary of Uranium Composite Data by Area
| Zone | Count | Length | Mean | SD | CV | Variance | Min | Lower Quartile | Median | Upper Quartile | Max |
| (ft) | % eU3O8 | % eU3O8 | % eU3O8 | % eU3O8 | % eU3O8 | % eU3O8 | % eU3O8 | ||||
| Upper (U) | 49,600 | 49,206 | 0.018 | 0.074 | 4.140 | 0.005 | 0.00 | 0.00 | 0.00 | 0.005 | 2.08 |
| Lower (L) | 35,950 | 35,560 | 0.001 | 0.010 | 12.26 | 0.00 | 0.00 | 0.00 | 0.00 | 0.00 | 0.60 |
The SLR QP is of the opinion that the compositing methods and lengths are appropriate for this style of mineralization and deposit type.
| 14-9 | |
| Energy Fuels Inc. | Bullfrog Project | May 9, 2025 |
| Technical Report | SLR Project No.: 123.V02544.00008 |
14.7 Trend Analysis
14.7.1 Variography
Semi-variogram models for continuity analysis of uranium mineralization were constructed using one-foot composites for the mineralized domain for equivalent grade (% eU3O8) using Leapfrog Edge software. Downhole variograms were used to model nugget effects (i.e., assay variability at very close distance).
Examples of experimental and modeled semi-variograms along specific directions of continuity for % eU3O8 at Bullfrog are presented in Table 14-5 and Figure 14-5.
Most of the drilling at Bullfrog was carried out on a 100 ft grid that historically was considered adequate to efficiently delineate the geometry and extent of the zones of mineralization. It is noted that there is a relatively moderate anisotropy in the variography that generally mirrors the historical drill pattern and grid and illustrates continuity of more than 100 ft. The downhole variogram displays a relatively short range and low nugget that is probably reflective of the average thickness and grade distribution of the mineralized zones.
The SLR QP review of the variograms found them to be reasonable and appropriate to be used in the Mineral Resource estimation.
Table 14-5: Variogram Values
| Structure | Normalized Sill |
Model | Alpha | Major (ft) | Semi-Major (ft) |
Minor (ft) |
| Nugget | 0.084 | |||||
| Structure 1 | 0.118 | Spheroidal | 3 | 25.2 | 66.4 | 7.5 |
| Structure 2 | 0.800 | Spheroidal | 3 | 74.9 | 112.1 | 15.2 |
| Total Sill: | 1.002 |
| 14-10 | |
| Energy Fuels Inc. | Bullfrog Project | May 9, 2025 |
| Technical Report | SLR Project No.: 123.V02544.00008 |
Figure 14-5: Major Axis Variogram

Source: SLR 2024.
Figure 14-6: Semi-Major Axis Variogram
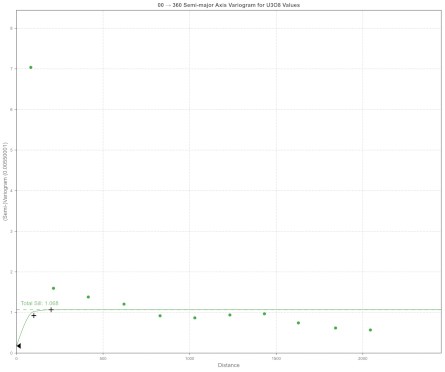
Source: SLR 2024.
| 14-11 | |
| Energy Fuels Inc. | Bullfrog Project | May 9, 2025 |
| Technical Report | SLR Project No.: 123.V02544.00008 |
Figure 14-7: Minor Axis Variogram
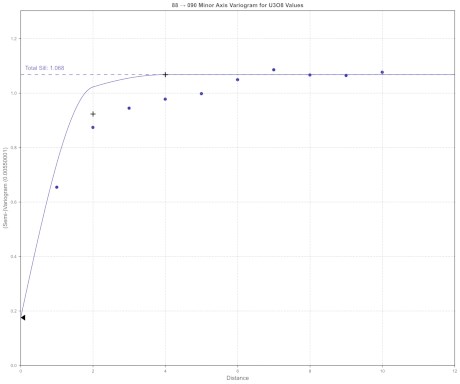
Source: SLR 2024.
14.8 Bulk Density
There is no known density study for the Bullfrog property. Historical bulk density records across the Tony M property located to the south indicate tonnage factors varied from 14 ft3/ton to 17 ft3/ton. Per the 2006 Technical Report (Pool 2006), a tonnage factor of 14.9 ft3/ton was used by Exxon and Atlas in estimating all mineral resources for the Bullfrog property, while a density of 14.7 ft3/ton was used for the Tony M property. Plateau used a bulk tonnage factor of 15.5 ft3/ton for the Tony M property mineral resource estimation, while EFNI used a density of 15.0 ft3 for the Bullfrog property. The maximum difference of 0.4 ft3/ton is approximately 2.0%, and the SLR QP considers the tonnage factor of 15 ft3/ton to be reliable and reasonable for the purposes of Mineral Resource estimation.
Tonnage factor can be derived from specific gravity (SG) with the following formula:
Tonnage factor = (SG * 62.427962)/2000
Where SG is represented by 2.13 g/cm3, which is typical for uranium ore sands in the Colorado Plateau region.
Although the SLR QP is of the opinion that there is a relatively low risk in assuming that density of mineralized zones is similar to that reported in mining operations south of the Project, additional density determinations, particularly in the mineralized zones, should be carried out to confirm and support future resource estimates.
| 14-12 | |
| Energy Fuels Inc. | Bullfrog Project | May 9, 2025 |
| Technical Report | SLR Project No.: 123.V02544.00008 |
14.9 Block Model
A regularized, unrotated whole block approach was used whereby the block was assigned to the domain where its centroid was located. The block model was constructed using Leapfrog Edge version 2023.1 software oriented with an azimuth of 0.0o, dip of 0.0°, and a plunge of 0.0° with a block size of 50 ft by 50 ft in the X (along strike) and Y (across strike) directions, respectively, and 2.0 ft in the Z (vertical or bench height) direction, honoring modeled geological surfaces.
The model fully enclosed the modeled lithologic wireframes, with the model origin (upper left corner at highest elevation) at State Plane 1983 Utah South FIPS 4303 (US feet) system 1,877,500 E,10,264,970 N, and 5,000 feet above sea level (FASL).
A summary of the block extents and variables is provided in Table 14-6 and Table 14-7.
The SLR QP concludes that the block model parameters are appropriate for this type of deposit and are adequate for use in estimating Mineral Resources.
Table 14-6: Summary of Block Model Setup
| Description | Easting (X) (ft) |
North (Y) (ft) |
Elevation (Z) (FASL) |
| Block Model Origin (lower left corner) | 1863150 | 10252770 | 5000 |
| Block Dimension (ft) | 50 | 50 | 2 |
| Number of Blocks | 287 | 244 | 550 |
| Rotation |
Table 14-7: Summary of Block Model Variables
| Variable | Type | Default | Description |
| Lith | Category | Lithology model | |
| AOI 01 | Category | Area of Interest 01 | |
| Classification | Category | Resource Classification Solids | |
| IB- ID2 - eU3O8 - U | Numeric | Indian Bench - ID2 eU3O8 Upper estimators | |
| IB- ID2 - eU3O8 - L | Numeric | Indian Bench - ID2 eU3O8 Lower estimators | |
| CB- ID2 - eU3O8 - U | Numeric | Copper Bench - ID2 eU3O8 Upper estimators | |
| CB- ID2 - eU3O8 - L | Numeric | Copper Bench - ID2 eU3O8 Lower estimators |
14.10 Search Strategy and Grade Interpolation Parameters
14.10.1 Estimation Methodology
The key element variable, uranium, was interpolated using the ID3 methodology. Estimation of grades was controlled by mineralized geologic zones and target area boundaries. Hard boundaries were used to limit the use of composites between different mineralization domains.
The selection of the search radii and rotation of search ellipsoids were guided by modeled continuity from the variograms of % eU3O8. In addition, the search radii were established to assure that all blocks in the estimation domain were estimated.
| 14-13 | |
| Energy Fuels Inc. | Bullfrog Project | May 9, 2025 |
| Technical Report | SLR Project No.: 123.V02544.00008 |
The search neighbourhood was designed with three successive passes. The first pass considered a relatively small search ellipsoid (designed at 100% of the modeled continuity range of the respective variograms), which was increased to approximately 200% in major and semi-major radii of the continuity range for the second pass and 300% for the third pass. The minor search radius remained unchanged and constant and was set to five feet or 2.5 times the block thickness (Table 14-8).
Table 14-8: Sample Selection Parameters Employed in the Estimation by Domain
| Copper Bench | |||||||||
| Pass | Search Ellipse | ||||||||
| Dip (°) |
Azimuth (°) |
Pitch (°) |
Major (ft) |
Semi-Major (ft) |
Minor (ft) |
Minimum Samples |
Maximum Samples |
Max Samples Per Drill Hole |
|
| 1st Pass | 0 | 0 | 0 | 150 | 100 | 5 | 2 | 2 | 2 |
| 2nd Pass | 0 | 0 | 0 | 300 | 200 | 5 | 3 | 10 | 2 |
| 3rd Pass | 0 | 0 | 0 | 600 | 400 | 5 | 1 | 6 | 2 |
| Indian Bench | |||||||||
| Pass | Search Ellipse | ||||||||
| Dip (°) |
Azimuth (°) |
Pitch (°) |
Major (ft) |
Semi-Major (ft) |
Minor (ft) |
Minimum Samples |
Maximum Samples |
Max Samples Per Drill Hole |
|
| 1st Pass | 0 | 0 | 0 | 150 | 220 | 5 | 2 | 2 | 2 |
| 2nd Pass | 0 | 0 | 0 | 300 | 440 | 5 | 3 | 10 | 2 |
| 3rd Pass | 0 | 0 | 0 | 600 | 840 | 5 | 1 | 6 | 2 |
The resource estimation methodology was based on the following:
• All sampling gaps in the % eU3O8 assays were treated as 0.0% eU3O8 grade for resource estimation.
• One foot composited data were not capped for estimation and no high grade search restriction was employed.
• Hard boundary conditions were employed in the estimation.
• Only samples from within the mineralization model domains were used to estimate blocks within those domains.
• The uranium grade was validated using by ID2, NN, and OK.
• The interpolation strategy involved setting up search parameters in three nested estimation runs.
14.10.2 High Grade Restriction
In addition to capping thresholds, a secondary approach to reducing the influence of high grade composites is to restrict the search ellipse dimension (high yield restriction (HYR)) during the estimation process. The threshold grade levels, chosen from the basic statistics and from visual inspection of the apparent continuity of very high grades within each estimation domain, may indicate the need to further limit their influence by restricting the range of their influence, which is generally set to approximately half the distance of the main search.
SLR is of the opinion that HYR is not required for Mineral Resource estimation for this Project.
| 14-14 | |
| Energy Fuels Inc. | Bullfrog Project | May 9, 2025 |
| Technical Report | SLR Project No.: 123.V02544.00008 |
14.11 Reasonable Prospects for Eventual Economic Extraction for Mineral Resources
Mineral Resources must demonstrate reasonable prospects for eventual economic extraction (RPEEE), which generally implies that the quantity and grade estimates meet certain economic thresholds and that the Mineral Resources are reported at an appropriate cut-off grade taking into account extraction scenarios.
Metal prices used for determining Mineral Reserves are based on consensus, long-term forecasts from banks, financial institutions, and other sources. For determining Mineral Resources, the metal prices used are typically higher than those used for determining Mineral Reserves.
A reporting cut-off grade was established for the Project based on assumed costs for both underground and open pit mining and commodity prices that provide a reasonable basis for establishing RPEEE for Mineral Resources.
Cost assumptions from other uranium development projects and recently published studies in the Colorado Plateau, including the 2022 Technical Report, were referenced to ascertain certain operating parameters as they relate to the estimation of a Mineral Resource cut-off grade (COG):
These cost references were modified to align with the assumed production rate for the Project. These cost and price assumptions have been used to inform an optimization process using the underground Deswik Stope Optimizer (Deswik.SO) software, which utilizes a Mineable Shape Optimizer (MSO) algorithm. The processing scenario assumption for the Project is an acid leach process, based on historical mine operations feeding the White Mesa Mill in Blanding, Utah
14.11.1 Cut-off Grade Estimation
The cut-off grade has been estimated based on an underground mining scenario of primarily long-hole stoping, as well as a random room and pillar operation with pillar extraction by a retreat system. Material will be trucked to the White Mesa Mill for processing.
The underground stope optimization parameters used are summarized in Table 14-9.
Table 14-9: Stope Optimization Parameters
| Parameters | Parameters | Unit | Value |
| Room and Pillar / Drift and Fill | Minimum Stope Height | ft | 4 |
| Maximum Stope Height | ft | 100 | |
| Block horizontal dimensions | ft | 50x50 |
The assumed costs for underground and open pit operations and commodity prices, along with the calculated cut-off grades used to establish RPEEE are presented in Table 14-10.
Table 14-10: Assumptions for Underground RPEEE
| Parameter | Units | Value |
| UG Incremental Cost (60%)1 | $/ton | 81.03 |
| Process Cost2 | $/ton | 110.00 |
| Surface Maintenance Labor | $/ton | 1.31 |
| 14-15 | |
| Energy Fuels Inc. | Bullfrog Project | May 9, 2025 |
| Technical Report | SLR Project No.: 123.V02544.00008 |
| Parameter | Units | Value |
| G&A3 | $/ton | 32.50 |
| Transport4 | $/ton | 29.85 |
| Cost | $/ton | 254.69 |
| U3O8 Price | $/lb | 90 |
| Mill Recovery | 95% | |
| Payable | 100% | |
| Net Revenue5 | $/lb | 85.50 |
| $/ton | 171,000 | |
| UG COG | % U3O8 | 0.15 |
| Note: 1. The underground mining cost per ton has been estimated at $135.05/ton based on benchmarking to similar operations. For calculating cut-off grade, internal development costs, estimated at 40% of the underground mining cost per ton, were excluded. 2. Based on actual costs at White Mesa Mill 3. G&A costs include assumptions for costs of travel to and from the Project site, insurance premiums, marketing and accounting, and general maintenance of site buildings. Costs were benchmarked to similar operations and are assumed to be approximately $1.5 million per year for a production rate of 10,000 ton per month. 4. Based on $0.235/ton/mile and 127-mile haulage 5. No royalties or tax were used in the assumptions. |
||
14.11.2 Optimization Results
The cost and price assumptions have been used for the optimization processes in the underground stope optimization and open pit optimization software. These are mine planning tools that automate the design of mineable shapes and maximize the value of the deposit according to the cost and price assumptions and provided design parameters.
The SLR QP cautions that the results from the optimization software are used solely for the purpose of testing the RPEEE by underground methods and do not represent an attempt to estimate Mineral Reserves. There are no Mineral Reserves on the Project. The results are used as a guide to assist in the preparation of a Mineral Resource statement, classification criteria, and to select an appropriate resource reporting cut-off grade.
The resulting shapes are presented in Figure 14-8. The SLR QP notes that the reported Mineral Resources include internal dilution within the underground MSO shapes and surface Whittle pit. No additional dilution or recovery factors were applied.
| 14-16 | |
| Energy Fuels Inc. | Bullfrog Project | May 9, 2025 |
| Technical Report | SLR Project No.: 123.V02544.00008 |
Figure 14-8: Bullfrog MSO Shapes
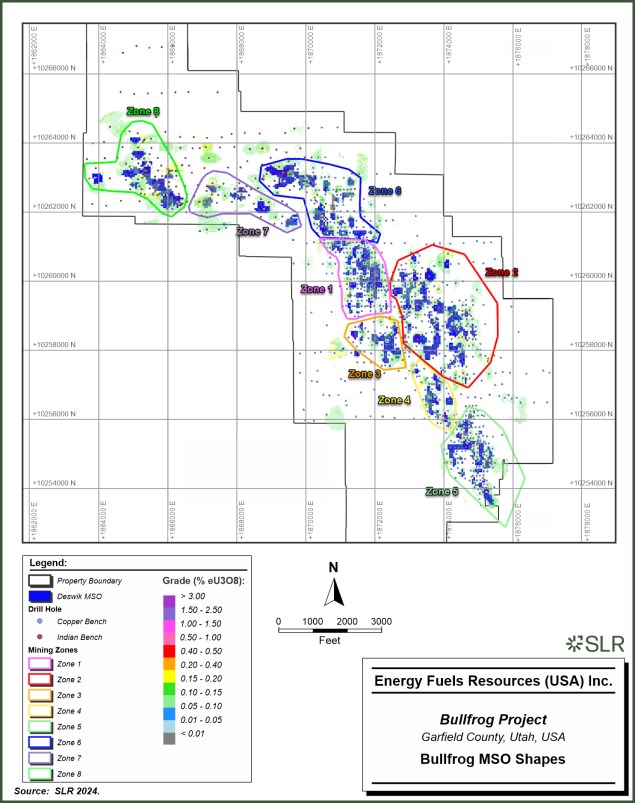
| 14-17 | |
| Energy Fuels Inc. | Bullfrog Project | May 9, 2025 |
| Technical Report | SLR Project No.: 123.V02544.00008 |
14.11.2.1 Contracts
At this time, EFR has not entered into any long-term agreements for the provision of materials, supplies, or labor for the Project. The construction and operations will require negotiation and execution of a few contracts for the supply of materials, services, and supplies.
14.11.3 Environmental, Social, and Governance
Two risks related to environmental, social, and governance (ESG) considerations that could affect the prospects for economic extraction are 1) the time required to obtain all regulatory agency approvals, and 2) the time and costs to obtain a "social license" or its equivalent from the affected Native American groups and other non-Indigenous stakeholders. As is the case with every mining project, there are several ESG-related factors that have the potential to influence the success of obtaining these approvals and becoming Modifying Factors for future reporting of Mineral Resources.
14.11.4 QP Comments on the Reasonable Prospects of Eventual Economic Extraction
In the opinion of the SLR QP, the U3O8 price assumption is moderately conservative based on recent trends in the uranium sector, however, it is consistent with expert uranium market analysts' studies while the mining and processing cost assumptions are consistent with assumptions for similar uranium deposits in the Colorado Plateau based on current benchmarks. The Mineral Resource presented in Section 14.15 may be materially impacted by any future changes in the break-even cut-off grade (both up or down), that may result from changes in mining method selection, mining costs, processing recoveries and costs, metal price fluctuations, significant changes in geological knowledge, or issues obtaining regulatory approvals and/or social license.
14.12 Classification
Classification of Mineral Resources as defined in SEC Regulation S-K subpart 229.1300 were followed for classification of Mineral Resources. The Canadian Institute of Mining, Metallurgy and Petroleum definition Standards for Mineral Resources and Mineral Reserves (CIM 2014) are consistent with these definitions.
A Mineral Resource is defined as a concentration or occurrence of material of economic interest in or on the Earth's crust in such form, grade or quality, and quantity that there are reasonable prospects for economic extraction. A mineral resource is a reasonable estimate of mineralization, considering relevant factors such as cut-off grade, likely mining dimensions, location, or continuity, that with the assumed and justifiable technical and economic conditions, is likely to, in whole or in part, become economically extractable. It is not merely an inventory of all mineralization drilled or sampled.
Based on this definition of Mineral Resources, the Mineral Resources estimated in this Technical Report have been classified according to the definitions below based on geology, grade continuity, and drill hole spacing.
Measured Mineral Resource: Is that part of a mineral resource for which quantity and grade or quality are estimated based on conclusive geological evidence and sampling. The level of geological certainty associated with a measured mineral resource is sufficient to allow a qualified person to apply modifying factors, as defined in this section, in sufficient detail to support detailed mine planning and final evaluation of the economic viability of the deposit. Because a measured mineral resource has a higher level of confidence than the level of confidence of either an indicated mineral resource or an inferred mineral resource, a measured mineral resource may be converted to a proven mineral reserve or to a probable mineral reserve.
| 14-18 | |
| Energy Fuels Inc. | Bullfrog Project | May 9, 2025 |
| Technical Report | SLR Project No.: 123.V02544.00008 |
Indicated Mineral Resource: Is that part of a mineral resource for which quantity and grade or quality are estimated based on adequate geological evidence and sampling. The level of geological certainty associated with an indicated mineral resource is sufficient to allow a qualified person to apply modifying factors in sufficient detail to support mine planning and evaluation of the economic viability of the deposit. Because an indicated mineral resource has a lower level of confidence than the level of confidence of a measured mineral resource, an indicated mineral resource may only be converted to a probable mineral reserve.
Inferred Mineral Resource: Is that part of a mineral resource for which quantity and grade or quality are estimated based on limited geological evidence and sampling. The level of geological uncertainty associated with an inferred mineral resource is too high to apply relevant technical and economic factors likely to influence the prospects of economic extraction in a manner useful for evaluation of economic viability. Because an inferred mineral resource has the lowest level of geological confidence of all mineral resources, which prevents the application of the modifying factors in a manner useful for evaluation of economic viability, an inferred mineral resource may not be considered when assessing the economic viability of a mining project and may not be converted to a mineral reserve.
The SLR QP has considered the following factors that can affect the uncertainty associated with the class of Mineral Resources:
• Reliability of sampling data:
o Drilling, sampling, sample preparation, and assay procedures follow industry standards.
o Data verification and validation work confirm drill hole sample databases are reliable.
o No significant biases were observed in the QA/QC analysis results.
• Confidence in interpretation and modelling of geological and estimation domains:
o Mineralization domains are interpreted from grade intercepts intersecting favorable lithological boundaries.
o While the extensive surface drilling and history of successful uranium mining at the Project would lead to a higher level of classification, the lack of vanadium assays supporting the vanadium potential leads to the vanadium being removed from the resources.
14.12.1 Indicated Mineral Resource
Blocks were classified as Indicated when the maximum average distance to samples used to estimate the block was less than the range of the modeled (variogram) continuity at 90% of the sill (≤ 100 ft drill hole spacing), estimated within the first pass, and contained within the Deswik.SO shapes.
14.12.2 Inferred Mineral Resource
All remaining block estimates within the modeled estimation domain were classified as Inferred.
| 14-19 | |
| Energy Fuels Inc. | Bullfrog Project | May 9, 2025 |
| Technical Report | SLR Project No.: 123.V02544.00008 |
14.13 Estimation Validation
The Bullfrog block model estimates were validated using industry standard techniques including:
• Global validation by comparison of composite statistics versus block estimates
• Local validation using visual inspections on sections and plans, viewing composites versus block estimates
• Local validation by comparison of average assay grades with average block estimates along different directions (swath plots)
The SLR QP found grade continuity to be reasonable and confirmed that the block grades were reasonably consistent with local drill hole composite grades.
14.13.1 Global Statistics
Mean composite grades were compared to the mean density weighted estimated block grades to globally validate the estimates (Table 14-11). In the Upper and Lower domain, the percent difference of the mean grades is less than 2%.
Table 14-11: Mean Composite Grades Compared to the Mean Block Estimates
| Zone | Upper | Lower | ||
| Descriptive Statistic | 1 m Comp |
Block Model |
1 m Comp |
Block Model |
| Count | 65,615.00 | 285,122.00 | 46,387.00 | 217,553.00 |
| Mean | 0.014 | 0.015 | 0.001 | 0.001 |
| STD | 0.067 | 0.056 | 0.011 | 0.008 |
| CV | 4.621 | 3.782 | 11.827 | 10.728 |
| Variance | 0.004 | 0.003 | 0.000 | 0.000 |
| Min | 0.000 | 0.000 | 0.000 | 0.000 |
| Lower quartile | 0.000 | 0.000 | 0.000 | 0.000 |
| Median | 0.000 | 0.000 | 0.000 | 0.000 |
| Upper quartile | 0.004 | 0.006 | 0.000 | 0.000 |
| Max | 2.178 | 1.605 | 0.724 | 0.573 |
14.13.2 Visual Inspection
Block grades were visually compared with drill hole composites on cross sections and longitudinal sections (Figure 14-9 and Figure 14-10). Visual validation comparing assay and composite grades to block grade estimates showed reasonable correlation with no significant overestimation or overextended influence of high grades in all domains.
| 14-20 | |
| Energy Fuels Inc. | Bullfrog Project | May 9, 2025 |
| Technical Report | SLR Project No.: 123.V02544.00008 |
Figure 14-9: Upper Cross Section 1873400 E
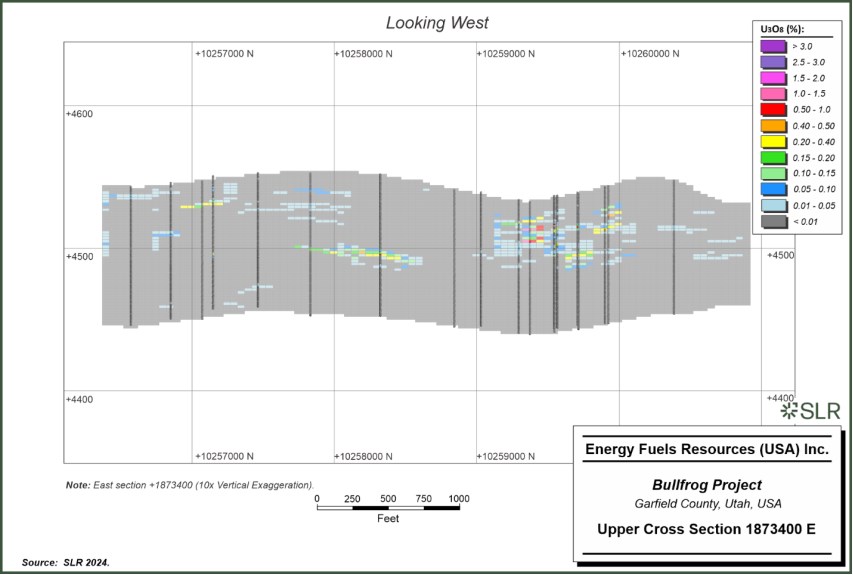
| 14-21 | |
| Energy Fuels Inc. | Bullfrog Project | May 9, 2025 |
| Technical Report | SLR Project No.: 123.V02544.00008 |
Figure 14-10: Upper Long Section 10259300 N
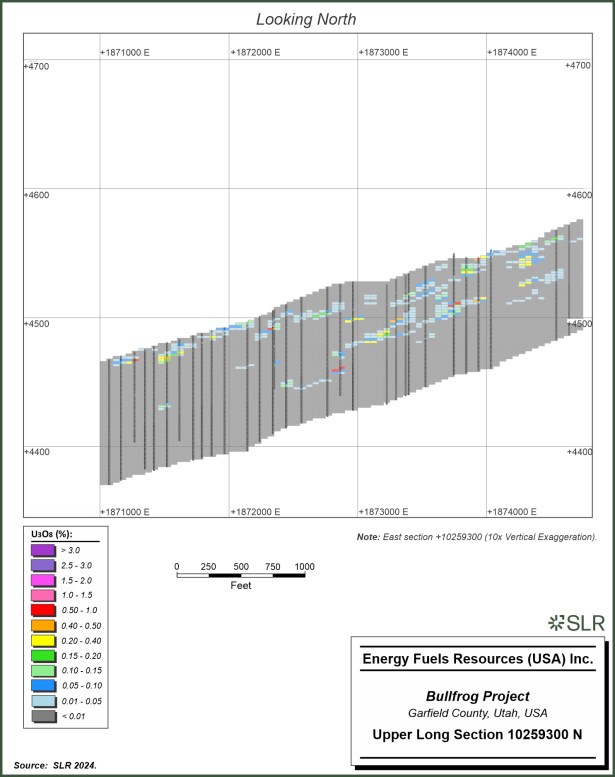
| 14-22 | |
| Energy Fuels Inc. | Bullfrog Project | May 9, 2025 |
| Technical Report | SLR Project No.: 123.V02544.00008 |
14.13.3 Trend (Swath) Plots
Average composite grades and average block estimates along different directions and the effects of different estimation methods, such as OK, ID, and NN, were compared. This involved calculating average composite grades and comparing them with average block estimates along east-west (X), north-south (Y) and elevation (Z) swaths. The swath dimensions are 5 ft in thickness.
Examples of swath plots from Bullfrog are presented in Figure 14-11, Figure 14-12, and Figure 14-13. The mean U3O8 composite grades and the mean non-density weighted estimated U3O8 block grades are quite similar in all directions. The estimates, as expected, are somewhat smoother than the composite grades, particularly where there are limited samples or very high-grade composites.
The swath plots show that there is good spatial correlation between different estimation methods, composite grades, and block model grades
Figure 14-11: Trend Plot X (East) Direction
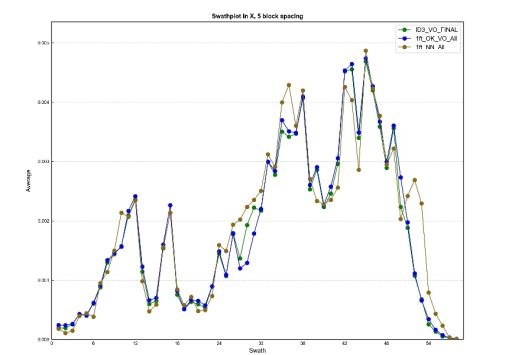
Source: SLR 2024.
| 14-23 | |
| Energy Fuels Inc. | Bullfrog Project | May 9, 2025 |
| Technical Report | SLR Project No.: 123.V02544.00008 |
Figure 14-12: Trend Plot Y (North) Direction
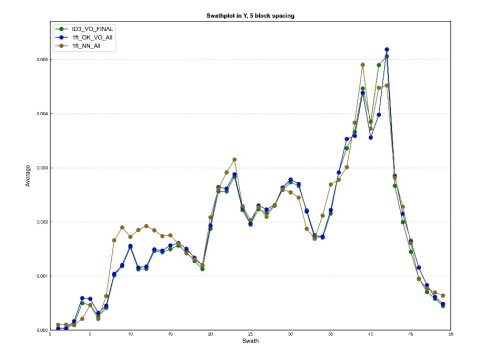
Source: SLR 2024.
Figure 14-13: Trend Plot Z (Vertical) Direction

Source: SLR, 2024
| 14-24 | |
| Energy Fuels Inc. | Bullfrog Project | May 9, 2025 |
| Technical Report | SLR Project No.: 123.V02544.00008 |
14.14 Grade Tonnage Sensitivity
Table 14-12 and Figure 14-14: present the sensitivity of the Indicated Mineral Resource model to various cut-off grades. Table 14-13 and Figure 14-15 present the sensitivity of the Inferred Mineral Resource model to various cut-off grades.
| 14-25 | |
| Energy Fuels Inc. | Bullfrog Project | May 9, 2025 |
| Technical Report | SLR Project No.: 123.V02544.00008 |
Table 14-12: Indicated Mineral Resource Grade versus Tons at Various Cut-Off Grades
|
Price ($/lb) |
Recovery |
COG |
Min |
GT COG |
Round UP |
Tonnage |
Grade |
Contained |
|
(Mton) |
(%U3O8) |
(Mlb |
||||||
|
100.00 |
95.0 |
0.135 |
4.0 |
0.54 |
0.50 |
1.97 |
0.284 |
11.18 |
|
95.00 |
95.0 |
0.142 |
4.0 |
0.57 |
0.60 |
1.85 |
0.293 |
10.85 |
|
90.00 |
95.0 |
0.150 |
4.0 |
0.60 |
0.60 |
1.74 |
0.303 |
10.53 |
|
85.00 |
95.0 |
0.159 |
4.0 |
0.63 |
0.60 |
1.62 |
0.314 |
10.14 |
|
80.00 |
95.0 |
0.169 |
4.0 |
0.67 |
0.70 |
1.48 |
0.327 |
9.71 |
|
75.00 |
95.0 |
0.180 |
4.0 |
0.72 |
0.70 |
1.37 |
0.34 |
9.32 |
|
70.00 |
95.0 |
0.193 |
4.0 |
0.77 |
0.80 |
1.26 |
0.354 |
8.89 |
|
65.00 |
95.0 |
0.208 |
4.0 |
0.83 |
0.80 |
1.13 |
0.372 |
8.37 |
|
60.00 |
95.0 |
0.225 |
4.0 |
0.90 |
0.90 |
0.99 |
0.392 |
7.80 |
|
55.00 |
95.0 |
0.245 |
4.0 |
0.98 |
1.00 |
0.87 |
0.415 |
7.21 |
|
50.00 |
95.0 |
0.270 |
5.0 |
1.35 |
1.30 |
0.72 |
0.448 |
6.44 |
|
45.00 |
95.0 |
0.300 |
6.0 |
1.80 |
1.80 |
0.59 |
0.483 |
5.72 |
|
40.00 |
95.0 |
0.337 |
7.0 |
2.36 |
2.40 |
0.47 |
0.524 |
4.97 |
Figure 14-14: Indicated Grade versus Tonnage
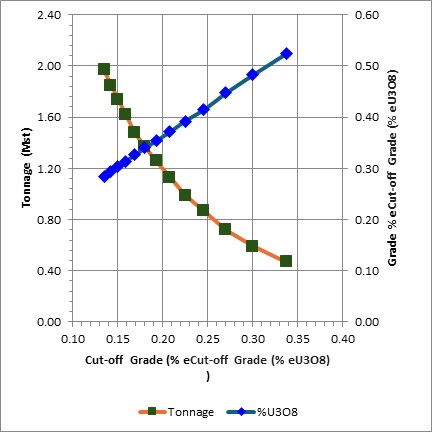
| 14-26 | |
| Energy Fuels Inc. | Bullfrog Project | May 9, 2025 |
| Technical Report | SLR Project No.: 123.V02544.00008 |
Table 14-13: Inferred Mineral Resource Grade versus Tons at Various Cut-Off Grades
| Price ($/lb) |
Recovery (%) | COG (%U308) |
Min Thickness (ft) |
GT COG (%-ft) |
Round UP GT COG |
Tonnage | Grade | Contained Metal |
| (Mton) | (%U3O8) | (Mlb U3O8) | ||||||
| 100.00 | 95.0 | 0.135 | 4.0 | 0.54 | 0.50 | 0.73 | 0.258 | 3.75 |
| 95.00 | 95.0 | 0.142 | 4.0 | 0.57 | 0.60 | 0.67 | 0.267 | 3.61 |
| 90.00 | 95.0 | 0.150 | 4.0 | 0.60 | 0.60 | 0.62 | 0.278 | 3.44 |
| 85.00 | 95.0 | 0.159 | 4.0 | 0.63 | 0.60 | 0.56 | 0.292 | 3.25 |
| 80.00 | 95.0 | 0.169 | 4.0 | 0.67 | 0.70 | 0.50 | 0.305 | 3.08 |
| 75.00 | 95.0 | 0.180 | 4.0 | 0.72 | 0.70 | 0.45 | 0.322 | 2.88 |
| 70.00 | 95.0 | 0.193 | 4.0 | 0.77 | 0.80 | 0.39 | 0.343 | 2.66 |
| 65.00 | 95.0 | 0.208 | 4.0 | 0.83 | 0.80 | 0.33 | 0.369 | 2.42 |
| 60.00 | 95.0 | 0.225 | 4.0 | 0.90 | 0.90 | 0.29 | 0.389 | 2.26 |
| 55.00 | 95.0 | 0.245 | 4.0 | 0.98 | 1.00 | 0.25 | 0.413 | 2.07 |
| 50.00 | 95.0 | 0.270 | 5.0 | 1.35 | 1.30 | 0.21 | 0.447 | 1.84 |
| 45.00 | 95.0 | 0.300 | 6.0 | 1.80 | 1.80 | 0.17 | 0.485 | 1.62 |
| 40.00 | 95.0 | 0.337 | 7.0 | 2.36 | 2.40 | 0.14 | 0.516 | 1.45 |
Figure 14-15: Inferred Grade versus Tonnage
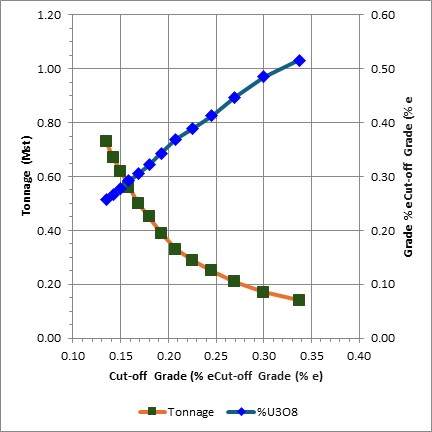
| 14-27 | |
| Energy Fuels Inc. | Bullfrog Project | May 9, 2025 |
| Technical Report | SLR Project No.: 123.V02544.00008 |
14.15 Mineral Resource Reporting
The Project Mineral Resource estimate is summarized by area at a cut-off grade of 0.15% U3O8 in Table 14-14. In the SLR QP's opinion, the assumptions, parameters, and methodology used for the Mineral Resource estimate are appropriate for the style of mineralization. The effective date of the Mineral Resource estimate is December 31, 2024.
The SLR QP is of the opinion that with consideration of the recommendations summarized in Section 1 and Section 26, any issues relating to all relevant technical and economic factors likely to influence the prospect of economic extraction can be resolved with further work.
The SLR QP is not aware of any environmental, permitting, legal, title, taxation, socio-economic, marketing, political, or other relevant factors that could materially affect the Mineral Resource estimate.
| 14-28 | |
| Energy Fuels Inc. | Bullfrog Project | May 9, 2025 |
| Technical Report | SLR Project No.: 123.V02544.00008 |
Table 14-14: Summary of Mineral Resources - Bullfrog Project -December 31, 2024
| Classification | Deposit | Zone | Grade Cut- Off (% eU3O8) |
Tonnage (Mton) |
Grade (% eU3O8) |
Contained Metal (Mlb eU3O8) |
EFR Basis (%) |
Recovery U3O8 (%) |
| Indicated | Copper Bench | Upper Zone | 0.150 | 1.40 | 0.295 | 8.25 | 100 | 95 |
| Lower Zone | 0.150 | 0.02 | 0.230 | 0.09 | 100 | 95 | ||
| Indian Bench | Upper Zone | 0.150 | 0.31 | 0.35 | 2.17 | 100 | 95 | |
| Lower Zone | 0.150 | 0.01 | 0.17 | 0.02 | 100 | 95 | ||
| Total Indicated | 1.74 | 0.303 | 10.53 | 100 | 95 | |||
| Inferred | Copper Bench | Upper Zone | 0.150 | 0.28 | 0.28 | 1.56 | 100 | 95 |
| Lower Zone | 0.150 | 0.01 | 0.20 | 0.02 | 100 | 95 | ||
| Indian Bench | Upper Zone | 0.150 | 0.32 | 0.29 | 1.84 | 100 | 95 | |
| Lower Zone | 0.150 | 0.01 | 0.17 | 0.02 | 100 | 95 | ||
| Total Inferred | 0.62 | 0.278 | 3.44 | 100 | 95 | |||
|
Notes: |
||||||||
| 14-29 | |
| Energy Fuels Inc. | Bullfrog Project | May 9, 2025 |
| Technical Report | SLR Project No.: 123.V02544.00008 |
15.0 Mineral Reserve Estimates
There are no current Mineral Reserves at the Project.
| 15-1 | |
| Energy Fuels Inc. | Bullfrog Project | May 9, 2025 |
| Technical Report | SLR Project No.: 123.V02544.00008 |
16.0 Mining Methods
16.1 Mine Design
16.1.1 Geotechnical Design Analysis
No geotechnical drilling has been completed for the Project. The following discussion describes the geotechnical conditions that are expected based on similar rocks.
The character of the rock mass at the Project is expected to be variable. It is difficult to provide a single set of design criteria that ensures stability without being overly conservative. By using an empirical rock strength approach, involving rock mass rating (RMR) characterization, design guidelines are provided for different rock classes. However, given the current state of knowledge about the rock mass and the preliminary state of mine design, a single set of design criteria are provided, which generally apply to expected conditions. It is important to note that these criteria will not apply in some areas because rock conditions are less favourable. A detailed mine design should consider local rock conditions; it may be necessary during development mining to locally adjust dimensions and ground support based on local rock conditions.
Geotechnical criteria for underground mining include providing estimates of maximum spans, maximum back area, types and use of ground support, mining orientation relative to stress loading, and maximum rib heights for large openings. These criteria consider the following mining requirements:
• The mineralized material is concentrated in tabular lens whose mined area will range in width from 200 ft to 500 ft and a strike length that extends up to 2,000 ft in length. The height of the mining seam is expected to vary between 3 ft to 21 ft. In the Copper Bench area (southeast area), the lenses range in depth from 510 ft to 1,100 ft below ground southeast to northwest. In the Indian Bench (northwest) mining area, depths of the zones are around 1,100 ft below the surface.
• The tabular lenses plunge at an average of 2° to southeast (125° bearing). Locally, plunges range from flat to 15°. There appears to be no major fault zones within the mineralization.
• Mine access will be via twin decline that starts in Section 3, T35S, R11E with most of the mineralization lens trending southeast (Copper Bench mineralized zone) to northwest (Indian Bench mineralized zone).
• The orebodies are located in what are referred to as the upper portion of the lower rim of the Salt Wash Member of the Morrison Formation in sequential sand units, referred to as Upper and Lower mineralized horizons (zones). The majority (+99%) occurs in the Upper horizon. The vertical extent of the orebodies will either be bottom-up access or top-down access from the sides of the orebody. Minimum grade cut-off grade requirements in the variable grade mineralized zones will result in low-grade unmined blocks of ground within orebodies that will remain after mining.
• A preliminary conceptual design was based on room-and-pillar mining methods and split shooting methods as currently employed by EFR at their Pinyon Plain and La Sal uranium mines. The mining concept included stopes developed as primary rooms and pillars extending transversely across the orebody to the full orebody height for an equivalent 85% Extraction ratio. Stope access will be drill/sampling/drainage galleries beneath the orebody, but above the Summerville Formation. Haulage will be in footwall haulages back to the decline intersections. The mining concept accounts for ventilation and a man egress access emergency shaft to be utilized, if needed, also.
| 16-1 | |
| Energy Fuels Inc. | Bullfrog Project | May 9, 2025 |
| Technical Report | SLR Project No.: 123.V02544.00008 |
To provide geotechnical design criteria, the approach adopted considers that the empirical methods used for making estimate of the support parameters are based on similar case histories in a range of applicable ground conditions. The use of empirical methods has been shown to be a reasonable approach to assessing ground support as long as anticipated ground conditions are within the data range. Although rock mass strengths at Bullfrog are considered poor to average quality, their RMR values were assumed to be within the data range of the empirical methods.
No analyses beyond these empirical assessments have been performed to check the recommended support parameters. Such analyses will be warranted when additional site-specific data from the underground are available, where analyses might include numerical modelling.
To account for the variability in rock quality anticipated a range of rock mass strengths have been considered. For example, wide drift spans will be less stable in weak ground than in strong ground conditions. For this reason, we have selected a range of three anticipated ground conditions: weak, medium and strong. For each of these we have estimated the percentage of excavations that will be in each ground condition, and thus the type of support required for the type of opening; that is long-term primary and stope access development and short-term stope drifts.
16.1.2 Open Spans
There are two rock behaviour conditions that have been analyzed: (1) stability when the rock behaves as a blocky rock mass and (2) stability when the rock behaves as an equivalent continuum. These were analyzed separately because the failure mechanisms are different; blocky ground stability is controlled by the strength of the natural bedding and jointing, while the stability of highly fractured/soft ground is controlled by the equivalent strength of the rock matrix.
16.1.2.1 Local Roof Stability
The siltstone roof rock mass is expected to behave like a continuum if the natural fractures do not significantly influence the rock matrix. The stability of rooms in this case will be a function of roof spans and rock strength. The strength and character of the rock mass were quantified using RMR estimates. Maximum stable roof spans are governed by the roof area and shape; large square openings are less stable than small rectangular openings of the same area. The hydraulic radius, HR, is used to describe the combination of size and shape as defined by the ratio of the area, A, to the perimeter, P, given by Equation 16-1.
Equation 16-1
![]()
where the length, L, is the longest dimension and the width, W, is the shortest dimension of the open roof or back area.
The relation between HR and RMR has been studied by many researchers who have compared mined geometries to actual conditions of the open area. Similar data has expressed this relation as a function of Barton's Q factor (Barton et al. 1974) where the relation for converting an RMR value to Q is given by Equation 16-2. (Barton, N. and E. Grimstad 1994).
| 16-2 | |
| Energy Fuels Inc. | Bullfrog Project | May 9, 2025 |
| Technical Report | SLR Project No.: 123.V02544.00008 |
Equation 16-2
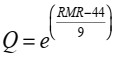
Other researchers have modified this rock quality factor to include the effects of stresses, unfavourable fracture orientations, and failure mechanism by comparing case history data to a Stability Number, N′ (Potvin, 1988). The relation for converting Q to N′ is given by Equation 16-3 (Nickson, 1992)
Equation 16-3
![]()
The rock stress factor, A, varies between 0.1 and 1 as a function of the ratio of the UCS to the induced mining stress. The lower the value of A, indicates that the induced mining stress is overwhelming the unconfined compressive strength of the rock. The joint orientation adjustment factor, B, varies between 0.1 and 1 as a function of the relative difference in dip between the dominant jointing and the walls or roof of the stope. The gravity adjustment factor, C, depends on whether the failure mode is sliding or slabbing, and it varies between 2 and 8 as a function of sliding plane angle from horizontal. In the absence of underground observations of ground conditions, B was assumed 0.2 to represent shallow dipping bedding planes and C was assumed 8.0 to represent full gravitational slabbing conditions.
Figure 16-1 and Figure 16-2 illustrate the relationship of HR versus N′, for case histories where the back is unsupported and supported by cable bolts, respectively. To estimate the stability of an open room the following input parameters were assumed.
• Pillar length = 10 ft
• Stope drift width = 10 ft
• Cross-cut width = 15 ft
• RMR for roof is from Figure 16-1
• Length of potential ground fall = Pillar length + 2 x Cross-cut width
• HR of potential ground fall (from Eq. 16-1) < 3.8 ft.
When the allowable HR is less than the 3.8 ft calculated from the geometry, then there is the potential for a roof fall or complete collapse of the opening. The allowable HR depends on the quality of the rock mass and whether jointing is favourable or unfavourable in the roof. Figure 16-2 and Figure 16-3 are used to estimate the maximum allowable HR required to ensure against roof collapse. The objective is to select stope drift widths such that the roof will not likely collapse.
| 16-3 | |
| Energy Fuels Inc. | Bullfrog Project | May 9, 2025 |
| Technical Report | SLR Project No.: 123.V02544.00008 |
Figure 16-1: Hydraulic Radius versus Modified Stability Number (N′) for Unsupported Case Histories
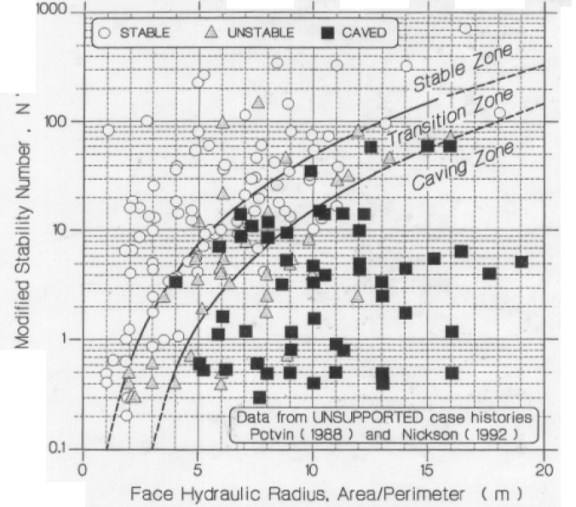
Source: From Hutchinson and Diederichs 1995
| 16-4 | |
| Energy Fuels Inc. | Bullfrog Project | May 9, 2025 |
| Technical Report | SLR Project No.: 123.V02544.00008 |
Figure 16-2: Hydraulic Radius versus Modified Stability Number (N′) for Supported Case Histories
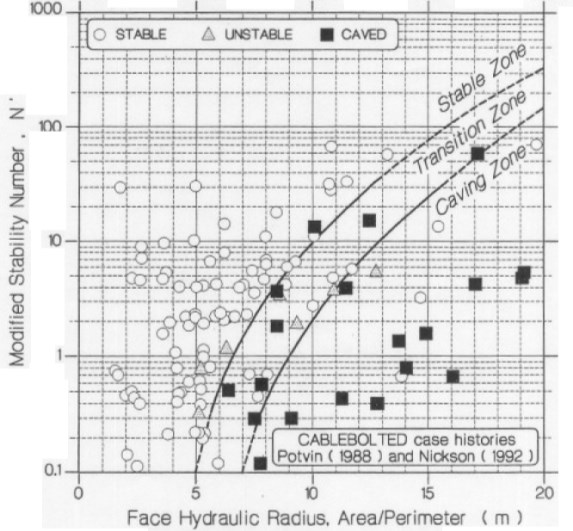
Source: From Hutchinson and Diederichs 1995
The maximum allowable hydraulic radius is given in Table 6-1 for both unsupported and supported open drifts for various rock classes. The only case where the roof is predicted to be unstable is when the roof is weak and is not supported. Given the uncertainty in rock quality, it is recommended that the roof in drifts be fully supported with rock bolts and/or split-set bolts.
| 16-5 | |
| Energy Fuels Inc. | Bullfrog Project | May 9, 2025 |
| Technical Report | SLR Project No.: 123.V02544.00008 |
Table 16-1: Maximum Allowable Hydraulic Radius For Unsupported And Supported Open Rooms For Various Strength Roof Rocks
| Rock Type | Roof RMR |
Q | A | B | C | N' | Max Allow Unsupported HR (ft) |
Max Allow Supported HR (ft) |
| Sandstone/Shale A Roof, Low | 23.9 | 0.1 | 0.10 | 0.2 | 8.0 | 0.02 | 2.2 | 12.4 |
| Sandstone/Shale A Roof, Med | 46.6 | 1.3 | 0.10 | 0.21 | 5.3 | 19.4 | ||
| Sandstones A Roof, High | 68.0 | 14.5 | 0.40 | 9.25 | 19.4 | 38.0 | ||
| Siltstone B1 Roof, Low | 24.1 | 0.1 | 0.10 | 0.2 | 8.0 | 0.02 | 2.2 | 12.4 |
| Silty SS, B1 Roof, Med | 48.4 | 1.6 | 0.10 | 0.26 | 5.7 | 20.1 | ||
| Silty SS, B1 Roof, High | 67.9 | 14.2 | 0.40 | 9.12 | 19.3 | 37.9 | ||
| Siltstone B2 Roof, Low | 24.7 | 0.1 | 0.10 | 0.2 | 8.0 | 0.02 | 2.3 | 12.6 |
| Siltstone B2 Roof, Med | 50.3 | 2.0 | 0.10 | 0.32 | 6.1 | 20.9 | ||
| Sandstone, B2 Roof, High | 69.7 | 17.4 | 0.40 | 11.16 | 20.7 | 39.3 | ||
| Claystone, C Roof, Low | 23.3 | 0.1 | 0.10 | 0.2 | 8.0 | 0.02 | 2.2 | 12.2 |
| Siltstone, C Roof, Med | 48.0 | 1.6 | 0.10 | 0.25 | 5.6 | 20.0 | ||
| Sandstone, C Roof, High | 68.9 | 15.9 | 0.40 | 10.20 | 20.0 | 38.7 | ||
| Claystone, D Roof, Low | 23.3 | 0.1 | 0.10 | 0.2 | 8.0 | 0.02 | 2.2 | 12.2 |
| Claystone, D Roof, Med | 48.1 | 1.6 | 0.10 | 0.25 | 5.6 | 20.0 | ||
| Sandstone, D Roof, High | 68.3 | 14.9 | 0.40 | 9.55 | 19.6 | 38.2 |
16.1.3 Roof Support
Stability of open spans in a blocky rock mass is anticipated to be governed by the thickness of bedding in the roof and intersection of joints producing massive sandstone blocks that are removable into the opening. Stability was analyzed using a simple limit equilibrium method that balanced block loads and support loads. The analysis used the following assumptions:
• Drift width = 10 ft
• Unit weight of roof rock = 145 lb/ft3
• Max bedding slab thickness = 50% of room width
• Minimum shear strength of roof rock = 350 psi
The recommended bolting requirements are given in Table 16-2. The minimum safety factor for bolts is 1.50. The bolts were assumed to be 45 ksi yield steel. Note that a larger diameter bolt is required in higher strength rock masses as the development length over which the load is transferred to the 'holding" ground is shorter. Smaller diameter bolts can be used with higher yield strength steel.
Table 16-2: Recommended Rock Bolt Parameters in Low Strength Ground Conditions
| Bolt diameter (in) | 5/8 | 3/4 | 7/8 | 1 |
| Spacing (ft) | 3.0 | 3.5 | 4.0 | 5.0 |
| 16-6 | |
| Energy Fuels Inc. | Bullfrog Project | May 9, 2025 |
| Technical Report | SLR Project No.: 123.V02544.00008 |
| Bolt diameter (in) | 5/8 | 3/4 | 7/8 | 1 |
| Assumed 5-foot slab: | ||||
| Bolt Length (ft) | 7.0 | 7.0 | 8.0 | 8.0 |
| Individual Bolt (ft2) | 3.11 | 3.39 | 3.59 | 3.01 |
| Assumed 10-foot slab: | ||||
| Bolt Length (ft) | 12.0 | 13.0 | 14.0 | 14.0 |
| Individual Bolt (ft2) | 1.56 | 1.69 | 1.79 | 1.50 |
The ground support design chart from Grimstad and Barton (1993), shown in Figure 16-3, which is based on the tunnelling quality index Q (Grimstad and Barton 1993), shows similar bolt lengths and spacing estimates (when converted from metric to U.S. custom units) for typical Q values of 0.10, 1.3, and 15 in weak, medium, and strong roof rock masses, respectively (RMR=25, 45, and 65, respectively, for a sandstone roof).
Figure 16-3 can also be used to check whether additional support is required for long-term primary development. Empirically, the equivalent dimension, De, of the excavation is obtained by dividing the span, diameter or wall height of the excavation by a quantity called the Excavation Support Ratio (ESR). The value of ESR is related to the intended use of the excavation and to the degree of security which is demanded of the support system installed to maintain the stability of the excavation. Barton et al. (1974) suggest ESR values between 3 and 5 for temporary mine openings and 1.6 for permanent mine openings. Converting the equivalent spans to meters and selecting the three rock qualities (i.e., weak, medium, and strong), Figure 6-4 suggests that between two to four inches of fiber-reinforced shotcrete would be required for long-term stability of primary development in weak to medium ground conditions.
The need for roof support in stopes can be cross checked by comparing stability to design curves for assessing critical spans developed by Ouchi, Pakalnis, and Brady (2004) from case histories in weak rock (Figure 16-4). The data used to develop this relationship were from smaller drifts (as opposed to larger stope roofs). This curve supports the observation that 10-ft wide room (3 m) in low and medium strength roof rock (RMR=25 and RMR=45, respectively) would likely be unstable without support, while in higher strength roof rock (RMR=65) would likely be stable without support. Therefore, in production stopes it will be important to assess the standup time for the roof rock and ensure that backfilling can be performed in the weak and medium strength rock masses prior to roof falls occurring.
Stand-up times have been empirically derived from the RMR values (Bieniawski 1989). Figure 16-5 illustrates this relation for unsupported roof spans. A 10-ft wide unsupported stope back is expected to have a stand up time of approximately one hour in weak ground (RMR=24), up to one week in medium ground (RMR=45), and up to one year in strong ground (RMR=65). These short stand-up times in weak and medium rock will require that support be installed immediately after the ground is excavated.
Ground water inflow requires that the mineralized zones be pre-drained by longholes from footwall drainage drifts for up to two months before development can be started in a specific pod. Stope development will commence immediately after the panel access development is completed. When development of a particular pod is finished, a minimum period of up to three months will be allowed for additional drying of the mineralized material by ventilation air before stoping begins. These assumptions are among those used for the determination of the length of time required before full production is reached.
| 16-7 | |
| Energy Fuels Inc. | Bullfrog Project | May 9, 2025 |
| Technical Report | SLR Project No.: 123.V02544.00008 |
Figure 16-3: Estimated Support Categories Based on the Tunnelling Quality Index Q
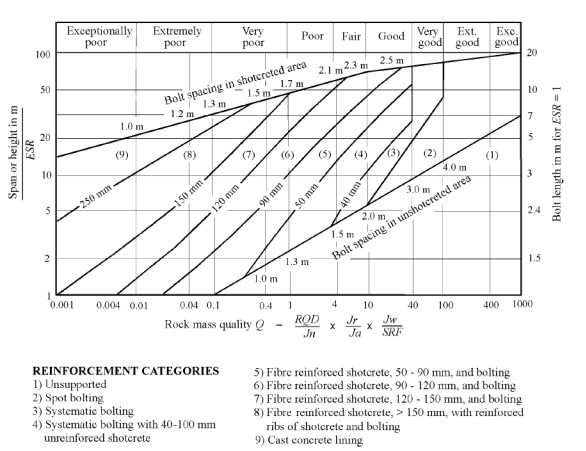
Source: After Grimstad and Barton 1993
| 16-8 | |
| Energy Fuels Inc. | Bullfrog Project | May 9, 2025 |
| Technical Report | SLR Project No.: 123.V02544.00008 |
Figure 16-4: Critical Span Curve for Weak Rock Mass
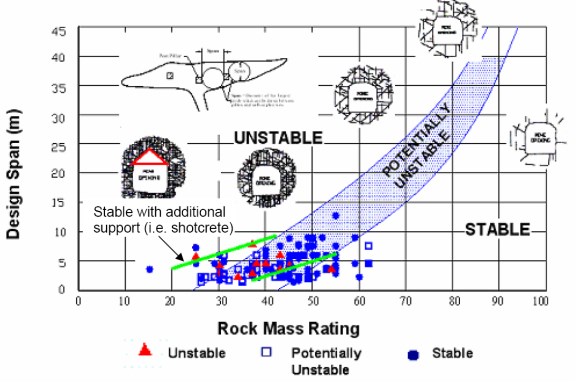
| 16-9 | |
| Energy Fuels Inc. | Bullfrog Project | May 9, 2025 |
| Technical Report | SLR Project No.: 123.V02544.00008 |
Figure 16-5: Relationship Between Stand-up Time, Span and RMR Classification
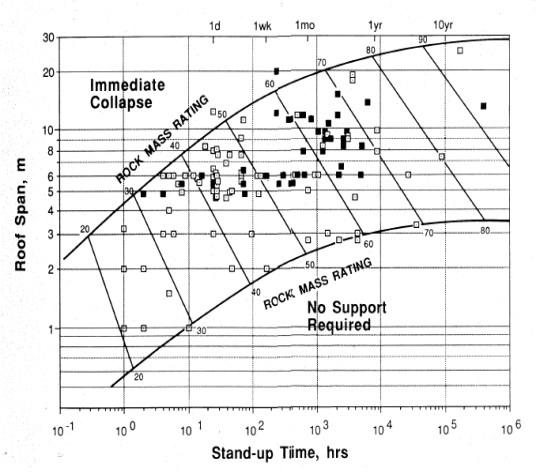
Source: After Bienawski1989
16.1.4 Ground Support Summary
Table 16-3 provides a summary of the recommended ground support parameters, by rock type, for long-term primary and stope access development whose roof is in either sandstone (Upper or Lower Mineralized Zone) or shale interbeds.
Guidance on how much of the excavations will be excavated in the various types of rock conditions is summarized in Table 16-4. In the absence of site-specific data from underground; the SLR QP has estimated the percent of the rock mass that will be weak, medium, and strong in order to quantify scenarios for underground excavations. Six types of access drifts have been identified depending on whether the excavation is in shale versus sandstone roof, the development drift is in wetter undisturbed ground versus in dryer ground, and proximity to faulted ground. Only four types of access drifts have been used to estimate the distribution of ground conditions in the production stopes. The distribution depends on whether the drift is early in the stope development when the ground is wet versus later in development, and whether the mineralized material grade is high or low. Historically, higher grade areas in underground uranium mines tend to produce less favourable ground conditions. Similarly, development excavated early in the stope life tends to be wetter and in less favorable ground conditions.
| 16-10 | |
| Energy Fuels Inc. | Bullfrog Project | May 9, 2025 |
| Technical Report | SLR Project No.: 123.V02544.00008 |
Table 16-3: Summary of Ground Support Parameters for Long-Term Primary and Stope Access Development
| Ground Support Item | Rock Type | ||
| Weak | Medium | Strong | |
| Drift Sandstone Roof, 12-ft wide | |||
| Unsupported Stability | Unstable | Potential Unstable | Stable |
| Unsupported Standup Time | 2.5 hr | 2.4 weeks | 3.4 years |
| RMR | 25 | 45 | 65 |
| Q | 0.1 | 1.1 | 10.3 |
| Roof Shear Strength (psi) | 750 | 1,400 | 3,100 |
| Max Allow Unsupported HR | 2.2 | 5.7 | 19.8 |
| Max Allow Supported HR | 12.4 | 20.1 | 38.4 |
| bolt diameter (in) | 3/4 | 3/4 | 7/8 |
| Bolts/row | 3 | 3 | 3 |
| spacing (ft) | 4.0 | 4.5 | 5.0 |
| Bolt Length (ft) | 4 | 4 | 4 |
| Shotcrete thickness (in) - long-term only | 4.0 | 2.0 | 0.0 |
| Mesh - long-term only | Tensar | Tensar | Tensar |
| Drift Shale/Mudstone Roof, 12-ft wide | |||
| Unsupported Stability | Unstable | Potential Unstable | Stable |
| Unsupported Standup Time | 1 hr | 4.5 days | 1.7 years |
| RMR | 20 | 40 | 60 |
| Q | 0.1 | 0.6 | 5.9 |
| Roof Shear Strength (psi) | 450 | 1,150 | 3,000 |
| Max Allow Unsupported HR | 2.2 | 5.7 | 19.8 |
| Max Allow Supported HR | 12.4 | 20.1 | 38.4 |
| bolt diameter (in) | 3/4 | 3/4 | 7/8 |
| Bolts/row | 3 | 3 | 3 |
| spacing (ft) | 4.0 | 4.5 | 5.0 |
| Bolt Length (ft) | 8.0 | 8.0 | 8.0 |
| Shotcrete thickness (in)- long-term only | 4 | 2 | 0 |
| Mesh - long-term only | Tensar | Tensar | Tensar |
| 16-11 | |
| Energy Fuels Inc. | Bullfrog Project | May 9, 2025 |
| Technical Report | SLR Project No.: 123.V02544.00008 |
Table 16-4: Assumed Distribution Of Anticipated Ground Condition For Different Operational Conditions
| Access Type | Percent of Rock Type | ||
| Weak | Medium | Strong | |
| Leading development in non-ore Sandstone | 15% | 40% | 45% |
| Lagging development in non-ore Sandstone | 10% | 35% | 55% |
| Leading development in non-ore Shale/Mudstones | 20% | 45% | 35% |
| Lagging development in non-ore Shale/Mudstones | 15% | 40% | 45% |
| Leading development in Fault Zones | 40% | 45% | 15% |
| Lagging development in Fault Zones | 30% | 55% | 15% |
| Early Stope development in med-low grade ore | 25% | 45% | 30% |
| Late Stope operation in med-low grade ore | 20% | 40% | 40% |
| Early Stope development in high grade ore | 40% | 40% | 20% |
| Late Stope operation in high grade ore | 30% | 45% | 25% |
16.1.5 Mine Access
The 13,520-foot-long decline connecting the southeast (Copper Bench) and the northwest (Indian Bench) production zones has been designed as a double heading (i.e., twin declines). This is required for ventilation purposes, both during the driving of the decline as the need for booster fans is eliminated, and for subsequent mining in the Indian Bench production zones. When completed, one of the decline headings will serve as a dedicated fresh airway connecting the northwest workings to the primary access Bullfrog decline located east of the Copper Bench orebody and the primary fresh air intake. The other decline heading will serve as a dedicated exhaust airway, connecting to the various exhaust boreholes in the southeast production zones, thus supplementing the exhaust capacity of the boreholes in the northwest production zones.
The geotechnical conditions presented in Section 16.1.1 were used to estimate the mine design parameters. These parameters relate to support for open spans for long-term haulages and short-term drifts within a stope. The support requirements are then used to estimate the cost for ground support. It should be noted that geotechnical drilling, sampling, and analyses should be completed during the next phase of the Project (i.e., pre-feasibility study).
16.1.6 Cut-off Grade Analysis
As noted earlier in Section 14.11 of this Technical Report, the following parameters were used to establish the U3O8 cut-off grade for the Bullfrog underground operation:
• Mining Cost, US$/ton milled: $135.05
• Incremental Mining Cost at 60% of Mining Cost, US$/ton $81.03
• Toll Milling Cost, US$/ton milled: $110
• Contract Hauling Cost1, US$/ton milled: $29.85
• Surface Maintenance, US$/ton milled: $1.31
• General and Administrative, US$/ton milled: $32.50
| 16-12 | |
| Energy Fuels Inc. | Bullfrog Project | May 9, 2025 |
| Technical Report | SLR Project No.: 123.V02544.00008 |
• Process Recovery, %: 95%
• Uranium (eU3O8) Price, US$/lb: $90.00
• Royalties Applied: None
It was assumed that 40% of the $135.05/ton mining cost is attributable to development that is common to multiple stopes, which reduces the amount of mining cost to $81.03/ton that is applied to the cut-off grade. The cut-off grade used for the mine stope optimizer was 0.15% U3O8.
16.1.7 Mining Dilution and Mining Recovery
The mining dilution applied to the Mineral Resources was 28% after 4 ft minimum thickness stopes. Mining recovery applied to the Mineral Resources was 85% to account for pillar and other mining losses within the horizontal dimension of 50 ft by 50 ft stopes.
16.2 Mining Method
Historically in this uranium district, the mining method has been classified as a random room and pillar mining with split shooting methods, using jackleg six-foot rounds, haulage with 7-ton end dump trucks, and loading by way of 1-yd3 to 2.5-yd3 load-haul-dump equipment (LHDs). The SLR QP recommends a similar approach to mining at the Project given the nature of the uranium mineralization. Typical stope sizes will depend on the uranium mineralization orientations and sizes encountered.
Development will be accomplished with the use of single-boom jumbo drills, larger LHDs (up to 4 yd3), and larger trucks (13-ton).
Access to the production areas will be via two parallel 12-ft wide by 12-ft high parallel declines (i.e., twin declines). One of these declines will also serve as one of the primary sources for the mine's intake ventilation.
Mining methods considered the following factors and constraints:
• Mineralized material zones are generally flat laying.
• Open stope areas will require stable back conditions during extraction. Back stability will need to consider rock strength, and proximity and condition of recent workings and groundwater drainage conditions.
• Blocks of ground serving as temporary or permanent pillars must remain stable during extraction of adjacent ground.
• Backfilling of primary openings needs to provide sufficient back support to allow secondary pillars to be mined with a stable back.
• Backfill from primary openings should not slough into rib pillar crosscuts during extraction.
• Backfill operations, when applied, will require tight filling against supported rock including pillar ribs and stope backs by up-dip filling operations. In multi-cut areas that require working from fill, the working mat should be sufficiently competent to support equipment.
• Temporary access ramps should remain stable during their expected life and can be re-cut provided roof and rib stability can be maintained.
| 16-13 | |
| Energy Fuels Inc. | Bullfrog Project | May 9, 2025 |
| Technical Report | SLR Project No.: 123.V02544.00008 |
• Backfilling operations should include water management provisions to control drainage to main haulages.
• Mineralized material lenses can be stacked one above the other with as little as tens of feet of separation.
• Considerations should be made in each mining area for variations in mining-induced stresses, rock failure mechanisms, and local ground deformations.
These trend-type orebodies will be developed and mined by two modified room-and-pillar methods and split shooting where required using ground support during development to ensure roof stability, especially in weak ground conditions.
Mill feed production is envisioned to start with rock support activities, drilling equipment using jackleg equipment and standard blasting techniques for rock fragmentation. Jackleg long holes will be used to follow the mineralization; measuring grade in the hole and the dark color of high grade is going to be key to segregate mill feed and waste material during the split shoot mining.
With the wide range of mineralized zone stope thicknesses (from 4 ft to 16 ft) and dips/plunges (from flat to 15 degrees), one of the mining methods selected for Bullfrog is room and pillar with split shooting, with a moderate strength cemented rock fill. This method allows for mobile equipment to be used effectively in the range of dips/plunges encountered at Bullfrog. This method is being recommended for the lower grade mineralized material lenses.
Drift and fill mining is being recommended for the higher-grade mineralized material lenses. This method is widely used in other mines with similar ground conditions and will result in higher mining recoveries as the need to leave permanent pillars will be significantly reduced. This method, however, requires a high quality, high strength engineered backfill to be successful.
Bulk mining methods were investigated, particularly for the thick (up to 20 ft) zones. One method considered involved mining of the thick zones in staggered primary and secondary panels using engineered cemented backfill. In this approach, an overcut drift is excavated at the top of the panel following the hanging wall contact and an undercut drift is excavated at the bottom along the footwall contact. The panels are then mined by benching between the overcut and undercut drifts. Once mucking of the broken mineralized material is complete, engineered cemented backfill is placed into the mined-out stopes. This method was not considered to be applicable due to the weak rock conditions. The low rock strengths and limited stand-up time made this method impractical given the relatively high stope walls which would be exposed during the benching process.
Each development crew will consist of two miners. The first crew member will be the drill operator and will be responsible for drilling of the face and installation of ground support (grouted rebar, mesh and straps). The second crew member will operate the 2.5 yd3 LHD and will be responsible for mucking the blasted rock from the face to the re-muck storage area, loading of the haulage trucks, and spreading of roadbed material. The two crew members will jointly load the drilled rounds with explosives and install the necessary services.
A separate haulage truck operator will be responsible for providing the development crew haulage needs. Based on detailed cycle time calculations, one haulage truck operator will handle the needs of two development crews. Either 7-ton or 13-ton capacity haulage tracks are proposed haulage trucks; these would be equipped with an ejector box, enabling dumping in standard drift heights.
Due to the specialty skills required, a separate crew will be responsible for the transportation and application of shotcrete in the development headings. Based on the detailed cycle time calculations, one shotcrete crew is capable of handling the requirements of two development crews. Proposed equipment for this activity includes a shotcrete machine and a (5 yd3) remix transporter. Shotcreting productivities were based on the average (moderate ground - expected 40% of the time) conditions which require the transportation and placement of fibre-reinforced shotcrete to a 2-inch thickness. This corresponds to a single batch of material.
| 16-14 | |
| Energy Fuels Inc. | Bullfrog Project | May 9, 2025 |
| Technical Report | SLR Project No.: 123.V02544.00008 |
In ground conditions that are better or worse than the average, shotcreting productivities will be impacted accordingly. For example, in good ground conditions (expected 20% of the time), the shotcrete is not required resulting in an increased productivity. In poor ground conditions (expected 40% of the time), fiber-reinforced shotcrete placement to a thickness of four inches will be required. This will significantly reduce the productivity as the remix truck will need to prepare and transport two batches of material. In poorly cemented weak ground, the productivity could be further reduced by the need to spray a flash coat of shotcrete soon after blasting to bond loose particle surfaces and prevent deterioration prior to the installation of permanent ground support.
Each development crew is assigned a dedicated drill jumbo, low profile bolter (e.g., Sandvik DS210L) and 2.5 yd3 LHD (e.g., MTI LT 350). Although the utilization time requirements for these units of equipment could allow for sharing with other development crews, it was determined that these units were critical to achieving the scheduled productivity rates. Sharing of the equipment would result in delays whenever the same activities were required in the two headings at the same time. Two development crews would, however, share a materials handling as activity needing this piece of equipment (primarily installation of services and the loading of explosives in the upper portion of the face) affords more scheduling flexibility.
Development productivity calculations were prepared to estimate the rate of advance and the workforce and equipment requirements for the development work. Productivity was developed from first principles, with each part of the development cycle time estimated to generate the overall cycle time for development headings.
In all cases, the loading (mucking) was assumed to be to a muck bay with re-mucking as a separate activity such that the face could be turned around as rapidly as possible. Truck loading and hauling are considered to be activities that can be undertaken simultaneously with the other activities at the face.
The planned LOM primary development totals 27,039 ft, primarily related to the twin declines from surface to the Copper Bench mining areas and terminating at the Indian Bench mining areas.
The productivity estimates for primary development are summarized in Table 16-5. Table 16-6 shows the relationship of work time to lost time. The lost time relates to travel time to the workplace and back, lunch breaks and other rest breaks. An efficiency of 83% (50 minutes per hour) is applied to account for the lower performance expected due to difficult working conditions (i.e., higher than normal temperature and humidity).
Table 16-5: Summary Cycle Time for 12-ft x 12-ft Heading (Single-Face Decline)
| Activity | Critical Path Time per Round |
| Pumping (min) | 10 |
| Drilling (min) | 102 |
| Blasting (min) | 120 |
| 16-15 | |
| Energy Fuels Inc. | Bullfrog Project | May 9, 2025 |
| Technical Report | SLR Project No.: 123.V02544.00008 |
| Activity | Critical Path Time per Round |
| Mucking (min) | 108 |
| Re-muck (min) | - |
| Trucking (min) | - |
| Shotcrete (min) | 45 |
| Bolting (min) | 36 |
| Mesh/Straps (min) | 93 |
| Services (min) | 48 |
| Roadbed | |
| Total (min) | 562 |
| Total (hrs) | 9.4 |
| Advance per day per shift (ft) | 10.0 |
Table 16-6: Hours per Person-Day
| Metric | Value |
| Hours/shift | 12.0 |
| Shifts/day | 2.0 |
| Lost time per shift (hr) | 2.0 |
| Useable hrs/ shift | 10.0 |
| Efficiency (50 min/hr) | 0.83 |
| Available work hours per day | 20.00 |
16.2.1 Alternative Excavation Technologies
Given the relatively low average strength of the rock mass, other excavation technologies were considered in this study. These include mechanical cutting of the rock (using roadheaders) and hydraulic technology (using high pressure water).
The use of high-pressure water was not reviewed in detail as an excavation technique due to the rock's propensity to significantly degrade in strength when in direct contact with water. In order to maintain suitable roadbeds, the collection and control of water at the face would require significant installations and the higher broken rock moisture content would complicate transportation and handling of the material.
16.2.1.1 Roadheaders
Roadheaders are a unique class of mechanical excavation machines that break rock by utilizing tungsten carbide tipped cutting tools laced in a specific geometry on a rotating cutting head. The cutting head can either be spherical, transverse or axial in design. The cutter head is driven by an electric motor through a heavy-duty gearbox configured for either milling or ripping cutting actions. The cutter boom is connected to a pedestal that allows unrestricted boom movement throughout a fixed maximum profile. Boom movement is controlled by hydraulic cylinders sized to provide sufficient force to maintain the cutting head in contact with the face, and the machine is track mounted to allow tramming from one work face to another. A gathering arm mucking system transfers the cuttings from the face. The cuttings are then conveyed to the rear of the machine for loading into haulage equipment. Several roadheader manufacturers worldwide presently offer small (30-ton) units which could be considered as applicable in the development of the Bullfrog deposit.
| 16-16 | |
| Energy Fuels Inc. | Bullfrog Project | May 9, 2025 |
| Technical Report | SLR Project No.: 123.V02544.00008 |
Roadheaders have traditionally operated in sedimentary rock with an unconfined compressive strength of less than 15,000 psi. The advantages of utilizing cutting technology rather than conventional drill and blast in low to moderate strength rocks include reduced damage to the surrounding rocks thereby improving overall heading stability and simplifying ground control requirements. The roadheaders also offer significant potential increases in drift excavation productivity.
Based on discussions with EFR personnel familiar with previous attempts to use roadheaders, the mechanical availability of the roadheader was very low due to the failure of cutting tools and heavy vibrations transmitted through the cutter head, boom and pedestal resulting in failure of the connections. The gathering arm mucking and conveying system was also prone to frequent mechanical breakdown. In addition, the roadheaders inability to cut some of the harder rocks encountered in the headings required that the machine be removed from the face and replaced with conventional drill/blast equipment until the harder zones were traversed.
The design of the cutting head and tools as well as the robustness of the machine has improved considerably since the previous trials during the 1970s and 1980s. There are, however, other factors to consider.
Success in applying roadheaders to underground mining environments is less a function of average rock strength, but is more dependent on rock strength variability and, more importantly, quartz content. As silica content of the rock increases, the operating performance of roadheaders significantly decreases due to the following factors:
• Inability of the cutting tools to take the high penetration force needed
• Inability of the machines to maintain the bit in the cut or the ability of the bit to track
• Low mass available to react to the required force
• Lack of understanding of the physical properties of the rock related to cutting forces
• Increased pick wear in high silica material
The sandstones and clays at Bullfrog can be relatively high in quartz.
At Bullfrog, a substantial portion of the development will be inclined at grades of up to 10%. Roadheaders are less productive at driving inclines as the machine center of gravity is shifted away from the face resulting in reduced forces being applied to the cutting head.
For these reasons, and the lack of available data relative to rock strength variability, the use of roadheaders has not been included in this study. However, the application of roadheaders at Bullfrog is a technology that offers the possibility of improved ground conditions and higher excavation productivity. For this reason, the SLR QP recommends that a more detailed study is be conducted during the next phase of study.
16.3 Life of Mine Plan
SLR has prepared two life of mine (LOM) plans for the Project. The Base Case considers Indicated and Inferred Resources, and the Alternative Case considers only Indicated Resources. There are no Measured Resources estimated at the Project. Inferred Resource tonnage represents approximately 20% of the Mineral Resources in the Base Case LOM plan. It is important to note that, unlike Mineral Reserves, Mineral Resources do not have demonstrated economic viability.
| 16-17 | |
| Energy Fuels Inc. | Bullfrog Project | May 9, 2025 |
| Technical Report | SLR Project No.: 123.V02544.00008 |
Development and stope mining productivities used for scheduling purposes have been calculated based on average ground conditions and substantial depressurization and reduction of the volumes of local ground water inflow. Based on estimated values for rock strength, it is estimated that 30% of the ground will be very weak, 40% average, and 30% stronger than average. It can be expected, therefore, that, in some instances, ground conditions or water flows will be better than the average, but more often, will be significantly worse than average. Whenever higher than expected ground water inflows or weaker rocks are encountered, productivities will be significantly reduced and the ability to meet the development and production targets included in this schedule will be difficult and challenging.
In the Southeast (Copper Bench) mineralized material zones, dedicated definition drilling and dewatering drifts have been located below the mineralized material horizons. The scheduled elapsed time between the definition and dewatering of a specific stoping block, the subsequent development of stope accesses followed by the initiation of mining, has been addressed. This approach should result in improved ground and water inflow conditions, enhancing the probability of meeting schedule targets.
Bullfrog's production is part of a Company's long-term strategy for supplying mineralized material to the White Mesa Mill. Target production for Bullfrog is 10,000 tons per month, or 120 ktpa. The production schedule considers eight production zones, as presented in Figure 16-6, which illustrates the mining stope optimizer (MSO) shapes for the LOM Base Case. Copper Bench is comprised of mining zones 1 through 5. Indian Bench contains mine zones 6 through 8. Mining will start in Copper Bench's mining zone 2, followed by zones 4 and 5, then mining zone 1 and mining zone 3. Mining in the Indian Bench area will begin with mining zone 6, then mining zone 7, and lastly mining zone 8. There will be multiple zones mined at the same time.
The LOM mining schedule for the Base Case is presented in Table 16-7 and graphically in Figure 16-7. Bullfrog's mine life for the Base Case is 15 years.
The LOM mining schedule for the Alternative Case is presented in Table 16-8. The LOM for the Alternative Case is 12 years.
| 16-18 | |
| Energy Fuels Inc. | Bullfrog Project | May 9, 2025 |
| Technical Report | SLR Project No.: 123.V02544.00008 |
Figure 16-6: Bullfrog MSO Shapes
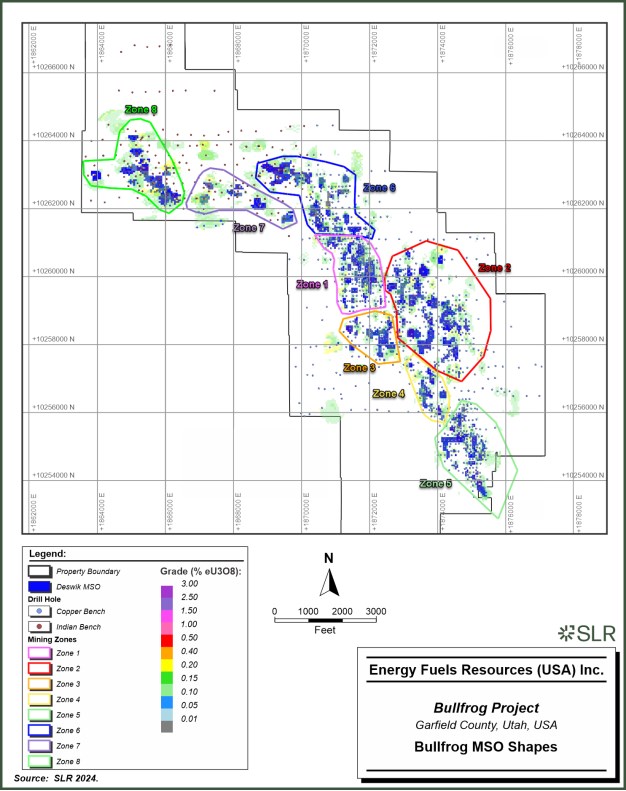
| 16-19 | |
| Energy Fuels Inc. | Bullfrog Project | May 9, 2025 |
| Technical Report | SLR Project No.: 123.V02544.00008 |
Table 16-7: Base Case LOM Mining Schedule
| Mining and Development Area |
Units | Totals | Yr-4 | Yr-3 | Yr-2 | Yr-1 | Yr1 | Yr2 | Yr3 | Yr4 | Yr5 | Yr6 | Yr7 | Yr8 | Yr9 | Yr10 | Yr11 | Yr12 | Yr13 | Yr14 | Yr15 |
| Production Zone | |||||||||||||||||||||
| 1 | kt | 281 | 6 | 120 | 120 | 35 | |||||||||||||||
| 2 | kt | 428 | 120 | 120 | 120 | 68 | |||||||||||||||
| 3 | kt | 120 | 85 | 35 | |||||||||||||||||
| 4 | kt | 83 | 52 | 31 | |||||||||||||||||
| 5 | kt | 203 | 89 | 114 | |||||||||||||||||
| 6 | kt | 345 | 85 | 120 | 120 | 19 | |||||||||||||||
| 7 | kt | 109 | 101 | 9 | |||||||||||||||||
| 8 | kt | 197 | 111 | 85 | |||||||||||||||||
| Total (tons) | kt | 1,765 | 120 | 120 | 120 | 120 | 120 | 120 | 120 | 120 | 120 | 120 | 120 | 120 | 120 | 120 | 85 | ||||
| U3O (%) | % | 0.28 | 0.26 | 0.26 | 0.26 | 0.28 | 0.26 | 0.25 | 0.28 | 0.28 | 0.30 | 0.28 | 0.27 | 0.27 | 0.32 | 0.27 | 0.27 | ||||
| U3O8 (lb) | klb | 9,711 | 624 | 624 | 624 | 661 | 625 | 599 | 673 | 673 | 720 | 682 | 659 | 659 | 767 | 660 | 461 | ||||
| Backfill Waste (tons) | kt | 679 | 51 | 51 | 51 | 49 | 43 | 41 | 40 | 40 | 39 | 44 | 46 | 46 | 45 | 55 | 39 | ||||
| Sub-Total Drill & Blast | kt | 2,444 | 171 | 171 | 171 | 169 | 163 | 161 | 160 | 160 | 159 | 164 | 166 | 166 | 165 | 175 | 124 | ||||
| Development | |||||||||||||||||||||
| Primary Decline 12-ft x 12-ft |
ft | 27,039 | 3,160 | 6,080 | 3,223 | 301 | - | - | - | 2,278 | 2,271 | - | - | 5,966 | 792 | - | - | 2,920 | 48 | - | - |
| Secondary Dev'l 10-ft x 12-ft |
ft | 21,653 | - | 2,920 | 2,920 | 1,298 | - | 2,608 | - | - | 2,920 | 6,032 | - | - | 2,954 | - | - | - | - | - | - |
| Production Dev'l 10-ft x 8-ft |
ft | 13,696 | - | - | - | 1,575 | 2,563 | 876 | - | - | - | - | 1,394 | 2,349 | - | - | 1,783 | - | - | 2,015 | 1,140 |
| Ventilation Shafts 8-ft dia |
ft | 8,665 | - | - | 372 | 372 | - | 1,224 | - | - | 1,026 | - | 1,019 | - | 784 | 974 | 877 | 945 | 1,073 | - | - |
| Primary Decline 12-ft x 12-ft |
kt | 365 | 43 | 82 | 44 | 4 | - | - | - | 31 | 31 | - | - | 81 | 11 | - | - | 39 | 1 | - | - |
| Secondary Dev'l 10-ft x 12-ft |
kt | 292 | - | 39 | 39 | 18 | - | 35 | - | - | 39 | 81 | - | - | 40 | - | - | - | - | - | - |
| 16-20 | |
| Energy Fuels Inc. | Bullfrog Project | May 9, 2025 |
| Technical Report | SLR Project No.: 123.V02544.00008 |
| Mining and Development Area |
Units | Totals | Yr-4 | Yr-3 | Yr-2 | Yr-1 | Yr1 | Yr2 | Yr3 | Yr4 | Yr5 | Yr6 | Yr7 | Yr8 | Yr9 | Yr10 | Yr11 | Yr12 | Yr13 | Yr14 | Yr15 |
| Production Dev'l 10-ft x 8-ft |
kt | 185 | - | - | - | 21 | 35 | 12 | - | - | - | - | 19 | 32 | - | - | 24 | - | - | 27 | 15 |
| Ventilation Shafts 8-ft dia. |
kt | 117 | - | - | 5 | 5 | - | 17 | - | - | 14 | - | 14 | - | 11 | 13 | 12 | 13 | 14 | - | - |
Notes:
1. Mining dilution applied to the Mineral Resources was estimated to be 28% after 4 ft minimum thickness stopes.
2. Mining recovery applied to the Mineral Resources was 85% to account for pillar and other mining losses within the horizontal dimension of 50 ft by 50 ft stopes.
3. The Base Case includes approximately 20% of Inferred Resources. Inferred Mineral Resources are considered too geologically speculative to have the economic considerations applied to them that would enable them to be categorized as Mineral Reserves.
| 16-21 | |
| Energy Fuels Inc. | Bullfrog Project | May 9, 2025 |
| Technical Report | SLR Project No.: 123.V02544.00008 |
Figure 16-7: Base Case LOM Schedule of Activities
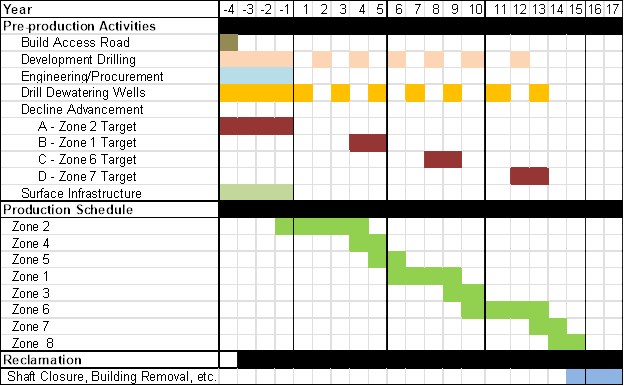
| 16-22 | |
| Energy Fuels Inc. | Bullfrog Project | May 9, 2025 |
| Technical Report | SLR Project No.: 123.V02544.00008 |
Table 16-8: Alternative Case LOM Mining Schedule
| Mining and Development Area |
Heading Size | Units | Totals | Yr-4 | Yr-3 | Yr-2 | Yr-1 | Yr1 | Yr2 | Yr3 | Yr4 | Yr5 | Yr6 | Yr7 | Yr8 | Yr9 | Yr10 | Yr11 | Yr12 |
| Production Zone | |||||||||||||||||||
| Total (tons) | kt | 1,440 | 120 | 120 | 120 | 120 | 120 | 120 | 120 | 120 | 120 | 120 | 120 | 120 | |||||
| U3O8 (%) | % | 0.28 | 0.26 | 0.26 | 0.26 | 0.28 | 0.26 | 0.25 | 0.28 | 0.28 | 0.3 | 0.28 | 0.27 | 0.27 | |||||
| U3O8 (lb) | klb | 7,709 | 624 | 624 | 624 | 661 | 625 | 599 | 673 | 673 | 720 | 682 | 659 | 545 | |||||
| Backfill Waste (tons) | kt | 533 | 51 | 51 | 51 | 49 | 43 | 41 | 40 | 40 | 39 | 44 | 46 | 38 | |||||
| Sub-Total Drill & Blast | kt | 1,981 | 171 | 171 | 171 | 169 | 163 | 161 | 160 | 160 | 159 | 164 | 166 | 166 | |||||
| Development | |||||||||||||||||||
| Primary Decline | 12-ft x 12-ft | ft | 26,991 | 3,160 | 6,080 | 3,223 | 301 | - | - | - | 2,278 | 2,271 | - | - | 5,966 | 792 | - | - | 2,920 |
| Secondary Development | 10-ft x 12-ft | ft | 21,652 | - | 2,920 | 2,920 | 1,298 | - | 2,608 | - | - | 2,920 | 6,032 | - | - | 2,954 | - | - | - |
| Production Development | 10-ft x 8-ft | ft | 10,540 | - | - | - | 1,575 | 2,563 | 876 | - | - | - | - | 1,394 | 2,349 | - | - | 1,783 | - |
| Ventilation Shafts | 8-ft dia. | ft | 7,593 | - | - | 372 | 372 | - | 1,224 | - | - | 1,026 | - | 1,019 | - | 784 | 974 | 877 | 945 |
| Primary Decline | 12-ft x 12-ft | kt | 366 | 43 | 82 | 44 | 4 | - | - | - | 31 | 31 | - | - | 81 | 11 | - | - | 39 |
| Secondary Development | 10-ft x 12-ft | kt | 291 | - | 39 | 39 | 18 | - | 35 | - | - | 39 | 81 | - | - | 40 | - | - | - |
| Production Development | 10-ft x 8-ft | kt | 143 | - | - | - | 21 | 35 | 12 | - | - | - | - | 19 | 32 | - | - | 24 | - |
| Ventilation Shafts | 8-ft dia. | kt | 104 | - | - | 5 | 5 | - | 17 | - | - | 14 | - | 14 | - | 11 | 13 | 12 | 13 |
Notes:
Mining dilution applied to the Mineral Resources was estimated to be 28% after 4 ft minimum thickness stopes.
Mining recovery applied to the Mineral Resources was 85% to account for pillar and other mining losses within the horizontal dimension of 50 ft by 50 ft stopes.
| 16-23 | |
| Energy Fuels Inc. | Bullfrog Project | May 9, 2025 |
| Technical Report | SLR Project No.: 123.V02544.00008 |
16.4 Mine Ventilation
16.4.1 Radon Gas
One of the major concerns in ventilating uranium mines is the presence of radon gas. In general, related issues of heat, dust, diesel and explosives fumes tend to be subordinate to the designs required to address radiation. As a rule, the control methods for the various ventilation requirements are complementary.
The most common and fundamental technique to ensure rapid evacuation of radon gas from the workplaces is the establishment of separate fresh and exhaust airways. This approach has been used in designing the accesses to, and the subsequent mining of, the various identified mineralized material zones. The use of single pass air and minimizing its residence time underground has been fundamental in the design of the primary ventilation network. In addition, any mobile equipment offering an enclosed, air-conditioned and filtered air cab as an option, has been priced with this option included.
Radon is often found in the groundwater, therefore, dewatering the mine in advance of development and production will help mitigate this problem.
16.4.2 Stope Access and Ventilation Sequencing
For the Copper Bench (southeast) mining areas, each of the development crews is assigned the excavation of the intake and exhaust ramps as well as the accesses and sill drifts for one zone. There are three mining zones accessed from the 4500 Level, three mining zones accessed from the 4450 Level and two mining zones accessed from the 4350 Level. Development of the ramps starts from the primary level development at the bottom of the zone (lowest elevation).
The maximum requirement size case scenario was developed; the designed ventilation system should be optimized based on the mining sequence during the next phase of mine planning. The general ventilation diagram is provided in Figure 16-8.
| 16-24 | |
| Energy Fuels Inc. | Bullfrog Project | May 9, 2025 |
| Technical Report | SLR Project No.: 123.V02544.00008 |
Figure 16-8: Ventilation Diagram
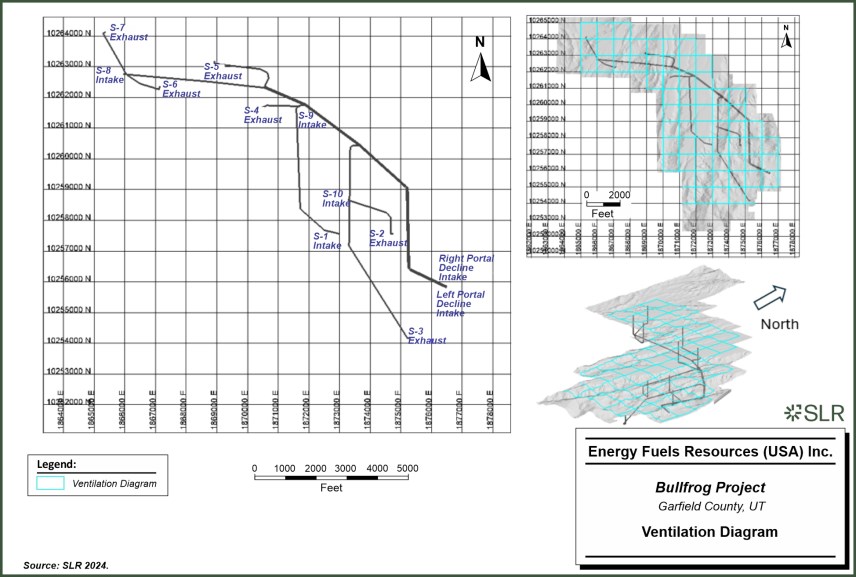
| 16-25 | |
| Energy Fuels Inc. | Bullfrog Project | May 9, 2025 |
| Technical Report | SLR Project No.: 123.V02544.00008 |
A secondary exhaust fan and rigid ducting is used to provide ventilation to each face. The intake ramp is excavated to the elevation of the first sill drift and the exhaust ramp is excavated to provide a connection to the exhaust borehole raise. Once the connection has been established, a ventilation door is constructed at the bottom of the exhaust ramp to isolate the ramp from the primary level access development. The exhaust ramp is then advanced to the elevation of the first sill drift. When the first stope accesses and sill drift has been completed, there is now a flow-through ventilation circuit between fresh air flowing up the intake ramp, across the first sill drift and down the exhaust ramp to the exhaust ventilation raise borehole. At this point, ventilation control doors are constructed in both the intake and exhaust accesses to the sill drift. The ventilation ducting used to drive the first leg of the ramps can now be dismantled for use in extending both ramps.
The secondary ventilation exhaust fan for the intake ramp is re-installed in the exhaust ramp just below the elevation of the first sill drift. Ducting is then installed from the fan, across the sill drift to the face of the intake ramp. Ventilation air flows up the first leg of the intake ramp and into the end of the ducting located near the active face. It is then pulled into the end of the ducting by the exhaust fan, travels through the ducting, discharging into the exhaust ramp flow to the exhaust borehole. The ducting is extended as the driving of the second leg of the intake ramp progresses.
The secondary ventilation exhaust fan for the exhaust ramp is also re-installed in the exhaust ramp just below the elevation of the first sill drift. Ducting is then installed from the fan to the face of the exhaust ramp. Ventilation air flows up the first leg of the intake ramp, across the first sill drift, then into the end of the ducting located near the face of the exhaust ramp. It is then pulled into the end of the ducting by the exhaust fan, travels through the ducting, discharging into the exhaust ramp flow to the exhaust borehole. The ducting is extended as the driving of the second leg of the exhaust ramp progresses.
Both the intake and exhaust ramps are then driven to the elevation of the second sill drift. When the second accesses and sill drift has been completed, there is now a flow-through ventilation circuit between fresh air flowing up the intake ramp, across the second sill drift and down the exhaust ramp to the exhaust ventilation borehole. At this point, ventilation control doors are constructed in both the intake and exhaust accesses to the second sill drift and the doors previously constructed in the first sill drift accesses are closed. The ventilation ducting used to drive the second leg of the ramps can now be dismantled for use in extending both ramps to the third sill drift. This development cycle is repeated in the Copper Bench (Southeast) mineralized material zones area until the final uppermost zone sill drift has been completed.
For the Indian Bench (Northwest) mineralized material zones area of the Bullfrog mine, the development sequence is different than the Copper Bench (Southeast) mineralized material zones area as the definition drilling of the zones cannot be undertaken prior to stope development being initiated. Definition drilling is completed on a stope by stope basis as described in Section 1.1.2.1. For this reason, each development crew is assigned the excavation of the intake and exhaust ramps as well as the accesses and sill drifts for two zones instead of one. As was the case in Southeast mineralized material mining zones area, development of the ramps for mining zones 2, 4, 5, 1 and 3 starts from the primary level development at the bottom of the zone (lowest elevation). Subsequent extension of the ramps is driven up-hill. Due to the positioning of the main decline connecting the Copper Bench and Indian Bench mining areas, development of the ramps for mining zones 6, 7,and 8start from the primary level development at the top of each zone (highest elevation). Extension of the ramps for these zones proceeds downhill until the final lowermost zone sill drift has been completed.
| 16-26 | |
| Energy Fuels Inc. | Bullfrog Project | May 9, 2025 |
| Technical Report | SLR Project No.: 123.V02544.00008 |
As mentioned above, definition drilling of the Indian Bench mining area is completed progressively as development is advanced. Once a sill drift has been established in the development crew's first assigned zone, development of this zone is suspended and the crew is relocated to its second assigned zone to continue the next leg of stope development in that zone. While development is suspended, definition drilling is undertaken in the first zone to define the next 200-ft interval. When the next leg of the second zone is completed, the development crew returns to its first assigned zone to continue the next leg of stope development. The definition drilling crew moves to the just completed second zone to define the next 200-ft interval. The development and definition drilling crews alternate between zones until the development and definition of zone is completed.
16.5 Mine Infrastructure
Mine infrastructure at the Project has been designed to accommodate all mining and transportation requirements. This includes maintenance, offices, mine dry, warehousing, stockpiles, standby generators, fueling station, rapid response services, equipment utilities, and other workshops.
All mineralized material produced at the Mine will be trucked 127 mi to Energy Fuel's processing facility, the White Mesa Mill (the Mill), in Blanding, Utah, which is located southeast of the Bullfrog mine.
Dewatering of the underground operation at Bullfrog would commence when the twin decline is started, four years before the production start-up. The dewatering program would be based on 11 small (5 hp to 15 hp) well pumps in 10-inch diameter bore holes located within and around the mine workings and dewatering from a sump at the bottom of the Bullfrog twin declines. This dewatering program is designed to cope with moderate volumes of underground water similar to those encountered in the Tony M Mine located three miles south/southwest of Bullfrog. Historically, the Tony M had average inflows that ranged from 15 gpm to 120 gpm. Flows expected at Bullfrog will be in the order of 20 gpm to 50 gpm from the underground sumps.
The general layout of the facilities is provided in Figure 16-9.
Table 16-9 summarizes the major mine infrastructure for the Bullfrog mine. Space requirements for the mine were determined based on the staffing requirements, production rate, type of mining method, and equipment.
The general layout of the facilities is provided in Figure 16-9.
Table 16-9: Mine Surface Infrastructure Space Requirements - Buildings/Areas
| Item | Key Dimensions | Length (ft) |
| Site Access Road from Highway 276 | 16-ft wide | 15,475 |
| Twin Declines (Primary Development) | 12 ft x 12 ft x 10-ft round | 13,520 (each) |
| Secondary Development | 10 ft x 12 ft x 10-ft round | 21,653 |
| Production Development | 10 ft x 8 ft x 10-ft round | 11,909 |
| Ventilation Raises (7) | 8-ft diameter | 5,863 |
| Dewatering Wells (11) | 10-in dia./ 6-in discharge |
14,518 |
| 16-27 | |
| Energy Fuels Inc. | Bullfrog Project | May 9, 2025 |
| Technical Report | SLR Project No.: 123.V02544.00008 |
| Item | Key Dimensions | Length (ft) |
| Emergency Escapeway1 | ||
| On-site Power Distribution | ||
| Substation | ||
| Maintenance Shop and Wash Bay | 90-ft x 110-ft | |
| Warehouse | 30-ft x 60-ft | |
| Mine Dry and Offices | 100-ft x 60-ft | |
| Safety/Security Facility (Trailer) | 8-ft x 40-ft | |
| Assay Lab (Trailer) | 8-ft x 40-ft | |
| Outdoor Warehouse Yard | 120-ft x 100-ft | |
| Cold Warehouse Shed | 30-ft x 30-ft | |
| Water Treatment Plant | 50-ft x 25-ft | |
| Evaporation Ponds | 300-ft x 50-ft | |
| Explosive Storage Magazines (Vendor-supplied) |
||
| Underground Refuge Chambers (2) | 12-person | |
| Ore Stockpile Area | ||
| Waste Storage Area | 300-ft x 300-ft | |
|
Notes: 1. Located in the Indian Bench intake raise. |
||
| 16-28 | |
| Energy Fuels Inc. | Bullfrog Project | May 9, 2025 |
| Technical Report | SLR Project No.: 123.V02544.00008 |
Figure 16-9: Surface Facilities Layout
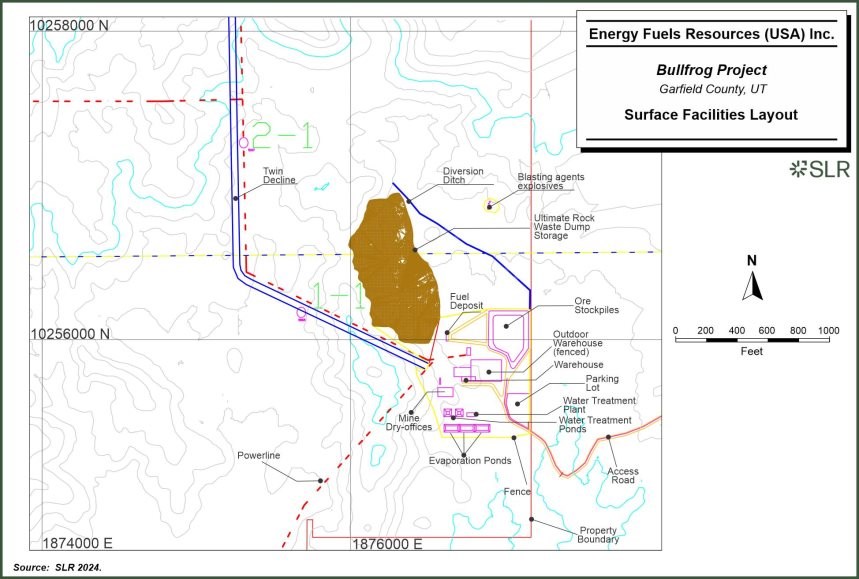
| 16-29 | |
| Energy Fuels Inc. | Bullfrog Project | May 9, 2025 |
| Technical Report | SLR Project No.: 123.V02544.00008 |
16.6 Mine Equipment
A fleet of mobile equipment, suitable for the proposed heading sizes and mining methods, has been selected and quantified. Budget quotes were obtained from Infomine's Mining Cost Service for the production equipment. Service equipment cost estimates were obtained from other recent SLR studies. Development and stoping activities use similar equipment fleets; as development requirements diminish over time, the development equipment will be re-allocated to stoping, eliminating the need to procure additional mobile equipment as the number of active stopes increases. Mobile equipment requirements are shown in Table 16-10.
Table 16-10: Bullfrog Mine Equipment Summary
| Quantity | Description |
| 30 | Jacklegs, 186 cfm/each |
| 3 | One-boom jumbo |
| 5 | 2.5 yd3 - LHD |
| 5 | 1.0 yd3 - LHD |
| 8 | Bobcats |
| 3 | 13-ton Trucks |
| 4 | 7-ton trucks |
| 4 | Tractors |
| 2 | Service Trucks |
| 1 | Roof Bolter - Single Boom |
| 1 | Shotcrete truck |
| 1 | Scissor lift truck |
| 1 | Longhole Drills (2" to 3"), 66 ft |
| 3 | 300 kVA Portable Power Center |
| 1 | Ventilation Fan - 6.5" Static Water, 403,000 cfm |
| 8 | Ventilation Drift Booster Fans - 14,000 cfm |
| 1 | Grader (12' blade modified) |
| 1 | Mine Phone Systems |
| 10 | Pumps, diaphragm |
| 5 | Pumps, submersible, 190 gpm at 20 ft of head |
| 2 | Pumps, dirty water, centrifugal, electric, 500 gpm, 1000 ft |
| 4 | Pickup Trucks, ¾-ton, automatic |
| 1 | Shop Equipment |
| 4 | Small Mine Equipment |
| 1 | First Aid/Emergency Equip Eng/Geol Equip Ambulance (Used) |
| 12 | Gamma Probe |
| 16-30 | |
| Energy Fuels Inc. | Bullfrog Project | May 9, 2025 |
| Technical Report | SLR Project No.: 123.V02544.00008 |
| Quantity | Description |
| 1 | F.E.L. (used) CAT 966H equivalent 2008, 12,450 hr, 5.5 yd3 |
| 1 | 3,200 cfm compressor at 101 psi |
| 1 | 2080 kW Generators, 2789 hp |
| 1 | 600 kW Generators |
| 1 | 160 kW Generators |
| 2 | 90 kW Generators |
| 2 | Water Truck, 1,000 gal |
| 2 | Misc. Equip. |
| 2 | Refuge Chamber (12-person) as supplied by Manufacturer |
| Notes: F.E.L. Front-End Loader cfm cubic feet per minute |
|
| 16-31 | |
| Energy Fuels Inc. | Bullfrog Project | May 9, 2025 |
| Technical Report | SLR Project No.: 123.V02544.00008 |
17.0 Recovery Methods
17.1 Introduction
The material produced from Bullfrog will be toll milled at the EFR-owned White Mesa Mill (the Mill), located near Blanding, Utah. The Mill was originally built in 1980. Since construction, the Mill has processed approximately five million tons of uranium and vanadium containing ores from Arizona, Colorado, and Utah. The Mill is currently operated on a campaign basis to produce yellowcake (U3O8). It can also process alternate feed materials.
Capable of processing 2,000 stpd, the Mill will process mineralized materials from the Bullfrog Mine, other EFR uranium mines, potential toll milling ores for other producers in the region, and alternate feed material. This Technical Report only addresses the costs and revenues of the Bullfrog Project, including project specific costs at the Mill. The location of the Mill is shown in Figure 17-1. The site layout is illustrated in Figure 17-2.
The Mill process is described in the following sections and the flowsheet is shown in Figure 17-3.
17.2 Ore Receiving
Material will be hauled from the Mine to the Mill in 24-ton capacity highway haul trucks. When trucks arrive at the Mill, they are weighed and probed prior to stockpiling. Samples are collected to measure the dry weight, and to perform amenability testing for process control. Trucks are washed in a contained area and scanned for gamma radiation prior to leaving the Mill site.
17.3 Grinding
A front-end loader will transfer the mineralized material from the stockpiles to the Mill through the 20 in stationary grizzly and into the ore-receiving hopper. The mineralized material is then transferred to the 6-ft by 18-ft diameter semi-autogenous grinding (SAG) mill via a 54-in wide conveyor belt. Water is added with the mineralized material into the SAG mill where the grinding is accomplished. The SAG mill is operated in closed circuit with vibrating screens. The coarse material, P80 +28 mesh (28 openings per linear inch and +0.0075" diameter particle size) is returned to the SAG mill for additional grinding and the P80 -28 mesh portion is pumped to the pulp (wet) storage tanks.
The pulp storage tanks are three 35-ft diameter by 35-ft high mechanically agitated tanks. These tanks serve two purposes. First, they provide storage capacity for the mineralized material prior to chemical processing; and second, they provide a facility for blending the various types of mineralized material prior to processing.
17.4 Leaching
From the pulp storage tanks slurry is pumped to pre-leach and leaching to dissolve the uranium. A hot, strong acid treatment is utilized in the second stage of leaching to obtain adequate recoveries. This results in high concentrations of free acid in solution. Therefore, a first stage leach "acid kill" is employed, which is referred to as pre-leach. mineralized material from the pulp storage tanks is metered into the pre-leach tanks at the desired flow rate. The slurry from the pulp storage tanks will usually be about 50% solids mixed with 50% water. This slurry is mixed in the pre-leach tanks with a strong acid solution from the overflow of the counter current decantation (CCD) circuit resulting in a density of approximately 22% solids. This step is employed to neutralize the excess acid from the second stage leach with raw ore. By doing this, not only is the excess acid partially neutralized, but some leaching occurs in the pre-leach circuit, and less acid is required in the second stage leach. The pre-leach mineralized material flows by gravity to the pre-leach thickener where flocculent is added and the solids are separated from the liquid. The underflow solids are pumped into the second-stage leach circuit where sulphuric acid, heat, and an oxidant (sodium chlorate) are added. About three hours retention time is expected to be needed in the seven second-stage leach tanks. Each tank has an agitator to keep the solids in suspension. The discharge from the leach circuit is a slurry consisting of solids and a sulfuric acid solution with dissolved uranium and vanadium. The leach slurry is then pumped to the CCD circuit for washing and solid liquid separation. The liquid or solution from the pre-leach thickener overflow is pumped first to the clarifier and then the solvent extraction (SX) feed tank.
| 17-1 | |
| Energy Fuels Inc. | Bullfrog Project | May 9, 2025 |
| Technical Report | SLR Project No.: 123.V02544.00008 |
17.5 Counter Current Decantation
The CCD circuit consists of a series of thickeners in which the pulp (underflow) goes in one direction, while the uranium/vanadium bearing solution (overflow) goes in a counter current direction. The solids settle to the bottom of the first thickener tank and flocculent is added to each thickener feed to increase the settling rate of the solids. As the pulp is pumped from one thickener to the next, it is gradually depleted of its uranium and vanadium. When the pulp leaves the last thickener, it is essentially barren waste that is disposed of in the tailing cells.
Eight thickeners are utilized in the CCD circuit to wash the acidic uranium bearing liquids from the leached solids. Water or barren solutions are added to the No. 8 thickener and flow counter-current to the solids. As the solution advances toward the No. 1 thickener, it carries the dissolved uranium. Conversely, the solids become washed of the uranium as they advance toward the last thickener. By the time, the solids are washed through the eight stages of thickening they are 99% free of soluble uranium and may be pumped to the Tailing Cells. The clear overflow solution from No. 1 CCD thickener advances through the pre-leach circuit and pre-leach thickener as previously explained, and to the clarifier, which is an additional thickener giving one more step to settle any suspended solids prior to advancing the solution to the SX circuit.
17.6 Solvent Extraction
The primary purpose of the uranium solvent extraction (SX) circuit is to concentrate the uranium. This circuit has two functions. First, the uranium is transferred from the aqueous acid solution to an immiscible organic liquid by ion exchange. Alamine 336 is a long chain tertiary amine that is used to extract the uranium compound. Then a reverse ion exchange process strips the uranium from the solvent, using aqueous sodium carbonate. As previously noted, the SX circuit is utilized to selectively remove the dissolved uranium from the clarified leach solution. Dissolved uranium is loaded on kerosene advancing counter currently to the leach solution. The uranium-loaded kerosene and leach solution are allowed to settle where the loaded kerosene floats to the top allowing for separation. The uranium barren leach solution is pumped back to the CCD circuit to be used as wash water. The loaded organic is transferred to the stripping circuit where acidified brine (stripping solution) is added and strips the uranium from the kerosene. Within the SX circuit, the uranium concentration increases by a factor of four when loading on the kerosene and again by a factor of ten when removed by the stripping solution. The barren kerosene is returned to the start of the SX circuit. The loaded strip solution is transferred to the precipitation circuit.
With respect to impurities removal, the SX circuit of the Mill is highly selective to uranium and consistently produces yellowcake in the 98% to 99% purity range. This includes ores that contain vanadium, arsenic, and selenium, which have shown to be problematic with other uranium recovery methods. The Mill has a vanadium recovery circuit, but only operated when the head grades are greater than 2 g/L vanadium. This high of a head grade is only expected when the vanadium to uranium ratio is greater than 3:1. Vanadium recovery is not anticipated from the Bullfrog mineralized material based on the low vanadium content.
| 17-2 | |
| Energy Fuels Inc. | Bullfrog Project | May 9, 2025 |
| Technical Report | SLR Project No.: 123.V02544.00008 |
17.7 Precipitation, Drying and Packaging
In the precipitation circuit the uranium (to this point has been in solution), is caused to precipitate or actually "fall out" of the solution. The addition of ammonia, air, and heat to the precipitation circuit causes the uranium to become insoluble in the acid strip solution. During precipitation, the uranium solution is continuously agitated to keep the solid particles of uranium in suspension. Leaving the precipitation circuit, the uranium, now a solid particle in suspension, rather than in solution, is pumped to a two-stage thickener circuit where the solid uranium particles are allowed to settle to the bottom of the tank. From the bottom of the thickener tank the precipitated uranium in the form of a slurry, about 50% solids, is pumped to an acid re-dissolve tank and then mixed with wash water again. The solution is then precipitated again with ammonia and allowed to settle in the second thickener. The slurry from the second thickener is de-watered in a centrifuge. From this centrifuge, the solid uranium product is pumped to the multiple hearth dryer. In the dryer, the product is dried at approximately 1,200°F, which dewaters the uranium oxide further and burns off additional impurities. From the dryer, the uranium oxide (U3O8), concentrated to +95%, is stored in a surge bin and packaged in 55 gallon drums. These drums are then labeled and readied for shipment.
| 17-3 | |
| Energy Fuels Inc. | Bullfrog Project | May 9, 2025 |
| Technical Report | SLR Project No.: 123.V02544.00008 |
Figure 17-1: White Mesa Mill Location
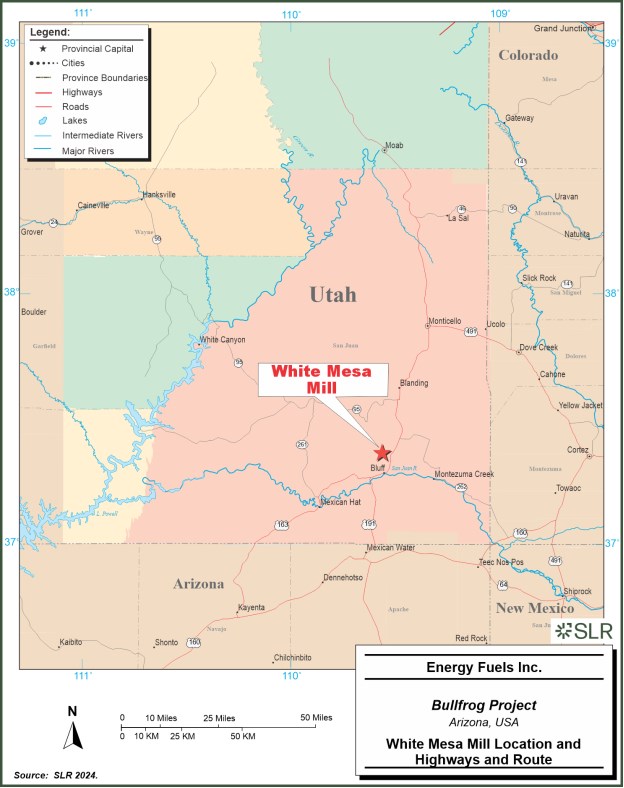
| 17-4 | |
| Energy Fuels Inc. | Bullfrog Project | May 9, 2025 |
| Technical Report | SLR Project No.: 123.V02544.00008 |
Figure 17-2: White Mesa Mill Facility Layout
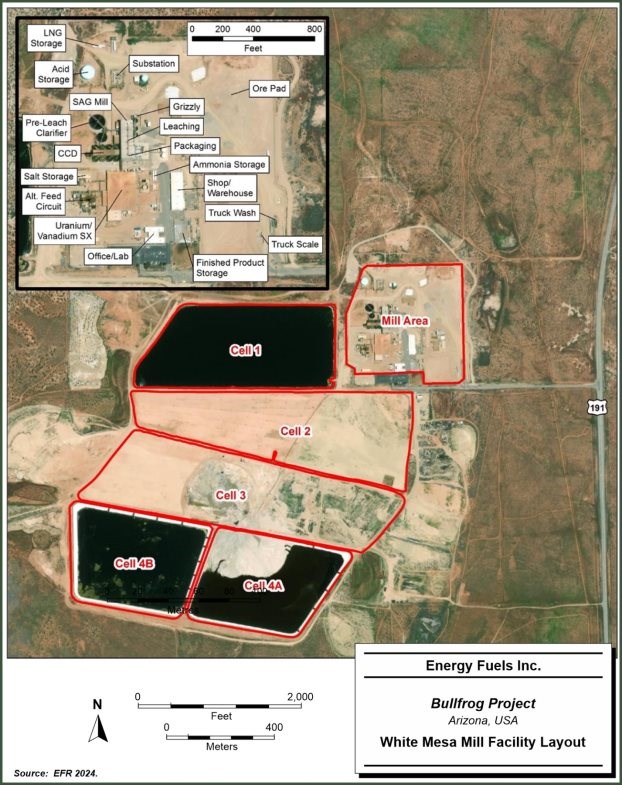
| 17-5 | |
| Energy Fuels Inc. | Bullfrog Project | May 9, 2025 |
| Technical Report | SLR Project No.: 123.V02544.00008 |
Figure 17-3: White Mesa Mill Flowsheet
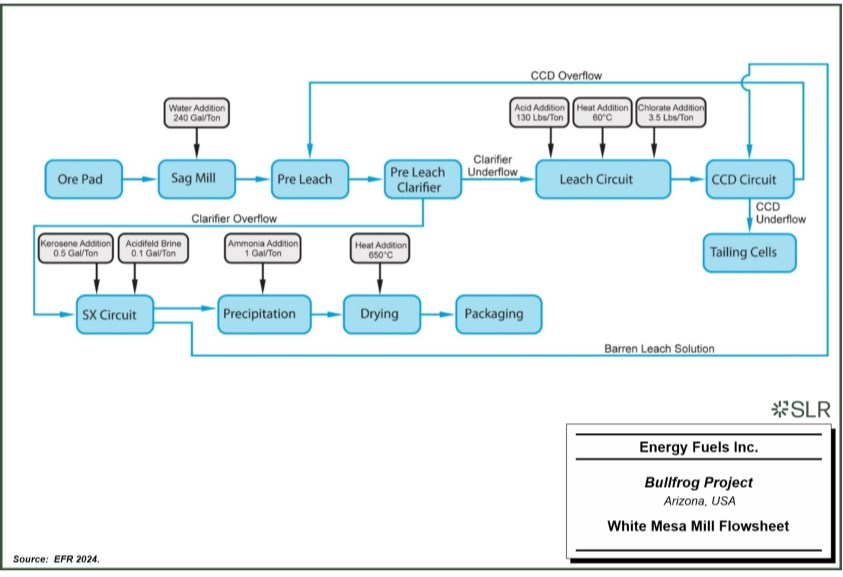
| 17-6 | |
| Energy Fuels Inc. | Bullfrog Project | May 9, 2025 |
| Technical Report | SLR Project No.: 123.V02544.00008 |
17.8 Mill Upgrades
The Mill was refurbished in 2008, and it does not require any mill-related upgrades to process the Bullfrog ore.
17.9 Process Design Criteria
The principal design criteria selected are tabulated below in Table 17-1. The process operation parameters will be finalized following testing of site-specific metallurgical samples. Current power and water requirements at the Mill are discussed in Sections 17.10 and 17.11. No increase in power or water supply is envisioned to be required for future operations.
Table 17-1: Principal Process Operation Criteria
| General | Criteria |
| Processing Rate | 547,500 stpa (1,800 stpd) |
| Feed Grade | 0.28% U3O8 |
| Uranium Circuit | |
| Final Grind | 80% passing 28 mesh |
| Typical Sulfuric Acid Consumption | 150 lb/ton (137 lb/ton actual) |
| Final Concentrate Mass | 122 lb/ft3 |
| Product Assay | 97% U3O8 |
| Recovery to Final Concentrate | 95% Uranium in Feed |
17.10 Mill Water Supply
The fresh water for processing operations at the Mill is provided by 2,000 ft deep water wells. Water can also be reclaimed and/or recycled from the evaporation ponds located on-site. Nominal water usage during uranium mineralized material processing is approximately 250 gpm.
17.11 Power
Power is supplied to the Mill by Rocky Mountain Power through their regional grid. Total online power for the Mill is presented in Table 17-2 and Table 17-3. Electrical loads were inventoried from existing equipment. Most electrical components installed are low voltage 460 V. Medium voltage, 4,160 V, is used for the SAG mill.
Table 17-2: White Mesa Mill Connected Load Rating
| Connected Load Rating | hp | kW | kVA |
| SAG Mill | 700 | 567 | 651 |
| All Pumps | 604 | 489 | 615 |
| Conveyors/Feeders/Screens | 94 | 76 | 95 |
| Agitators/Settlers/Mixers | 550 | 446 | 512 |
| CCD | 200 | 162 | 186 |
| 17-7 | |
| Energy Fuels Inc. | Bullfrog Project | May 9, 2025 |
| Technical Report | SLR Project No.: 123.V02544.00008 |
| Connected Load Rating | hp | kW | kVA |
| Presses/Flocculant | 22 | 18 | 23 |
| Fans/Scrubbers/Cranes | 45 | 36 | 42 |
| Bag House/Miscellaneous | 91 | 65 | 81 |
| Totals | 2,306 | 1,859 | 2,205 |
Table 17-3: White Mesa Mill Operating Load Rating
| Operating Load Rating | hp | kW | kVA |
| SAG Mill | 581 | 471 | 540 |
| All Pumps | 451 | 358 | 449 |
| Conveyors/Feeders/Screens | 71 | 55 | 68 |
| Agitators/Settlers/Mixers | 457 | 370 | 425 |
| CCD | 166 | 134 | 154 |
| Presses/Flocculant | 17 | 14 | 18 |
| Fans/Scrubbers/Cranes | 37 | 30 | 35 |
| Bag House/Miscellaneous | 58 | 48 | 60 |
| Total | 1,838 | 1,480 | 1,749 |
| 17-8 | |
| Energy Fuels Inc. | Bullfrog Project | May 9, 2025 |
| Technical Report | SLR Project No.: 123.V02544.00008 |
18.0 Project Infrastructure
Figure 16-9 presents the site infrastructure.
18.1 Mine Access Roads
The access road from the Utah State Highway 276 to the Project will require upgrading.
18.2 Power
Electrical power will be supplied by onsite diesel generators, as detailed in Table 16-10. It has been estimated that the site will require approximately 2 MW of power. Most of the power to be consumed will come from ventilation fans and a stationary air compressor.
18.3 Water
Small quantities (less than 100 gpm) of water will be needed for the mine operations and the mine surface support facilities. It is anticipated that this water will be sourced from the onsite water treatment plant that will be used to treat the underground dewatering discharge. EFR does not anticipate a large quantity of water to be treated. During the next phase of the Project, the anticipated water needs will be reviewed, including the requirements for a water treatment plant.
18.4 Accommodation Camp
There will be no accommodation camp at the Bullfrog mine site; EFR plans to arrange accommodations for the teams in Ticaboo, Utah, and Hanksville, Utah.
| 18-1 | |
| Energy Fuels Inc. | Bullfrog Project | May 9, 2025 |
| Technical Report | SLR Project No.: 123.V02544.00008 |
19.0 Market Studies and Contracts
19.1 Markets
Uranium does not trade on the open market, and many of the private sales contracts are not publicly disclosed since buyers and sellers negotiate contracts privately. Spot prices are generally driven by current inventories and speculative short-term buying. Monthly long-term industry average uranium prices based on the month-end prices are published by Ux Consulting, LLC, and Trade Tech, LLC. An accepted mining industry practice is to use Consensus Forecast Prices obtained by collating commodity price forecasts from credible sources.
19.1.1 Supply
According to the World Nuclear Association (World Nuclear 2024), world uranium requirements totaled more than 67,517 t uranium (U) in 2024:
• 2016 — 63,404 t U
• 2017 — 65014 t U
• 2018 — 67,244 t U
• 2020 — 68,240 t U
• 2021 — 62,496 t U
• 2022 — 62,496 t U
• 2023 — 65,651 t U
• 2024 forecast — 67,517 t U
The top five producing countries (Kazakhstan, Canada, Namibia, Australia, and Uzbekistan) accounted for over 85% of world uranium production in 2022.
Over half of uranium mine production is from state-owned mining companies, some of which prioritize secure supply over market considerations.
19.1.2 Demand
Demand is primarily driven using uranium as a source for nuclear power plants. The use of nuclear power generation plants has become increasingly acceptable politically. Both China and India have indicated an intention to increase the percentage of power generated by nuclear plants. The largest increase in demand will come from those two countries.
Demand for uranium fuel is more predictable than for most other mineral commodities due to the cost structure of nuclear power generation, with high capital and low fuel costs. Once reactors are built, it is very cost effective to maintain operation at high capacity and for utilities to make any adjustments to load trends by cutting back on fossil fuel use. Demand forecasts for uranium thus depend largely on installed and operable capacity regardless of economic fluctuations.
The World Nuclear Association website notes that mineral price fluctuations are related to demand and perceptions of scarcity. The price cannot indefinitely stay below the cost of production, nor can it remain at a high price for longer than it takes for new producers to enter the market and for supply anxiety to subside.
| 19-1 | |
| Energy Fuels Inc. | Bullfrog Project | May 9, 2025 |
| Technical Report | SLR Project No.: 123.V02544.00008 |
19.1.3 Price
The key to understanding any mineral market is knowing how the mineral price is determined. There are generally considered to be two prices in the uranium market: (1) long-term contract prices, and (2) spot prices. These two prices are published by companies that provide marketing support to the industry. The price report UxC is the most followed report in the industry. Over the long term, price follows the classic market force of supply demand balance with a speculative investment market that creates price volatility.
TradeTech LLC (TradeTech) generates a composite price forecast based on a weighted average of the Forward Available Model 1 and 2 (FAM 1 and FAM 2) projections. Each FAM scenario has a distinct trajectory, however, TradeTech expects reality to fall between the two FAM scenarios. The Weighted Average Term Price (WATP) is TradeTech's opinion of where the market will reside. Figure 19-1 provides a Long-Term Uranium Price Forecast through 2040 from TradeTech from the first quarter of 2024. FAM 1 and 2 forecasts differ in assumptions as to how future uranium supply enters the market.
"The FAM 1 model represents a good level of uranium production growth incorporating TradeTech's assessment of delays to current planned production. To provide insight into the implications of more significant supply delays, a FAM 2 model has been evaluated. The FAM 2 scenario assumes further restricted project development reflecting additional delays and cancellations." (TradeTech 2024). Currently, most US producers are in a mode of beginning to revive their projects that were on care and maintenance. At this time in the US, there are some new projects that are being seriously considered for licensing and permitting and/or a restart. This condition aligns more with the FAM 2 projections.
Figure 19-1: Long Term Uranium Price Forecast
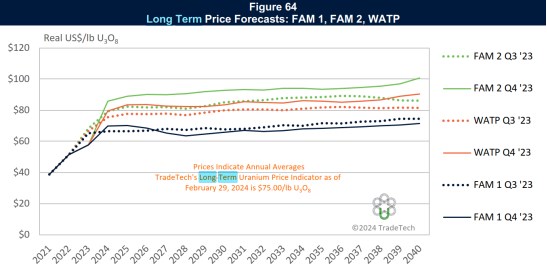
Source: TradeTech 2024
Consensus forecasts collected by SLR are in line with the FAM 2 spot prices in Figure 19-1, with long-term averages of approximately $80.00/lb. General industry practice is to use a consensus long-term forecast price for estimating Mineral Reserves, and 10% to 20% higher prices for estimating Mineral Resources.
| 19-2 | |
| Energy Fuels Inc. | Bullfrog Project | May 9, 2025 |
| Technical Report | SLR Project No.: 123.V02544.00008 |
For Mineral Resource estimation and cash flow projections, SLR selected a U3O8 price of $90.00/lb, on a Cost, Insurance, and Freight (CIF) basis to customer facility, based on independent forecasts. This price was derived from a review of independent market forecasts conducted in Q1 2024. This includes pricing trends published by TradeTech and UxC, as well as consensus forecasts collected by SLR from a range of credible industry sources. The selected price reflects an average of long-term forward-looking uranium price projections extending through 2035-2040, with emphasis on the weighted average projections from TradeTech's FAM 2 scenario, which aligns with anticipated supply constraints and current US project restart conditions.
The justification for using this long-term forecast period is rooted in standard mining industry practice. Mineral Resource estimation typically uses a long-term price forecast to better reflect the sustained pricing environment under which a project is expected to be developed and operated. Spot prices are volatile and not representative of the pricing typically realized under term contracts for uranium supply. The selected time frame also aligns with projected production timelines and supports the economic viability of the Project over its anticipated life-of-mine.
The SLR QP has reviewed the market studies and analysis reports and is of the opinion they support the findings of this Technical Report and disclosure of the Mineral Resource estimates. By their nature, all commodity price assumptions are forward-looking. No forward-looking statement can be guaranteed, and actual future results may vary materially.
19.2 Contracts
At this time, EFR has not entered into any long-term agreements for the provision of materials, supplies, or labor for the Project. The construction and operations will require negotiation and execution of a few contracts for the supply of materials, services, and supplies.
| 19-3 | |
| Energy Fuels Inc. | Bullfrog Project | May 9, 2025 |
| Technical Report | SLR Project No.: 123.V02544.00008 |
20.0 Environmental Studies, Permitting, and Social or Community Impact
20.1 Environmental Studies
EFR has performed select environmental studies of the Project area, starting in 2014 and supplemented in 2015 and 2016. The methods and scope of work for these efforts were defined by EFR in coordination with the U.S. Bureau of Land Management (BLM) and the Utah Department of Natural Resources, Division of Oil, Gas and Mining (DOGM). Available resource data including previous surveys near the Project area, publications, and databases were collected and reviewed prior to the field surveys. Results of baseline information collected and studied by EFR included the following:
20.1.1 Vegetation Studies
The topography of the Project area consists of rolling hills, incised ephemeral drainages, and Badlands. Elevations range from 5,000 ft to 5,500 ft ASL. The Project area is dominated by Blackbrush shrubland and grassland, low salt desert scrub, sparsely vegetated or unvegetated Badlands, and areas of sagebrush shrubland and stands of pinyon pine (Pinus edulis) and Utah juniper (Sabina osteosperma). Badlands typically had little to no vegetation cover. Blackbrush Shrubland cover ranged from about 9% to 26%. Salt Desert Scrub typically had slightly less cover, which ranged from 5% to 25%. Blackbrush Grasslands, Sagebrush Shrubland, and Pinyon/Juniper vegetation types generally had slightly more than 20% cover. Weighted by area, the average vegetation cover ranged from about 3% to 26%.
20.1.2 Wetlands and Waters of the U.S.
There are no wetlands in the Project area, although there are several erosional features. Waters of the U.S. were identified along the north and south access roads to the Project area. Copper Creek, on the west edge of the study area, supports wetlands outside of the defined survey boundary.
20.1.3 Noxious Weeds
One Utah State-listed noxious weed, tamarisk, was observed within the Project area. No other Utah State-listed noxious weeds were observed in the Project area.
20.1.4 Wildlife
A variety of wildlife and bird species are likely to be present in the Project area. Various lizards and snakes, rodents, and lagomorph habitat were observed. Cottontail rabbit scat was observed in the Project area. Seventeen species of bats were recorded at the Tony M Mine evaporation pond about 2 miles south of the Bullfrog Mine project area. Some of these bats may use habitat in the project area. Based on the observed habitats, migratory bird species, including various songbirds and ravens, could live and forage in the Project area. While no raptor nests or activity was observed during the 2014 and 2015 surveys, raptors may forage in the Project area for smaller birds, rodents, and rabbits. The availability of prey is limited and, therefore, use of the Project area by foraging raptors likely is minimal. Habitat for raptor nesting is poor because of the lack of tall trees and rocky cliffs.
| 20-1 | |
| Energy Fuels Inc. | Bullfrog Project | May 9, 2025 |
| Technical Report | SLR Project No.: 123.V02544.00008 |
20.1.5 Threatened, Endangered and Sensitive Species
Garfield County, Utah, contains potential habitat for several federally listed threatened and endangered species; however, no suitable habitat for these species was observed in the Project area. Coordination with the State of Utah Natural Resources Department, Utah Natural Heritage Program, and the BLM-Henry Mountains Field Office took place in 2014. As part of this coordination, these agencies provided lists of Threatened, Endangered, and Sensitive Species for federal and state jurisdictions that were focused on the Garfield County area. Federal and state representatives verified that there are no known occurrences, nor any expected occurrences, of any federally listed threatened or endangered species within the project area.
A list of potential federally listed threatened and endangered species that may occur in and adjacent to project area are presented in Table 20-1.
Table 20-1: Federally Listed Potential Threatened and Endangered Species Which May Impact the Bullfrog Mine
| Species | Listing | Habitat Requirements | Habitat Observed in Project Area |
| Humpback chub Gila cypha |
Endangered | Large turbid rivers in the Colorado River sys1eru | No; no perennial drainages or potential for depletions to the Colorado River |
| Colorado pikeminnow Ptychocheilus lucius |
Endangered | Large, warm and swift rivers in the Colorado River sytem | No; no perennial drainages or potential for depletions to the Colorado River |
| Bonytail chub Gila elegans |
Endangered | Backwaters with muddy bottoms and flowing pools in the Colorado River basin | No: no perennial drainages or potential for depletions to the Colorado River |
| Razorback sucker Xyrauchen texanus |
Endangered | Medium to large rivers with swift turbulent waters in the Colorado River system | No; no perennial drainages or potential for depletions to the Colorado River |
| Mexican spotted owl Strix occidentalis |
Threatened | Species found in steep- walled canyons and mixed- conifer forests | No canyon habitat |
| Greater sage-grouse Centrocercus urophasianus |
Candidate | Sagebrush communities, sagebrush-grass forb, and wet meadows | No; very limited sagebrush community present |
| Yellow-billed cuckoo Coccyzus americanus |
Candidate | Riparian areas. moist thickets, and orchards | No suitable riparian habitat |
| Southwestern willow flycatcher Empidonax trailii extimus |
Endangered | Species requires open second growth and woodlands, swamps, scrubby and brushy areas and thickets (AOU 1983) | No suitable riparian habitat |
| California condor Gymnogyps californianus |
Threatened Experimental Population, Non-Essential |
Prefers low to moderate elevation mountainous country; generally found in brushy and rocky areas with cliffs for nesting and foraging habitat consisting of oak savannahs, grasslands. canyons, and mountain plateaus (AOU 1983) |
No suitable habitat |
| 20-2 | |
| Energy Fuels Inc. | Bullfrog Project | May 9, 2025 |
| Technical Report | SLR Project No.: 123.V02544.00008 |
| Species | Listing | Habitat Requirements | Habitat Observed in Project Area |
| Ute ladies'-tresses orchid Spiranthes diluvialis |
Threatened | Wetlands; typically along streams or brooks | No suitable habitat |
| Jones cycladenia Cycladenia humilis var. jonesii | Threatened | Desert Shrub; barren gypsiferous clay hills that form the steep sides and lower slopes of mesas (NatureServe 2014) | No suitable gypsiferous soils present; no plants observed |
| Maguire daisy Erigeron maguirei |
Recovery | Mountain shrub zone; the daisy prefers shaded cool alcoves and mesic wash bottoms as well as partially shaded slopes of eroded sandstone cliffs (FWS 1995a) | No potential habitat observed |
| Autumn buttercup Ranunculus aestivalis |
Endangered | Found in the perennially moist soils in wet meadows along the Sevier River (Smith et al. 1991) | No habitat in the Project area |
| Wright fishhook cactus Sclerocactus wrightiae |
Endangered | Low-elevation desert trough of the San Rafael swell; habitat ranges from saltbrush clay flats to sandy desert grasslands (Wright Fishhook Recovery Committee 1985) | Not known to occur in the Project area |
| Winkler cactus Pediocactus winkleri |
Threatened | Desert shrub vegetation with find sandy soil; only known occurrences in narrow arc between central Wayne County and extreme southwest Emery County (FWS 1995b) | Not known to occur in the Project area |
| Utah prairie dog Cynomys parvidens |
Threatened | Species prefers grasslands at elevations between 5,400 and 9,500 ft above sea level (FWS 2013) | No suitable habitat in the Project area |
| Source: FWS 2015 | |||
Table 20-2 lists the sensitive species with potential habitat in the Project area. None of these species were observed during baseline study field surveys.
| 20-3 | |
| Energy Fuels Inc. | Bullfrog Project | May 9, 2025 |
| Technical Report | SLR Project No.: 123.V02544.00008 |
Table 20-2: State of Utah, Garfield County, Sensitive Species with Potential Habitat in the Project Area
| Species of Concern | Habitat | Species Observed |
| Allen's (Mexican) big-eared bat Idionycteris phyllotis |
Oak brush, pinyon-juniper woodland, riparian woodland, ponderosa pine; generally found near rocky outcrops, boulders, and cliffs; typically forages near ponds and streams | Not observed; record of occurrences within a 2-mile radius of the Project area |
| Fringed myotis Myotis thysanodes |
Woodland habitats including ponderosa pine, pinyon-juniper, greasewood, saltbush, scrub oak; roots in caves, mines, buildings, and rock crevices | Not observed; record of occurrences within a 2-mile radius of the Project area |
| Townsend's big-eared bat Perognathus flavus |
In the West, scrub deserts and pine and pinyon-juniper forests; roosts and hibernates in caves and mines | Not observed; record of occurrences within a 2-mile radius of the Project area |
20.1.6 Cultural (and Archaeological/Historical) Resources
20.1.6.1 Paleontology
During the EFR Project paleontological resources survey, five fossil localities, including vertebrate, invertebrate, and plant remains, were documented in the Project area, producing a survey result of "Positive Findings." These were discovered in the Tununk Member of the Late Cretaceous Mancos Formation, and the Brushy Basin and Tidwell Members of the Late Jurassic Morrison Formation.
20.1.7 Radiation
No elevated radiation levels were measured in the survey, although it was speculated that elevated levels likely exist in the vicinity of abandoned drill holes that are present in these areas from previous exploration projects. Even though most of the drill cuttings were used to backfill and plug the drill holes, some Salt Wash cuttings may remain at the surface around the holes and near the surface in reclaimed mud pits. Even though radiation levels can be expected to be above background levels, they were considered to be relatively low and limited in areal extent and to not represent a health hazard.
20.1.8 Ore and Waste Characterization
Mining at the Project will generate waste rock and uranium mineralized material from the Salt Wash Member of the Morrison Formation. The Salt Wash has been mined since the early 1900s in southeastern Utah and southwestern Colorado, and this geologic unit has a fairly similar lithology and chemical content throughout this region. EFR has collected geochemical data from other Salt Wash mines in the region, including the nearby Tony M Mine, and performed an initial chemical characterization of the types of waste rock and mineralized material that will be mined at the Bullfrog Project. A risk analysis was also conducted to determine if these materials are potentially deleterious as defined by DOGM in UAC §R647 or could result in unnecessary or undue degradation of the environment as defined by the BLM in 43 CFR §3809.5.
| 20-4 | |
| Energy Fuels Inc. | Bullfrog Project | May 9, 2025 |
| Technical Report | SLR Project No.: 123.V02544.00008 |
The waste rock was found to contain elevated levels of uranium, arsenic, selenium, and radium, but in concentrations that did not represent a risk to human health or the surrounding ecosystem. The waste rock has net-neutralization potential and will not generate acid-mine drainage. Although it has the potential to leach metals and radionuclides under saturated conditions, these conditions do not exist at the Bullfrog Project because of its location in an arid environment where precipitation typically runs off or evaporates before it can infiltrate to any extent into the ground surface.
20.1.9 Soils
The Project area is located in sedimentary deposits of the Colorado Plateau. The geology of the Project area is characterized primarily by interbedded layers of shale, sandstone, and eroded sedimentary material (USGS 1973). The west side of the project area includes a mix of upper Cretaceous layers of Mancos shale and Dakota sandstone, as well as Cedar Mountain and Morrison Formation shale, conglomerates, and mudstone. The geologic parent material of the east side of the project area contains lenses of chert, sandy conglomerates, mudstone, and siltstone of the Morrison Formation.
20.1.10 Miscellaneous
Other baseline studies may be required and performed to the level of detail and quality typically required by state and federal agencies to perform environmental evaluation and support permitting. Examples include:
Socio-economic Studies (including Environmental Justice)
Air Quality and Meteorology
While these additional studies have not been completed, based on a review of completed studies and an understanding of similar studies completed in adjacent areas of the Project, the QP is not aware of any environmental issues that could materially affect Project permitting or impact the reasonable prospects for eventual extraction of extract the Mineral Resource.
20.2 Project Permitting
Permitting of the proposed Project will require approvals from federal, state and local (county) agencies. These approvals include:
• Plan of Operation and reclamation bond from the BLM
• Notice of Intention and reclamation bond from the Utah DOGM
• Conditional Use Permit from Garfield County
• Various other approvals from state agencies including an air quality permit, ground water and surface water discharge permits, pond construction and operating permits, a septic permit and water right(s).
A Memorandum of Understanding (MOU) has been developed between the BLM and the DOGM to facilitate a coordinated review and approval process where responsibilities overlap.
Detailed summaries of the responsible agencies and permits that may be required are provided below.
| 20-5 | |
| Energy Fuels Inc. | Bullfrog Project | May 9, 2025 |
| Technical Report | SLR Project No.: 123.V02544.00008 |
U.S. Bureau of Land Management
As portions of proposed disturbance activities will be located on BLM lands, the BLM will serve as the lead federal agency during the review process under the National Environmental Protection Act (NEPA). The BLM's NEPA process requires submittal of a Plan of Operations (POO), including the collection and assessment of environmental baseline studies as described in Section 20.0 above, public scoping meetings, preparation of an Environmental Assessment (EA) or Environmental Impact Statement (EIS), and approval of the POO through issuance of a Finding of No Significant Impact (FONSI) and Decision Record (following the EA process) or Record of Decision (EIS process). While approval of the POO through BLM is anticipated to be one of the more time-critical permitting requirements, it is not expected to present any technical challenges in the overall development of the Project.
The BLM also has requirements for financial assurance (i.e., reclamation bonds) to guarantee reclamation, and (under the above referenced MOU) serves as a cooperating agency with the state of Utah to provide concurrence on reclamation estimates and as a co-beneficiary on surety instruments.
Utah Department of Natural Resources, Division of Oil, Gas, and Mining
An approved Notice of Intention (NOI) to Commence Large Scale Mining Operations will be required through DOGM. The NOI application consists of an Operations Plan, Reclamation Plan and environmental baseline studies as described in Section 20.0 above. The DOGM is also the lead agency in the financial surety process in the state of Utah and works directly with cooperating agencies, including the BLM and State of Utah School & Institutional Trust Lands Administration, to receive concurrence on reclamation performance bonds. Similar to the POO process through the BLM, approval of the NOI through DOGM is anticipated to be one of the more time-critical permitting requirements.
Utah Department of Environmental Quality, Division of Air Quality
Air quality permits to Construct and Operate will be required from the Utah Department of Environmental Quality, Division of Air Quality (DAQ). Air emission sources typically covered under these permits for underground uranium mines include fugitive dust from surface disturbances, emissions from generators, underground mine venting of radon, fuel storage tanks and boilers. The air emission sources from this project will either be covered under a minor source permit (Approval Order) or Title V Permit depending on the number and horsepower of generators needed to supply electrical power to the project. Approval of the air quality permit is not anticipated to present any technical or time-critical issues.
Utah Department of Environmental Quality, Division of Water Quality
Dewatering of the underground workings and discharge of treated water will require a series of permit approvals from the Utah Department of Environmental Quality, Division of Water Quality (DWQ). These permits may include a Construction Permit and Approval to Operate for the storage and/or treatment ponds, a Ground Water Discharge Permit or Permit by Rule to discharge ground water into the pond(s), and a Utah Pollutant Discharge Elimination System (UPDES) Water Discharge Permit for discharge of treated water to the land surface.
While the site is anticipated to be designed to be a zero-discharge facility from a storm water standpoint, the Project will require coverage under a UPDES General Industrial Storm Water Permit due to the potential for storm water discharge from the facility. Approval of the various ground water and surface water discharge permits through DWQ are not anticipated to present any technical or time-critical issues.
| 20-6 | |
| Energy Fuels Inc. | Bullfrog Project | May 9, 2025 |
| Technical Report | SLR Project No.: 123.V02544.00008 |
Utah Department of Environmental Quality, Division of Drinking Water
The Utah Department of Environmental Quality, Division of Drinking Water (DDW) is responsible for permitting of potable water systems including non-transient, non-community public water systems. The DDW's permitting process requires approval of a Drinking Water Source Protection Plan, Water System Plan (Construction) Approval and Water System Operating Permit. A potable water system is currently not being proposed for the Project, as potable water will be supplied from an alternative, permitted source, i.e., water will be sourced from commercial suppliers of potable water.
Utah Department of Natural Resources, Division of Water Rights
The Department of Natural Resources, Division of Water Rights regulates the appropriation and distribution of water in the state of Utah. It also serves as the office of public record for the diversion and beneficial use of water in the form of water rights. The only water right anticipated for the project is for the appropriation and beneficial use of water associated with dewatering of the underground workings. Approval of this water right is not anticipated to present any technical or time-critical issues.
State of Utah School & Institutional Trust Lands Administration
Prior to commencing any surface disturbance on state (trust) lands subject to a mineral lease or permit, the State of Utah School & Institutional Trust Lands Administration (SITLA) requires submittal and approval of a plan of operations simultaneous with the NOI approval process through the DOGM. For proposed disturbances on trust lands, the SITLA also requires posting of a reclamation performance bond through DOGM prior to the commencement of operations and provides concurrence directly to the DOGM during the reclamation surety process. By rule, SITLA's notice(s) of approval are to be provided to the DOGM in an expeditious manner and, therefore, not anticipated to present any time-critical issues.
Southwest Utah Public Health Department
The Southwest Utah Public Health Department is responsible for permitting of onsite wastewater (septic) systems in the southwest region of Utah, which includes Garfield County. Approval of a septic permit is not anticipated to present any technical or time-critical issues.
Garfield County
A Conditional Use Permit (CUP) will be required by Garfield County. The CUP is not anticipated to present technical or time critical issues in the development of this project.
20.3 Social or Community Requirements
The surrounding communities have a long history of working with, and for, the region's mining and mineral resource industry, and their support for this Project is expected to be strong. Much of the Project's anticipated local support will be economically driven, as the Project is expected to create more jobs and generate revenue from local and state taxes and royalties. Energy Fuels has a long history of hiring the skilled personnel required to operate similar projects in the region and plans to do the same for the Project. To the extent possible and where expertise is available, the QP recommends that EFR endeavor to procure equipment, supplies and services locally and to hire local personnel.
Development and maintaining of a Social License will be integral to EFR's success.
| 20-7 | |
| Energy Fuels Inc. | Bullfrog Project | May 9, 2025 |
| Technical Report | SLR Project No.: 123.V02544.00008 |
20.4 Mine Closure Requirements
The land encompassing the Project area is currently designated as multiple use and is used mostly for livestock grazing, wildlife habitat, and recreation (primarily off-road vehicles). Reclamation will return disturbed areas of the Project to the same pre-mining land use(s). As described in Section 20.2 above, reclamation plans and performance bonds will be required and in place prior to the startup of mining in accordance with state and federal requirements. At the conclusion of underground operations, mine openings will be sealed, with waste rock piles being used for backfilling and/or reclaimed in place. Infrastructure will be dismantled and removed, buildings demolished, and other surface features, such as roads and ponds, reclaimed in place. Areas of disturbance will be contoured to blend with the existing landscape and re-vegetated using topsoil salvaged during development activities and a native seed mix. The site will be monitored for reclamation performance by state and federal agencies until reclamation is deemed complete and the financial assurance/reclamation bond is released.
20.5 QP Opinion
Given the early stage of the Project, EFR has not yet applied for any mining-related permits. Site-specific environmental baseline studies may need to be supplemented to support future permit applications. In the opinion of the QP, the current status of permitting and planning related to ESG issues is appropriate for the stage of project.
| 20-8 | |
| Energy Fuels Inc. | Bullfrog Project | May 9, 2025 |
| Technical Report | SLR Project No.: 123.V02544.00008 |
21.0 Capital and Operating Costs
21.1 Capital Costs
It is proposed that mine equipment will be purchased through the preproduction period. Mine development includes activities prior to mine stope development. Ventilation and escapeway raise development costs include conventional raise boring and contractor costs.
Surface equipment is estimated using new equipment. Used equipment is estimated for low use equipment like the grader and cranes.
Infrastructure includes buildings, roads, yards, power, and supplies storage needs for the Project, including the materials handling requirements at the White Mesa Mill.
The surface infrastructure indirect costs exclude embedded indirect costs allocated to the underground mine construction contracts and surface installation construction contracts. Engineering for the facilities and operations will be carried out through the permitting and the construction phases. Engineering costs for the completion of the pre-feasibility-level engineering are included in this estimate.
Procurement for the Project is forecast to extend over a four-year period with a crew of three working on purchasing, expediting, payables, and some level of freight handling. The construction management at Bullfrog is forecasted to include a staff of four to five management personnel for a three-year period. After construction, most of the personnel will continue with operations. Supervisor salary rates for this period reflect the overtime in a remote construction effort.
The construction support crew includes operators for cranes, forklifts, and trucks, as well as laborers to support the construction efforts. The cost estimate includes construction support items that would be rented or provided by subcontractors in a less remote location.
The Owner's Costs include an Owner's team of four staff for one year prior to the commencement of development and operations, including operating personnel brought to site in advance of the "start-up". The estimate is based upon a mine staff and mine crew of 84 at full operation and includes recruitment. No costs for the Mill are carried in those individual capital estimates. The environmental bond is estimated to be $1.8 million for the combined Bullfrog Mine and White Mesa Mill sites (for the Bullfrog mineralized material only).
The QP has taken into account the risks associated with the specific engineering estimation methods used to arrive at the cost estimates, and has taken into consideration the accuracy of the estimation methods for similar projects at an Initial Assessment level of study. The cost estimate includes a contingency allowance of 25%, and an accuracy of approximately +/-50%. The SLR QP considers this a minimum level of contingency for the Project at the current state of planning and development.
Life of Mine (LOM) direct capital costs are summarized in Table 21-1 in 2023 US dollars.
| 21-1 | |
| Energy Fuels Inc. | Bullfrog Project | May 9, 2025 |
| Technical Report | SLR Project No.: 123.V02544.00008 |
Table 21-1: LOM Direct Capital Cost Summary
| Capital Cost Item | Preproduction Yr-4 to Yr-1 ($ 000) |
Mine Production Yr1 to Yr15 ($ 000) |
LOM Totals ($ 000) |
LOM Total as a Percentage of Total Capital Costs |
| Total Primary, 12 ft x 12 ft | $7,953 | $8,894 | $16,847 | 23% |
| Total Secondary, 10 ft x 12 ft | $4,301 | $8,745 | $13,045 | 17% |
| Total Production, 10 ft x 8 ft | $895 | $6,888 | $7,784 | 10% |
| Total Ventilation Shaft Length, 8 ft dia. | $268 | $2,858 | $3,127 | 4% |
| Subtotal Development | $13,417 | $27,385 | $40,803 | 55% |
| Mine Mobile Equipment | $15,523 | $5,748 | $21,271 | 28% |
| Site Powerlines | $1,592 | $1,396 | $2,987 | 4% |
| Mine Ventilation Equipment | $538 | $1,608 | $2,146 | 3% |
| Mine Buildings | $3,883 | $213 | $4,096 | 5% |
| Dewatering Wells | $975 | $1,901 | $2,876 | 4% |
| Access Road, 16-ft wide | $515 | $- | $515 | 1% |
| Fencing | $- | $4 | $4 | 0% |
| Totals | $36,443 | $38,256 | $74,698 | 100% |
For this estimate, the Engineering Procurement Construction Management (EPCM), Owner's Costs, and Indirect Costs (Other Costs) were estimated at 20% of the total Direct Costs during the pre-production period, which equates to $7.3 million. As previously noted, a contingency of 25% was applied to the sum of the Direct Costs and Other Costs; for the pre-production period, this equates to approximately $10.9 million. Sustaining capital costs are estimated to be $38.3 million. Permitting and Closure for this mine were estimated to be approximately $4.3 million.
Life of Mine (LOM) capital costs are summarized in Table 21-2 in 2023 US dollars.
Table 21-2: LOM Capital Cost Summary
| Capital Cost Item | Initial Capital Preproduction Yr-4 to Yr-1 ($ 000) |
Sustaining Capital Mine Production Yr1 to Yr15 ($ 000) |
LOM Totals ($ 000) |
| Direct Capital Costs | $36,443 | $38,256 | $74,698 |
| Other Costs (20% of Direct) | $7,289 | 0 | 7,289 |
| Total Direct + Other Costs | $43,731 | 38,256 | $81,988 |
| Contingency (25%) | $10,933 | $10,933 | |
| Permitting and Closure | 4,322 | ||
| Total Capital Costs | $54,664 | $38,256 | $97,242 |
| 21-2 | |
| Energy Fuels Inc. | Bullfrog Project | May 9, 2025 |
| Technical Report | SLR Project No.: 123.V02544.00008 |
The following is excluded from the capital cost estimate:
• Project financing and interest charges
• Land acquisition, leases rights of way and water rights
• Escalation during construction
• Permits, fees and process royalties
• Environmental impact studies
• Initial fills and first charges
• Any additional civil, concrete work due to the adverse soil condition and location
• Insurance during construction
• Taxes
• Import duties and custom fees
• Cost of geotechnical investigation
• Working capital
• Sunk costs
• Pilot Plant and other test work
• Exploration drilling
• Tailings expansions
• Costs of fluctuations in currency exchanges
• Project application and approval expenses
• Future expansion
• Plant mobile equipment
• Permanent communications
• Townsite
• Rail service
• Construction camp
• Catering costs
The QP has taken into account the risks associated with the specific engineering estimation methods used to arrive at the cost estimates, and has taken into consideration the accuracy of the estimation methods for similar projects at a PEA level of study. The cost estimate includes a contingency allowance of 25%, and an accuracy of approximately +/-50%. The SLR QP considers this a minimum level of contingency for the Project at the current state of planning and development
21.2 Operating Costs
The LOM average operating cost includes mining, general and administration, freight of the product to a point of sale (White Mesa Mill), toll milling costs at White Mesa Mill, and various royalties and severance taxes. The Project operating costs were estimated in 2023 US dollars basis.
| 21-3 | |
| Energy Fuels Inc. | Bullfrog Project | May 9, 2025 |
| Technical Report | SLR Project No.: 123.V02544.00008 |
Table 21-3: LOM Operating Unit Costs Summary
| Unit Operating Cost Summary | Units | LOM Unit Operating Cost |
| Underground Mining Cost | $/ton milled | $135.05 |
| Milling & Processing | $/ton milled | $110.00 |
| G&A | $/ton milled | $32.73 |
| Transportation (Bullfrog Mine to White Mesa Mill; 127 miles) | $/ton milled | $29.85 |
| Total | $307.63 |
21.2.1 Workforce
Table 21-4 summarizes the staffing requirements for the Project during the peak production period.
Table 21-4: Staff Requirements
| Department | Number of Employees | ||
| Staff | Hourly | Total | |
| Operations | 5 | 49 | 54 |
| Underground Maintenance | 1 | 7 | 8 |
| Technical Services | 2 | 2 | 4 |
| Site Management and Administration | 0 | 4 | 4 |
| Total | 8 | 62 | 70 |
This study assumed a typical schedule at the mine of 2 crews, 5 days per week, 2 shifts per day, and 12 hours per shift. The schedule for most administration would be Monday through Friday, 8 am to 5 pm.
In addition, operations at the White Mesa Mill will require approximately 50 persons.
| 21-4 | |
| Energy Fuels Inc. | Bullfrog Project | May 9, 2025 |
| Technical Report | SLR Project No.: 123.V02544.00008 |
22.0 Economic Analysis
22.1 Base Case - Indicated and Inferred Resources
The economic analysis contained in this Technical Report is based, in part, on Inferred Mineral Resources, and is preliminary in nature. Inferred Mineral Resources are considered too geologically speculative to have the economic considerations applied to them that would enable them to be categorized as Mineral Reserves. There is no certainty that economic forecasts on which this PEA is based will be realized. Inferred Mineral Resource tonnage represents approximately 20% of the Mineral Resources used in this Base Case economic analysis. It is important to note that, unlike Mineral Reserves, Mineral Resources do not have demonstrated economic viability.
An after-tax Cash Flow Projection has been generated from the Life of Mine production schedule and capital and operating cost estimates. A summary of the key criteria is provided below.
22.1.1 Economic Criteria
22.1.1.1 Revenue
• Total mill feed processed: 1,765 kt
• Percent of Inferred Mineral Resource tonnage in LOM: 20%
• Average head grade: 0.28% eU3O8
• Average mining rate: 10,000 tons per month mining from underground (120,000 tons per year).
• Cut-off grade of 0.15% applied to diluted stope shapes.
• eU3O8 is sold at 100% payable.
• All prices are in US dollars, the Project is located in Utah, and all products produced are sold domestically.
• Metal Price: US$90/lb eU3O8.
• Net Smelter Return includes refining, transport, and insurance costs.
• Revenue is recognized at the time of production.
• Average mill recovery: 95%
• Total Recovered U3O8: 9,226 llb
22.1.1.2 Costs
Pre-production period: four years (Year -4 through Year -1).
Mine life: 15 years.
Life of Mine production plan as summarized in Table 16-7.
Mine life capital totals $97 million, initial capital totals $55 million, permitting and closure totals $4 million, and sustaining capital totals $38 million.
| 22-1 | |
| Energy Fuels Inc. | Bullfrog Project | May 9, 2025 |
| Technical Report | SLR Project No.: 123.V02544.00008 |
22.1.1.3 Taxation and Royalties
There are no royalties on the Bullfrog production other than the state of Utah has a 2.6% Severance mineral tax. Income tax assumptions include a 21% Federal Income tax rate and a Utah Income tax rate of 4.50%. Unit of Production (UoP) depreciation was used along with percentage depletion of 22% versus cost depletion.
22.1.2 Cash Flow Analysis
Considering the Project on a stand-alone basis, the undiscounted after-tax cash flow totals $147 million over the mine life, and simple payback occurs approximately 5.8 years from start of production. The after-tax Net Present Value (NPV) at an 8% discount rate is $31 million, and the after-tax Internal Rate of Return (IRR) is 14%.
The amount of Inferred Mineral Resources included in this study represents approximately 20% of the total Mineral Resources tons. Inferred Mineral Resources are geologically speculative, and there is no certainty that economic forecasts on which this PEA is based will be realized.
The Base Case cash flow analysis is provided in Section 30.0 Appendix. A summary of the after-tax cash flow is provided in Table 22-1. Figure 22-1 presents the payable metal by year.
Table 22-1: Base Case After-Tax Cash Flow Summary
| Description | US$ million |
| Realized Market Prices | |
| U3O8 ($/lb) | $90 |
| Payable Metal | |
| U3O8 (klb) | 9,226 |
| Total Gross Revenue | 830 |
| Mining Cost | (238) |
| Mill Feed Transport Cost | (53) |
| Process Cost | (194) |
| Surface Facility Maintenance Cost | 0 |
| G & A Cost | (58) |
| Product Transport to Market | 0 |
| Royalties | 0 |
| Severance Tax | (20) |
| Total Operating Costs | (563) |
| Operating Margin (EBITDA) | 267 |
| Operating Margin % | 32% |
| Corporate Income Tax | (22) |
| Working Capital* | 0 |
| 22-2 | |
| Energy Fuels Inc. | Bullfrog Project | May 9, 2025 |
| Technical Report | SLR Project No.: 123.V02544.00008 |
| Operating Cash Flow | 245 |
| Development Capital | (55) |
| Exploration | 0 |
| Sustaining Capital | (38) |
| Closure/Reclamation | (4) |
| Total Capital | (97) |
| Pre-tax Free Cash Flow | 169.8 |
| Pre-tax NPV @ 5% | 72.5 |
| Pre-tax NPV @ 8% | 40.5 |
| Pre-tax NPV @ 12% | 14.0 |
| Pre-tax IRR | 15.6% |
| After-tax Free Cash Flow | 147.6 |
| After-tax NPV @ 5% | 59.8 |
| After-tax NPV @ 8% | 31.2 |
| After-tax NPV @ 12% | 7.6 |
| After-tax IRR | 14.0% |
| Notes: *Includes Working Capital of $24.7 million through first two years of production |
|
Figure 22-1: Base Case Payable U3O8
| 22-3 | |
| Energy Fuels Inc. | Bullfrog Project | May 9, 2025 |
| Technical Report | SLR Project No.: 123.V02544.00008 |
22.1.3 Sensitivity Analysis
Project risks can be identified in both economic and non-economic terms. Key economic risks were examined by running cash flow sensitivities:
• eU3O8 price
• Mill Recovery
• Head grade
• Operating costs
• Pre-production capital costs
• Mine life
Pre-tax IRR sensitivity over the base case has been calculated for -20% to +20% variations. The sensitivities are shown in Figure 22-2 and Table 22-2.
The sensitivity analysis reveals the variations in key economic factors-such as metal prices, operating costs, and recovery rates-that can significantly impact the Project's net present value (NPV) and internal rate of return (IRR). Understanding these sensitivities is crucial for effective risk management and strategic decision-making.
| 22-4 | |
| Energy Fuels Inc. | Bullfrog Project | May 9, 2025 |
| Technical Report | SLR Project No.: 123.V02544.00008 |
Table 22-2: Base Case After-Tax Sensitivity Analyses
|
Variance |
Head Grade |
NPV at 8% |
|
80% |
0.22% |
($24,309) |
|
90% |
0.25% |
$2,120 |
|
100% |
0.28% |
$31,155 |
|
110% |
0.30% |
$60,668 |
|
120% |
0.33% |
$90,182 |
|
Variance |
Recovery |
NPV at 8% |
|
95% |
76% |
($24,309) |
|
98% |
86% |
$2,120 |
|
100% |
95% |
$31,155 |
|
103% |
97% |
$38,533 |
|
105% |
100% |
$45,912 |
|
Variance |
Metal Prices |
NPV at 8% |
|
80% |
$72.00 |
($24,309) |
|
90% |
$81.00 |
$2,120 |
|
100% |
$90.00 |
$31,155 |
|
103% |
$99.00 |
$60,668 |
|
105% |
$108.00 |
$90,182 |
|
Variance |
Operating Costs |
NPV at 8% |
|
85% |
$416,786 |
$58,321 |
|
93% |
$453,561 |
$44,738 |
|
100% |
$490,336 |
$31,155 |
|
118% |
$576,145 |
$194 |
|
135% |
$661,954 |
($27,993) |
|
Variance |
Capital Costs |
NPV at 8% |
|
85% |
$82,655 |
$41,430 |
|
93% |
$89,949 |
$36,292 |
|
100% |
$97,242 |
$31,155 |
|
118% |
$114,259 |
$19,168 |
|
135% |
$131,276 |
$7,181 |
| 22-5 | |
| Energy Fuels Inc. | Bullfrog Project | May 9, 2025 |
| Technical Report | SLR Project No.: 123.V02544.00008 |
Figure 22-2: Base Case After-Tax Sensitivity Analysis
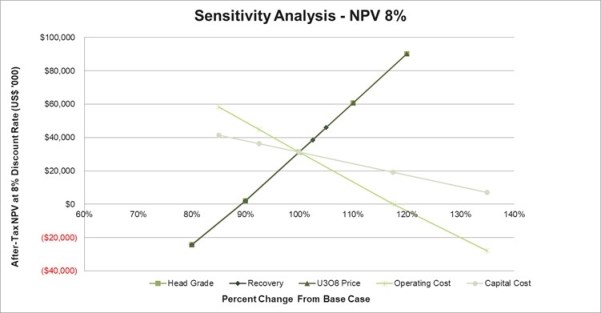
22.2 Alternative Case - Indicated Only
The SLR QP also undertook an analysis of an alternative case that considers only Indicated Mineral Resources, which account for approximately 1.42 million tons, or 80%, of the 1.76 million tons in the base case production schedule. The Project has no estimated Measured Resource. The SLR QP has determined that a stand-alone alternative case with only Indicated Mineral Resource tonnage is economic using the assumptions and inputs outlined in the Base Case at an Internal Rate of Return of approximately 12%. The SLR QP notes that while the alternative case does not contain Inferred Mineral Resources, Indicated Mineral Resources are not Reserves and do not have demonstrated economic viability. There is no certainty that economic forecasts included in this PEA will be realized.
EFR plans to conduct additional definition drilling of the known mineralized material to convert the Inferred Mineral Resources to Indicated Mineral Resources.
22.2.1 Economic Criteria
22.2.1.1 Revenue
• Total mill feed processed: 1,419 kt
• Average head grade: 0.27% eU3O8
• Average mining rate: 10,000 tons per month mining from underground (120,000 tons per year).
• Cut-off grade of 0.15% applied to diluted stope shapes.
• eU3O8 is sold at 100% payable.
• All prices are in US dollars, the Project is located in Utah, and all products produced are sold domestically.
| 22-6 | |
| Energy Fuels Inc. | Bullfrog Project | May 9, 2025 |
| Technical Report | SLR Project No.: 123.V02544.00008 |
• Metal Price: US$90/lb eU3O8.
• Net Smelter Return includes refining, transport, and insurance costs.
• Revenue is recognized at the time of production.
• Average mill recovery: 95%
• Total Recovered U3O8: 7,324 llb
22.2.1.2 Costs
Pre-production period: four years (Year -4 through Year -1).
Mine life: 12 years.
Mine life capital totals $97 million, initial capital totals $55 million, permitting and closure totals $4 million, and sustaining capital totals $38 million.
Average operating cost over the mine life is $307.63 per ton milled.
22.2.1.3 Taxation and Royalties
There are no royalties on the Bullfrog production other than the state of Utah has a 2.6% Severance mineral tax. Income tax assumptions include a 21% Federal Income tax rate and a Utah Income tax rate of 4.50%. Unit of Production (UoP) depreciation was used along with percentage depletion of 22% versus cost depletion.
22.2.2 Cash Flow Analysis
Considering the Project on a stand-alone basis, the undiscounted after-tax cash flow totals $97.6 million over the mine life, and simple payback occurs approximately 5.7 years from start of production. The after-tax Net Present Value (NPV) at an 8% discount rate is $18.7 million, and the after-tax Internal Rate of Return (IRR) is 12.4%.
The cash flow analysis for the Alternative Case is provided in Section 30.0 Appendix and is summarized in Table 22-3. Figure 22-3 presents the payable metal by year.
Table 22-3: Alternative Case After-Tax Cash Flow Summary
| Description | US$ million |
| Realized Market Prices | |
| U3O8 ($/lb) | $90 |
| Payable Metal | |
| U3O8 (klb) | 7,324 |
| Total Gross Revenue | 659 |
| Mining Cost | (190) |
| Mill Feed Transport Cost | (42) |
| Process Cost | (156) |
| Surface Facility Maintenance Cost | 0 |
| G & A Cost | (47) |
| 22-7 | |
| Energy Fuels Inc. | Bullfrog Project | May 9, 2025 |
| Technical Report | SLR Project No.: 123.V02544.00008 |
| Description | US$ million |
| Product Transport to Market | 0 |
| Royalties | 0 |
| Severance Tax | (16) |
| Total Operating Costs | (452) |
| Operating Margin (EBITDA) | 207 |
| Operating Margin % | 31% |
| Corporate Income Tax | (15) |
| Working Capital* | 0 |
| Operating Cash Flow | 192 |
| Development Capital | (55) |
| Exploration | 0 |
| Sustaining Capital | (35) |
| Closure/Reclamation | (4) |
| Total Capital | (94) |
| Pre-tax Free Cash Flow | 112.7 |
| Pre-tax NPV @ 5% | 48.4 |
| Pre-tax NPV @ 8% | 25.8 |
| Pre-tax NPV @ 12% | 6.4 |
| Pre-tax IRR | 13.9% |
| After-tax Free Cash Flow | 97.8 |
| After-tax NPV @ 5% | 39.2 |
| After-tax NPV @ 8% | 18.8 |
| After-tax NPV @ 12% | 1.4 |
| After-tax IRR | 12.4% |
| Notes: *Includes Working Capital of $24.7 million through first two year of production |
|
| 22-8 | |
| Energy Fuels Inc. | Bullfrog Project | May 9, 2025 |
| Technical Report | SLR Project No.: 123.V02544.00008 |
Figure 22-3: Alternative Case Payable U3O8
22.2.3 Sensitivity Analysis
Project risks can be identified in both economic and non-economic terms. Key economic risks were examined by running cash flow sensitivities:
• eU3O8 price
• Mill Recovery
• Head grade
• Operating costs
• Pre-production capital costs
• Mine life
Pre-tax IRR sensitivity over the base case has been calculated for -20% to +20% variations. The sensitivities are shown in Figure 22-4 and Table 22-4.
The sensitivity analysis reveals the variations in key economic factors-such as metal prices, operating costs, and recovery rates-that can significantly impact the Project's net present value (NPV) and internal rate of return (IRR). Understanding these sensitivities is crucial for effective risk management and strategic decision-making.
| 22-9 | |
| Energy Fuels Inc. | Bullfrog Project | May 9, 2025 |
| Technical Report | SLR Project No.: 123.V02544.00008 |
Table 22-4: Alternative Case (Indicated Only) After-Tax Sensitivity Analyses
| Variance | Head Grade (% U3O8) |
NPV at 8% (US$000) |
| 80% | 0.22% | ($28,051) |
| 90% | 0.25% | ($5,602) |
| 100% | 0.27% | $18,814 |
| 110% | 0.30% | $44,604 |
| 120% | 0.33% | $70,393 |
| Variance | Recovery (%) |
NPV at 8% (US$000) |
| 95% | 76% | ($28,051) |
| 98% | 86% | ($5,602) |
| 100% | 95% | $18,814 |
| 103% | 97% | $25,262 |
| 105% | 100% | $31,709 |
| Variance | Metal Prices (US$/lb U3O8) |
NPV at 8% (US$000) |
| 80% | $72.00 | ($28,051) |
| 90% | $81.00 | ($5,602) |
| 100% | $90.00 | $18,814 |
| 103% | $99.00 | $44,604 |
| 105% | $108.00 | $70,393 |
| Variance | Operating Costs (US$/ton) |
NPV at 8% (US$000) |
| 85% | $334,526 | $42,754 |
| 93% | $364,043 | $30,784 |
| 100% | $393,560 | $18,814 |
| 118% | $462,434 | ($7,448) |
| 135% | $531,307 | ($31,706) |
| Variance | Capital Costs (US$000) |
NPV at 8% (US$000) |
| 85% | $80,284 | $28,971 |
| 93% | $87,368 | $23,893 |
| 100% | $94,452 | $18,814 |
| 118% | $110,981 | $6,964 |
| 135% | $127,510 | ($4,885) |
| 22-10 | |
| Energy Fuels Inc. | Bullfrog Project | May 9, 2025 |
| Technical Report | SLR Project No.: 123.V02544.00008 |
Figure 22-4: Alternative Case After-Tax Sensitivity Analysis
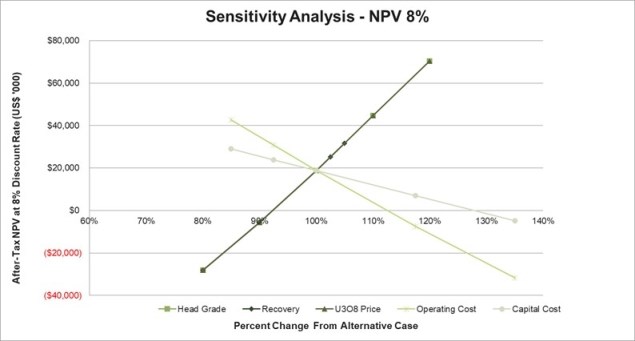
| 22-11 | |
| Energy Fuels Inc. | Bullfrog Project | May 9, 2025 |
| Technical Report | SLR Project No.: 123.V02544.00008 |
23.0 Adjacent Properties
23.1 Tony M Property
Exploration drilling in the Shootaring Canyon area was initiated by Plateau during the mid-1970s in the vicinity of small mine workings and outcropping uranium mineralization east of the canyon. In February 1977, drilling commenced on the former Tony M property and adjacent areas, with Plateau reportedly drilling more than 2,000 rotary drillholes totaling approximately 1,000,000 ft. Over 1,200 holes were drilled on the former Tony M property. Following the discovery of the Tony M deposit in 1977, Plateau developed the former Tony M property from September 1977 to May 1984, at which time mining activities were suspended. By January 31, 1983, over 18 mi of underground workings were developed at the Tony M mine, and a total of approximately 237,000 tons of mineralized material was extracted with an average grade of 0.121% U3O8 containing approximately 573,500 lb U3O8 (Roscoe et al., 2012)
The SLR QP notes that historically the Bullfrog property consisted of the Southwest, Copper Bench, and Indian Bench deposits. Exxon conducted reconnaissance in the Bullfrog property area in 1974 and 1975, staking its first claims in 1975 and 1976. A first phase drilling program in 1977 resulted in the discovery of what became the Southwest deposit. Additional claims were subsequently staked, and drilling was continued, first by Exxon's Exploration Group, and then by its Pre-Development Group. Several uranium and vanadium zones were discovered in the Southwest and Copper Bench areas, and mineralization exhibiting potential economic grade was also discovered in the Indian Bench area. Over the years, the properties changed ownership several times until 2012 when EFR acquired all the properties along with Tony M mine. In October of 2021, Consolidated Uranium Inc. acquired the Tony M mine and Southwest deposits. In December 2023, Consolidated Uranium Inc. merged with IsoEnergy Ltd.
Uranium mineralization for the Tony M property occurs over three stratigraphic zones of the lowermost 35 ft to 62 ft of the Salt Wash Member sandstone of the Jurassic age Morrison Formation.
23.2 Frank M Deposit
The Frank M deposit was discovered by Plateau during drilling in 1977. The Frank M deposit is located in Sections 2 and 3, T35S, R11E. It is located 0.5 miles southeasterly and a continuation of the Copper Bench mineralization of the Bullfrog deposit.
The host for the Frank M uranium deposit is the fluvial sandstone of the Salt Wash Member of the Jurassic Morrison Formation. The deposit is approximately 7,000 ft long and is commonly between 1,500 ft and 2,000 ft wide. The mineralized zone is located at a depth of 200 ft below ground surface in the east and over 500 ft below ground surface to the west. The average drilling depth in the area is approximately 400 ft. Nearly all of the deposit occurs above the static water table, which only intersects the mineralized horizon near the northwesterly limit of the Project.
On behalf of Plateau, in 1981, Geostat Inc. estimated the resource for the Frank M deposit using geostatistical methods (Plateau 1981).
On October 2, 2024, IsoEnergy Ltd. announced a definitive agreement pursuant to which IsoEnergy will acquire Anfield Energy Inc, including the Frank M property and Shootaring Canyon Mill (IsoEnergy 2024).
The location of the Frank M and Tony M properties are shown in Figure 4-2.
| 23-1 | |
| Energy Fuels Inc. | Bullfrog Project | May 9, 2025 |
| Technical Report | SLR Project No.: 123.V02544.00008 |
23.3 Lucky Strike 10 Deposit
The Lucky Strike 10 deposit is located on the southeast rim of Shootaring Canyon approximately 3.0 mi south of the southern extension of the Copper Bench deposit. It is a southeasterly extension of the Tony M mineralized trend and is located above the water table (Gupta 1983).
The SLR QP has not been able to verify the information on the adjacent properties and the information is not necessarily indicative of the mineralization on the Project.
| 23-2 | |
| Energy Fuels Inc. | Bullfrog Project | May 9, 2025 |
| Technical Report | SLR Project No.: 123.V02544.00008 |
24.0 Other Relevant Data and Information
No additional information or explanation is necessary to make this Technical Report understandable and not misleading.
| 24-1 | |
| Energy Fuels Inc. | Bullfrog Project | May 9, 2025 |
| Technical Report | SLR Project No.: 123.V02544.00008 |
25.0 Interpretation and Conclusions
The SLR QPs offer the following conclusions by area:
25.1 Geology and Mineral Resources
• The Bullfrog deposit is considered a tabular sandstone hosted uranium deposit.
• The Project is an advanced exploration stage property, 100% owned by EFR. The Project is in a region with a well-developed mining industry and is close to necessary infrastructure and resources.
• As of the effective date of this Technical Report, historical records of EFR predecessors indicate that approximately 1,694 drill holes have been completed on the Bullfrog deposit. Of the 1,694 drill holes, 949 drill holes totaling 910,780 ft of drilling were used in this Mineral Resource estimate Historical surface holes missing collar information, lithology information, or corresponding radiometric logs, i.e., assay data, were excluded.
• In the SLR QP's opinion, the drill hole logging and sampling procedures meet industry standards and are adequate for Mineral Resource estimation. The SLR QP is not aware of any drilling, sampling, or recovery factors that could materially impact the accuracy and reliability of the results.
• Mineral Resources have been classified in accordance with the definitions for Mineral Resources in S-K 1300, which are consistent with Canadian Institute of Mining, Metallurgy and Petroleum (CIM) Definition Standards for Mineral Resources and Mineral Reserves dated May 10, 2014 (CIM, 2014) definitions which are incorporated by reference in NI 43-101.
• In the SLR QP's opinion, the assumptions, parameters, and methodology used for the Bullfrog Mineral Resource estimate is appropriate for the style of mineralization and mining methods.
• The SLR QP considers the estimation procedures employed at Bullfrog, including compositing, top-cutting, variography, block model construction, and interpolation to be reasonable and in line with industry standard practice.
• The SLR QP is of the opinion the block models are adequate for public disclosure and to support mining activities. The effective date of the Mineral Resource estimate is December 31, 2024.
• The SLR QP considers that the knowledge of the deposit setting, lithologies, structural controls on mineralization, and the mineralization style and setting, is sufficient to support the MRE to the level of classification assigned.
• The SLR QP considers that the resource cut-off grade and mining shapes used to identify those portions of the Mineral Resource that meet the requirement for the reasonable prospects for economic extraction to be appropriate for this style of uranium deposit and mineralization.
25.2 Mining and Mineral Reserves
• There are no current Mineral Reserves at the Project.
| 25-1 | |
| Energy Fuels Inc. | Bullfrog Project | May 9, 2025 |
| Technical Report | SLR Project No.: 123.V02544.00008 |
• Mineralization is hosted in the relatively flat laying Salt Wash Member of the Westwater formation at depths below the surface of 500 ft to 1,200 ft.
• The Bullfrog Project is composed of the Copper Bench (southeast) and the Indian Bench (northwest) mining areas.
• The mining areas will be accessed by a 13,520-ft long adit decline to the underground mine.
• The mine life comprises a four-year pre-production period and a 15-year active mine life (Base Case) across eight intertwined mining zones (zone 1 through zone 8). The Alternative Case active mine life is 12 years.
• The primary mining methods to employed at Bullfrog will be room and pillar, drift and fill, and split-shot. EFR is acutely aware of the need to keep dilution low given the high cost of transportation and treatment. EFR has many mines with similar geological and mining attributes to Bullfrog. EFR has employed the above-mentioned mining methods at their other underground operations.
• A minimum mining thickness of four feet was applied to two-foot-thick mining blocks.
• Stope dilution was calculated to be 28%.
• An 85% mining recovery was applied to the Mineral Resource mining stopes.
• Groundwater inflow to the mine workings is expected to be between 20 gallons per minute (gpm) to 50 gpm; further hydrogeological modelling and analysis is required to confirm this. The SLR QP has accounted for dewatering wells for depressurization of the mine workings in the capital and operating costs.
• The Base Case mine plan includes 1.8 million tons (Mton) at an average grade of 0.28% eU3O8, containing 9.7 million pounds (Mlb) of eU3O8. Approximately 20% of the tonnage included in the Base Case is categorized as Inferred Resources. The Alternative Case, which comprises Indicated Resources only, includes 1.5 Mton at an average grade of 0.27 eU3O8, containing 7.7 Mlb of eU3O8.
• It is envisioned that Bullfrog will supply approximately 10,000 tons of mineralized material a month (120,000 tons per year (tpa)) to EFR's White Mesa Mill located six miles south of Blanding, Utah, approximately 127 miles south of the Bullfrog mine. The White Mesa Mill is the only active, operating uranium mill in the United States.
25.3 Mineral Processing
• The Bullfrog mineralized material will be toll milled at the existing White Mesa Mill in Utah. Mineralized material will be transported by haul trucks to the White Mesa Mill.
• The Mill has been in operation since 1981 and is equipped with the required equipment using a proven process for the production of uranium oxide (U3O8) product, called "yellowcake". In addition, although it is not part of the production schedule in this Technical Report, the Mill also has the capacity to produce vanadium pentoxide (V2O5).
• Mill operations can receive run-of-mine (ROM) material from the Bullfrog Project and various other EFR mines. Material will be dumped from trucks onto a mineralized material pad at the Mill and stockpiled by type to be blended as needed. Material will be weighed, sampled, and probed for uranium grade. The mineralized material pad area has an approximate capacity of 450,000 tons.
| 25-2 | |
| Energy Fuels Inc. | Bullfrog Project | May 9, 2025 |
| Technical Report | SLR Project No.: 123.V02544.00008 |
• The Mill utilizes agitated hot acid leach and solvent extraction to recover uranium. Historical metallurgical tests and Mill production records on similar mineralized material confirm this processing method will recover 95% of the contained uranium.
• The Mill has historically run on a campaign basis and processes uranium bearing materials as they become available.
25.4 Infrastructure
• The Project will have diesel-generated electric power for the underground operation, ventilation fans, surface infrastructure, and dewatering wells.
• Water for the Project will be supplied from dewatering wells, which are needed to depressurize the underground mine.
• The primary surface infrastructure buildings and areas that are required to efficiently operate the Bullfrog mine include the following:
o Underground mine equipment maintenance shop
o Equipment wash bay
o Warehouse facilities
o Mine dry for the workers,
o Offices
o Emergency Medical Services (EMS) facilities
o Guard shack and parking
o Water treatment plant and evaporation ponds
o Fuel depot
o Waste storage facilities
o Ore stockpile area
o Explosive storage facilities
o Underground communications
o Dewatering wells
o Ventilation shafts and fans
o Electrical generators, substation, and site distribution powerlines
o Project access road and site roads
o Fencing
25.5 Environment
• EFR has a comprehensive understanding of regulatory requirements, permits, authorizations, and the applicable agencies for each. They have initiated select environmental baseline gathering for select disciplines to comply with these requirements.
• The environmental baseline studies that have been performed for the Project area were established between 2014 and 2016 to support permitting. This baseline serves as an excellent benchmark for documenting existing site conditions (and changes that have occurred since) and can be used to assess success of proposed reclamation practices.
• The Project is in a regulatory jurisdiction that has recent experience in permitting similar project activities.
| 25-3 | |
| Energy Fuels Inc. | Bullfrog Project | May 9, 2025 |
| Technical Report | SLR Project No.: 123.V02544.00008 |
25.6 Capital and Operating Costs
The initial direct capital cost estimate is estimated to be US$36 million. Indirect costs and Owner's costs are estimated to total 20% of direct costs. The contingency has been estimated at 25% of direct, indirect, and Owner's costs. Total initial capital costs over the four year pre-production period are estimated to be US$55 million.
The initial capital cost estimate has an accuracy of +50% / -50%.
Sustaining capital costs are estimated to be US$38 million. Permitting and closure costs are estimated to be US$4 million.
The average life of mine operating costs is estimated to be US$307.63 per ton milled.
| 25-4 | |
| Energy Fuels Inc. | Bullfrog Project | May 9, 2025 |
| Technical Report | SLR Project No.: 123.V02544.00008 |
26.0 Recommendations
SLR has proposed a two-phase exploration program with a total budget of approximately US$2,203,000 to advance the Project, beginning in 2025 (Table 26-1). Phase 2 is contingent on the successful completion of Phase 1.
Table 26-1: Proposed Energy Fuels 2025 Budget - Bullfrog Project
| Category | Budget (US$) |
| Phase 1 | |
| Surface Delineation Drilling | 418,500 |
| Downhole Radiometrics | 279,000 |
| Update Mineral Resource Estimate | 60,000 |
| Phase 1 Subtotal | 757,500 |
| Contingency (10%) | 75,750 |
| Phase 1 Total | 833,250 |
| Phase 2 | |
| Engineering Studies | 307,500 |
| Geotechnical Holes | 232,500 |
| Hydrogeology Study | 75,000 |
| Mine Zone Developmental Drilling | 248,000 |
| Environmental Studies | 250,000 |
| Prepare PFS | 440,000 |
| Update Mine Plan | 20,000 |
| Investigate Alternative Mining Methods | 20,000 |
| PFS | 400,000 |
| Phase 2 Subtotal | 1,245,500 |
| Contingency (10%) | 124,550 |
| Phase 2 Total | 1,370,050 |
| Sub-Total Phase 1 + Phase 2 | 2,003,000 |
| Contingency (10%) | 200,300 |
| Total Phase 1 + Phase 2 | 2,203,300 |
The objectives of the exploration program are summarized below.
26.1 Geology and Mineral Resources
The SLR QP offers the following recommendations related to the geology and Mineral Resources aspects of the Project:
| 26-1 | |
| Energy Fuels Inc. | Bullfrog Project | May 9, 2025 |
| Technical Report | SLR Project No.: 123.V02544.00008 |
26.1.1 Phase 1: Development Drilling Program
1 Conduct a 20 to 30 drill hole development drilling program aiming to upgrade Inferred Resources to Indicated Resource and verify historical reported equilibrium values. Average depth per hole is projected to be approximately 930 ft.
2 Utilize Prompt Fission Neutron (PFN) drill hole geophysical logging as an alternative to collecting core to save costs on equilibrium analysis. PFN logging has proven to be a reliable methodology for equilibrium analysis and has a strong performance record on similar uranium deposits in the USA.
3 Update the Mineral Resource estimate for the Project using Deswik Stope Optimizer (Deswik.SO) shape optimization.
The SLR QP estimated costs per drill foot is US$25/ft, which includes the equilibrium analysis costs using the PFN tool.
26.1.2 Phase 2: Updated Resource Estimate and Pre-Feasibility Study
1 Following the Phase 1 drilling and Mineral Resource update, complete a Prefeasibility Study (PFS) of the Project.
26.2 Mining and Mineral Reserves
1 As part of a PFS, conduct the necessary work to estimate Mineral Reserves. The following tasks, included in the work program budget, will need to be part of the PFS.
o Conduct development drilling of the first mining zones to be encountered.
o Conduct drilling and analysis of geotechnical holes in the first mining zones to be encountered and along the decline route to support ground control design.
o Conduct a hydrology study to quantify the amount of mine depressurization and dewatering needed for the Project.
o Update the mine plan designs and schedule, including equipment and site service requirements to support the target production rates.
2 Investigate the alternative mining methods, like the use of roadheaders in soft ground.
26.3 Mineral Processing
1 Continue the White Mesa Mill intermittent operations with maintenance program.
2 Evaluate historical operating data to determine possible flowsheet improvements or modifications to improve the mill production rate/economics and make these changes before commencing production.
3 Conduct bench tests on the Bullfrog mineralized material to define process parameters.
26.4 Infrastructure
1 Design and estimate costs for a surface infrastructure to support future mining activities, including Project access road, surface facilities, water treatment plant, settling ponds, and evaporation ponds.
| 26-2 | |
| Energy Fuels Inc. | Bullfrog Project | May 9, 2025 |
| Technical Report | SLR Project No.: 123.V02544.00008 |
26.5 Environment
26.5.1 Hydrology
1 Given the absence of site-specific boring logs, monitoring wells, and data on transmissivity and storage, install wells to improve understanding of the groundwater system beneath the proposed Project site. Pumping tests should also be conducted to determine extraction rates, as well as the transmissivity and storage coefficient of the Navajo Sandstone aquifer near the production wells.
2 Using site-specific boring logs and permeability data, develop 3D geologic models, followed by numerical models, to verify the water budget of the Navajo Sandstone and assess its hydraulic connectivity, both laterally and vertically, with adjacent formations. Mine inflow estimates for the underground workings should be confirmed through the groundwater monitoring program, incorporating seepage water collection and the numerical modeling process for the Project.
26.5.2 Baseline Studies, Permits, Reclamation.
1 Review and document the previous environmental baseline studies, supplement or update these studies as required for current and anticipated permitting efforts, and document changes in the baseline since initial permitting efforts.
2 Complete additional studies for the socio-economic impacts, air quality, and meteorology.
3 Track (and where appropriate participate in) new legislation that may have impact(s) on permitting and environmental requirements for the Project.
4 As Permits are applied for and secured, begin development of an environmental management system that captures and describes environmental plans and requirements.
5 Even though opportunity may be limited, look for opportunities for concurrent reclamation to minimize financial obligation(s) during mining and at closure.
6 Once construction is complete, stabilize new disturbances with mulch, surface armoring and/or and vegetation to minimize erosion.
7 Develop revegetation test plots to finalize reclamation seed mix(es).
26.6 Capital and Operating Costs
1 For the next phase of study, complete detailed capital cost estimates based on PFS-level designs.
| 26-3 | |
| Energy Fuels Inc. | Bullfrog Project | May 9, 2025 |
| Technical Report | SLR Project No.: 123.V02544.00008 |
27.0 References
Agnerian, H., and Roscoe, W.E., 2003, The Contour Method of Estimating Mineral Resources, Roscoe Pestle Associates, Inc. paper, 9 pp.
Atlas Minerals Corp., 1991, Bullfrog Project - (Sales Prospectus), Copy #13, March.
Bhatt, B.J., 1983, Final report on the magnitude and variability of uranium disequilibrium based on the mined ore buggy sampling data, Tony M Mine, Shootaring Canyon, Garfield County, Utah, Plateau Resources Ltd., Grand Junction, Colorado.
Blanchard, P.J., 1986. Ground-Water Conditions in the Lake Powell Area, Utah Department of Natural Resources Technical Publication No. 84.
Canadian Institute of Mining, Metallurgy and Petroleum (CIM), 2014, CIM Definition Standards for Mineral Resources and Mineral Reserves, adopted by the CIM Council on May 10, 2014.
Carpenter, 1980, Elemental, isotopic and mineralogic distributions within a tabular-type sandstone uranium-vanadium deposit, Henry Mountains mineral belt, Garfield County, Utah, Unpub. M. Sc. thesis, Colorado School of Mines, Golden, Colorado, 156 pp.
CIM. 2019. CIM Estimation of Mineral Resources & Mineral Reserves Best Practice Guidelines, adopted by the CIM Council on November 29, 2019.
Consumers Power Company, 1982, Annual Report.
Doelling, H.H. and Willis, G. C., 2018, Interim Geologic Map of the Escalante 30' x 60' Quadrangle, Garfield and Kane Counties, Utah, Utah Geological Survey Open-File Report 690DM, 17 pp.
Doelling, H.H., 1967, Uranium deposits of Garfield County, Utah, Utah Geological Survey, Special Studies 22.
Electronic Code of Federal Regulations, Title 17: Commodity and Securities Exchanges, Chapter II, Part 229 Standard Instructions for Filing Forms Under Securities Act of 1933, Securities Exchange Act of 1934 and Energy Policy and Conservation Act of 1975- Regulation S-K. (https://www.ecfr.gov/cgi-bin/text-idx?amp;node=17:3.0.1.1.11&rgn=div5#se17.3.229_11303)
Energy Fuels Nuclear Inc., 1991, Revised geologic review and economic analysis of Atlas Minerals' Bullfrog Property, Garfield County, Utah, Memo to G.W. Grandey et al., from R.N. Schafer & D.M. Pillmore, March 27.
Energy Fuels Nuclear Inc., 1993a, Bullfrog mine ore reserve access alternatives and production feasibility analysis (Revised 4/15/93), Memo to M.D. Vincelette from R.B. Smith & J.F. Stubblefield, April 15.
Energy Fuels Nuclear Inc., 1993b, Bullfrog Uranium Resources, memo to I.W. Mathisen, Jr., from R.W. Schafer, September 24.
Energy Fuels Nuclear Inc., 1994, Bullfrog Deposit, memo to T.C. Pool from J.T. Cottrell, March 10.
Fischer, R.P., 1968, The uranium and vanadium deposits of the Colorado Plateau Region, in Ore deposits of the United States 1933-1967, Ridge, J.D., AIME, pp.735-746.
| 27-1 | |
| Energy Fuels Inc. | Bullfrog Project | May 9, 2025 |
| Technical Report | SLR Project No.: 123.V02544.00008 |
Gupta, U.K. et al., 1983, Five year plan for the Shootaring Canyon Processing Facility 1984 through 1988, Vol. 1, Summary and Text, Plateau Resources Ltd., September.
Hackman, R. J., and Wyant, D. G., 1973, Geology, structure, and uranium deposits of the Escalante quadrangle, Utah and Arizona: U.S Geological Survey Miscellaneous Investigations Map 1-744, 2 sheets.
Hunt, C.B., Averitt, P., and Miller, R.L., 1953, Geology and geography of the Henry Mountains Region, Utah, U.S. Geological Survey Professional Paper 228, Washington, DC, 224 pp.
IsoEnergy. 2024. IsoEnergy Announces Acquisition of Anfield, Securing Expanded Near-Term U.S. Uranium Production and the Shootaring Canyon Mill. News Release by IsoEnergy Ltd. dated October 2, 2024.
LaPoint, D.J., 1978, Sampling Procedures for Chemical Analysis of Core, Plateau Resources Ltd., July 13, 1978.
LASR Geo Consulting, 2008. Spring and Seep Survey of the S1/2 of Copper Creek Benches and N1/2 of Lost Spring Quadrangles. Prepared for Denison Mines (USA) Corp. July 21, 2008.
Milne & Associates, 1990, Optimization study of the Southwest, Copper Bench, and Indian Bench Deposits, Garfield County, Utah, report prepared for Atlas Precious Metals, Sparks, Nevada, signed by Steve Milne, Registered Professional Engineer, AZ, December 6.
Mine Reserves Associates, Inc., 1990, Mineral Inventory and Mineable Reserves for the Indian Bench Deposit, Garfield County, Utah, Report prepared for Atlas Minerals Corp., Lakewood, Colorado, December 3.
Mower, W. R. Reconnaissance Appraisal of the Hydrology of the Bullfrog Project Area, Garfield County, Utah. November 28, 1980.
Northrup, H.R. and Goldhaber, M.T., (Editors), 1990, Genesis of the Tabular-Type Vanadium-Uranium deposits of the Henry Mountains Basin, Utah, Economic Geology, v. 85, No. 2, March-April, pp. 215-269.
Northrup, H.R., 1982, Origin of the tabular-type vanadium-uranium deposits in the Henry Structural Basin, Utah, Ph. D. Thesis, T-2614, Colorado School of Mines, Golden, Colorado, 340 pp.
Nuclear Assurance Corp., 1989, Geologic analysis of uranium and vanadium ore reserves in the Tony M orebody, Garfield County, Utah, Report No. NAC-C-89023, prepared for Nuclear Fuel Services, Inc., Norcross, Georgia, August 31, filed of record in the Garfield County Courthouse, September 19, 1989 as a Subscribed and Sworn Affidavit of Work performed by Douglas Underhill.
Parsons Behle & Latimer, 2022, Mining Claim Status Report - Bullfrog Mine, Garfield County, Utah, letter report to Energy Fuels Resources (USA) Inc., February 7, 2022, 15 pp.
Peterson, F., 1977, Uranium deposits related to depositional environments in the Morrison Formation (Upper Jurassic), Henry Mountains mineral belt of southern Utah: U.S. Geol. Survey Circ. 753, pp. 45-47.
Peterson, F., 1978, Measured sections of the lower member and Salt Wash Member of the Morrison Formation (Upper Jurassic) in the Henry Mountains mineral belt of southern Utah: U.S. Geol. Survey Open-File Rept. 78-1094, 95 pp.
| 27-2 | |
| Energy Fuels Inc. | Bullfrog Project | May 9, 2025 |
| Technical Report | SLR Project No.: 123.V02544.00008 |
Peterson, F., 1980, Sedimentology as a strategy for uranium exploration, in Turner- Peterson, C.E., ed., Uranium in sedimentary rocks: application of the facies concept to exploration: Denver, Soc. Econ. Paleontologists Mineralogists, Rock Mountain Sec., pp. 65-126.
Peterson, Fred, and Pipiringos, G. N., 1979, Stratigraphic relations of the Navajo Sandstone to Middle Jurassic Formations, southern Utah and northern Arizona: U.S. Geological Survey Professional Paper 1035-B, 43 p.
Pincock, Allen & Holt, Inc., 1984a, Minable ore reserve inventory for the Southwest and Copper Bench Deposits, Garfield County, Utah, Tucson, Arizona.
Pincock, Allen & Holt, Inc., 1984b, Mineral inventory for the Tony M deposit, Garfield County, Utah, Tucson, Arizona, November.
Pincock, Allen & Holt, Inc., 1985, Mineable reserve for the Tony M deposit, Garfield County, Utah, PAH Project No. 363.02, Tucson, AZ, signed by Steve Milne, Registered Professional Engineer, Arizona, December 6.
Plateau Resources Ltd., 1981, Summary of the Shootaring Canyon Project, Garfield County, Utah, revised November 1981, Frank M Mine.
Plateau Resources Ltd., 1982, Tony M Kriged Ore Reserve Estimate, Map 7-OR-5, August 23.
Plateau Resources Ltd., 1983, Annual Report to Shareholders, January 26.
Pool, T.C., 2006, Technical Report on the Henry Mountains Complex Uranium Project, Utah, U.S.A., NI 43-101 Technical Report by Scott Wilson Roscoe Postle Associates Inc. for International Uranium Corp., September 9, 2006.
Rajala, J., 1983, Report on Bullfrog Laboratory Studies (conducted by Atlas Minerals), Inter-Office Memo to J.V. Atwood, Atlas Minerals, November 7.
Robinson, J.W. & P.J. McCabe, 1997, Sandstone-Body and Shale-Body Dimensions in a Braided Fluvial System: Salt Wash Sandstone Member (Morrison Formation), Garfield County, Utah, AAPG, v. 81, No. 8 (August 1997), pp. 1267-1291.
Roscoe, W.E and Underhill, D.H., 2009, Technical Report on the Tony M-Southwest Deposit, Henry Mountains Complex Uranium Project, Utah, U.S.A., NI 43-101 Technical Report by Scott Wilson Roscoe Postle Associates Inc. for Denison Mines Corp., March 19, 2009.
Roscoe, W.E., Underhill, D.H, and Pool, T.C., 2012, Technical Report on the Henry Mountains Complex Uranium Property, Utah, U.S.A., NI 43-101 Technical Report by Roscoe Postle Associates Inc. for Energy Fuels Inc., June 27, 2012.
Schafer, R.N., 1991, Bullfrog Evaluation, EFR Memo to I.W. Mathisen, Jr., March 26.
Scott, J.H., 1962: GAMLOG A Computer Program for Interpreting Gamma-Ray Logs; United States Atomic Energy Commission, Grand Junction Office, Production Evaluation Division, Ore Reserves Branch, TM-179, September 1962.
SLR, 2022: Technical Report on the Bullfrog Project, Garfield County, Utah, USA, SLR International Corporation, prepared for Energy Fuels Inc., February 22, 2022, 104 p.
Stokes, W. L., [ed.], 1964, Geologic map of Utah: University of Utah, scale 1:250,000.
Thamm, J.K., Kovschak, A.A. Jr., and Adams, S.S., 1981, Geology and recognition criteria for sandstone uranium deposits of the Salt Wash type, Colorado Plateau province, US. Dept. Energy Final Rept., GJBX-6(81), Grand Junction, CO, 111 pp.
| 27-3 | |
| Energy Fuels Inc. | Bullfrog Project | May 9, 2025 |
| Technical Report | SLR Project No.: 123.V02544.00008 |
Underhill, D.H., 1984, Summary description of the Shootaring Canyon orebodies of Atlas Minerals Company, Plateau Resources Ltd., Grand Junction, Colorado.
Underhill, D.H., et al., 1983, Geology Department 5 Year Plan Support Documents, October 7, Plateau Resources Ltd.
US Securities and Exchange Commission, 2018: Regulation S-K, Subpart 229.1300, Item 1300 Disclosure by Registrants Engaged in Mining Operations, and Item 601 (b)(96) Technical Report Summary.
Wanty, R.B., 1986, Geochemistry of vanadium in an epigenetic sandstone-hosted vanadium-uranium deposit, Henry basin, Utah, Unpub Ph. D. Thesis, Colorado School of Mines, Golden, Colorado, 198 pp.
Wanty, R.B., Goldhaber, M.R., and Northrup, H.R., 1990, Geochemistry of Vanadium in an Epigenetic, Sandstone-hosted Vanadium-Uranium deposit, Henry Basin, Utah, Economic Geology, v. 85, No. 2, March-April, pp. 270-284
Western Water & Land, Inc., 2015. Bullfrog Project Hydrogeologic Report Garfield County, Utah. August 19, 2015.
| 27-4 | |
| Energy Fuels Inc. | Bullfrog Project | May 9, 2025 |
| Technical Report | SLR Project No.: 123.V02544.00008 |
28.0 Date and Signature Date
This report titled "Technical Report, Bullfrog Project, Garfield County, Utah, USA" with an effective date of December 31, 2024 was prepared and signed by the following authors:
| (Signed & Sealed) Stuart Collins | |
| Dated at Lakewood, CO | Stuart Collins, P.E. |
| May 9, 2025 | |
| (Signed & Sealed) Jeffrey L. Woods | |
| Dated at Sparks, NV | Jeffrey L. Woods, MMSA QP |
| May 9, 2025 | |
| (Signed & Sealed) Lee (Pat) Gochnour | |
| Dated at Aberdeen, WA | Lee (Pat) Gochnour, MMSA QP |
| May 9, 2025 | |
| (Signed & Sealed) Mark B. Mathisen | |
| Dated at Lakewood, CO | Mark B. Mathisen, C.P.G. |
| May 9, 2025 | |
| (Signed & Sealed) Grant A. Malensek | |
| Dated at Lakewood, CO | Grant A. Malensek, M.Eng., P.Eng. |
| May 9, 2025 | |
| (Signed & Sealed) Tedros Tesfay | |
| Dated at Lakewood, CO | Tedros Tesfay, Ph.D., SME(RM) |
| May 9, 2025 |
| 28-1 | |
| Energy Fuels Inc. | Bullfrog Project | May 9, 2025 |
| Technical Report | SLR Project No.: 123.V02544.00008 |
29.0 Certificate of Qualified Person
29.1 Grant A. Malensek
I, Grant A. Malensek, M.Eng., P.Eng., as an author of this report entitled "Technical Report, Bullfrog Project, Garfield County, Utah, USA" with an effective date of December 31, 2024 prepared for Energy Fuels Inc., do hereby certify that:
1. I am Technical Director - US Mining Advisory, and Senior Principal Mining Engineer with SLR International Corporation, of Suite 100, 1658 Cole Boulevard, Lakewood, CO, USA 80401.
2. I am a graduate of the University of British Columbia, Canada, in 1987 with a Bachelor of Science degree in Geological Sciences and Colorado School of Mines, USA in 1997 with a Master of Engineering degree in Geological Engineering.
3. I am registered as a Professional Engineer/Geoscientist in the Province of British Columbia (Reg.# 23905). I have worked as a mining engineer for a total of 27 years since my graduation. My relevant experience for the purpose of the Technical Report is:
o Feasibility, prefeasibility, and scoping studies
o Fatal flaw, due diligence, and Independent Engineer reviews for equity and project financings.
o Financial and technical-economic modelling, analysis, budgeting, and forecasting.
o Property and project valuations.
o Capital cost estimates and reviews.
o Mine strategy reviews.
o Options analysis and project evaluations in connection with mergers and acquisitions.
4. I have read the definition of "qualified person" set out in National Instrument 43-101 (NI 43-101) and certify that by reason of my education, affiliation with a professional association (as defined in NI 43-101) and past relevant work experience, I fulfill the requirements to be a "qualified person" for the purposes of NI 43-101.
5. I have not visited the Bullfrog property.
6. I am responsible for Sections 1.2, 22, and 30, and related disclosure in Section 27 of the Technical Report.
7. I am independent of the Issuer applying the test set out in Section 1.5 of NI 43-101.
8. I previously was involved as the project manager for the preparation of "Technical Report for the Bullfrog Project, Garfield County, Utah, USA" with an effective date of December 31, 2021, and dated February 22, 2022.
9. I have read NI 43-101, and the Technical Report has been prepared in compliance with NI 43-101 and Form 43-101F1.
| 29-1 | |
| Energy Fuels Inc. | Bullfrog Project | May 9, 2025 |
| Technical Report | SLR Project No.: 123.V02544.00008 |
10. At the effective date of the Technical Report, to the best of my knowledge, information, and belief, the sections. in the Technical Report for which I am responsible contain all scientific and technical information that is required to be disclosed to make the Technical Report not misleading.
Dated this 9th day of May, 2025,
(Signed) Grant A. Malensek
Grant A. Malensek, P.Eng.
| 29-2 | |
| Energy Fuels Inc. | Bullfrog Project | May 9, 2025 |
| Technical Report | SLR Project No.: 123.V02544.00008 |
29.2 Mark B. Mathisen
I, Mark B. Mathisen, C.P.G., as an author of this report entitled "Technical Report, Bullfrog Project, Garfield County, Utah, USA" with an effective date of December 31, 2024 prepared for Energy Fuels Inc., do hereby certify that:
1. I am Principal Geologist with SLR International Corporation, of Suite 100, 1658 Cole Boulevard, Lakewood, CO, USA 80401.
2. I am a graduate of Colorado School of Mines, Golden, CO, USA in 1984 with a Bachelor of Science degree in Geophysical Engineering.
3. I am a Registered Professional Geologist in the State of Wyoming (Reg.# PG-2821), a Certified Professional Geologist with the American Institute of Professional Geologists (Reg.# CPG-11648), and a Registered Member of SME (Reg.# 04156896). I have worked as a geologist for a total of 28 years since my graduation. My relevant experience for the purpose of the Technical Report is:
• Mineral Resource estimation and preparation of NI 43-101 Technical Reports.
• Director, Project Resources, with Denison Mines Corp., responsible for resource evaluation and reporting for uranium projects in the USA, Canada, Africa, and Mongolia.
• Project Geologist with Energy Fuels Nuclear, Inc., responsible for planning and direction of field activities and project development for an in situ leach uranium project in the USA. Cost analysis software development.
• Design and direction of geophysical programs for US and international base metal and gold exploration joint venture programs.
4. I have read the definition of "qualified person" set out in National Instrument 43-101 (NI 43-101) and certify that by reason of my education, affiliation with a professional association (as defined in NI 43-101) and past relevant work experience, I fulfill the requirements to be a "qualified person" for the purposes of NI 43-101.
5. I most recently visited the Bullfrog Project on July 15 to 18, 2024.
6. I am responsible for Sections 1.1, 1.1.1.1, 1.1.2.1, 1.3.1 to 1.3.6, 1.3.11, 2, 3, 4 excluding 4.3, 5 to 8, 9 excluding 9.1, 10 to 12, 14, 19, 23, 24, 25.1, and 26.1, and related disclosure in Section 27 of the Technical Report.
7. I am independent of the Issuer applying the test set out in Section 1.5 of NI 43-101.
8. I previously authored the "Technical Report for the Bullfrog Project, Garfield County, Utah, USA" with an effective date of December 31, 2021, and dated February 22, 2022.
9. I have read NI 43-101, and the Technical Report has been prepared in compliance with NI 43-101 and Form 43-101F1.
10. At the effective date of the Technical Report, to the best of my knowledge, information, and belief, the sections. in the Technical Report for which I am responsible contain all scientific and technical information that is required to be disclosed to make the Technical Report not misleading.
Dated this 9th day of May, 2025,
/s/ Mark B. Mathisen
Mark B. Mathisen, C.P.G.
| 29-3 | |
| Energy Fuels Inc. | Bullfrog Project | May 9, 2025 |
| Technical Report | SLR Project No.: 123.V02544.00008 |
29.3 Stuart Collins, P.E.
I, Stuart Collins, P.E., as an author of this report entitled "Technical Report, Bullfrog Project, Garfield County, Utah, USA" with an effective date of December 31, 2024 prepared for Energy Fuels Inc., do hereby certify that:
1. I am Principal Mining Engineer with SLR International Corporation, of Suite 100, 1658 Cole Boulevard, Lakewood, CO, USA 80401.
2. I am a graduate of South Dakota School of Mines and Technology, Rapid City, South Dakota, USA, in 1985 with a Bachelor of Science degree in Mining Engineering.
3. I am a Registered Professional Engineer in the state of Colorado (Reg.# 29455). I have been a member of the Society for Mining, Metallurgy, and Exploration (SME) since 1985, and a Registered Member (Reg.# 612514) since September 2006. I have worked as a mining engineer for a total of 36 years since my graduation. My relevant experience for the purpose of the Technical Report is:
• Review and report as a consultant on numerous exploration, development, and production mining projects around the world for due diligence and regulatory requirements.
• Mine engineering, mine management, mine operations and mine financial analyses involving copper, gold, silver, nickel, cobalt, uranium, coal, and base metals, located in the USA, Canada, Mexico, Costa Rica, Argentina, Brazil, Peru, Papua New Guinea, Australia, Mauritania, Liberia, and Turkey.
• Senior positions with consulting and engineering firms and public mining companies.
• Engineering Manager for many mining-related companies.
• Business Development for a small, privately owned mining company in Colorado, USA.
• Operations supervisor at a large gold mine in Nevada, USA.
• Involvement with the development and operation of a small underground gold mine in Arizona, USA.
4. I have read the definition of "qualified person" set out in National Instrument 43-101 (NI 43-101) and certify that by reason of my education, affiliation with a professional association (as defined in NI 43-101) and past relevant work experience, I fulfill the requirements to be a "qualified person" for the purposes of NI 43-101.
5. I visited the Bullfrog Project on July 15 to 18, 2024.
6. I am responsible for Sections 1.1.1.2, 1.1.1.4, 1.1.1.6, 1.1.2.2, 1.1.2.4, 1.1.2.6, 1.3.7, 1.3.8, 1.3.10, 1.3.13, 15, 16, 18, 21, 25.2, 25.4, 25.6, 26.2, 26.4, and 26.6, and share responsibility for Section 27 of the Technical Report.
7. I am independent of the Issuer applying the test set out in Section 1.5 of NI 43-101.
8. I have had no prior involvement with the property that is the subject of the Technical Report.
9. I have read NI 43-101, and the Technical Report has been prepared in compliance with NI 43-101 and Form 43-101F1.
10. At the effective date of the Technical Report, to the best of my knowledge, information, and belief, the sections in the Technical Report for which I am responsible contain all scientific and technical information that is required to be disclosed to make the Technical Report not misleading.
| 29-4 | |
| Energy Fuels Inc. | Bullfrog Project | May 9, 2025 |
| Technical Report | SLR Project No.: 123.V02544.00008 |
Dated this 9th day of May, 2025,
(Signed) Stuart E. Collins
Stuart E. Collins
| 29-5 | |
| Energy Fuels Inc. | Bullfrog Project | May 9, 2025 |
| Technical Report | SLR Project No.: 123.V02544.00008 |
29.4 Jeffrey L. Woods
I, Jeffrey L. Woods, MMSA QP, as an author of this report entitled "Technical Report, Bullfrog Project, Garfield County, Utah, USA" with an effective date of December 31, 2024 prepared for Energy Fuels Inc., do hereby certify that:
1. I am Principal Consulting Metallurgist with Woods Process Services, of 1112 Fuggles Drive, Sparks, Nevada 89441.
2. I am a graduate of Mackay School of Mines, University of Nevada, Reno, Nevada, U.S.A., in 1988 with a B.S. degree in Metallurgical Engineering.
3. I am a member in good standing of Society for Mining, Metallurgy and Exploration, membership #4018591.I have practiced my profession continuously for 35 years since graduation. My relevant experience for the purpose of the Technical Report is:
• Review and report as a consultant on numerous exploration, development, and production mining projects around the world for due diligence and regulatory requirements
• Metallurgical engineering, test work review and development, process operations and metallurgical process analyses, involving copper, gold, silver, nickel, cobalt, uranium, and base metals located in the United States, Canada, Mexico, Honduras, Nicaragua, Chile, Turkey, Cameroon, Peru, Argentina, and Colombia
• Senior Process Engineer for a number of mining-related companies
• Manager and Business Development for a small, privately owned metallurgical testing laboratory in Plano, Texas, USA
• Vice President Process Engineering for at a large copper mining company in Sonora, Mexico
• Global Director Metallurgy and Processing Engineering for a mid-tier international mining company
4. I have read the definition of "qualified person" set out in National Instrument 43-101 (NI 43-101) and certify that by reason of my education, affiliation with a professional association (as defined in NI 43-101) and past relevant work experience, I fulfill the requirements to be a "qualified person" for the purposes of NI 43-101.
5. I have not visited the Bullfrog property.
6. I am responsible for Sections 1.1.1.3, 1.1.2.3, 1.3.9, 13, 17, 25.3, and 26.3 and share responsibility for Section 27 of the Technical Report.
7. I am independent of the Issuer applying the test set out in Section 1.5 of NI 43-101.
8. I have had no prior involvement with the property that is the subject of the Technical Report.
9. I have read NI 43-101, and the Technical Report has been prepared in compliance with NI 43-101 and Form 43-101F1.
| 29-6 | |
| Energy Fuels Inc. | Bullfrog Project | May 9, 2025 |
| Technical Report | SLR Project No.: 123.V02544.00008 |
10. At the effective date of the Technical Report, to the best of my knowledge, information, and belief, the sections in the Technical Report for which I am responsible contain all scientific and technical information that is required to be disclosed to make the Technical Report not misleading.
Dated this 9th day of May, 2025,
(Signed) Jeffrey L. Woods
Jeffrey L. Woods
| 29-7 | |
| Energy Fuels Inc. | Bullfrog Project | May 9, 2025 |
| Technical Report | SLR Project No.: 123.V02544.00008 |
29.5 Lee (Pat) Gochnour
I, Lee (Pat) Gochour, MMSA QP (#01160), as an author of this report entitled "Technical Report, Bullfrog Project, Garfield County, Utah, USA" with an effective date of December 31, 2024 prepared for Energy Fuels Inc., do hereby certify that:
1. I am Associate Principal Environmental Specialist, and Principal of Gochnour & Associates, Inc. of 915 Fairway Lane, Aberdeen, Washington, 98520.
2. I am a graduate of Eastern Washington University in 1981 with a B.A. in Park Administration and Land Use Planning.
3. I am a member in good standing of Mining and Metallurgical Society of America. I have practiced my profession continuously for 43 years since graduation. My relevant experience for the purpose of the Technical Report is:
o Vice President of Environmental Services for Pincock, Allen & Holt
o Corporate Environmental Manager for St. Joe Minerals, Bond International Gold, LAC Minerals and MinVen Gold Corporation
o Environmental audits, permitting programs, developing Plan of Operations and EA/EIS, alternative siting studies, reclamation planning, environmental contingency planning, remediation and environmental litigation support
o Environmental and permitting feasibility support for project financing for domestic and international projects and clients
4. I have read the definition of "qualified person" set out in National Instrument 43-101 (NI 43-101) and certify that by reason of my education, affiliation with a professional association (as defined in NI 43-101) and past relevant work experience, I fulfill the requirements to be a "qualified person" for the purposes of NI 43-101.
5. I have not visited the Bullfrog Property.
6. I am responsible for Section 1.1.1.5, 1.1.2.5, 1.3.12, 4.3, 20, 25.5, and 26.5.1, and contributions to Section 27 of the Technical Report.
7. I am independent of the Issuer applying the test set out in Section 1.5 of NI 43-101.
8. I have had no prior involvement with the property that is the subject of the Technical Report.
9. I have read NI 43-101, and the Technical Report has been prepared in compliance with NI 43-101 and Form 43-101F1.
10. At the effective date of the Technical Report, to the best of my knowledge, information, and belief, the sections in the Technical Report for which I am responsible contain all scientific and technical information that is required to be disclosed to make the Technical Report not misleading.
Dated this 9th day of May, 2025,
(Signed & Sealed) Lee (Pat) Gochnour
Lee (Pat) Gochnour, MMSA QP
| 29-8 | |
| Energy Fuels Inc. | Bullfrog Project | May 9, 2025 |
| Technical Report | SLR Project No.: 123.V02544.00008 |
29.6 Tedros Tesfay
I, Tedros Tesfay, Ph.D., SME [RM], as an author of this report entitled "Technical Report, Bullfrog Project, Garfield County, Utah, USA" with an effective date of December 31, 2024 prepared for Energy Fuels Inc., do hereby certify that:
1. I am Senior Hydrogeologist with SLR International Corporation, 1658 Cole Blvd, Suite 10Lakewood, CO 80401.
2. I am a graduate of University of North Dakota, Grand Forks, ND in 2006 with a Ph. D.
3. I am registered as a Registered Member (Society for Mining, Metallurgy & Exploration Inc. (SME), ID # 04322808). I have worked as a mining hydrogeologist for a total of 16 years since my graduation. My relevant experience for the purpose of the Technical Report is:
• Hydrogeological investigation in mining and other sectors.
• Geological modeling
• Numerical modeling
• Geochemical characterizations
• Mine impact assessments
• Dewatering systems
4. I have read the definition of "qualified person" set out in National Instrument 43-101 (NI 43-101) and certify that by reason of my education, affiliation with a professional association (as defined in NI 43-101) and past relevant work experience, I fulfill the requirements to be a "qualified person" for the purposes of NI 43-101.
5. I have not visited the Project.
6. I am responsible for Section 9.1 and related disclosure in Section 1.1.2.5, 26.5.2, and related disclosure in Section 27 of the Technical Report.
7. I am independent of the Issuer, Energy Fuels Inc, and the Bullfrog Project applying the test set out in Section 1.5 of NI 43-101.
8. I have had no prior involvement with the property that is the subject of the Technical Report.
9. I have read NI 43-101, and the Technical Report has been prepared in compliance with NI 43-101 and Form 43-101F1.
10. At the effective date of the Technical Report, to the best of my knowledge, information, and belief, the sections in the Technical Report for which I am responsible contain all scientific and technical information that is required to be disclosed to make the Technical Report not misleading.
Dated this 9th day of May, 2025,
(Signed) Tedros Tesfay
Tedros Tesfay, Ph.D., SME [RM]
| 29-9 | |
| Energy Fuels Inc. | Bullfrog Project | May 9, 2025 |
| Technical Report | SLR Project No.: 123.V02544.00008 |
30.0 Appendix
| 30-1 | |
| Energy Fuels Inc. | Bullfrog Project | May 9, 2025 |
| Technical Report | SLR Project No.: 123.V02544.00008 |
Table 30-1: Base Case After-Tax Cash Flow Summary
| Economic Model Annual Summary | ||||||||||||||||||||||||||||||||||||||||||||||||||||||||||||||||||||
 |
Company | Energy Fuels Resources (USA) Inc. | ||||||||||||||||||||||||||||||||||||||||||||||||||||||||||||||||||
| Project Name | Bullfrog | |||||||||||||||||||||||||||||||||||||||||||||||||||||||||||||||||||
| Scenario Name | Base Case (Measured, Indicated, and Inferred) | |||||||||||||||||||||||||||||||||||||||||||||||||||||||||||||||||||
| Analysis Type | S-K 1300 Initial Assessment | |||||||||||||||||||||||||||||||||||||||||||||||||||||||||||||||||||
| Project Timeline in Years | 1 | 2 | 3 | 4 | 5 | 6 | 7 | 8 | 9 | 10 | 11 | 12 | 13 | 14 | 15 | 16 | 17 | 18 | 19 | 20 | 21 | |||||||||||||||||||||||||||||||||||||||||||||||
| Commercial Production Timeline in Years | -4 | -3 | -2 | -1 | 1 | 2 | 3 | 4 | 5 | 6 | 7 | 8 | 9 | 10 | 11 | 12 | 13 | 14 | 15 | 16 | 17 | |||||||||||||||||||||||||||||||||||||||||||||||
| Time Until Closure In Years | US$ & Imperial Units | LoM Avg / Total | 19 | 18 | 17 | 16 | 15 | 14 | 13 | 12 | 11 | 10 | 9 | 8 | 7 | 6 | 5 | 4 | 3 | 2 | 1 | |||||||||||||||||||||||||||||||||||||||||||||||
| Market Prices | ||||||||||||||||||||||||||||||||||||||||||||||||||||||||||||||||||||
| U3O8 | US$/lb | $90 | 90 | 90 | 90 | 90 | 90 | 90 | 90 | 90 | 90 | 90 | 90 | 90 | 90 | 90 | 90 | 90 | 90 | 90 | 90 | |||||||||||||||||||||||||||||||||||||||||||||||
| Physicals | ||||||||||||||||||||||||||||||||||||||||||||||||||||||||||||||||||||
| Total Mill Feed Mined (21% Inferred) | kt | 1,800 | - | - | - | - | 120 | 120 | 120 | 120 | 120 | 120 | 120 | 120 | 120 | 120 | 120 | 120 | 120 | 120 | 120 | |||||||||||||||||||||||||||||||||||||||||||||||
| Total Waste Mined | kt | 679 | - | - | - | 51 | 51 | 51 | 49 | 43 | 41 | 40 | 40 | 39 | 44 | 46 | 46 | 45 | 55 | 39 | ||||||||||||||||||||||||||||||||||||||||||||||||
| Total Material Mined | kt | 2,479 | - | - | - | - | 171 | 171 | 171 | 169 | 163 | 161 | 160 | 160 | 159 | 164 | 166 | 166 | 165 | 175 | 159 | |||||||||||||||||||||||||||||||||||||||||||||||
| Total Mill Feed Processed | kt | 1,765 | - | - | - | - | 120 | 120 | 120 | 120 | 120 | 120 | 120 | 120 | 120 | 120 | 120 | 120 | 120 | 120 | 85 | |||||||||||||||||||||||||||||||||||||||||||||||
| Head Grade, U3O8 | % | 0.28 | - | - | - | - | 0.26% | 0.26% | 0.26% | 0.28% | 0.26% | 0.25% | 0.28% | 0.28% | 0.30% | 0.28% | 0.27% | 0.27% | 0.32% | 0.27% | 0.27% | |||||||||||||||||||||||||||||||||||||||||||||||
| Contained U3O8 | klb | 9,711 | - | - | - | - | 624 | 624 | 624 | 661 | 625 | 599 | 673 | 673 | 720 | 682 | 659 | 659 | 767 | 660 | 461 | |||||||||||||||||||||||||||||||||||||||||||||||
| Average Recovery | % | 95.0% | -- | -- | -- | -- | 95.0% | 95.0% | 95.0% | 95.0% | 95.0% | 95.0% | 95.0% | 95.0% | 95.0% | 95.0% | 95.0% | 95.0% | 95.0% | 95.0% | 95.0% | |||||||||||||||||||||||||||||||||||||||||||||||
| Recovered U3O8 | klb | 9,226 | - | - | - | - | 593 | 593 | 593 | 628 | 594 | 569 | 639 | 639 | 684 | 648 | 626 | 626 | 728 | 627 | 438 | |||||||||||||||||||||||||||||||||||||||||||||||
| U3O8 Sales | klb | 9,226 | - | - | - | - | 593 | 593 | 593 | 628 | 594 | 569 | 639 | 639 | 684 | 648 | 626 | 626 | 728 | 627 | 438 | |||||||||||||||||||||||||||||||||||||||||||||||
| Cash Flow | ||||||||||||||||||||||||||||||||||||||||||||||||||||||||||||||||||||
| Gross Revenue | $000s | 830,312 | - | - | - | - | 53,390 | 53,390 | 53,390 | 56,540 | 53,428 | 51,206 | 57,512 | 57,512 | 61,538 | 58,314 | 56,332 | 56,332 | 65,541 | 56,430 | 39,457 | |||||||||||||||||||||||||||||||||||||||||||||||
| Mining & Development Costs | $135.05 | $000s | (238,394 | ) | - | - | - | - | (16,650 | ) | (16,650 | ) | (16,650 | ) | (16,488 | ) | (15,891 | ) | (15,748 | ) | (15,562 | ) | (15,562 | ) | (15,520 | ) | (15,995 | ) | (16,195 | ) | (16,195 | ) | (16,125 | ) | (17,030 | ) | (12,136 | ) | ||||||||||||||||||||||||||||||
| Mill Feed Transport Cost | $29.85 | $000s | (52,681 | ) | - | - | - | - | (3,581 | ) | (3,581 | ) | (3,581 | ) | (3,581 | ) | (3,581 | ) | (3,581 | ) | (3,581 | ) | (3,581 | ) | (3,581 | ) | (3,581 | ) | (3,581 | ) | (3,581 | ) | (3,581 | ) | (3,581 | ) | (2,542 | ) | ||||||||||||||||||||||||||||||
| Processing | $110.00 | $000s | (194,168 | ) | - | - | - | - | (13,200 | ) | (13,200 | ) | (13,200 | ) | (13,200 | ) | (13,200 | ) | (13,200 | ) | (13,200 | ) | (13,200 | ) | (13,200 | ) | (13,200 | ) | (13,200 | ) | (13,200 | ) | (13,200 | ) | (13,200 | ) | (9,368 | ) | ||||||||||||||||||||||||||||||
| Surface Facility Maintenance | $0.00 | $000s | - | - | - | - | - | |||||||||||||||||||||||||||||||||||||||||||||||||||||||||||||
| G&A | $32.73 | $000s | (57,774 | ) | - | - | - | - | (3,928 | ) | (3,928 | ) | (3,928 | ) | (3,928 | ) | (3,928 | ) | (3,928 | ) | (3,928 | ) | (3,928 | ) | (3,928 | ) | (3,928 | ) | (3,928 | ) | (3,928 | ) | (3,928 | ) | (3,928 | ) | (2,782 | ) | ||||||||||||||||||||||||||||||
| Subtotal Site Operating Costs | $307.63 | $000s | (543,018 | ) | - | - | - | - | (37,359 | ) | (37,359 | ) | (37,359 | ) | (37,197 | ) | (36,600 | ) | (36,457 | ) | (36,271 | ) | (36,271 | ) | (36,230 | ) | (36,704 | ) | (36,904 | ) | (36,904 | ) | (36,834 | ) | (37,739 | ) | (26,828 | ) | ||||||||||||||||||||||||||||||
| Product Transport to Market | $0.00 | $000s | - | - | - | - | - | |||||||||||||||||||||||||||||||||||||||||||||||||||||||||||||
| Royalties | $0.00 | $000s | - | - | - | - | - | - | - | - | - | - | - | - | - | - | - | - | - | - | - | - | ||||||||||||||||||||||||||||||||||||||||||||||
| Severance Tax | $11.45 | $000s | (20,218 | ) | - | - | - | - | (1,295 | ) | (1,295 | ) | (1,295 | ) | (1,377 | ) | (1,296 | ) | (1,238 | ) | (1,402 | ) | (1,402 | ) | (1,507 | ) | (1,423 | ) | (1,372 | ) | (1,372 | ) | (1,611 | ) | (1,374 | ) | (960 | ) | ||||||||||||||||||||||||||||||
| Total Cash Costs | $319.08 | $000s | (563,236 | ) | - | - | - | - | (38,654 | ) | (38,654 | ) | (38,654 | ) | (38,574 | ) | (37,896 | ) | (37,695 | ) | (37,673 | ) | (37,673 | ) | (37,736 | ) | (38,127 | ) | (38,276 | ) | (38,276 | ) | (38,445 | ) | (39,113 | ) | (27,788 | ) | ||||||||||||||||||||||||||||||
| Operating Margin | $000s | 267,075 | - | - | - | - | 14,736 | 14,736 | 14,736 | 17,966 | 15,531 | 13,511 | 19,839 | 19,839 | 23,802 | 20,187 | 18,056 | 18,056 | 27,096 | 17,316 | 11,669 | |||||||||||||||||||||||||||||||||||||||||||||||
| EBITDA | $000s | 267,075 | - | - | - | - | 14,736 | 14,736 | 14,736 | 17,966 | 15,531 | 13,511 | 19,839 | 19,839 | 23,802 | 20,187 | 18,056 | 18,056 | 27,096 | 17,316 | 11,669 | |||||||||||||||||||||||||||||||||||||||||||||||
| Depreciation/Amortization Allowance | $000s | (92,910 | ) | - | - | - | - | (4,056 | ) | (4,346 | ) | (4,091 | ) | (4,611 | ) | (4,673 | ) | (4,872 | ) | (5,669 | ) | (6,325 | ) | (7,270 | ) | (6,951 | ) | (7,059 | ) | (7,812 | ) | (9,296 | ) | (8,964 | ) | (6,916 | ) | |||||||||||||||||||||||||||||||
| Depletion Allowances | $000s | (87,083 | ) | - | - | - | - | (5,340 | ) | (5,195 | ) | (5,322 | ) | (6,678 | ) | (5,429 | ) | (4,320 | ) | (7,085 | ) | (6,757 | ) | (8,266 | ) | (6,618 | ) | (5,499 | ) | (5,122 | ) | (8,900 | ) | (4,176 | ) | (2,377 | ) | |||||||||||||||||||||||||||||||
| Earnings Before Taxes | $000s | 87,083 | - | - | - | - | 5,340 | 5,195 | 5,322 | 6,678 | 5,429 | 4,320 | 7,085 | 6,757 | 8,266 | 6,618 | 5,499 | 5,122 | 8,900 | 4,176 | 2,377 | |||||||||||||||||||||||||||||||||||||||||||||||
| State/Fed Corp Income Taxes | $000s | (22,206 | ) | - | - | - | - | (1,362 | ) | (1,325 | ) | (1,357 | ) | (1,703 | ) | (1,384 | ) | (1,101 | ) | (1,807 | ) | (1,723 | ) | (2,108 | ) | (1,688 | ) | (1,402 | ) | (1,306 | ) | (2,269 | ) | (1,065 | ) | (606 | ) | |||||||||||||||||||||||||||||||
| Net Income | $000s | 64,877 | - | - | - | - | 3,978 | 3,870 | 3,965 | 4,975 | 4,045 | 3,218 | 5,278 | 5,034 | 6,158 | 4,930 | 4,096 | 3,816 | 6,630 | 3,111 | 1,771 | |||||||||||||||||||||||||||||||||||||||||||||||
| Non-Cash Add Back - Depreciation/Amortization | $000s | 92,910 | - | - | - | - | 4,056 | 4,346 | 4,091 | 4,611 | 4,673 | 4,872 | 5,669 | 6,325 | 7,270 | 6,951 | 7,059 | 7,812 | 9,296 | 8,964 | 6,916 | |||||||||||||||||||||||||||||||||||||||||||||||
| Non-Cash Add Back - Depletion | $000s | 87,083 | - | - | - | - | 5,340 | 5,195 | 5,322 | 6,678 | 5,429 | 4,320 | 7,085 | 6,757 | 8,266 | 6,618 | 5,499 | 5,122 | 8,900 | 4,176 | 2,377 | |||||||||||||||||||||||||||||||||||||||||||||||
| Working Capital | $000s | - | - | - | - | - | (4,287 | ) | - | - | - | - | - | - | - | - | - | - | - | - | - | - | - | 4,287 | ||||||||||||||||||||||||||||||||||||||||||||
| Operating Cash Flow | $000s | 244,869 | - | - | - | - | 9,087 | 13,411 | 13,379 | 16,263 | 14,147 | 12,410 | 18,032 | 18,116 | 21,694 | 18,499 | 16,654 | 16,750 | 24,826 | 16,251 | 11,063 | - | 4,287 | |||||||||||||||||||||||||||||||||||||||||||||
| Development Capital | ||||||||||||||||||||||||||||||||||||||||||||||||||||||||||||||||||||
| Underground Mine | $000s | (29,478 | ) | (11,788 | ) | (6,496 | ) | (7,513 | ) | (3,681 | ) | - | ||||||||||||||||||||||||||||||||||||||||||||||||||||||||
| Mill | $000s | - | ||||||||||||||||||||||||||||||||||||||||||||||||||||||||||||||||||
| Surface Infrastructure | $000s | (4,399 | ) | (2,513 | ) | (808 | ) | (660 | ) | (418 | ) | - | - | - | - | - | - | |||||||||||||||||||||||||||||||||||||||||||||||||||
| Surface Mine, Water Treatment Plant, Powerline Indirects | $000s | (2,566 | ) | (346 | ) | (252 | ) | (1,779 | ) | (189 | ) | - | - | - | - | - | - | |||||||||||||||||||||||||||||||||||||||||||||||||||
| Owner's Costs and Contingency | 50.0% | $000s | (18,221 | ) | (7,323 | ) | (3,778 | ) | (4,976 | ) | (2,144 | ) | - | - | - | - | - | - | ||||||||||||||||||||||||||||||||||||||||||||||||||
| Development Capital | $000s | (54,664 | ) | (21,970 | ) | (11,335 | ) | (14,928 | ) | (6,431 | ) | - | - | - | - | - | - | - | - | - | - | - | - | - | - | - | ||||||||||||||||||||||||||||||||||||||||||
| Exploration | $000s | - | ||||||||||||||||||||||||||||||||||||||||||||||||||||||||||||||||||
| Sustaining Capital | $000s | (38,256 | ) | - | - | - | - | (4,209 | ) | (4,218 | ) | (765 | ) | (3,297 | ) | (3,632 | ) | (4,301 | ) | (1,739 | ) | (5,150 | ) | (3,219 | ) | (351 | ) | (1,677 | ) | (2,908 | ) | (510 | ) | (1,632 | ) | (648 | ) | |||||||||||||||||||||||||||||||
| Closure/Reclamation | $000s | (4,322 | ) | (732 | ) | (378 | ) | (498 | ) | (214 | ) | - | - | - | - | - | - | - | - | - | - | - | - | - | - | - | (1,000 | ) | (1,500 | ) | ||||||||||||||||||||||||||||||||||||||
| Total Capital | $000s | (97,242 | ) | (22,702 | ) | (11,712 | ) | (15,426 | ) | (6,646 | ) | (4,209 | ) | (4,218 | ) | (765 | ) | (3,297 | ) | (3,632 | ) | (4,301 | ) | (1,739 | ) | (5,150 | ) | (3,219 | ) | (351 | ) | (1,677 | ) | (2,908 | ) | (510 | ) | (1,632 | ) | (648 | ) | (1,000 | ) | (1,500 | ) | |||||||||||||||||||||||
| Cash Flow Adj./Reimbursements | $000s | - | - | - | - | - | - | - | - | - | - | - | - | - | - | - | - | - | - | - | - | |||||||||||||||||||||||||||||||||||||||||||||||
| 30-2 | |
| Energy Fuels Inc. | Bullfrog Project | May 9, 2025 |
| Technical Report | SLR Project No.: 123.V02544.00008 |
| Economic Model Annual Summary | ||||||||||||||||||||||||||||||||||||||||||||||||||||||||||||||||||||
 |
Company | Energy Fuels Resources (USA) Inc. | ||||||||||||||||||||||||||||||||||||||||||||||||||||||||||||||||||
| Project Name | Bullfrog | |||||||||||||||||||||||||||||||||||||||||||||||||||||||||||||||||||
| Scenario Name | Base Case (Measured, Indicated, and Inferred) | |||||||||||||||||||||||||||||||||||||||||||||||||||||||||||||||||||
| Analysis Type | S-K 1300 Initial Assessment | |||||||||||||||||||||||||||||||||||||||||||||||||||||||||||||||||||
| Project Timeline in Years | 1 | 2 | 3 | 4 | 5 | 6 | 7 | 8 | 9 | 10 | 11 | 12 | 13 | 14 | 15 | 16 | 17 | 18 | 19 | 20 | 21 | |||||||||||||||||||||||||||||||||||||||||||||||
| Commercial Production Timeline in Years | -4 | -3 | -2 | -1 | 1 | 2 | 3 | 4 | 5 | 6 | 7 | 8 | 9 | 10 | 11 | 12 | 13 | 14 | 15 | 16 | 17 | |||||||||||||||||||||||||||||||||||||||||||||||
| Time Until Closure In Years | US$ & Imperial Units | LoM Avg / Total | 19 | 18 | 17 | 16 | 15 | 14 | 13 | 12 | 11 | 10 | 9 | 8 | 7 | 6 | 5 | 4 | 3 | 2 | 1 | |||||||||||||||||||||||||||||||||||||||||||||||
| LoM Metrics | ||||||||||||||||||||||||||||||||||||||||||||||||||||||||||||||||||||
| Economic Metrics | ||||||||||||||||||||||||||||||||||||||||||||||||||||||||||||||||||||
| Discount Rate | BOP | 5% | 0.9524 | 0.9070 | 0.8638 | 0.8227 | 0.7835 | 0.7462 | 0.7107 | 0.6768 | 0.6446 | 0.6139 | 0.5847 | 0.5568 | 0.5303 | 0.5051 | 0.4810 | 0.4581 | 0.4363 | 0.4155 | 0.3957 | 0.3769 | 0.3589 | |||||||||||||||||||||||||||||||||||||||||||||
| Discount Rate | BOP | 8% | 0.9259 | 0.8573 | 0.7938 | 0.7350 | 0.6806 | 0.6302 | 0.5835 | 0.5403 | 0.5002 | 0.4632 | 0.4289 | 0.3971 | 0.3677 | 0.3405 | 0.3152 | 0.2919 | 0.2703 | 0.2502 | 0.2317 | 0.2145 | 0.1987 | |||||||||||||||||||||||||||||||||||||||||||||
| a) Pre-Tax | ||||||||||||||||||||||||||||||||||||||||||||||||||||||||||||||||||||
| Free Cash Flow | $000s | 169,834 | (22,702 | ) | (11,712 | ) | (15,426 | ) | (6,646 | ) | 6,240 | 10,517 | 13,971 | 14,669 | 11,899 | 9,210 | 18,100 | 14,688 | 20,583 | 19,836 | 16,379 | 15,148 | 26,586 | 15,685 | 11,021 | (1,000 | ) | 2,787 | ||||||||||||||||||||||||||||||||||||||||
| Cumulative Free Cash Flow | $000s | (22,702 | ) | (34,415 | ) | (49,840 | ) | (56,486 | ) | (50,246 | ) | (39,729 | ) | (25,758 | ) | (11,089 | ) | 810 | 10,020 | 28,120 | 42,809 | 63,392 | 83,227 | 99,607 | 114,755 | 141,341 | 157,025 | 168,047 | 167,047 | 169,834 | ||||||||||||||||||||||||||||||||||||||
| NPV @ 5% | $000s | 72,497 | (21,621 | ) | (10,623 | ) | (13,325 | ) | (5,468 | ) | 4,889 | 7,848 | 9,929 | 9,929 | 7,670 | 5,654 | 10,583 | 8,179 | 10,916 | 10,018 | 7,879 | 6,940 | 11,599 | 6,517 | 4,362 | (377 | ) | 1,000 | ||||||||||||||||||||||||||||||||||||||||
| NPV @ 8% | $000s | 40,483 | (21,021 | ) | (10,041 | ) | (12,245 | ) | (4,885 | ) | 4,247 | 6,628 | 8,152 | 7,925 | 5,952 | 4,266 | 7,763 | 5,833 | 7,568 | 6,753 | 5,163 | 4,422 | 7,185 | 3,925 | 2,554 | (215 | ) | 554 | ||||||||||||||||||||||||||||||||||||||||
| IRR | % | 15.6% | ||||||||||||||||||||||||||||||||||||||||||||||||||||||||||||||||||
| Profitability Index (NPV/PW Capex) | NPV/PWcapex | 1.0 | 20,924 | 10,281 | 12,895 | 5,291 | 3,297 | 3,148 | 544 | 2,232 | 2,342 | 2,640 | 1,017 | 2,868 | 1,707 | 177 | 807 | 1,332 | 222 | 678 | 256 | - | - | |||||||||||||||||||||||||||||||||||||||||||||
| b) After-Tax | ||||||||||||||||||||||||||||||||||||||||||||||||||||||||||||||||||||
| Free Cash Flow | $000s | 147,628 | (22,702 | ) | (11,712 | ) | (15,426 | ) | (6,646 | ) | 4,879 | 9,193 | 12,614 | 12,966 | 10,514 | 8,109 | 16,293 | 12,965 | 18,475 | 18,148 | 14,977 | 13,842 | 24,316 | 14,620 | 10,415 | (1,000 | ) | 2,787 | ||||||||||||||||||||||||||||||||||||||||
| Cumulative Free Cash Flow | $000s | (22,702 | ) | (34,415 | ) | (49,840 | ) | (56,486 | ) | (51,608 | ) | (42,415 | ) | (29,801 | ) | (16,835 | ) | (6,321 | ) | 1,788 | 18,081 | 31,047 | 49,522 | 67,670 | 82,647 | 96,489 | 120,806 | 135,425 | 145,840 | 144,840 | 147,628 | |||||||||||||||||||||||||||||||||||||
| NPV @ 5% | $000s | 59,825 | (21,621 | ) | (10,623 | ) | (13,325 | ) | (5,468 | ) | 3,822 | 6,860 | 8,964 | 8,776 | 6,778 | 4,978 | 9,526 | 7,220 | 9,798 | 9,166 | 7,204 | 6,341 | 10,609 | 6,075 | 4,122 | (377 | ) | 1,000 | ||||||||||||||||||||||||||||||||||||||||
| NPV @ 8% | $000s | 31,155 | (21,021 | ) | (10,041 | ) | (12,245 | ) | (4,885 | ) | 3,320 | 5,793 | 7,360 | 7,005 | 5,260 | 3,756 | 6,988 | 5,149 | 6,793 | 6,179 | 4,721 | 4,040 | 6,572 | 3,659 | 2,413 | (215 | ) | 554 | ||||||||||||||||||||||||||||||||||||||||
| IRR | % | 14.0% | ||||||||||||||||||||||||||||||||||||||||||||||||||||||||||||||||||
| Undiscounted Payback from Start of Comm. Prod. | Years | 5.8 | - | - | - | - | - | - | - | - | - | 5.8 | 5.8 | 5.8 | 5.8 | 5.8 | 5.8 | 5.8 | 5.8 | 5.8 | 5.8 | 5.8 | 5.8 | |||||||||||||||||||||||||||||||||||||||||||||
| Operating Metrics | ||||||||||||||||||||||||||||||||||||||||||||||||||||||||||||||||||||
| Mine Life | Years | 15 | ||||||||||||||||||||||||||||||||||||||||||||||||||||||||||||||||||
| Average Daily Processing Rate | tpd placed | 340 | - | - | - | - | 343 | 343 | 343 | 343 | 343 | 343 | 343 | 343 | 343 | 343 | 343 | 343 | 343 | 343 | 243 | |||||||||||||||||||||||||||||||||||||||||||||||
| UG Mining Cost | $ / t milled | $135.05 | - | - | - | - | 138.75 | 138.75 | 138.75 | 137.40 | 132.43 | 131.23 | 129.68 | 129.68 | 129.33 | 133.29 | 134.96 | 134.96 | 134.37 | 141.91 | 142.50 | |||||||||||||||||||||||||||||||||||||||||||||||
| Mill Feed Transport Cost | $ / t milled | $29.85 | - | - | - | - | 29.85 | 29.85 | 29.85 | 29.85 | 29.85 | 29.85 | 29.85 | 29.85 | 29.85 | 29.85 | 29.85 | 29.85 | 29.85 | 29.85 | 29.85 | |||||||||||||||||||||||||||||||||||||||||||||||
| Processing Cost | $ / t milled | $110.00 | - | - | - | - | 110.00 | 110.00 | 110.00 | 110.00 | 110.00 | 110.00 | 110.00 | 110.00 | 110.00 | 110.00 | 110.00 | 110.00 | 110.00 | 110.00 | 110.00 | |||||||||||||||||||||||||||||||||||||||||||||||
| G&A Cost | $ / t milled | $32.73 | - | - | - | - | 32.73 | 32.73 | 32.73 | 32.73 | 32.73 | 32.73 | 32.73 | 32.73 | 32.73 | 32.73 | 32.73 | 32.73 | 32.73 | 32.73 | 32.66 | |||||||||||||||||||||||||||||||||||||||||||||||
| Total Site Operating Costs | $ / t milled | $307.63 | - | - | - | - | 311.33 | 311.33 | 311.33 | 309.98 | 305.00 | 303.81 | 302.26 | 302.26 | 301.91 | 305.87 | 307.53 | 307.53 | 306.95 | 314.49 | 315.01 | |||||||||||||||||||||||||||||||||||||||||||||||
| Product Transport to Market | $ / t milled | $0.00 | - | - | - | - | - | - | - | - | - | - | - | - | - | - | - | - | - | - | - | |||||||||||||||||||||||||||||||||||||||||||||||
| Royalties | $ / t milled | $0.00 | - | - | - | - | - | - | - | - | - | - | - | - | - | - | - | - | - | - | - | |||||||||||||||||||||||||||||||||||||||||||||||
| Severance Tax | $ / t milled | $11.45 | - | - | - | - | 10.79 | 10.79 | 10.79 | 11.47 | 10.80 | 10.32 | 11.68 | 11.68 | 12.56 | 11.86 | 11.43 | 11.43 | 13.42 | 11.45 | 11.27 | |||||||||||||||||||||||||||||||||||||||||||||||
| Total Operating Costs | $ / t milled | $319.08 | - | - | - | - | 322.12 | 322.12 | 322.12 | 321.45 | 315.80 | 314.13 | 313.94 | 313.94 | 314.47 | 317.73 | 318.96 | 318.96 | 320.38 | 325.94 | 326.28 | |||||||||||||||||||||||||||||||||||||||||||||||
| Sales Metrics | ||||||||||||||||||||||||||||||||||||||||||||||||||||||||||||||||||||
| U3O8 Sales | klb | 9,226 | - | - | - | - | 593 | 593 | 593 | 628 | 594 | 569 | 639 | 639 | 684 | 648 | 626 | 626 | 728 | 627 | 438 | |||||||||||||||||||||||||||||||||||||||||||||||
| Total Cash Cost | $ / lb U3O8 | 61.05 | - | - | - | - | 65.16 | 65.16 | 65.16 | 61.40 | 63.84 | 66.25 | 58.95 | 58.95 | 55.19 | 58.84 | 61.15 | 61.15 | 52.79 | 62.38 | 63.38 | |||||||||||||||||||||||||||||||||||||||||||||||
| Total AISC | $ / lb U3O8 | 65.67 | - | - | - | - | 72.25 | 72.27 | 66.45 | 66.65 | 69.96 | 73.81 | 61.68 | 67.01 | 59.90 | 59.39 | 63.83 | 65.80 | 53.49 | 64.98 | 64.86 | |||||||||||||||||||||||||||||||||||||||||||||||
| Avg. ROM Annual U3O8 Sales | klb/yr | 728 | ||||||||||||||||||||||||||||||||||||||||||||||||||||||||||||||||||
| 30-3 | |
| Energy Fuels Inc. | Bullfrog Project | May 9, 2025 |
| Technical Report | SLR Project No.: 123.V02544.00008 |
Table 30-2: Alternative Case After-Tax Cash Flow Summary
| Economic Model Annual Summary | ||||||||||||||||||||||||||||||||||||||||||||||||||||||||||||||||||||
 |
Company | Energy Fuels Resources (USA) Inc. | ||||||||||||||||||||||||||||||||||||||||||||||||||||||||||||||||||
| Project Name | Bullfrog | |||||||||||||||||||||||||||||||||||||||||||||||||||||||||||||||||||
| Scenario Name | Alternative Case ((Indicated Only) | |||||||||||||||||||||||||||||||||||||||||||||||||||||||||||||||||||
| Analysis Type | S-K1300 Initial Assessment | |||||||||||||||||||||||||||||||||||||||||||||||||||||||||||||||||||
| Project Timeline in Years | 1 | 2 | 3 | 4 | 5 | 6 | 7 | 8 | 9 | 10 | 11 | 12 | 13 | 14 | 15 | 16 | 17 | 18 | 19 | 20 | 21 | |||||||||||||||||||||||||||||||||||||||||||||||
| Commercial Production Timeline in Years | -4 | -3 | -2 | -1 | 1 | 2 | 3 | 4 | 5 | 6 | 7 | 8 | 9 | 10 | 11 | 12 | 13 | 14 | 15 | 16 | 17 | |||||||||||||||||||||||||||||||||||||||||||||||
| Time Until Closure In Years | US$ & Imperial Units | LoM Avg / Total | 16 | 15 | 14 | 13 | 12 | 11 | 10 | 9 | 8 | 7 | 6 | 5 | 4 | 3 | 2 | 1 | -1 | -2 | -3 | |||||||||||||||||||||||||||||||||||||||||||||||
| Market Prices | ||||||||||||||||||||||||||||||||||||||||||||||||||||||||||||||||||||
| U3O8 | US$/lb | $90 | 90 | 90 | 90 | 90 | 90 | 90 | 90 | 90 | 90 | 90 | 90 | 90 | 90 | 90 | 90 | 90 | 90 | 90 | 90 | |||||||||||||||||||||||||||||||||||||||||||||||
| Physicals | ||||||||||||||||||||||||||||||||||||||||||||||||||||||||||||||||||||
| Total Mill Feed Mined | kt | 1,440 | - | - | - | - | 120 | 120 | 120 | 120 | 120 | 120 | 120 | 120 | 120 | 120 | 120 | 120 | - | - | - | |||||||||||||||||||||||||||||||||||||||||||||||
| Total Waste Mined | kt | 532 | - | - | - | - | 51 | 51 | 51 | 49 | 43 | 41 | 40 | 40 | 39 | 44 | 46 | 38 | - | - | - | |||||||||||||||||||||||||||||||||||||||||||||||
| Total Material Mined | kt | 1,972 | - | - | - | - | 171 | 171 | 171 | 169 | 163 | 161 | 160 | 160 | 159 | 164 | 166 | 158 | - | - | - | |||||||||||||||||||||||||||||||||||||||||||||||
| Total Mill Feed Processed | kt | 1,419 | - | - | - | - | 120 | 120 | 120 | 120 | 120 | 120 | 120 | 120 | 120 | 120 | 120 | 99 | - | - | - | |||||||||||||||||||||||||||||||||||||||||||||||
| Head Grade, U3O8 | % | 0.27 | - | - | - | - | 0.26% | 0.26% | 0.26% | 0.28% | 0.26% | 0.25% | 0.28% | 0.28% | 0.30% | 0.28% | 0.27% | 0.27% | 0.00% | 0.00% | 0.00% | |||||||||||||||||||||||||||||||||||||||||||||||
| Contained U3O8 | klb | 7,709 | - | - | - | - | 624 | 624 | 624 | 661 | 625 | 599 | 673 | 673 | 720 | 682 | 659 | 545 | - | - | - | |||||||||||||||||||||||||||||||||||||||||||||||
| Average Recovery | % | 95.0% | -- | -- | -- | -- | 95.0% | 95.0% | 95.0% | 95.0% | 95.0% | 95.0% | 95.0% | 95.0% | 95.0% | 95.0% | 95.0% | 95.0% | 95.0% | 95.0% | 95.0% | |||||||||||||||||||||||||||||||||||||||||||||||
| Recovered U3O8 | klb | 7,324 | - | - | - | - | 593 | 593 | 593 | 628 | 594 | 569 | 639 | 639 | 684 | 648 | 626 | 518 | - | - | - | |||||||||||||||||||||||||||||||||||||||||||||||
| U3O8 Sales | klb | 7,324 | - | - | - | - | 593 | 593 | 593 | 628 | 594 | 569 | 639 | 639 | 684 | 648 | 626 | 518 | - | - | - | |||||||||||||||||||||||||||||||||||||||||||||||
| CashFlow | ||||||||||||||||||||||||||||||||||||||||||||||||||||||||||||||||||||
| Gross Revenue | $000s | 659,151 | - | - | - | - | 53,390 | 53,390 | 53,390 | 56,540 | 53,428 | 51,206 | 57,512 | 57,512 | 61,538 | 58,314 | 56,332 | 46,599 | - | - | - | |||||||||||||||||||||||||||||||||||||||||||||||
| Mining & Development Costs | $134.09 | $000s | (190,305 | ) | - | - | - | - | (16,650 | ) | (16,650 | ) | (16,650 | ) | (16,488 | ) | (15,891 | ) | (15,748 | ) | (15,562 | ) | (15,562 | ) | (15,520 | ) | (15,995 | ) | (16,195 | ) | (13,397 | ) | - | - | - | |||||||||||||||||||||||||||||||||
| MillFeed Transport Cost | $29.85 | $000s | (42,358 | ) | - | - | - | - | (3,581 | ) | (3,581 | ) | (3,581 | ) | (3,581 | ) | (3,581 | ) | (3,581 | ) | (3,581 | ) | (3,581 | ) | (3,581 | ) | (3,581 | ) | (3,581 | ) | (2,963 | ) | - | - | - | |||||||||||||||||||||||||||||||||
| Processing | $110.00 | $000s | (156,119 | ) | - | - | - | - | (13,200 | ) | (13,200 | ) | (13,200 | ) | (13,200 | ) | (13,200 | ) | (13,200 | ) | (13,200 | ) | (13,200 | ) | (13,200 | ) | (13,200 | ) | (13,200 | ) | (10,919 | ) | - | - | - | |||||||||||||||||||||||||||||||||
| Surface Facility Maintenance | $0.00 | $000s | - | - | - | - | - | |||||||||||||||||||||||||||||||||||||||||||||||||||||||||||||
| G&A | $33.21 | $000s | (47,136 | ) | - | - | - | - | (3,928 | ) | (3,928 | ) | (3,928 | ) | (3,928 | ) | (3,928 | ) | (3,928 | ) | (3,928 | ) | (3,928 | ) | (3,928 | ) | (3,928 | ) | (3,928 | ) | (3,928 | ) | - | - | - | |||||||||||||||||||||||||||||||||
| Subtotal Site Operating Costs | $307.14 | $000s | (435,918 | ) | - | - | - | - | (37,359 | ) | (37,359 | ) | (37,359 | ) | (37,197 | ) | (36,600 | ) | (36,457 | ) | (36,271 | ) | (36,271 | ) | (36,230 | ) | (36,704 | ) | (36,904 | ) | (31,207 | ) | - | - | - | |||||||||||||||||||||||||||||||||
| Product Transport to Market | $0.00 | $000s | - | - | - | - | - | |||||||||||||||||||||||||||||||||||||||||||||||||||||||||||||
| Royalties | $0.00 | $000s | - | - | - | - | - | - | - | - | - | - | - | - | - | - | - | - | - | - | - | - | ||||||||||||||||||||||||||||||||||||||||||||||
| Severance Tax | $11.30 | $000s | (16,037 | ) | - | - | - | - | (1,295 | ) | (1,295 | ) | (1,295 | ) | (1,377 | ) | (1,296 | ) | (1,238 | ) | (1,402 | ) | (1,402 | ) | (1,507 | ) | (1,423 | ) | (1,372 | ) | (1,135 | ) | - | - | - | |||||||||||||||||||||||||||||||||
| Total Cash Costs | $318.44 | $000s | (451,955 | ) | - | - | - | - | (38,654 | ) | (38,654 | ) | (38,654 | ) | (38,574 | ) | (37,896 | ) | (37,695 | ) | (37,673 | ) | (37,673 | ) | (37,736 | ) | (38,127 | ) | (38,276 | ) | (32,341 | ) | - | - | - | |||||||||||||||||||||||||||||||||
| Operating Margin | $000s | 207,196 | - | - | - | - | 14,736 | 14,736 | 14,736 | 17,966 | 15,531 | 13,511 | 19,839 | 19,839 | 23,802 | 20,187 | 18,056 | 14,258 | - | - | - | |||||||||||||||||||||||||||||||||||||||||||||||
| EBITDA | $000s | 207,196 | - | - | - | - | 14,736 | 14,736 | 14,736 | 17,966 | 15,531 | 13,511 | 19,839 | 19,839 | 23,802 | 20,187 | 18,056 | 14,258 | - | - | - | |||||||||||||||||||||||||||||||||||||||||||||||
| Depreciation/Amortization Allowance | $000s | (90,120 | ) | - | - | - | - | (5,109 | ) | (5,481 | ) | (5,147 | ) | (5,825 | ) | (5,943 | ) | (6,262 | ) | (7,329 | ) | (8,386 | ) | (9,862 | ) | (9,472 | ) | (10,068 | ) | (11,237 | ) | - | - | - | ||||||||||||||||||||||||||||||||||
| Depletion Allowances | $000s | (58,538 | ) | - | - | - | - | (4,813 | ) | (4,627 | ) | (4,794 | ) | (6,071 | ) | (4,794 | ) | (3,625 | ) | (6,255 | ) | (5,726 | ) | (6,970 | ) | (5,357 | ) | (3,994 | ) | (1,511 | ) | - | - | - | ||||||||||||||||||||||||||||||||||
| Earnings Before Taxes | $000s | 58,538 | - | - | - | - | 4,813 | 4,627 | 4,794 | 6,071 | 4,794 | 3,625 | 6,255 | 5,726 | 6,970 | 5,357 | 3,994 | 1,511 | - | - | - | |||||||||||||||||||||||||||||||||||||||||||||||
| State/Fed Corp Income Taxes | $000s | (14,927 | ) | - | - | - | - | (1,227 | ) | (1,180 | ) | (1,223 | ) | (1,548 | ) | (1,223 | ) | (924 | ) | (1,595 | ) | (1,460 | ) | (1,777 | ) | (1,366 | ) | (1,019 | ) | (385 | ) | - | - | - | ||||||||||||||||||||||||||||||||||
| Net Income | $000s | 43,611 | - | - | - | - | 3,586 | 3,447 | 3,572 | 4,523 | 3,572 | 2,700 | 4,660 | 4,266 | 5,193 | 3,991 | 2,976 | 1,125 | - | - | - | |||||||||||||||||||||||||||||||||||||||||||||||
| Non-Cash Add Back - Depreciation/Amortization | $000s | 90,120 | - | - | - | - | 5,109 | 5,481 | 5,147 | 5,825 | 5,943 | 6,262 | 7,329 | 8,386 | 9,862 | 9,472 | 10,068 | 11,237 | - | - | - | |||||||||||||||||||||||||||||||||||||||||||||||
| Non-Cash Add Back - Depletion | $000s | 58,538 | - | - | - | - | 4,813 | 4,627 | 4,794 | 6,071 | 4,794 | 3,625 | 6,255 | 5,726 | 6,970 | 5,357 | 3,994 | 1,511 | - | - | - | |||||||||||||||||||||||||||||||||||||||||||||||
| Working Capital | $000s | - | - | - | - | - | (4,287 | ) | - | - | - | - | - | - | - | - | - | - | - | - | 4,287 | - | - | - | ||||||||||||||||||||||||||||||||||||||||||||
| Operating Cash Flow | $000s | 192,269 | - | - | - | - | 9,221 | 13,556 | 13,513 | 16,418 | 14,309 | 12,587 | 18,244 | 18,378 | 22,024 | 18,821 | 17,038 | 13,873 | - | 4,287 | - | - | - | |||||||||||||||||||||||||||||||||||||||||||||
| Development Capital | ||||||||||||||||||||||||||||||||||||||||||||||||||||||||||||||||||||
| Underground Mine | $000s | (29,478 | ) | (11,788 | ) | (6,496 | ) | (7,513 | ) | (3,681 | ) | - | ||||||||||||||||||||||||||||||||||||||||||||||||||||||||
| Mill | $000s | - | ||||||||||||||||||||||||||||||||||||||||||||||||||||||||||||||||||
| Surface Infrastructure | $000s | (4,399 | ) | (2,513 | ) | (808 | ) | (660 | ) | (418 | ) | - | - | - | - | - | - | |||||||||||||||||||||||||||||||||||||||||||||||||||
| Surface Mine, Water Treatment Plant, Powerline Indirects | $000s | (2,566 | ) | (346 | ) | (252 | ) | (1,779 | ) | (189 | ) | - | - | - | - | - | - | |||||||||||||||||||||||||||||||||||||||||||||||||||
| Owner's Costsand Contingency | 50.0% | $000s | (18,221 | ) | (7,323 | ) | (3,778 | ) | (4,976 | ) | (2,144 | ) | - | - | - | - | - | - | ||||||||||||||||||||||||||||||||||||||||||||||||||
| Development Capital | $000s | (54,664 | ) | (21,970 | ) | (11,335 | ) | (14,928 | ) | (6,431 | ) | - | - | - | - | - | - | - | - | - | - | - | - | - | - | - | ||||||||||||||||||||||||||||||||||||||||||
| Exploration | $000s | - | ||||||||||||||||||||||||||||||||||||||||||||||||||||||||||||||||||
| Sustaining Capital | $000s | (35,466 | ) | - | - | - | - | (4,209 | ) | (4,218 | ) | (765 | ) | (3,297 | ) | (3,632 | ) | (4,301 | ) | (1,739 | ) | (5,150 | ) | (3,219 | ) | (351 | ) | (1,677 | ) | (2,908 | ) | - | - | - | ||||||||||||||||||||||||||||||||||
| Closure/Reclamation | $000s | (4,322 | ) | (732 | ) | (378 | ) | (498 | ) | (214 | ) | - | - | - | - | - | - | - | - | - | - | - | - | (1,000 | ) | (1,500 | ) | - | - | - | ||||||||||||||||||||||||||||||||||||||
| Total Capital | $000s | (94,452 | ) | (22,702 | ) | (11,712 | ) | (15,426 | ) | (6,646 | ) | (4,209 | ) | (4,218 | ) | (765 | ) | (3,297 | ) | (3,632 | ) | (4,301 | ) | (1,739 | ) | (5,150 | ) | (3,219 | ) | (351 | ) | (1,677 | ) | (2,908 | ) | (1,000 | ) | (1,500 | ) | - | - | - | ||||||||||||||||||||||||||
| Cash Flow Adj./Reimbursements | $000s | - | - | - | - | - | - | - | - | - | - | - | - | - | - | - | - | - | - | - | - | |||||||||||||||||||||||||||||||||||||||||||||||
| 30-4 | |
| Energy Fuels Inc. | Bullfrog Project | May 9, 2025 |
| Technical Report | SLR Project No.: 123.V02544.00008 |
| Economic Model Annual Summary | ||||||||||||||||||||||||||||||||||||||||||||||||||||||||||||||||||||
 |
Company | Energy Fuels Resources (USA) Inc. | ||||||||||||||||||||||||||||||||||||||||||||||||||||||||||||||||||
| Project Name | Bullfrog | |||||||||||||||||||||||||||||||||||||||||||||||||||||||||||||||||||
| Scenario Name | Alternative Case ((Indicated Only) | |||||||||||||||||||||||||||||||||||||||||||||||||||||||||||||||||||
| Analysis Type | S-K1300 Initial Assessment | |||||||||||||||||||||||||||||||||||||||||||||||||||||||||||||||||||
| Project Timeline in Years | 1 | 2 | 3 | 4 | 5 | 6 | 7 | 8 | 9 | 10 | 11 | 12 | 13 | 14 | 15 | 16 | 17 | 18 | 19 | 20 | 21 | |||||||||||||||||||||||||||||||||||||||||||||||
| Commercial Production Timeline in Years | -4 | -3 | -2 | -1 | 1 | 2 | 3 | 4 | 5 | 6 | 7 | 8 | 9 | 10 | 11 | 12 | 13 | 14 | 15 | 16 | 17 | |||||||||||||||||||||||||||||||||||||||||||||||
| Time Until Closure In Years | US$ & Imperial Units | LoM Avg / Total | 16 | 15 | 14 | 13 | 12 | 11 | 10 | 9 | 8 | 7 | 6 | 5 | 4 | 3 | 2 | 1 | -1 | -2 | -3 | |||||||||||||||||||||||||||||||||||||||||||||||
| LoM Metrics | ||||||||||||||||||||||||||||||||||||||||||||||||||||||||||||||||||||
| Economic Metrics | ||||||||||||||||||||||||||||||||||||||||||||||||||||||||||||||||||||
| Discount Rate | BOP | 5% | 0.9524 | 0.9070 | 0.8638 | 0.8227 | 0.7835 | 0.7462 | 0.7107 | 0.6768 | 0.6446 | 0.6139 | 0.5847 | 0.5568 | 0.5303 | 0.5051 | 0.4810 | 0.4581 | 0.4363 | 0.4155 | 0.3957 | 0.3769 | 0.3589 | |||||||||||||||||||||||||||||||||||||||||||||
| Discount Rate | BOP | 8% | 0.9259 | 0.8573 | 0.7938 | 0.7350 | 0.6806 | 0.6302 | 0.5835 | 0.5403 | 0.5002 | 0.4632 | 0.4289 | 0.3971 | 0.3677 | 0.3405 | 0.3152 | 0.2919 | 0.2703 | 0.2502 | 0.2317 | 0.2145 | 0.1987 | |||||||||||||||||||||||||||||||||||||||||||||
| a)Pre-Tax | ||||||||||||||||||||||||||||||||||||||||||||||||||||||||||||||||||||
| FreeCashFlow | $000s | 112,744 | (22,702 | ) | (11,712 | ) | (15,426 | ) | (6,646 | ) | 6,240 | 10,517 | 13,971 | 14,669 | 11,899 | 9,210 | 18,100 | 14,688 | 20,583 | 19,836 | 16,379 | 11,350 | (1,000 | ) | 2,787 | - | - | - | ||||||||||||||||||||||||||||||||||||||||
| Cumulative Free Cash Flow | $000s | (22,702 | ) | (34,415 | ) | (49,840 | ) | (56,486 | ) | (50,246 | ) | (39,729 | ) | (25,758 | ) | (11,089 | ) | 810 | 10,020 | 28,120 | 42,809 | 63,392 | 83,227 | 99,607 | 110,957 | 109,957 | 112,744 | 112,744 | 112,744 | 112,744 | ||||||||||||||||||||||||||||||||||||||
| NPV @ 5% | $000s | 48,378 | (21,621 | ) | (10,623 | ) | (13,325 | ) | (5,468 | ) | 4,889 | 7,848 | 9,929 | 9,929 | 7,670 | 5,654 | 10,583 | 8,179 | 10,916 | 10,018 | 7,879 | 5,199 | (436 | ) | 1,158 | - | - | - | ||||||||||||||||||||||||||||||||||||||||
| NPV @ 8% | $000s | 25,799 | (21,021 | ) | (10,041 | ) | (12,245 | ) | (4,885 | ) | 4,247 | 6,628 | 8,152 | 7,925 | 5,952 | 4,266 | 7,763 | 5,833 | 7,568 | 6,753 | 5,163 | 3,313 | (270 | ) | 697 | - | - | - | ||||||||||||||||||||||||||||||||||||||||
| IRR | % | 13.9% | ||||||||||||||||||||||||||||||||||||||||||||||||||||||||||||||||||
| Profitability Index (NPV/PW Capex) | NPV/PWcapex | 0.7 | 20,924 | 10,281 | 12,895 | 5,291 | 3,297 | 3,148 | 544 | 2,232 | 2,342 | 2,640 | 1,017 | 2,868 | 1,707 | 177 | 807 | 1,332 | - | - | - | - | - | |||||||||||||||||||||||||||||||||||||||||||||
| b)After-Tax | ||||||||||||||||||||||||||||||||||||||||||||||||||||||||||||||||||||
| Free Cash Flow | $000s | 97,816 | (22,702 | ) | (11,712 | ) | (15,426 | ) | (6,646 | ) | 5,013 | 9,337 | 12,748 | 13,121 | 10,676 | 8,286 | 16,505 | 13,228 | 18,806 | 18,469 | 15,361 | 10,965 | (1,000 | ) | 2,787 | - | - | - | ||||||||||||||||||||||||||||||||||||||||
| Cumulative Free Cash Flow | $000s | (22,702 | ) | (34,415 | ) | (49,840 | ) | (56,486 | ) | (51,473 | ) | (42,136 | ) | (29,388 | ) | (16,267 | ) | (5,590 | ) | 2,696 | 19,201 | 32,429 | 51,235 | 69,704 | 85,065 | 96,029 | 95,029 | 97,816 | 97,816 | 97,816 | 97,816 | |||||||||||||||||||||||||||||||||||||
| NPV @ 5% | $000s | 39,219 | (21,621 | ) | (10,623 | ) | (13,325 | ) | (5,468 | ) | 3,928 | 6,968 | 9,060 | 8,881 | 6,882 | 5,087 | 9,650 | 7,366 | 9,973 | 9,328 | 7,389 | 5,023 | (436 | ) | 1,158 | - | - | - | ||||||||||||||||||||||||||||||||||||||||
| NPV @ 8% | $000s | 18,814 | (21,021 | ) | (10,041 | ) | (12,245 | ) | (4,885 | ) | 3,412 | 5,884 | 7,439 | 7,089 | 5,341 | 3,838 | 7,079 | 5,253 | 6,915 | 6,288 | 4,842 | 3,200 | (270 | ) | 697 | - | - | - | ||||||||||||||||||||||||||||||||||||||||
| IRR | % | 12.4% | ||||||||||||||||||||||||||||||||||||||||||||||||||||||||||||||||||
| Undiscounted Payback from Start of Comm. Prod. | Years | 5.7 | - | - | - | - | - | - | - | - | - | 5.7 | 5.7 | 5.7 | 5.7 | 5.7 | 5.7 | 5.7 | 5.7 | 5.7 | 5.7 | 5.7 | 5.7 | |||||||||||||||||||||||||||||||||||||||||||||
| Operating Metrics | ||||||||||||||||||||||||||||||||||||||||||||||||||||||||||||||||||||
| Mine Life | Years | 12 | ||||||||||||||||||||||||||||||||||||||||||||||||||||||||||||||||||
| Average Daily Processing Rate | tpd placed | 340 | - | - | - | - | 343 | 343 | 343 | 343 | 343 | 343 | 343 | 343 | 343 | 343 | 343 | 284 | - | - | - | |||||||||||||||||||||||||||||||||||||||||||||||
| UG Mining Cost | $ / tmilled | $134.09 | - | - | - | - | 138.75 | 138.75 | 138.75 | 137.40 | 132.43 | 131.23 | 129.68 | 129.68 | 129.33 | 133.29 | 134.96 | 134.96 | - | - | - | |||||||||||||||||||||||||||||||||||||||||||||||
| Mill Feed Transport Cost | $ / tmilled | $29.85 | - | - | - | - | 29.85 | 29.85 | 29.85 | 29.85 | 29.85 | 29.85 | 29.85 | 29.85 | 29.85 | 29.85 | 29.85 | 29.85 | - | - | - | |||||||||||||||||||||||||||||||||||||||||||||||
| Processing Cost | $ / t milled | $110.00 | - | - | - | - | 110.00 | 110.00 | 110.00 | 110.00 | 110.00 | 110.00 | 110.00 | 110.00 | 110.00 | 110.00 | 110.00 | 110.00 | - | - | - | |||||||||||||||||||||||||||||||||||||||||||||||
| G&A Cost | $ / t milled | $33.21 | - | - | - | - | 32.73 | 32.73 | 32.73 | 32.73 | 32.73 | 32.73 | 32.73 | 32.73 | 32.73 | 32.73 | 32.73 | 39.57 | - | - | - | |||||||||||||||||||||||||||||||||||||||||||||||
| Total Site Operating Costs | $ / t milled | $307.14 | - | - | - | - | 311.33 | 311.33 | 311.33 | 309.98 | 305.00 | 303.81 | 302.26 | 302.26 | 301.91 | 305.87 | 307.53 | 314.37 | - | - | - | |||||||||||||||||||||||||||||||||||||||||||||||
| Product Transport to Market | $ / t milled | $0.00 | - | - | - | - | - | - | - | - | - | - | - | - | - | - | - | - | - | - | - | |||||||||||||||||||||||||||||||||||||||||||||||
| Royalties | $ / t milled | $0.00 | - | - | - | - | - | - | - | - | - | - | - | - | - | - | - | - | - | - | - | |||||||||||||||||||||||||||||||||||||||||||||||
| Severance Tax | $ / t milled | $11.30 | - | - | - | - | 10.79 | 10.79 | 10.79 | 11.47 | 10.80 | 10.32 | 11.68 | 11.68 | 12.56 | 11.86 | 11.43 | 11.43 | - | - | - | |||||||||||||||||||||||||||||||||||||||||||||||
| Total Operating Costs | $ / t milled | $318.44 | - | - | - | - | 322.12 | 322.12 | 322.12 | 321.45 | 315.80 | 314.13 | 313.94 | 313.94 | 314.47 | 317.73 | 318.96 | 325.80 | - | - | - | |||||||||||||||||||||||||||||||||||||||||||||||
| Sales Metrics | ||||||||||||||||||||||||||||||||||||||||||||||||||||||||||||||||||||
| U3O8 Sales | klb | 7,324 | - | - | - | - | 593 | 593 | 593 | 628 | 594 | 569 | 639 | 639 | 684 | 648 | 626 | 518 | - | - | - | |||||||||||||||||||||||||||||||||||||||||||||||
| Total Cash Cost | $ / lb U3O8 | 61.71 | - | - | - | - | 65.16 | 65.16 | 65.16 | 61.40 | 63.84 | 66.25 | 58.95 | 58.95 | 55.19 | 58.84 | 61.15 | 62.46 | - | - | - | |||||||||||||||||||||||||||||||||||||||||||||||
| Total AISC | $ / lb U3O8 | 67.14 | - | - | - | - | 72.25 | 72.27 | 66.45 | 66.65 | 69.96 | 73.81 | 61.68 | 67.01 | 59.90 | 59.39 | 63.83 | 68.08 | - | - | - | |||||||||||||||||||||||||||||||||||||||||||||||
| Avg. ROM Annual U3O8 Sales | klb/yr | 610 | ||||||||||||||||||||||||||||||||||||||||||||||||||||||||||||||||||
| 30-5 | |