Shareholder Report
Mar. 31, 2025
USD ($)
$ / shares
WHAT WERE THE FUND COSTS FOR THE LAST SIX MONTHS? (based on a hypothetical $10,000 investment)
|
Fund Name
|
Costs of a $10,000 investment
|
Costs paid as a percentage of a $10,000 investment*
|
|
Amplify AI Powered Equity ETF
|
$37
|
0.75%
|
Visit https://amplifyetfs.com/fund-documents/ for more recent performance information.
KEY FUND STATISTICS (as of March 31, 2025)
|
Net Assets
|
$101,350,823
|
|
Number of Holdings
|
156
|
|
Portfolio Turnover
|
492%
|
|
30-Day SEC Yield
|
0.58%
|
|
30-Day SEC Yield Unsubsidized
|
0.58%
|
|
Top Holdings
|
(%)
|
|
General Motors Co.
|
7.4%
|
|
MicroStrategy, Inc. - Class A
|
7.3%
|
|
AppLovin Corp. - Class A
|
7.1%
|
|
Newmont Corp.
|
4.8%
|
|
Carvana Co.
|
3.9%
|
|
Monolithic Power Systems, Inc.
|
3.7%
|
|
Edison International
|
3.3%
|
|
FMC Corp.
|
3.0%
|
|
Air Lease Corp.
|
2.9%
|
|
Coca-Cola Co.
|
2.8%
|
This report describes changes to the Fund that occurred during the reporting period.
WHAT WERE THE FUND COSTS FOR THE LAST SIX MONTHS? (based on a hypothetical $10,000 investment)
|
Fund Name
|
Costs of a $10,000 investment
|
Costs paid as a percentage of a $10,000 investment*
|
|
Amplify Alternative Harvest ETF
|
$15
|
0.41%
|
Visit https://amplifyetfs.com/fund-documents/ for more recent performance information.
KEY FUND STATISTICS (as of March 31, 2025)
|
Net Assets
|
$112,431,430
|
|
Number of Holdings
|
12
|
|
Portfolio Turnover
|
61%
|
|
30-Day SEC Yield
|
36.56%
|
|
30-Day SEC Yield Unsubsidized
|
36.08%
|
|
Top Holdings
|
(%)
|
|
Amplify Seymour Cannabis ETF
|
53.1%
|
|
First American Government Obligations Fund - Class X
|
32.9%
|
|
Tilray Brands, Inc.
|
14.1%
|
|
SNDL, Inc.
|
8.6%
|
|
Cronos Group, Inc.
|
8.3%
|
|
Aurora Cannabis, Inc.
|
5.6%
|
|
High Tide, Inc.
|
3.2%
|
|
Canopy Growth Corp.
|
3.1%
|
|
Organigram Holdings, Inc.
|
2.1%
|
|
Village Farms International, Inc.
|
1.4%
|
Other Material Fund Changes:
|
•
|
MJ completed a 1-for-12 reverse share split effective February 21, 2025
|
This report describes changes to the Fund that occurred during the reporting period.
WHAT WERE THE FUND COSTS FOR THE LAST SIX MONTHS? (based on a hypothetical $10,000 investment)
|
Fund Name
|
Costs of a $10,000 investment
|
Costs paid as a percentage of a $10,000 investment*
|
|
Amplify BlackSwan Growth & Treasury Core ETF
|
$24
|
0.49%
|
Visit https://amplifyetfs.com/fund-documents/ for more recent performance information.
KEY FUND STATISTICS (as of March 31, 2025)
|
Net Assets
|
$247,869,802
|
|
Number of Holdings
|
14
|
|
Portfolio Turnover
|
25%
|
|
30-Day SEC Yield
|
3.45%
|
|
30-Day SEC Yield Unsubsidized
|
3.45%
|
|
Top Holdings
|
(%)
|
|
United States Treasury Note/Bond
|
9.4%
|
|
United States Treasury Note/Bond
|
9.3%
|
|
United States Treasury Note/Bond
|
9.3%
|
|
United States Treasury Note/Bond
|
9.3%
|
|
United States Treasury Note/Bond
|
9.2%
|
|
United States Treasury Note/Bond
|
9.2%
|
|
United States Treasury Note/Bond
|
9.2%
|
|
United States Treasury Note/Bond
|
9.2%
|
|
United States Treasury Note/Bond
|
9.2%
|
|
United States Treasury Note/Bond
|
9.1%
|
Changes to Fund’s Principal Risks:
The fund will add the below risk to its “Principal Risks” section: FLEX Options Risk. The Fund may utilize FLEX Options issued and guaranteed for settlement by the OCC. The Fund bears the risk that the OCC will be unable or unwilling to perform its obligations under the FLEX Options contracts. In the unlikely event that the OCC becomes insolvent or is otherwise unable to meet its settlement obligations, the Fund could suffer significant losses. Additionally, FLEX Options may be less liquid than certain other securities, such as standardized options. In less liquid markets for the FLEX Options, the Fund may have difficulty closing out certain FLEX Options positions at desired times and prices. In connection with
the creation and redemption of Shares, to the extent market participants are not willing or able to enter into FLEX Option transactions with the Fund at prices that reflect the market price of the Shares, the Fund’s NAV and, in turn the share price of the Fund, could be negatively impacted. The value of the FLEX Options held by the Fund will be determined based on market quotations or other recognized pricing methods. The value of FLEX Options will be affected by, among others, changes in the value of the reference asset, changes in interest rates, changes in the actual and implied volatility of the reference asset and the remaining time to until the FLEX Options expire.
This report describes changes to the Fund that occurred during the reporting period.
WHAT WERE THE FUND COSTS FOR THE LAST SIX MONTHS? (based on a hypothetical $10,000 investment)
|
Fund Name
|
Costs of a $10,000 investment
|
Costs paid as a percentage of a $10,000 investment*
|
|
Amplify BlackSwan ISWN ETF
|
$24
|
0.49%
|
Visit https://amplifyetfs.com/fund-documents/ for more recent performance information.
KEY FUND STATISTICS (as of March 31, 2025)
|
Net Assets
|
$29,979,406
|
|
Number of Holdings
|
13
|
|
Portfolio Turnover
|
18%
|
|
30-Day SEC Yield
|
3.42%
|
|
30-Day SEC Yield Unsubsidized
|
3.42%
|
|
Top Holdings
|
(%)
|
|
United States Treasury Note/Bond
|
9.3%
|
|
United States Treasury Note/Bond
|
9.2%
|
|
United States Treasury Note/Bond
|
9.2%
|
|
United States Treasury Note/Bond
|
9.2%
|
|
United States Treasury Note/Bond
|
9.1%
|
|
United States Treasury Note/Bond
|
9.1%
|
|
United States Treasury Note/Bond
|
9.1%
|
|
United States Treasury Note/Bond
|
9.0%
|
|
United States Treasury Note/Bond
|
9.0%
|
|
United States Treasury Note/Bond
|
9.0%
|
Changes to Fund’s Principal Risks:
The fund will add the below risk to its “Principal Risks” section: FLEX Options Risk. The Fund may utilize FLEX Options issued and guaranteed for settlement by the OCC. The Fund bears the risk that the OCC will be unable or unwilling to perform its obligations under the FLEX Options contracts. In the unlikely event that the OCC becomes insolvent or is otherwise unable to meet its settlement obligations, the Fund could suffer significant losses. Additionally, FLEX Options may be less liquid than certain other securities, such as standardized options. In less liquid markets for the FLEX Options, the Fund may have difficulty closing out certain FLEX Options positions at desired times and prices. In connection with the creation and redemption of Shares, to the extent market participants are not willing or able to enter into FLEX Option
transactions with the Fund at prices that reflect the market price of the Shares, the Fund’s NAV and, in turn the share price of the Fund, could be negatively impacted. The value of the FLEX Options held by the Fund will be determined based on market quotations or other recognized pricing methods. The value of FLEX Options will be affected by, among others, changes in the value of the reference asset, changes in interest rates, changes in the actual and implied volatility of the reference asset and the remaining time to until the FLEX Options expire.
This report describes changes to the Fund that occurred during the reporting period.
WHAT WERE THE FUND COSTS FOR THE LAST SIX MONTHS? (based on a hypothetical $10,000 investment)
|
Fund Name
|
Costs of a $10,000 investment
|
Costs paid as a percentage of a $10,000 investment*
|
|
Amplify Bloomberg AI Value Chain ETF
|
$28
|
0.60%
|
Visit https://amplifyetfs.com/fund-documents/ for more recent performance information.
KEY FUND STATISTICS (as of March 31, 2025)
|
Net Assets
|
$21,445,553
|
|
Number of Holdings
|
47
|
|
Portfolio Turnover
|
105%
|
|
30-Day SEC Yield
|
0.44%
|
|
30-Day SEC Yield Unsubsidized
|
0.44%
|
|
Top Holdings
|
(%)
|
|
Alibaba Group Holding Ltd.
|
4.1%
|
|
International Business Machines Corp.
|
2.9%
|
|
Intel Corp.
|
2.9%
|
|
Samsung Electronics Co. Ltd.
|
2.8%
|
|
SK Hynix, Inc.
|
2.8%
|
|
Super Micro Computer, Inc.
|
2.7%
|
|
First American Government Obligations Fund - Class X
|
2.7%
|
|
Qualcomm, Inc.
|
2.6%
|
|
Micron Technology, Inc.
|
2.5%
|
|
MediaTek, Inc.
|
2.5%
|
Fund Name Change:
Name change to: Amplify Bloomberg AI Value Chain ETF
Fund Ticker Change:
Ticker change to: AIVC
Changes to the Fund’s Investment Objective or Goals:
On August 13, 2024, the Board of Trustees of the Trust approved a change to the Fund’s Investment Objective. On or about October 14, 2024, the Fund’s Investment Objective changed as follows: The Amplify Bloomberg AI Value Chain ETF seeks investment results that generally correlate (before fees and expenses) to the total return performance of the Bloomberg AI Value Chain Index.
Other Material Fund Changes:
|
•
|
Index Provider change to: Bloomberg Index Services Limited. Index change to: Bloomberg AI Value Chain Index
|
|
•
|
Management fee change to: 0.59%
|
This report describes changes to the Fund that occurred during the reporting period.
WHAT WERE THE FUND COSTS FOR THE REPORTING PERIOD? (based on a hypothetical $10,000 investment)
|
Fund Name
|
Costs of a $10,000 investment
|
Costs paid as a percentage of a $10,000 investment*
|
|
Amplify Bloomberg U.S. Treasury 12% Premium Income ETF
|
$13
|
0.30%
|
Visit https://amplifyetfs.com/fund-documents/ for more recent performance information.
KEY FUND STATISTICS (as of March 31, 2025)
|
Net Assets
|
$9,530,872
|
|
Number of Holdings
|
4
|
|
Portfolio Turnover
|
108%
|
|
30-Day SEC Yield
|
4.08%
|
|
30-Day SEC Yield Unsubsidized
|
4.08%
|
|
Top 10 Issuers
|
(%)
|
|
iShares 20+ Year Treasury Bond ETF
|
62.9%
|
|
United States Treasury Note/Bond
|
36.8%
|
|
Invesco Government & Agency Portfolio
|
0.1%
|
Fund Name Change:
Name change to: Amplify Bloomberg U.S. Treasury 12% Premium Income ETF
WHAT WERE THE FUND COSTS FOR THE LAST SIX MONTHS? (based on a hypothetical $10,000 investment)
|
Fund Name
|
Costs of a $10,000 investment
|
Costs paid as a percentage of a $10,000 investment*
|
|
Amplify BlueStar Israel Technology ETF
|
$38
|
0.75%
|
Visit https://amplifyetfs.com/fund-documents/ for more recent performance information.
KEY FUND STATISTICS (as of March 31, 2025)
|
Net Assets
|
$85,572,333
|
|
Number of Holdings
|
57
|
|
Portfolio Turnover
|
9%
|
|
30-Day SEC Yield
|
-0.15%
|
|
30-Day SEC Yield Unsubsidized
|
-0.15%
|
|
Top Holdings
|
(%)
|
|
Check Point Software Technologies, Ltd.
|
9.8%
|
|
CyberArk Software, Ltd.
|
8.5%
|
|
Elbit Systems Ltd.
|
8.2%
|
|
Amdocs, Ltd.
|
7.1%
|
|
Monday.com Ltd.
|
7.0%
|
|
Nice Ltd.
|
6.8%
|
|
Wix.com, Ltd.
|
4.8%
|
|
SentinelOne, Inc. - Class A
|
3.8%
|
|
Nova Ltd.
|
3.1%
|
|
First American Government Obligations Fund - Class X
|
3.1%
|
WHAT WERE THE FUND COSTS FOR THE LAST SIX MONTHS? (based on a hypothetical $10,000 investment)
|
Fund Name
|
Costs of a $10,000 investment
|
Costs paid as a percentage of a $10,000 investment*
|
|
Amplify Cash Flow Dividend Leaders ETF
|
$0
|
0.00%
|
Visit https://amplifyetfs.com/fund-documents/ for more recent performance information.
KEY FUND STATISTICS (as of March 31, 2025)
|
Net Assets
|
$20,831,243
|
|
Number of Holdings
|
61
|
|
Portfolio Turnover
|
86%
|
|
30-Day SEC Yield
|
2.55%
|
|
30-Day SEC Yield Unsubsidized
|
2.16%
|
|
Top Holdings
|
(%)
|
|
HCA Healthcare, Inc.
|
2.7%
|
|
Matador Resources Co.
|
2.6%
|
|
Fidelity National Financial, Inc.
|
2.6%
|
|
eBay, Inc.
|
2.5%
|
|
NRG Energy, Inc.
|
2.5%
|
|
Genpact Ltd.
|
2.5%
|
|
Molson Coors Beverage Co. - Class B
|
2.5%
|
|
CF Industries Holdings, Inc.
|
2.4%
|
|
Owens Corning
|
2.4%
|
|
FedEx Corp.
|
2.4%
|
This report describes changes to the Fund that occurred during the reporting period.
WHAT WERE THE FUND COSTS FOR THE LAST SIX MONTHS? (based on a hypothetical $10,000 investment)
|
Fund Name
|
Costs of a $10,000 investment
|
Costs paid as a percentage of a $10,000 investment*
|
|
Amplify COWS Covered Call ETF
|
$32
|
0.65%
|
Visit https://amplifyetfs.com/fund-documents/ for more recent performance information.
KEY FUND STATISTICS (as of March 31, 2025)
|
Net Assets
|
$10,020,838
|
|
Number of Holdings
|
121
|
|
Portfolio Turnover
|
225%
|
|
30-Day SEC Yield
|
1.95%
|
|
30-Day SEC Yield Unsubsidized
|
1.95%
|
|
Top Holdings
|
(%)
|
|
HCA Healthcare, Inc.
|
2.7%
|
|
Matador Resources Co.
|
2.6%
|
|
Fidelity National Financial, Inc.
|
2.6%
|
|
eBay, Inc.
|
2.6%
|
|
NRG Energy, Inc.
|
2.5%
|
|
Genpact Ltd.
|
2.5%
|
|
Molson Coors Beverage Co. - Class B
|
2.5%
|
|
CF Industries Holdings, Inc.
|
2.5%
|
|
Owens Corning
|
2.5%
|
|
FedEx Corp.
|
2.5%
|
Changes to the Fund’s Principal Investment Strategy:
HCOW invests in Equity Securities that comprise the Amplify Cash Flow Dividend Leaders ETF (the “COWS ETF”). The COWS ETF invests at least 80% of its net assets (plus borrowings for investment purposes) in U.S. equity securities (primarily common stocks) that comprise the Kelly US Cash Flow Dividend Leaders Index (the “COWS Index”), which primarily includes common stocks. The COWS Index is based on a proprietary methodology developed and maintained by Kelly Indexes, LLC (the “Index Provider”), an affiliate of Kelly Intelligence, an investment sub-adviser to the COWS ETF and the Fund. Covered Call Option Strategy In furtherance of the Fund’s investment objective to provide investors with current income, the Fund will seek to generate additional current income by employing a “covered call” option
strategy in which it will write (sell) U.S. exchange-traded covered call options on the Equity Securities. The Fund expects to write covered call options on each Equity Security, but such call writing may be reduced under certain market circumstances. The Fund’s covered call strategy seeks to generate approximately 10% or greater annualized gross income from premiums received from selling option contracts, however the amount of income generated by the Fund’s implementation of the covered call option strategy will vary based on factors such as market prices, volatility and interest rates. In selling call option contracts, the Fund effectively sells its ability to participate in gains of the Equity Security beyond the predetermined strike price in exchange for the premium income received. The Fund expects to sell call option contracts with expiration dates of approximately one month.
Fund Name Change:
Name change to: Amplify COWS Covered Call ETF
WHAT WERE THE FUND COSTS FOR THE LAST SIX MONTHS? (based on a hypothetical $10,000 investment)
|
Fund Name
|
Costs of a $10,000 investment
|
Costs paid as a percentage of a $10,000 investment*
|
|
Amplify CWP Enhanced Dividend Income ETF
|
$27
|
0.54%
|
Visit https://amplifyetfs.com/fund-documents/ for more recent performance information.
KEY FUND STATISTICS (as of March 31, 2025)
|
Net Assets
|
$4,058,402,641
|
|
Number of Holdings
|
31
|
|
Portfolio Turnover
|
40%
|
|
30-Day SEC Yield
|
1.77%
|
|
30-Day SEC Yield Unsubsidized
|
1.76%
|
|
Top Holdings
|
(%)
|
|
Visa, Inc. - Class A
|
5.3%
|
|
CME Group, Inc.
|
5.2%
|
|
Amplify Samsung SOFR ETF
|
5.0%
|
|
Caterpillar, Inc.
|
5.0%
|
|
JPMorgan Chase & Co.
|
4.9%
|
|
Honeywell International, Inc.
|
4.9%
|
|
American Express Co.
|
4.8%
|
|
Goldman Sachs Group, Inc.
|
4.7%
|
|
Home Depot, Inc.
|
4.7%
|
|
Microsoft Corp.
|
4.7%
|
WHAT WERE THE FUND COSTS FOR THE LAST SIX MONTHS? (based on a hypothetical $10,000 investment)
|
Fund Name
|
Costs of a $10,000 investment
|
Costs paid as a percentage of a $10,000 investment*
|
|
Amplify CWP Growth & Income ETF
|
$28
|
0.55%
|
Visit https://amplifyetfs.com/fund-documents/ for more recent performance information.
KEY FUND STATISTICS (as of March 31, 2025)
|
Net Assets
|
$31,236,081
|
|
Number of Holdings
|
55
|
|
Portfolio Turnover
|
155%
|
|
30-Day SEC Yield
|
0.37%
|
|
30-Day SEC Yield Unsubsidized
|
0.37%
|
|
Top Holdings
|
(%)
|
|
NVIDIA Corp.
|
9.2%
|
|
Apple, Inc.
|
8.9%
|
|
Microsoft Corp.
|
7.3%
|
|
Amazon.com, Inc.
|
5.8%
|
|
Meta Platforms, Inc. - Class A
|
5.7%
|
|
Alphabet, Inc. - Class A
|
5.6%
|
|
Netflix, Inc.
|
4.0%
|
|
Tesla, Inc.
|
4.0%
|
|
Broadcom, Inc.
|
3.1%
|
|
Visa, Inc. - Class A
|
3.0%
|
WHAT WERE THE FUND COSTS FOR THE LAST SIX MONTHS? (based on a hypothetical $10,000 investment)
|
Fund Name
|
Costs of a $10,000 investment
|
Costs paid as a percentage of a $10,000 investment*
|
|
Amplify CWP International Enhanced Dividend Income ETF
|
$33
|
0.65%
|
Visit https://amplifyetfs.com/fund-documents/ for more recent performance information.
KEY FUND STATISTICS (as of March 31, 2025)
|
Net Assets
|
$206,833,922
|
|
Number of Holdings
|
66
|
|
Portfolio Turnover
|
52%
|
|
30-Day SEC Yield
|
1.96%
|
|
30-Day SEC Yield Unsubsidized
|
1.96%
|
|
Top Holdings
|
(%)
|
|
First American Government Obligations Fund - Class X
|
10.8%
|
|
Tencent Holdings Ltd.
|
5.1%
|
|
Agnico Eagle Mines Ltd.
|
4.1%
|
|
Barclays PLC
|
4.0%
|
|
SAP SE
|
3.7%
|
|
RELX PLC
|
3.6%
|
|
Enbridge, Inc.
|
3.3%
|
|
Wheaton Precious Metals Corp.
|
3.2%
|
|
Siemens AG
|
3.1%
|
|
Mitsubishi UFJ Financial Group, Inc.
|
3.1%
|
WHAT WERE THE FUND COSTS FOR THE LAST SIX MONTHS? (based on a hypothetical $10,000 investment)
|
Fund Name
|
Costs of a $10,000 investment
|
Costs paid as a percentage of a $10,000 investment*
|
|
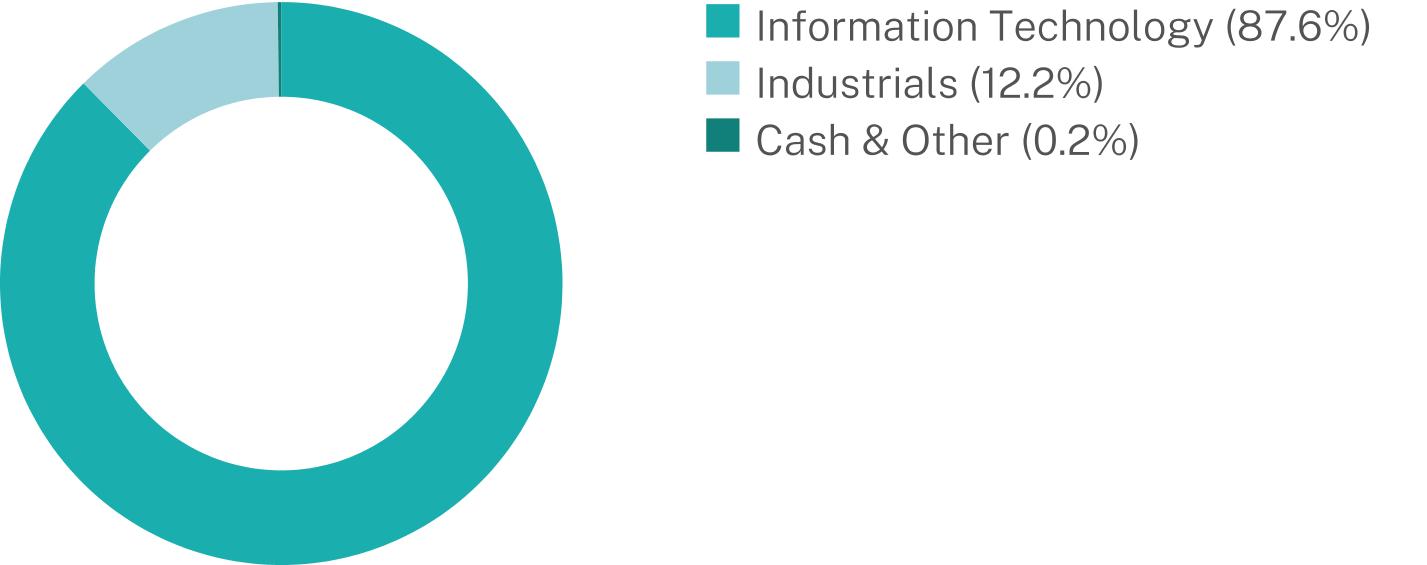
Amplify Cybersecurity ETF
|
$31
|
0.60%
|
Visit https://amplifyetfs.com/fund-documents/ for more recent performance information.
KEY FUND STATISTICS (as of March 31, 2025)
|
Net Assets
|
$1,931,437,870
|
|
Number of Holdings
|
25
|
|
Portfolio Turnover
|
15%
|
|
30-Day SEC Yield
|
0.17%
|
|
30-Day SEC Yield Unsubsidized
|
0.17%
|
|
Top Holdings
|
(%)
|
|
Broadcom, Inc.
|
7.7%
|
|
Cisco Systems, Inc.
|
6.9%
|
|
Northrop Grumman Corp.
|
6.2%
|
|
General Dynamics Corp.
|
6.0%
|
|
Palo Alto Networks, Inc.
|
5.7%
|
|
Crowdstrike Holdings, Inc. - Class A
|
5.5%
|
|
Fortinet, Inc.
|
5.1%
|
|
Okta, Inc.
|
4.9%
|
|
Check Point Software Technologies, Ltd.
|
4.6%
|
|
Zscaler, Inc.
|
4.6%
|
WHAT WERE THE FUND COSTS FOR THE LAST SIX MONTHS? (based on a hypothetical $10,000 investment)
|
Fund Name
|
Costs of a $10,000 investment
|
Costs paid as a percentage of a $10,000 investment*
|
|
Amplify Digital Payments ETF
|
$38
|
0.75%
|
Visit https://amplifyetfs.com/fund-documents/ for more recent performance information.
KEY FUND STATISTICS (as of March 31, 2025)
|
Net Assets
|
$268,740,836
|
|
Number of Holdings
|
39
|
|
Portfolio Turnover
|
18%
|
|
30-Day SEC Yield
|
-0.22%
|
|
30-Day SEC Yield Unsubsidized
|
-0.22%
|
|
Top Holdings
|
(%)
|
|
First American Government Obligations Fund - Class X
|
6.9%
|
|
Visa, Inc. - Class A
|
6.6%
|
|
Mastercard, Inc. - Class A
|
6.5%
|
|
Fiserv, Inc.
|
6.2%
|
|
American Express Co.
|
6.0%
|
|
PayPal Holdings, Inc.
|
5.7%
|
|
Fidelity National Information Services, Inc.
|
5.3%
|
|
Corpay, Inc.
|
4.7%
|
|
Global Payments, Inc.
|
4.7%
|
|
Wise PLC - Class A
|
4.7%
|
|
Top Ten Countries
|
(%)
|
|
United States
|
89.5%
|
|
United Kingdom
|
5.0%
|
|
Netherlands
|
4.0%
|
|
Brazil
|
2.4%
|
|
Italy
|
1.8%
|
|
Japan
|
1.5%
|
|
Puerto Rico
|
0.8%
|
|
Australia
|
0.8%
|
|
France
|
0.8%
|
|
Cash & Other
|
-6.6%
|
WHAT WERE THE FUND COSTS FOR THE LAST SIX MONTHS? (based on a hypothetical $10,000 investment)
|
Fund Name
|
Costs of a $10,000 investment
|
Costs paid as a percentage of a $10,000 investment*
|
|
Amplify Etho Climate Leadership U.S. ETF
|
$22
|
0.45%
|
Visit https://amplifyetfs.com/fund-documents/ for more recent performance information.
KEY FUND STATISTICS (as of March 31, 2025)
|
Net Assets
|
$151,191,007
|
|
Number of Holdings
|
287
|
|
Portfolio Turnover
|
2%
|
|
30-Day SEC Yield
|
1.09%
|
|
30-Day SEC Yield Unsubsidized
|
1.09%
|
|
Top Holdings
|
(%)
|
|
First American Government Obligations Fund - Class X
|
1.2%
|
|
Sprouts Farmers Market, Inc.
|
0.9%
|
|
InterDigital, Inc.
|
0.7%
|
|
Alnylam Pharmaceuticals, Inc.
|
0.7%
|
|
Bloom Energy Corp. - Class A
|
0.7%
|
|
Protagonist Therapeutics, Inc.
|
0.6%
|
|
Liquidity Services, Inc.
|
0.6%
|
|
T-Mobile US, Inc.
|
0.6%
|
|
Twilio, Inc. - Class A
|
0.6%
|
|
Exelixis, Inc.
|
0.6%
|
WHAT WERE THE FUND COSTS FOR THE LAST SIX MONTHS? (based on a hypothetical $10,000 investment)
|
Fund Name
|
Costs of a $10,000 investment
|
Costs paid as a percentage of a $10,000 investment*
|
|
Amplify High Income ETF
|
$25
|
0.50%
|
Visit https://amplifyetfs.com/fund-documents/ for more recent performance information.
KEY FUND STATISTICS (as of March 31, 2025)
|
Net Assets
|
$541,936,262
|
|
Number of Holdings
|
63
|
|
Portfolio Turnover
|
27%
|
|
30-Day SEC Yield
|
11.83%
|
|
30-Day SEC Yield Unsubsidized
|
11.83%
|
|
Top Holdings
|
(%)
|
|
abrdn Healthcare Opportunities Fund
|
3.5%
|
|
CBRE Global Real Estate Income Fund
|
3.4%
|
|
Western Asset Diversified Income Fund
|
3.2%
|
|
Nuveen Floating Rate Income Fund
|
3.2%
|
|
NYLI CBRE Global Infrastructure Megatrends Term Fund
|
3.2%
|
|
abrdn Income Credit Strategies Fund
|
3.1%
|
|
BlackRock Health Sciences Term Trust
|
3.1%
|
|
BlackRock ESG Capital Allocation Term Trust
|
3.1%
|
|
Aberdeen Asia-Pacific Income Fund, Inc.
|
3.1%
|
|
abrdn Total Dynamic Dividend Fund
|
3.0%
|
This report describes changes to the Fund that occurred during the reporting period.
WHAT WERE THE FUND COSTS FOR THE LAST SIX MONTHS? (based on a hypothetical $10,000 investment)
|
Fund Name
|
Costs of a $10,000 investment
|
Costs paid as a percentage of a $10,000 investment*
|
|
Amplify Junior Silver Miners ETF
|
$35
|
0.69%
|
Visit https://amplifyetfs.com/fund-documents/ for more recent performance information.
KEY FUND STATISTICS (as of March 31, 2025)
|
Net Assets
|
$1,098,941,659
|
|
Number of Holdings
|
55
|
|
Portfolio Turnover
|
37%
|
|
30-Day SEC Yield
|
-0.17%
|
|
30-Day SEC Yield Unsubsidized
|
-0.17%
|
|
Top Holdings
|
(%)
|
|
First Majestic Silver Corp.
|
10.6%
|
|
Hecla Mining Co.
|
8.9%
|
|
Coeur Mining, Inc.
|
7.2%
|
|
Wheaton Precious Metals Corp.
|
6.9%
|
|
Endeavour Silver Corp.
|
5.6%
|
|
Fortuna Mining Corp.
|
4.6%
|
|
Osisko Gold Royalties Ltd.
|
3.9%
|
|
KGHM Polska Miedz SA
|
3.7%
|
|
Industrias Penoles SAB de CV
|
3.6%
|
|
Cia de Minas Buenaventura SAA
|
3.6%
|
|
Top Ten Countries
|
(%)
|
|
Canada
|
62.5%
|
|
United States
|
22.3%
|
|
Peru
|
5.6%
|
|
Mexico
|
4.2%
|
|
Poland
|
3.7%
|
|
United Kingdom
|
1.2%
|
|
Sweden
|
1.1%
|
|
Australia
|
0.5%
|
|
Cash & Other
|
-1.1%
|
Changes to the Fund’s Principal Investment Strategy:
Notwithstanding anything to the contrary in the Fund’s Prospectus and Summary Prospectus, the sixth and seventh paragraphs of the section entitled “Principal Investment Strategies” are hereby deleted in their entirety and replaced with the following: Weighting. The Index is a modified theme-adjusted free float market capitalization-weighted index. A theme-adjusted free float market value is calculated for each Index constituent and then constituent weightings are determined based on each Index constituent’s theme-adjusted free float market value, subject to certain adjustments. For additional information about the Index’s weighting process see “Additional Information About the Fund’s Strategies and Risks—Principal Investment Strategies.” Additionally, the following disclosure is added in the Fund’s Prospectus as
the third paragraph of the “Additional Information About the Fund’s Strategies and Risks—Principal Investment Strategies” section: The Index is a modified theme-adjusted free float market capitalization-weighted index. A theme-adjusted free float market value is calculated for each Index constituent as the product of its: (i) free float market capitalization; (ii) the issuing company’s silver revenue percentage (as defined by Metals Focus); and (iii) its liquidity factor (calculated as the Index constituent’s three-month average daily traded value divided by the aggregate three-month average daily traded value of all Index constituents). Companies within the “Project Development” sector have an assumed silver revenue of 100% for these purposes. Each Index constituent’s initial weight is determined by dividing its theme-adjusted free float market value by the aggregate theme-adjusted free float market value of all Index components. Initial weights are then adjusted to determine final weights to reduce excessive concentration by: (1) first, raising each Index constituents initial weight to the power of 0.50 (adjusted initial weight); and (2) second, dividing the adjusted initial weight by the aggregate adjusted initial weight of all Index constituents. Index constituents are then grouped based on their market capitalization at the time of the Reconstitution Reference Date. Group 1 Index constituents are those that have a market capitalization at or above the 90th percentile of the portfolio. Group 2 constituents consist of all other Index constituents. Weights from step (2) above are further adjusted on a pro-rata basis such that: (i) the aggregate weight of Group 1 securities cannot exceed 15% of the total portfolio weight; and (ii) no Index constituent weight may exceed 10%.
WHAT WERE THE FUND COSTS FOR THE LAST SIX MONTHS? (based on a hypothetical $10,000 investment)
|
Fund Name
|
Costs of a $10,000 investment
|
Costs paid as a percentage of a $10,000 investment*
|
|
Amplify Lithium & Battery Technology ETF
|
$28
|
0.59%
|
Visit https://amplifyetfs.com/fund-documents/ for more recent performance information.
KEY FUND STATISTICS (as of March 31, 2025)
|
Net Assets
|
$55,979,962
|
|
Number of Holdings
|
53
|
|
Portfolio Turnover
|
50%
|
|
30-Day SEC Yield
|
1.60%
|
|
30-Day SEC Yield Unsubsidized
|
1.60%
|
|
Top Holdings
|
(%)
|
|
First American Government Obligations Fund - Class X
|
8.6%
|
|
Contemporary Amperex Technology Co. Ltd. - Class A
|
7.2%
|
|
BHP Group Ltd.
|
7.0%
|
|
BYD Co. Ltd. - Class H
|
6.9%
|
|
Freeport-McMoRan, Inc.
|
4.8%
|
|
Tesla, Inc.
|
3.9%
|
|
Grupo Mexico SAB de CV - Class B
|
3.4%
|
|
NAURA Technology Group Co. Ltd. - Class A
|
3.2%
|
|
TDK Corp.
|
2.5%
|
|
Li Auto, Inc.
|
2.1%
|
WHAT WERE THE FUND COSTS FOR THE LAST SIX MONTHS? (based on a hypothetical $10,000 investment)
|
Fund Name
|
Costs of a $10,000 investment
|
Costs paid as a percentage of a $10,000 investment*
|
|
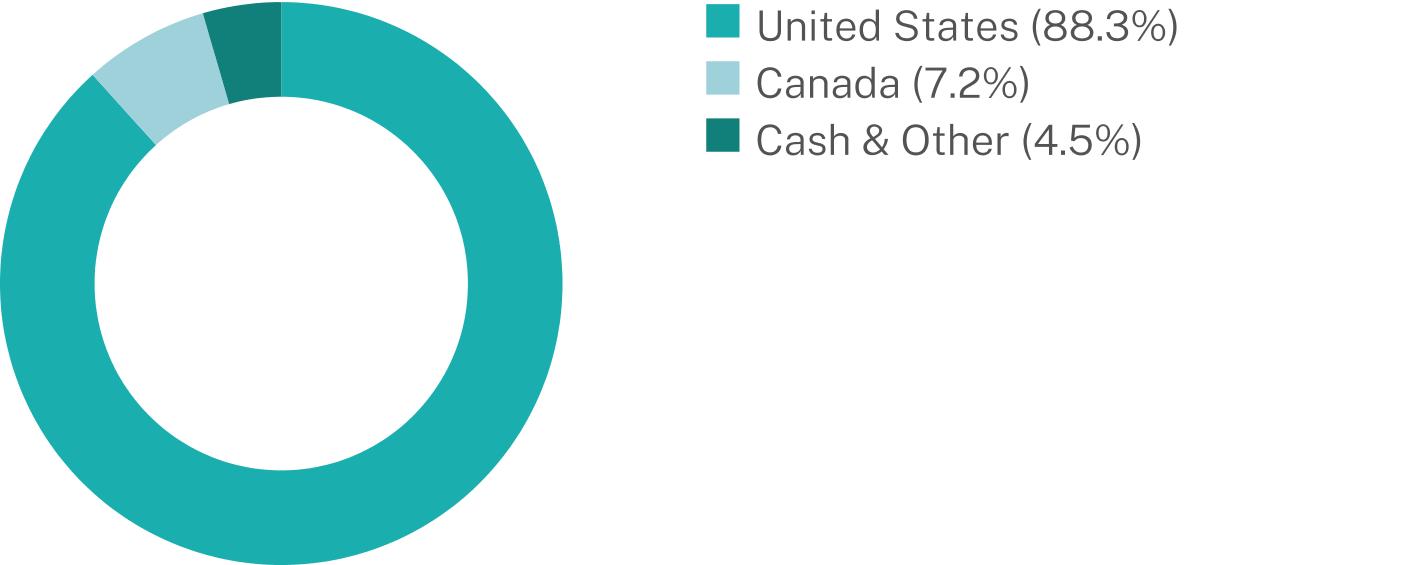
Amplify Natural Resources Dividend Income ETF
|
$30
|
0.59%
|
Visit https://amplifyetfs.com/fund-documents/ for more recent performance information.
KEY FUND STATISTICS (as of March 31, 2025)
|
Net Assets
|
$13,038,305
|
|
Number of Holdings
|
41
|
|
Portfolio Turnover
|
76%
|
|
30-Day SEC Yield
|
7.57%
|
|
30-Day SEC Yield Unsubsidized
|
7.57%
|
|
Top Holdings
|
(%)
|
|
First American Government Obligations Fund - Class X
|
7.9%
|
|
Petroleo Brasileiro SA
|
5.1%
|
|
Dorchester Minerals LP
|
3.9%
|
|
B2Gold Corp.
|
3.7%
|
|
FLEX LNG Ltd.
|
3.7%
|
|
Alliance Resource Partners LP
|
3.4%
|
|
Black Stone Minerals LP
|
3.3%
|
|
Delek Logistics Partners LP
|
3.3%
|
|
Genesis Energy LP
|
3.2%
|
|
CVR Energy, Inc.
|
3.1%
|
|
Geographic Breakdown
|
(%)
|
|
United States
|
77.4%
|
|
Canada
|
14.5%
|
|
Brazil
|
8.1%
|
|
Norway
|
3.6%
|
|
United Kingdom
|
2.2%
|
|
Italy
|
1.9%
|
|
Cash & Other
|
-7.7%
|
WHAT WERE THE FUND COSTS FOR THE LAST SIX MONTHS? (based on a hypothetical $10,000 investment)
|
Fund Name
|
Costs of a $10,000 investment
|
Costs paid as a percentage of a $10,000 investment*
|
|
Amplify Online Retail ETF
|
$32
|
0.65%
|
Visit https://amplifyetfs.com/fund-documents/ for more recent performance information.
KEY FUND STATISTICS (as of March 31, 2025)
|
Net Assets
|
$152,986,254
|
|
Number of Holdings
|
79
|
|
Portfolio Turnover
|
18%
|
|
30-Day SEC Yield
|
0.03%
|
|
30-Day SEC Yield Unsubsidized
|
0.03%
|
|
Top Holdings
|
(%)
|
|
Liquidity Services, Inc.
|
3.5%
|
|
Hims & Hers Health, Inc.
|
3.4%
|
|
eBay, Inc.
|
3.0%
|
|
First American Government Obligations Fund - Class X
|
3.0%
|
|
Chewy, Inc. - Class A
|
3.0%
|
|
DoorDash, Inc. - Class A
|
2.9%
|
|
Copart, Inc.
|
2.8%
|
|
BigCommerce Holdings, Inc.
|
2.8%
|
|
Uber Technologies, Inc.
|
2.7%
|
|
Expedia Group, Inc.
|
2.7%
|
WHAT WERE THE FUND COSTS FOR THE LAST SIX MONTHS? (based on a hypothetical $10,000 investment)
|
Fund Name
|
Costs of a $10,000 investment
|
Costs paid as a percentage of a $10,000 investment*
|
|
Amplify Samsung SOFR ETF
|
$10
|
0.20%
|
Visit https://amplifyetfs.com/fund-documents/ for more recent performance information.
KEY FUND STATISTICS (as of March 31, 2025)
|
Net Assets
|
$284,428,914
|
|
Number of Holdings
|
4
|
|
Portfolio Turnover
|
0%
|
|
30-Day SEC Yield
|
4.22%
|
|
30-Day SEC Yield Unsubsidized
|
4.22%
|
|
Top Holdings
|
(%)
|
|
SOF REPO 04/01/25 4.45%
|
42.2%
|
|
SOF REPO 04/01/25 4.45%
|
29.7%
|
|
SOF REPO 04/01/25 4.45%
|
28.1%
|
|
Invesco Government & Agency Portfolio - Class Institutional
|
0.0%
|
This report describes changes to the Fund that occurred during the reporting period.
WHAT WERE THE FUND COSTS FOR THE LAST SIX MONTHS? (based on a hypothetical $10,000 investment)
|
Fund Name
|
Costs of a $10,000 investment
|
Costs paid as a percentage of a $10,000 investment*
|
|
Amplify Seymour Cannabis ETF
|
$27
|
0.75%
|
Visit https://amplifyetfs.com/fund-documents/ for more recent performance information.
KEY FUND STATISTICS (as of March 31, 2025)
|
Net Assets
|
$69,711,144
|
|
Number of Holdings
|
39
|
|
Portfolio Turnover
|
17%
|
|
30-Day SEC Yield
|
3.07%
|
|
30-Day SEC Yield Unsubsidized
|
2.87%
|
|
Top Holdings**
|
(%)
|
|
United States Treasury Bill
|
51.1%
|
|
Invesco Government & Agency Portfolio - Class Institutional
|
17.0%
|
|
Curaleaf Holdings, Inc.
|
8.1%
|
|
TerrAscend Corp.
|
4.9%
|
|
WM Technology, Inc.
|
4.3%
|
|
United States Treasury Bill
|
3.6%
|
|
Innovative Industrial Properties, Inc.
|
2.7%
|
|
First American Government Obligations Fund - Class X
|
1.5%
|
|
GrowGeneration Corp.
|
1.2%
|
|
Tilray Brands, Inc.
|
0.9%
|
Changes to Fund’s Investment Adviser or Sub Adviser:
The Board of Trustees of the Trust also considered and voted to approve the following changes to the Fund: (i) The investment sub-advisory agreement with Penserra Capital Management LLC (“Penserra”) will be terminated and Seymour Asset Management LLC (“Seymour”) will continue to serve as an investment sub-adviser. (ii) Tidal Investments LLC (“Tidal”) will be added as an investment sub-adviser to the Fund pursuant to an investment sub-advisory agreement between Amplify Investments LLC and Tidal.
Changes to Fund’s Investment Objective or Goals:
On November 12, 2024, the Board of Trustees of the Trust approved a change to the Fund’s 80% investment policy. On or around January 28, 2024, the Fund’s 80% investment policy will change as follows: Under normal market conditions, the Fund seeks to achieve its investment objective by investing in the securities of U.S. companies engaged in cannabis and hemp-related activities selected by the Fund’s investment adviser, Amplify Investments LLC (“Amplify Investments” or the “Adviser”). Pursuant to this strategy, the Fund will invest at least 80% of its net assets (plus borrowings for investment purposes) in the securities of U.S. companies that derive 50% or more of their revenue from the cannabis and hemp ecosystem and in derivatives that have economic characteristics similar to such securities.
Other Material Fund Changes:
|
•
|
CNBS completed a 1-for-12 reverse share split effective February 21, 2025
|
WHAT WERE THE FUND COSTS FOR THE REPORTING PERIOD? (based on a hypothetical $10,000 investment)
|
Fund Name
|
Costs of a $10,000 investment
|
Costs paid as a percentage of a $10,000 investment*
|
|
Amplify Small-Mid Cap Equity ETF
|
$25
|
0.60%
|
Visit https://amplifyetfs.com/fund-documents/ for more recent performance information.
KEY FUND STATISTICS (as of March 31, 2025)
|
Net Assets
|
$1,156,321
|
|
Number of Holdings
|
58
|
|
Portfolio Turnover
|
20%
|
|
30-Day SEC Yield
|
0.48%
|
|
30-Day SEC Yield Unsubsidized
|
0.48%
|
|
Top 10 Issuers
|
(%)
|
|
Watsco, Inc.
|
4.7%
|
|
Pinnacle Financial Partners, Inc.
|
3.6%
|
|
Eagle Materials, Inc.
|
3.5%
|
|
BJ’s Wholesale Club Holdings, Inc.
|
3.4%
|
|
Tyler Technologies, Inc.
|
3.1%
|
|
Devon Energy Corp.
|
3.1%
|
|
Markel Group, Inc.
|
2.6%
|
|
EastGroup Properties, Inc.
|
2.6%
|
|
American Financial Group, Inc.
|
2.5%
|
|
NVR, Inc.
|
2.5%
|
WHAT WERE THE FUND COSTS FOR THE LAST SIX MONTHS? (based on a hypothetical $10,000 investment)
|
Fund Name
|
Costs of a $10,000 investment
|
Costs paid as a percentage of a $10,000 investment*
|
|
Amplify Transformational Data Sharing ETF
|
$36
|
0.70%
|
Visit https://amplifyetfs.com/fund-documents/ for more recent performance information.
KEY FUND STATISTICS (as of March 31, 2025)
|
Net Assets
|
$664,198,000
|
|
Number of Holdings
|
53
|
|
Portfolio Turnover
|
24%
|
|
30-Day SEC Yield
|
0.09%
|
|
30-Day SEC Yield Unsubsidized
|
0.09%
|
|
Top Holdings
|
(%)
|
|
First American Government Obligations Fund - Class X
|
12.8%
|
|
Robinhood Markets, Inc. - Class A
|
4.9%
|
|
MicroStrategy, Inc. - Class A
|
4.8%
|
|
Coinbase Global, Inc. - Class A
|
4.0%
|
|
Metaplanet, Inc.
|
3.8%
|
|
International Business Machines Corp.
|
3.6%
|
|
PayPal Holdings, Inc.
|
3.2%
|
|
Cleanspark, Inc.
|
3.2%
|
|
Block, Inc.
|
3.1%
|
|
Galaxy Digital Holdings Ltd.
|
3.1%
|
WHAT WERE THE FUND COSTS FOR THE LAST SIX MONTHS? (based on a hypothetical $10,000 investment)
|
Fund Name
|
Costs of a $10,000 investment
|
Costs paid as a percentage of a $10,000 investment*
|
|
Amplify Travel Tech ETF
|
$37
|
0.75%
|
Visit https://amplifyetfs.com/fund-documents/ for more recent performance information.
KEY FUND STATISTICS (as of March 31, 2025)
|
Net Assets
|
$50,541,894
|
|
Number of Holdings
|
32
|
|
Portfolio Turnover
|
21%
|
|
30-Day SEC Yield
|
0.26%
|
|
30-Day SEC Yield Unsubsidized
|
0.26%
|
|
Top Holdings
|
(%)
|
|
Trip.com Group Ltd.
|
4.7%
|
|
MakeMyTrip Ltd.
|
4.7%
|
|
Booking Holdings, Inc.
|
4.7%
|
|
Uber Technologies, Inc.
|
4.6%
|
|
Tongcheng Travel Holdings Ltd.
|
4.6%
|
|
TravelSky Technology Ltd. - Class H
|
4.4%
|
|
TripAdvisor, Inc.
|
4.3%
|
|
Airbnb, Inc. - Class A
|
4.2%
|
|
Lyft, Inc. - Class A
|
4.1%
|
|
Despegar.com Corp.
|
4.1%
|
This report describes changes to the Fund that occurred during the reporting period.
WHAT WERE THE FUND COSTS FOR THE LAST SIX MONTHS? (based on a hypothetical $10,000 investment)
|
Fund Name
|
Costs of a $10,000 investment
|
Costs paid as a percentage of a $10,000 investment*
|
|
Amplify Video Game Leaders ETF
|
$34
|
0.69%
|
Visit https://amplifyetfs.com/fund-documents/ for more recent performance information.
KEY FUND STATISTICS (as of March 31, 2025)
|
Net Assets
|
$36,642,524
|
|
Number of Holdings
|
22
|
|
Portfolio Turnover
|
97%
|
|
30-Day SEC Yield
|
0.07%
|
|
30-Day SEC Yield Unsubsidized
|
0.07%
|
|
Top Holdings
|
(%)
|
|
Advanced Micro Devices, Inc.
|
10.5%
|
|
Microsoft Corp.
|
9.9%
|
|
Tencent Holdings, Ltd.
|
9.8%
|
|
Meta Platforms, Inc. - Class A
|
9.8%
|
|
Invesco Government & Agency Portfolio - Class Institutional
|
6.2%
|
|
NetEase, Inc.
|
5.0%
|
|
Sony Group Corp.
|
4.8%
|
|
Sea, Ltd.
|
4.8%
|
|
NVIDIA Corp.
|
4.7%
|
|
Nintendo Co. Ltd.
|
4.5%
|
Fund Name Change:
Name change to: Amplify Video Game Leaders ETF
Other Material Fund Changes:
|
•
|
Index provider change to VettaFi LLC. Index change to: VettaFi Video Game Leaders Index
|
|
•
|
Effective March 26, 2025, the Fund is reducing the size of Creation Units from 50,000 Shares to 10,000 Shares.
|
|
•
|
Management fee change to: 0.59%
|
WHAT WERE THE FUND COSTS FOR THE LAST SIX MONTHS? (based on a hypothetical $10,000 investment)
|
Fund Name
|
Costs of a $10,000 investment
|
Costs paid as a percentage of a $10,000 investment*
|
|
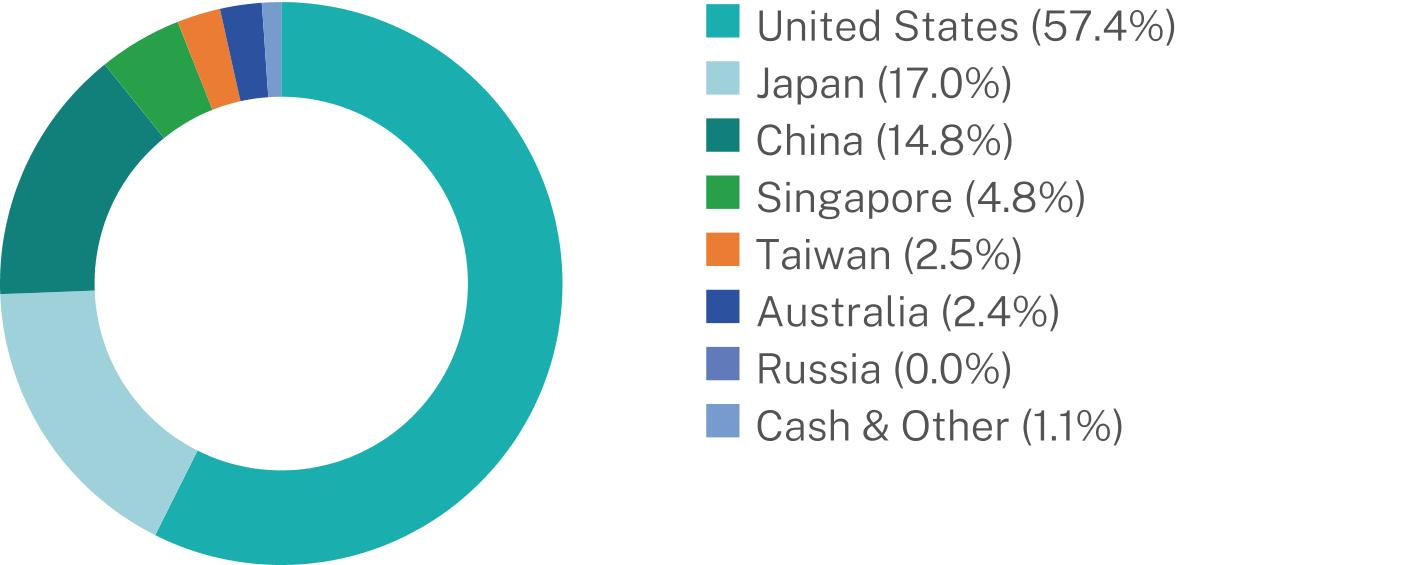
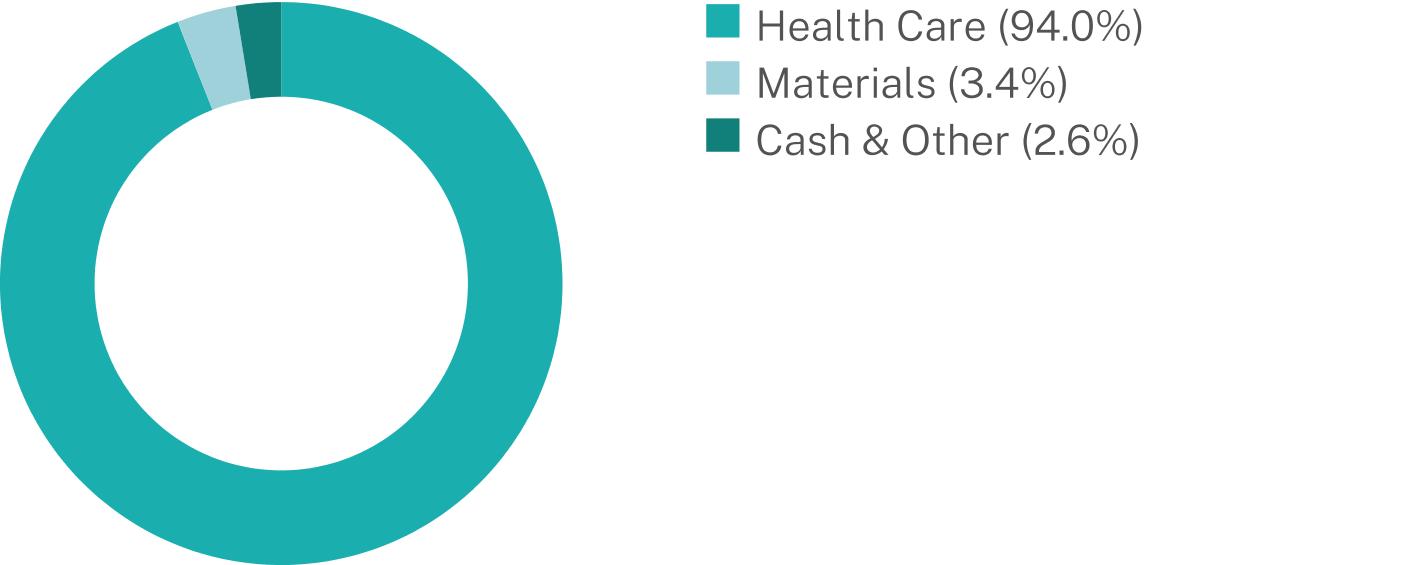
Amplify Weight Loss Drug & Treatment ETF
|
$27
|
0.59%
|
Visit https://amplifyetfs.com/fund-documents/ for more recent performance information.
KEY FUND STATISTICS (as of March 31, 2025)
|
Net Assets
|
$3,871,107
|
|
Number of Holdings
|
27
|
|
Portfolio Turnover
|
22%
|
|
30-Day SEC Yield
|
1.33%
|
|
30-Day SEC Yield Unsubsidized
|
1.33%
|
|
Top Holdings
|
(%)
|
|
Eli Lilly & Co.
|
15.8%
|
|
Novo Nordisk AS
|
14.0%
|
|
First American Government Obligations Fund - Class X
|
13.9%
|
|
West Pharmaceutical Services, Inc.
|
5.1%
|
|
Chugai Pharmaceutical Co. Ltd.
|
5.1%
|
|
Thermo Fisher Scientific, Inc.
|
5.0%
|
|
Merck & Co., Inc.
|
4.8%
|
|
Amgen, Inc.
|
4.7%
|
|
Innovent Biologics, Inc.
|
4.7%
|
|
Pfizer, Inc.
|
4.7%
|
| [1] |
|
||
| [2] |
|
||
| [3] |
|
||
| [4] |
|
||
| [5] |
|
||
| [6] |
|
||
| [7] |
|
||
| [8] |
|
||
| [9] |
|
||
| [10] |
|
||
| [11] |
|
||
| [12] |
|
||
| [13] |
|
||
| [14] |
|
||
| [15] |
|
||
| [16] |
|
||
| [17] |
|
||
| [18] |
|
||
| [19] |
|
||
| [20] |
|
||
| [21] |
|
||
| [22] |
|
||
| [23] |
|
||
| [24] |
|
||
| [25] |
|
||
| [26] |
|
||
| [27] |
|
||
| [28] |
|