Pay vs Performance Disclosure
shares in Millions
shares in Millions
Dec. 31, 2024
USD ($)
shares
Pay Versus Performance
In accordance with Item 402(v) of Regulation philosophy and how we align executive compensation with company performance, refer to the CD&A section above.
S-K,
we are providing the following information regarding the relationship between compensation actually paid (CAP) and certain financial performance measures. The disclosures in this “Pay Versus Performance” section do not necessarily align with how we, the Compensation & Human Capital Committee or the Board view the link between compensation and performance. For additional information about our pay-for-performance
The following table sets forth information concerning compensation of our NEOs and company financial performance for 2024. Except as noted herein, 2024 compensation and company performance
amounts
provided in this “Pay Versus Performance” section relate to the full year 2024, including combined amounts relating to Endo International plc prior to the consummation of the Plan and Endo, Inc. thereafter. Information for years prior to 2024 has not been presented because Endo, Inc. was not required to report pursuant to Section 13(a) or 15(d) of the Exchange Act prior to 2024. Value of Initial Fixed $100 Investment Based on: |
||||||||||||||||||||||||||||||||||||||||
Year (1) |
Summary Compen- sation Table Total for Current PEO ($) |
Summary Compen- sation Table Total for Former PEO ($) |
Compen- sation Actually Paid to Current PEO ($)(2) |
Compen- sation Actually Paid to Former PEO ($)(2) |
Average Summary Compen- sation Table Total for Non-PEO NEOs ($) |
Average Compen- sation Actually Paid to Non- PEO NEOs ($)(2) |
Total Share- holder Return ($)(3) |
Peer Group Total Share- holder Return ($)(3) |
Net Income (Loss) ($ in millions) (4)(5) |
Adjusted Revenue ($ in millions) (4)(6) |
||||||||||||||||||||||||||||||
2024 |
$ |
1,810,841 |
$ |
7,078,459 |
$ |
1,780,163 |
$ |
7,078,459 |
$ |
5,105,481 |
$ |
4,586,699 |
$ |
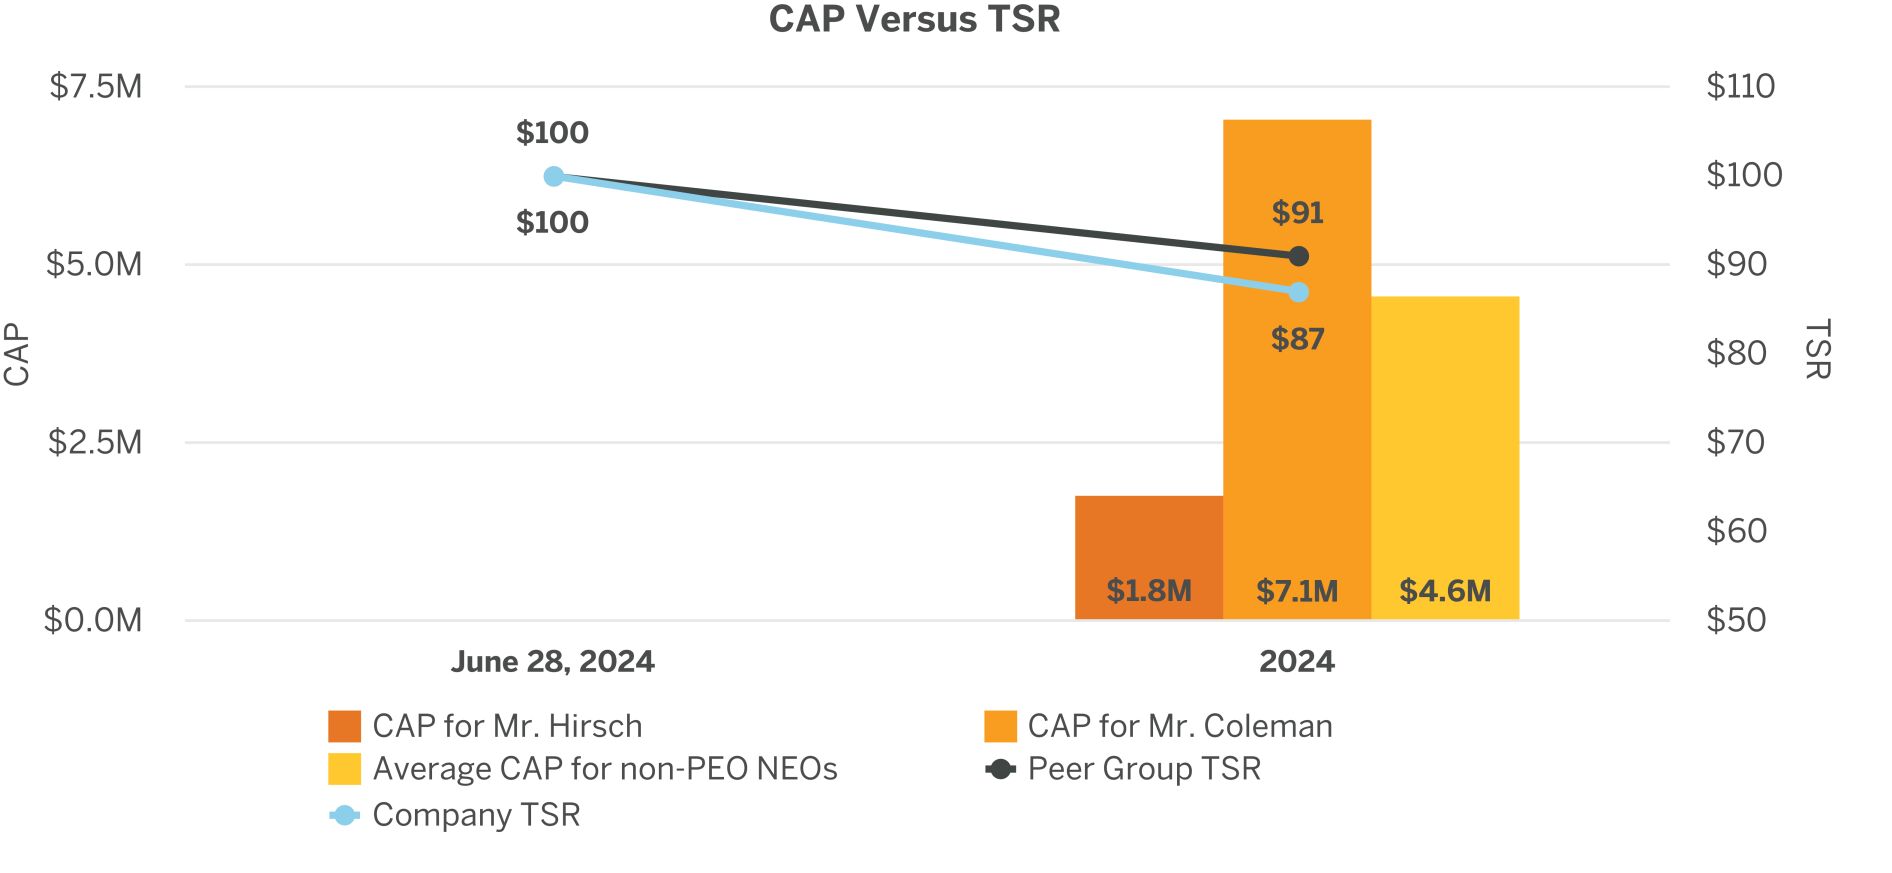
87 |
$ |
91 |
$ |
5,642 |
$ |
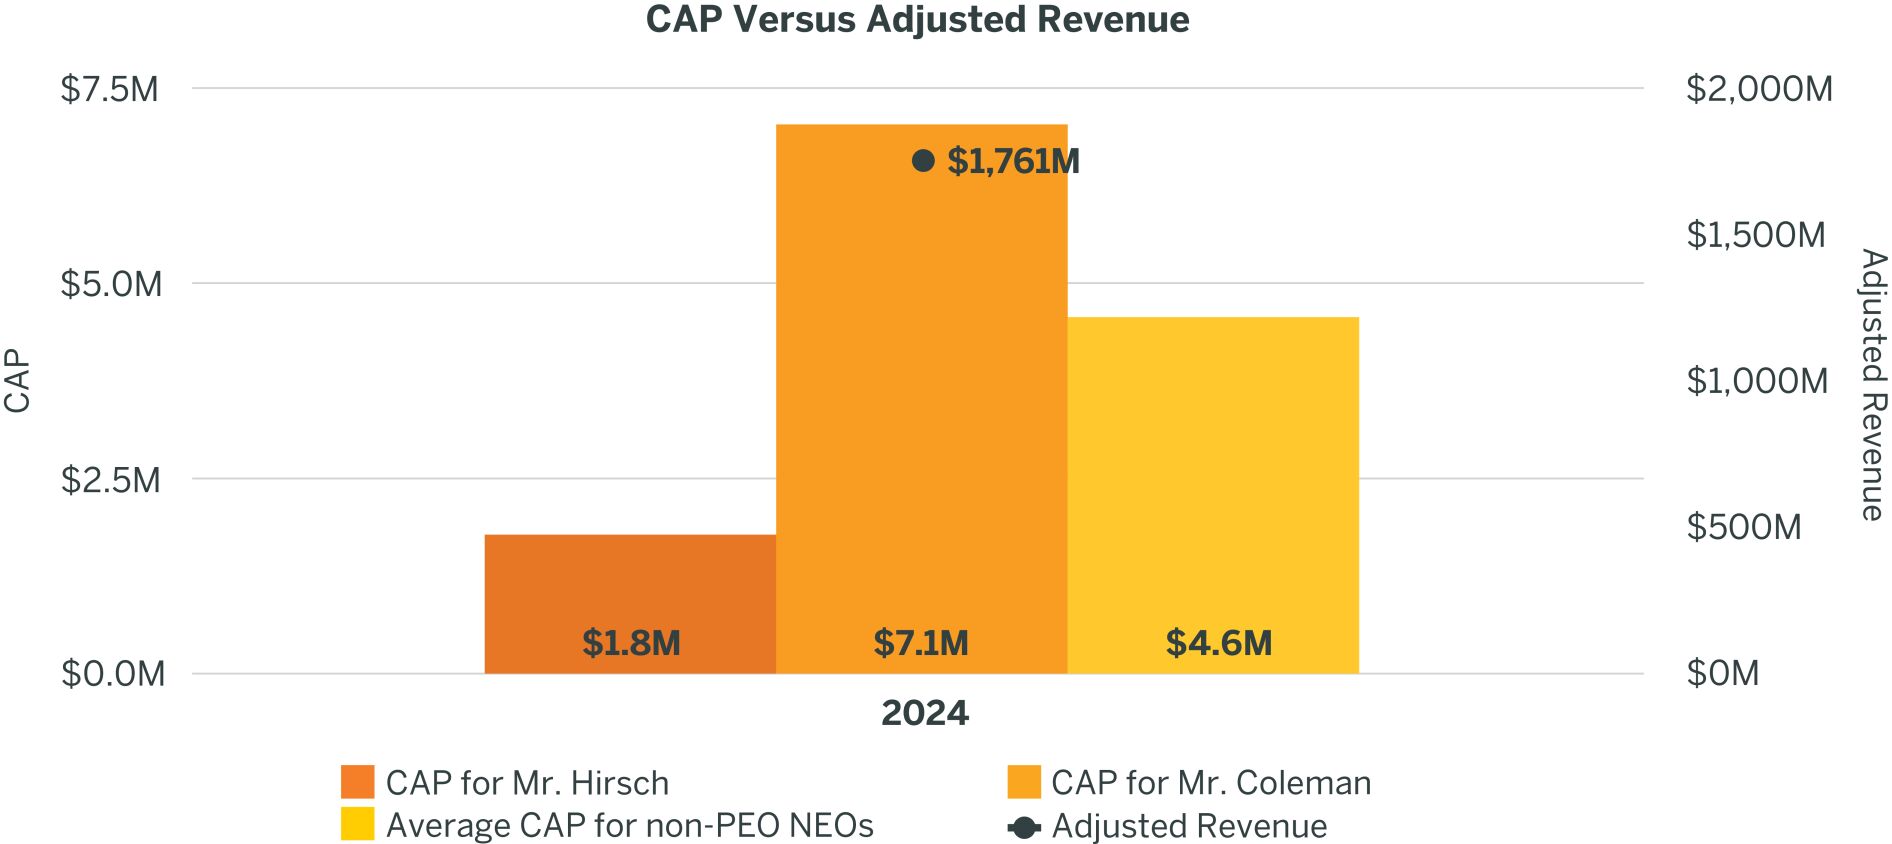
1,761 |
||||||||||||||||||||
(1) |
The Company had two Principal Executive Officers (PEOs) during 2024, including Mr. Coleman (Former PEO) until August 29, 2024 and Mr. Hirsch (Current PEO) since August 29, 2024. The non-PEO NEOs were as follows: |
Year |
Non-PEO NEOs | |
2024 |
Messrs. Bradley, Maletta and Barry and Dr. Tursi | |
(2) |
Amounts represent CAP to our PEOs and the average CAP to our non-PEO NEOs. Reported 2024 CAP amounts represent the “Total” 2024 compensation reported in the Summary Compensation Table (averaged in the case of our non-PEO NEOs), adjusted in accordance with SEC rules as follows: |
Current PEO ($) |
Former PEO ($) |
Average Non-PEO NEOs ($) |
||||||||||
Total compensation as reported in the Summary Compensation Table |
$ |
1,810,841 |
$ |
7,078,459 |
$ |
5,105,481 |
||||||
Adjustments related to fair values of equity awards (a): |
||||||||||||
(-) Grant date fair value of equity awards granted in year |
(797,626 |
) |
— |
(3,946,805 |
) | |||||||
+ Year-end fair value of equity awards granted in year and outstanding and unvested at year-end (b) |
766,948 |
— |
3,428,023 |
|||||||||
CAP |
$ |
1,780,163 |
$ |
7,078,459 |
$ |
4,586,699 |
||||||
(a) |
Adjustments related to fair values of equity awards (which include, as applicable, stock and option awards) were computed in accordance with ASC 718 using methodologies and assumptions materially consistent with those used at the time of grant. |
(b) |
Amounts include (i) performance-based awards which, assuming actual performance relative to the applicable performance targets as of December 31, 2024, would be earned below target and (ii) time-based awards. |
(3) |
On June 28, 2024, Endo, Inc.’s newly-issued common shares commenced trading on the OTCQX ® Best Market under the ticker symbol NDOI. For purposes of the total stockholder return (TSR) amounts presented in the table above and the graph below, (i) both Endo and peer group TSR amounts are based on initial fixed investments of $100 in Endo common stock and the S&P 500 Pharmaceuticals Industry Index, respectively, and in each case, as of June 28, 2024. |
(4) |
These 2024 results represent combined 2024 amounts relating to Endo International plc prior to the consummation of the Plan and Endo, Inc. thereafter. This combined presentation is not considered to be in accordance with GAAP, and the combined amounts have not been prepared as pro forma results per applicable regulations, do not reflect the actual results that would have been achieved absent the consummation of the Plan and may not be indicative of future results. |
(5) |
Amount represents the sum of $731 million of net loss for the Successor and $6,373 million of net income for the Predecessor, each determined in accordance with GAAP. |
(6) |
Adjusted Revenue in 2024 consisted of revenues of $1,178 million for the Successor and $582 million for the Predecessor, each determined in accordance with GAAP, adjusted as described in CD&A under the heading “2024 Annual Cash IC Considerations and Determinations—2024 Financial Objectives and Results.” |
(1) |
The Company had two Principal Executive Officers (PEOs) during 2024, including Mr. Coleman (Former PEO) until August 29, 2024 and Mr. Hirsch (Current PEO) since August 29, 2024. The non-PEO NEOs were as follows: |
Year |
Non-PEO NEOs | |
2024 |
Messrs. Bradley, Maletta and Barry and Dr. Tursi | |
®
Best Market under the ticker symbol NDOI. For purposes of the total stockholder return (TSR) amounts presented in the table above and the graph below, (i) both Endo and peer group TSR amounts are based on initial fixed investments of $100 in Endo common stock and the S&P 500 Pharmaceuticals Industry Index, respectively, and in each case, as of June 28, 2024.
(2) |
Amounts represent CAP to our PEOs and the average CAP to our non-PEO NEOs. Reported 2024 CAP amounts represent the “Total” 2024 compensation reported in the Summary Compensation Table (averaged in the case of our non-PEO NEOs), adjusted in accordance with SEC rules as follows: |
Current PEO ($) |
Former PEO ($) |
Average Non-PEO NEOs ($) |
||||||||||
Total compensation as reported in the Summary Compensation Table |
$ |
1,810,841 |
$ |
7,078,459 |
$ |
5,105,481 |
||||||
Adjustments related to fair values of equity awards (a): |
||||||||||||
(-) Grant date fair value of equity awards granted in year |
(797,626 |
) |
— |
(3,946,805 |
) | |||||||
+ Year-end fair value of equity awards granted in year and outstanding and unvested at year-end (b) |
766,948 |
— |
3,428,023 |
|||||||||
CAP |
$ |
1,780,163 |
$ |
7,078,459 |
$ |
4,586,699 |
||||||

Pay Versus Performance Tabular List
The measures most important in determining CAP with respect to our NEOs during 2024 were those measures most heavily w
eighte
d in our annual cash
IC program
, which include: Most Important Performance Measures |
Adjusted Revenue |
Adjusted Free Cash Flow |
Adjusted EBITDA Margin |