Shareholder Report
Mar. 31, 2025
USD ($)
Holding
capitalgroup.com/mutual-fund-literature-A
(800) 421-4225
.
What were the fund costs for the last
(based on a hypothetical $10,000 investment)year
?Share class | Costs of a $10,000 investment | Costs paid as a percentage of a $10,000 investment |
| Class A | $ 83 | 0.83 % |
Management's discussion of fund performance
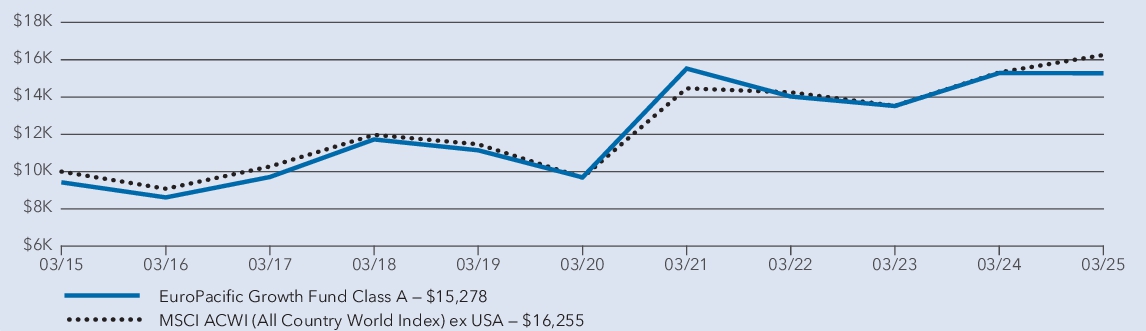
The fund’s Class A shares lost 0.05% for the year ended March 31, 2025. That result compares with a 6.09% gain for the MSCI ACWI (All Country World Index) ex USA. For information on returns for additional periods, including the fund lifetime, please refer to .
capitalgroup.com/mutual-fund-returns-A
What factors influenced results
European stocks rose, aided by looser monetary policy as economic growth remained sluggish. U.K. markets advanced amid slight growth in gross domestic product and persistent inflation. Japanese stocks fell modestly as economic growth remained frail and the Bank of Japan nudged up interest rates. Stocks in China surged, fueled by government stimulus and enthusiasm for the technology sector. India saw a slight positive return in a year marked by weakening economic growth.
Holdings in most equity sectors produced positive returns for the fund, with communication services, financials and utilities particularly additive. Likewise, consumer staples, industrials and real estate saw returns surpassing those of the overall portfolio. Geographically, investments in companies based in the eurozone and the U.K. were significant contributors to absolute returns.
Conversely, the fund’s holdings in the health care, energy and materials sectors detracted from returns. Likewise, holdings in Japan and other European regions had negative returns overall.
Average annual
total
returns
1 year | 5 years | 10 years | |
| EuroPacific Growth Fund — Class A (with sales charge) * | (5.80 ) % | 8.24 % | 4.33 % |
| EuroPacific Growth Fund — Class A (without sales charge) * | (0.05 ) % | 9.53 % | 4.95 % |
| MSCI ACWI (All Country World Index) ex USA † | 6.09 % | 10.92 % | 4.98 % |
*
Investment results assume all distributions are reinvested and reflect applicable fees and expenses. When applicable, results reflect fee waivers and/or expense reimbursements, without which they would have been lower.†
Results assume all distributions are reinvested. Any market index shown is unmanaged, and therefore, has no expenses. Investors cannot invest directly in an index. Source(s): MSCI.Key fund statistics
| Fund net assets (in millions) | $ 124,209 |
| Total number of portfolio holdings | 342 |
| Total advisory fees paid (in millions) | $ 561 |
| Portfolio turnover rate | 35 % |
Portfolio holdings by sector
(percent of net assets)
Material fund
changes
This is a summary of certain changes to the fund since April 1, 2024. For more complete information, you may review the fund’s next prospectus, which we expect to be available by June 1, 2025 at or upon request at
capitalgroup.com/mutual-fund-literature-A
(800) 421-4225
.Effective June 1, 2025, the fund name is EUPAC Fund.
capitalgroup.com/mutual-fund-literature-A
(800) 421-4225
.
capitalgroup.com/mutual-fund-literature-C
(800) 421-4225
.
What were the fund costs for the last
(based on a hypothetical $10,000 investment)year
?Share class | Costs of a $10,000 investment | Costs paid as a percentage of a $10,000 investment |
| Class C | $ 155 | 1.56 % |
Management's discussion of fund performance
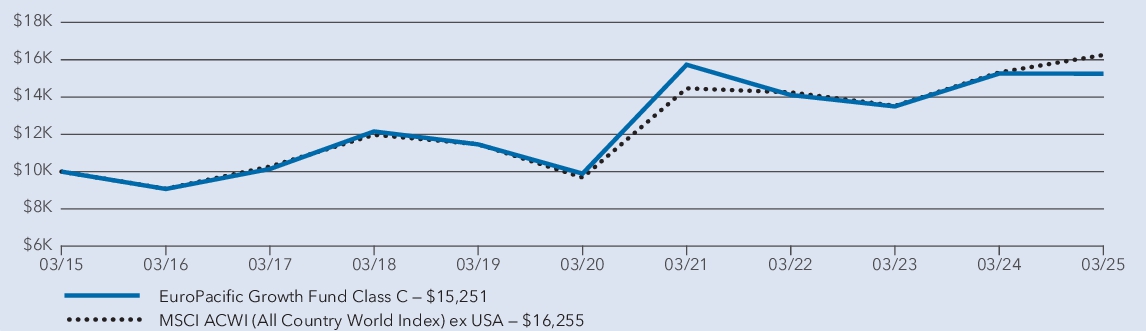
The fund’s Class C shares lost 0.78% for the year ended March 31, 2025. That result compares with a 6.09% gain for the MSCI ACWI (All Country World Index) ex USA. For information on returns for additional periods, including the fund lifetime, please refer to .
capitalgroup.com/mutual-fund-returns-C
What factors influenced results
European stocks rose, aided by looser monetary policy as economic growth remained sluggish. U.K. markets advanced amid slight growth in gross domestic product and persistent inflation. Japanese stocks fell modestly as economic growth remained frail and the Bank of Japan nudged up interest rates. Stocks in China surged, fueled by government stimulus and enthusiasm for the technology sector. India saw a slight positive return in a year marked by weakening economic growth.
Holdings in most equity sectors produced positive returns for the fund, with communication services, financials and utilities particularly additive. Likewise, consumer staples, industrials and real estate saw returns surpassing those of the overall portfolio. Geographically, investments in companies based in the eurozone and the U.K. were significant contributors to absolute returns.
Conversely, the fund’s holdings in the health care, energy and materials sectors detracted from returns. Likewise, holdings in Japan and other European regions had negative returns overall.
Average annual total returns
1 year | 5 years | 10 years | |
| EuroPacific Growth Fund — Class C (with sales charge) * | (1.71 ) % | 8.72 % | 4.31 % |
| EuroPacific Growth Fund — Class C (without sales charge) * | (0.78 ) % | 8.72 % | 4.31 % |
| MSCI ACWI (All Country World Index) ex USA † | 6.09 % | 10.92 % | 4.98 % |
*
Investment results assume all distributions are reinvested and reflect applicable fees and expenses. When applicable, results reflect fee waivers and/or expense reimbursements, without which they would have been lower.†
Results assume all distributions are reinvested. Any market index shown is unmanaged, and therefore, has
no expenses. Investors cannot invest
directly in an index. Source(s): MSCI.Key fund statistics
| Fund net assets (in millions) | $ 124,209 |
| Total number of portfolio holdings | 342 |
| Total advisory fees paid (in millions) | $ 561 |
| Portfolio turnover rate | 35 % |
Portfolio holdings by sector
(percent of net
assets
)
Material fund changes
This is a summary of certain changes to the fund since April 1, 2024. For more complete information, you may review the fund’s next prospectus, which we expect to be available by June 1, 2025 at or upon request at
capitalgroup.com/mutual-fund-literature-C
(800) 421-4225
.Effective June 1, 2025, the fund name is EUPAC Fund.
capitalgroup.com/mutual-fund-literature-C
(800) 421-4225
.
capitalgroup.com/mutual-fund-literature
(800) 421-4225
.
What were the fund costs for the last year?
(based on a hypothetical $10,000 investment)Share class | Costs of a $10,000 investment | Costs paid as a percentage of a $10,000 investment |
| Class T | $ 58 | 0.58 % |
Management's discussion of fund performance
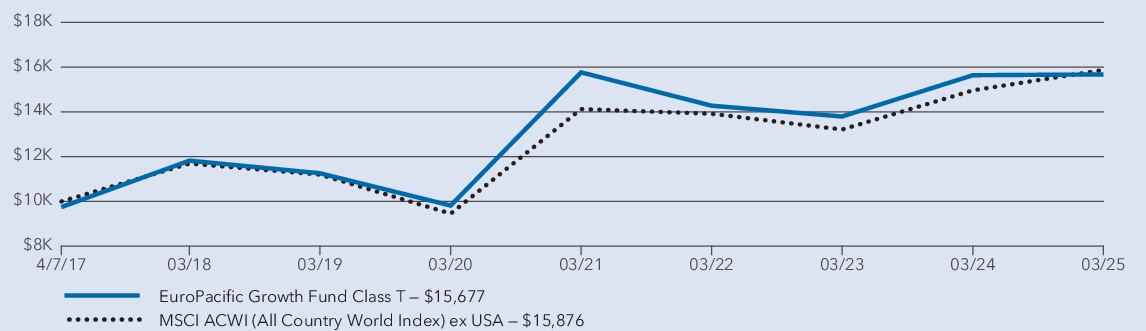
The fund’s Class T shares gained 0.22% for the year ended March 31, 2025. That result compares with a 6.09% gain for the MSCI ACWI (All Country World Index) ex USA.
What factors influenced results
European stocks rose, aided by looser monetary policy as economic growth remained sluggish. U.K. markets advanced amid slight growth in gross domestic product and persistent inflation. Japanese stocks fell modestly as economic growth remained frail and the Bank of Japan nudged up interest rates. Stocks in China surged, fueled by government stimulus and enthusiasm for the technology sector. India saw a slight positive return in a year marked by weakening economic growth.
Holdings in most equity sectors produced positive returns for the fund, with communication services, financials and utilities particularly additive. Likewise, consumer staples, industrials and real estate saw returns surpassing those of the overall portfolio. Geographically, investments in companies based in the eurozone and the U.K. were significant contributors to absolute returns.
Conversely, the fund’s holdings in the health care, energy and materials sectors detracted from returns. Likewise, holdings in Japan and other European regions had negative returns overall.
Average annual
total
returns1 year | 5 years | Since inception 1 | |
| EuroPacific Growth Fund — Class T (with sales charge) 2 | (2.29 ) % | 9.25 % | 5.80 % |
| EuroPacific Growth Fund — Class T (without sales charge) 2 | 0.22 % | 9.81 % | 6.13 % |
| MSCI ACWI (All Country World Index) ex USA 3 | 6.09 % | 10.92 % | 5.96 % |
1
Class T shares were first offered on April 7, 2017.2
Investment results assume all distributions are reinvested and reflect applicable fees and expenses. When applicable, results reflect fee waivers and/or expense reimbursements, without which they would have been lower.3
Results assume all distributions are reinvested. Any market index shown is unmanaged, and therefore, has no expenses. Investors cannot invest directly in an index. Source(s): MSCI.Key fund statistics
| Fund net assets (in millions) | $ 124,209 |
| Total number of portfolio holdings | 342 |
| Total advisory fees paid (in millions) | $ 561 |
| Portfolio turnover rate | 35 % |
Portfolio holdings by sector
(percent of net assets
)
Material fund changes
This is a summary of certain changes to the fund since April 1, 2024. For more complete information, you may review the fund’s next prospectus, which we expect to be available by June 1, 2025 at or upon request at
capitalgroup.com/mutual-fund-literature
(800) 421-4225
.Effective June 1, 2025, the fund name is EUPAC Fund.
capitalgroup.com/mutual-fund-literature
(800) 421-4225
.
capitalgroup.com/mutual-fund-literature-F1
(800) 421-4225
.
What were the fund costs for the last year?
(based on a hypothetical $10,000 investment)Share class | Costs of a $10,000 investment | Costs paid as a percentage of a $10,000 investment |
| Class F-1 | $ 86 | 0.86 % |
Management's discussion of fund performance
The fund’s Class F-1 shares lost 0.07% for the year ended March 31, 2025. That result compares with a 6.09% gain for the MSCI ACWI (All Country World Index) ex USA. For information on returns for additional periods, including the fund lifetime, please refer to .
capitalgroup.com/mutual-fund-returns-F1
What factors influenced results
European stocks rose, aided by looser monetary policy as economic growth remained sluggish. U.K. markets advanced amid slight growth in gross domestic product and persistent inflation. Japanese stocks fell modestly as economic growth remained frail and the Bank of Japan nudged up interest rates. Stocks in China surged, fueled by government stimulus and enthusiasm for the technology sector. India saw a slight positive return in a year marked by weakening economic growth.
Holdings in most equity sectors produced positive returns for the fund, with communication services, financials and utilities particularly additive. Likewise, consumer staples, industrials and real estate saw returns surpassing those of the overall portfolio. Geographically, investments in companies based in the eurozone and the U.K. were significant contributors to absolute returns.
Conversely, the fund’s holdings in the health care, energy and materials sectors detracted from returns. Likewise, holdings in Japan and other European regions had negative returns overall.

Average annual total returns
1 year | 5 years | 10 years | |
| EuroPacific Growth Fund — Class F-1 * | (0.07 ) % | 9.51 % | 4.92 % |
| MSCI ACWI (All Country World Index) ex USA † | 6.09 % | 10.92 % | 4.98 % |
*
Investment results assume all distributions are reinvested and reflect applicable fees and expenses. When applicable, results reflect fee waivers and/or expense reimbursements, without which they would have been lower.†
Results assume all distributions are reinvested. Any market index shown is unmanaged, and therefore, has no expenses. Investors cannot invest directly in an index. Source(s): MSCI.Key fund statistics
| Fund net assets (in millions) | $ 124,209 |
| Total number of portfolio holdings | 342 |
| Total advisory fees paid (in millions) | $ 561 |
| Portfolio turnover rate | 35 % |
Portfolio holdings by sector
(percent of net assets)
Material fund
changes
This is a summary of certain changes to the fund since April 1, 2024. For more complete information, you may review the fund’s next prospectus, which we expect to be available by June 1, 2025 at or upon request at
capitalgroup.com/mutual-fund-literature-F1
(800) 421-4225
.Effective June 1, 2025, the fund name is EUPAC Fund.
capitalgroup.com/mutual-fund-literature-F1
(800) 421-4225
.
capitalgroup.com/mutual-fund-literature-F2
(800) 421-4225
.
What were the fund costs for the last year?
(based on a hypothetical $10,000 investment)Share class | Costs of a $10,000 investment | Costs paid as a percentage of a $10,000 investment |
| Class F-2 | $ 57 | 0.57 % |
Management's discussion of fund performance
The fund’s Class F-2 shares gained 0.22% for the year ended March 31, 2025. That result compares with a 6.09% gain for the MSCI ACWI (All Country World Index) ex USA. For information on returns for additional periods, including the fund lifetime, please refer to .
capitalgroup.com/mutual-fund-returns-F2
What factors influenced results
European stocks rose, aided by looser monetary policy as economic growth remained sluggish. U.K. markets advanced amid slight growth in gross domestic product and persistent inflation. Japanese stocks fell modestly as economic growth remained frail and the Bank of Japan nudged up interest rates. Stocks in China surged, fueled by government stimulus and enthusiasm for the technology sector. India saw a slight positive return in a year marked by weakening economic growth.
Holdings in most equity sectors produced positive returns for the fund, with communication services, financials and utilities particularly additive. Likewise, consumer staples, industrials and real estate saw returns surpassing those of the overall portfolio. Geographically, investments in companies based in the eurozone and the U.K. were significant contributors to absolute returns.
Conversely, the fund’s holdings in the health care, energy and materials sectors detracted from returns. Likewise, holdings in Japan and other European regions had negative returns overall.

Average annual total returns
1 year | 5 years | 10 years | |
| EuroPacific Growth Fund — Class F-2 * | 0.22 % | 9.81 % | 5.21 % |
| MSCI ACWI (All Country World Index) ex USA † | 6.09 % | 10.92 % | 4.98 % |
*
Investment results assume all distributions are reinvested and reflect applicable fees and expenses. When applicable, results reflect fee waivers and/or expense reimbursements, without which they would have been lower.†
Results assume all distributions are reinvested. Any market index shown is unmanaged, and therefore, has no expenses. Investors cannot invest directly in an index. Source(s): MSCI.Key fund statistics
| Fund net assets (in millions) | $ 124,209 |
| Total number of portfolio holdings | 342 |
| Total advisory fees paid (in millions) | $ 561 |
| Portfolio turnover rate | 35 % |
Portfolio holdings by sector
(percent of net assets
)
Material fund changes
This is a summary of certain changes to the fund since April 1, 2024. For more complete information, you may review the fund’s next prospectus, which we expect to be available by June 1, 2025 at or upon request at
capitalgroup.com/mutual-fund-literature-F2
(800) 421-4225
.Effective June 1, 2025, the fund name is EUPAC Fund.
capitalgroup.com/mutual-fund-literature-F2
(800) 421-4225
.
capitalgroup.com/mutual-fund-literature-F3
(800) 421-4225
.
What were the fund costs for the last year?
(based on a hypothetical $10,000 investment)Share class | Costs of a $10,000 investment | Costs paid as a percentage of a $10,000 investment |
| Class F-3 | $ 47 | 0.47 % |
Management's discussion of fund performance
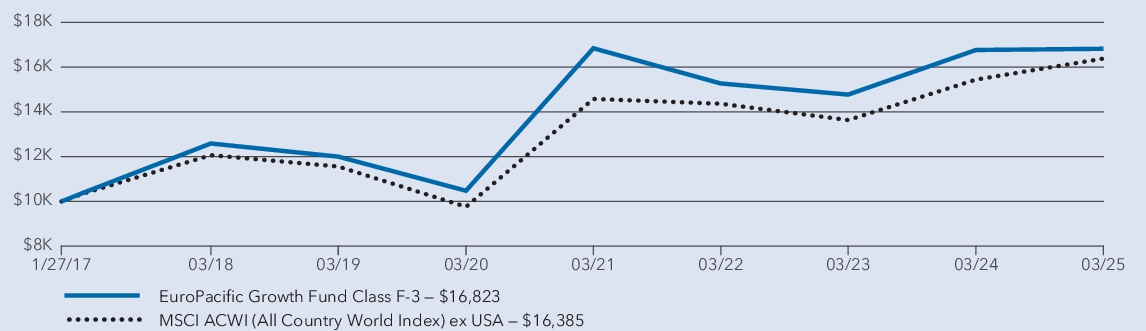
The fund’s Class F-3 shares gained 0.31% for the year ended March 31, 2025. That result compares with a 6.09% gain for the MSCI ACWI (All Country World Index) ex USA. For information on returns for additional periods, including the fund lifetime, please refer to .
capitalgroup.com/mutual-fund-returns-F3
What factors influenced results
European stocks rose, aided by looser monetary policy as economic growth remained sluggish. U.K. markets advanced amid slight growth in gross domestic product and persistent inflation. Japanese stocks fell modestly as economic growth remained frail and the Bank of Japan nudged up interest rates. Stocks in China surged, fueled by government stimulus and enthusiasm for the technology sector. India saw a slight positive return in a year marked by weakening economic growth.
Holdings in most equity sectors produced positive returns for the fund, with communication services, financials and utilities particularly additive. Likewise, consumer staples, industrials and real estate saw returns surpassing those of the overall portfolio. Geographically, investments in companies based in the eurozone and the U.K. were significant contributors to absolute returns.
Conversely, the fund’s holdings in the health care, energy and materials sectors detracted from returns. Likewise, holdings in Japan and other European regions had negative returns overall.
Average annual total returns
1 year | 5 years | Since inception 1 | |
| EuroPacific Growth Fund — Class F-3 2 | 0.31 % | 9.93 % | 6.57 % |
| MSCI ACWI (All Country World Index) ex USA 3 | 6.09 % | 10.92 % | 6.23 % |
1
Class F-3 shares were first offered on January 27, 2017.2
Investment results assume all distributions are reinvested and reflect applicable fees and expenses. When applicable, results reflect fee waivers and/or expense reimbursements, without which they would have been lower.3
Results assume all distributions are reinvested. Any market index shown is unmanaged, and therefore, has no expenses. Investors cannot invest directly in an index. Source(s): MSCI.Key fund statistics
| Fund net assets (in millions) | $ 124,209 |
| Total number of portfolio holdings | 342 |
| Total advisory fees paid (in millions) | $ 561 |
| Portfolio turnover rate | 35 % |
Portfolio holdings by sector
(percent of net assets)
Material fund changes
This is a summary of certain changes to the fund since April 1, 2024. For more complete information, you may review the fund’s next prospectus, which we expect to be available by June 1, 2025 at or upon request at
capitalgroup.com/mutual-fund-literature-F3
(800) 421-4225
.Effective June 1, 2025, the fund name is EUPAC Fund.
capitalgroup.com/mutual-fund-literature-F3
(800) 421-4225
.
capitalgroup.com/mutual-fund-literature-529A
(800) 421-4225
.
What were the fund costs for the last year?
(based on a hypothetical $10,000 investment)Share class | Costs of a $10,000 investment | Costs paid as a percentage of a $10,000 investment |
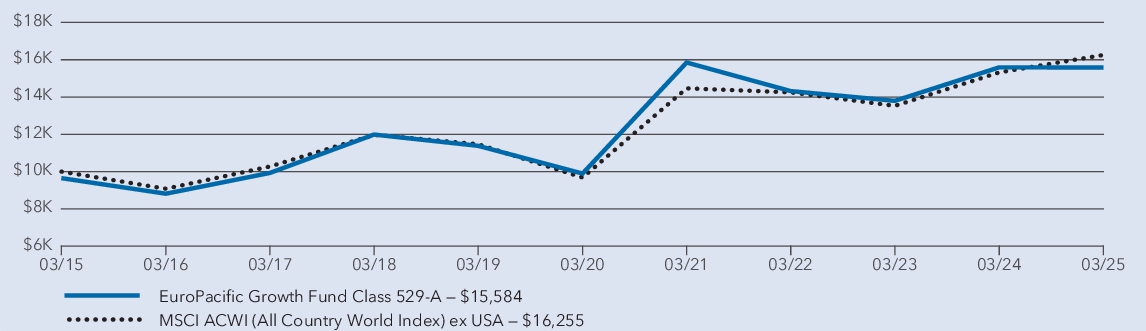
| Class 529-A | $ 85 | 0.85 % |
Management's discussion of fund performance
The fund’s Class 529-A shares lost 0.06% for the year ended March 31, 2025. That result compares with a 6.09% gain for the MSCI ACWI (All Country World Index) ex USA. For information on returns for additional periods, including the fund lifetime, please refer to .
capitalgroup.com/mutual-fund-returns-529A
What factors influenced results
European stocks rose, aided by looser monetary policy as economic growth remained sluggish. U.K. markets advanced amid slight growth in gross domestic product and persistent inflation. Japanese stocks fell modestly as economic growth remained frail and the Bank of Japan nudged up interest rates. Stocks in China surged, fueled by government stimulus and enthusiasm for the technology sector. India saw a slight positive return in a year marked by weakening economic growth.
Holdings in most equity sectors produced positive returns for the fund, with communication services, financials and utilities particularly additive. Likewise, consumer staples, industrials and real estate saw returns surpassing those of the overall portfolio. Geographically, investments in companies based in the eurozone and the U.K. were significant contributors to absolute returns.
Conversely, the fund’s holdings in the health care, energy and materials sectors detracted from returns. Likewise, holdings in Japan and other European regions had negative returns overall.
Average annual total returns
1 year | 5 years | 10 years | |
| EuroPacific Growth Fund — Class 529-A (with sales charge) * | (3.56 ) % | 8.73 % | 4.54 % |
| EuroPacific Growth Fund — Class 529-A (without sales charge) * | (0.06 ) % | 9.51 % | 4.91 % |
| MSCI ACWI (All Country World Index) ex USA † | 6.09 % | 10.92 % | 4.98 % |
*
Investment results assume all distributions are reinvested and reflect applicable fees and expenses. When applicable, results reflect fee waivers and/or expense reimbursements, without which they would have been lower.†
Results assume all distributions are reinvested. Any market index shown is unmanaged, and therefore, has no expenses. Investors cannot invest directly in an index. Source(s): MSCI.Key fund statistics
| Fund net assets (in millions) | $ 124,209 |
| Total number of portfolio holdings | 342 |
| Total advisory fees paid (in millions) | $ 561 |
| Portfolio turnover rate | 35 % |
Portfolio holdings by sector
(percent of net assets)
Material fund changes
This is a summary of certain changes to the fund since April 1, 2024. For more complete information, you may review the fund’s next prospectus, which we expect to be available by June 1, 2025 at or upon request at
capitalgroup.com/mutual-fund-literature-529A
(800) 421-4225
.Effective June 1, 2025, the fund name is EUPAC Fund.
capitalgroup.com/mutual-fund-literature-529A
(800) 421-4225
.
capitalgroup.com/mutual-fund-literature-529C
(800) 421-4225
.
What were the fund costs for the last year?
(based on a hypothetical $10,000 investment)Share class | Costs of a $10,000 investment | Costs paid as a percentage of a $10,000 investment |
| Class 529-C | $ 158 | 1.59 % |
Management's discussion of fund performance
The fund’s Class 529-C shares lost 0.81% for the year ended March 31, 2025. That result compares with a 6.09% gain for the MSCI ACWI (All Country World Index) ex USA. For information on returns for additional periods, including the fund lifetime, please refer to .
capitalgroup.com/mutual-fund-returns-529C
What factors influenced results
European stocks rose, aided by looser monetary policy as economic growth remained sluggish. U.K. markets advanced amid slight growth in gross domestic product and persistent inflation. Japanese stocks fell modestly as economic growth remained frail and the Bank of Japan nudged up interest rates. Stocks in China surged, fueled by government stimulus and enthusiasm for the technology sector. India saw a slight positive return in a year marked by weakening economic growth.
Holdings in most equity sectors produced positive returns for the fund, with communication services, financials and utilities particularly additive. Likewise, consumer staples, industrials and real estate saw returns surpassing those of the overall portfolio. Geographically, investments in companies based in the eurozone and the U.K. were significant contributors to absolute returns.
Conversely, the fund’s holdings in the health care, energy and materials sectors detracted from returns. Likewise, holdings in Japan and other European regions had negative returns overall.

Average annual total returns
1 year | 5 years | 10 years | |
| EuroPacific Growth Fund — Class 529-C (with sales charge) * | (1.75 ) % | 8.68 % | 4.51 % |
| EuroPacific Growth Fund — Class 529-C (without sales charge) * | (0.81 ) % | 8.68 % | 4.51 % |
| MSCI ACWI (All Country World Index) ex USA † | 6.09 % | 10.92 % | 4.98 % |
*
Investment results assume all distributions are reinvested and reflect applicable fees and expenses. When applicable, results reflect fee waivers and/or expense reimbursements, without which they would have been lower.†
Results assume all distributions are reinvested. Any market index shown is unmanaged, and therefore, has no expenses. Investors cannot invest directly in an index. Source(s): MSCI.Key fund statistics
| Fund net assets (in millions) | $ 124,209 |
| Total number of portfolio holdings | 342 |
| Total advisory fees paid (in millions) | $ 561 |
| Portfolio turnover rate | 35 % |
Portfolio holdings by sector
(percent of net assets)
Material fund changes
This is a summary of certain changes to the fund since April 1, 2024. For more complete information, you may review the fund’s next prospectus, which we expect to be available by June 1, 2025 at or upon request at
capitalgroup.com/mutual-fund-literature-529C
(800) 421-4225
.Effective June 1, 2025, the fund name is EUPAC Fund.
capitalgroup.com/mutual-fund-literature-529C
(800) 421-4225
.
capitalgroup.com/mutual-fund-literature-529E
(800) 421-4225
.
What were the fund costs for the last year?
(based on a hypothetical $10,000 investment)Share class | Costs of a $10,000 investment | Costs paid as a percentage of a $10,000 investment |
| Class 529-E | $ 108 | 1.08 % |
Management's discussion of fund performance
The fund’s Class 529-E shares lost 0.28% for the year ended March 31, 2025. That result compares with a 6.09% gain for the MSCI ACWI (All Country World Index) ex USA. For information on returns for additional periods, including the fund lifetime, please refer to .
capitalgroup.com/mutual-fund-returns-529E
What factors influenced results
European stocks rose, aided by looser monetary policy as economic growth remained sluggish. U.K. markets advanced amid slight growth in gross domestic product and persistent inflation. Japanese stocks fell modestly as economic growth remained frail and the Bank of Japan nudged up interest rates. Stocks in China surged, fueled by government stimulus and enthusiasm for the technology sector. India saw a slight positive return in a year marked by weakening economic growth.
Holdings in most equity sectors produced positive returns for the fund, with communication services, financials and utilities particularly additive. Likewise, consumer staples, industrials and real estate saw returns surpassing those of the overall portfolio. Geographically, investments in companies based in the eurozone and the U.K. were significant contributors to absolute returns.
Conversely, the fund’s holdings in the health care, energy and materials sectors detracted from returns. Likewise, holdings in Japan and other European regions had negative returns overall.

Average annual total returns
1 year | 5 years | 10 years | |
| EuroPacific Growth Fund — Class 529-E * | (0.28 ) % | 9.26 % | 4.67 % |
| MSCI ACWI (All Country World Index) ex USA † | 6.09 % | 10.92 % | 4.98 % |
*
Investment results assume all distributions are reinvested and reflect applicable fees and expenses. When applicable, results reflect fee waivers and/or expense reimbursements, without which they would have been lower.†
Results assume all distributions are reinvested. Any market index shown is unmanaged, and therefore, has no expenses. Investors cannot invest directly in an index. Source(s): MSCI.Key fund statistics
| Fund net assets (in millions) | $ 124,209 |
| Total number of portfolio holdings | 342 |
| Total advisory fees paid (in millions) | $ 561 |
| Portfolio turnover rate | 35 % |
Portfolio holdings by sector
(percent of net assets)
Material fund changes
This is a summary of certain changes to the fund since April 1, 2024. For more complete information, you may review the fund’s next prospectus, which we expect to be available by June 1, 2025 at or upon request at
capitalgroup.com/mutual-fund-literature-529E
(800) 421-4225
.Effective June 1, 2025, the fund name is EUPAC Fund.
capitalgroup.com/mutual-fund-literature-529E
(800) 421-4225
.
capitalgroup.com/mutual-fund-literature
(800) 421-4225
.
What were the fund costs for the last year?
(based on a hypothetical $10,000 investment)Share class | Costs of a $10,000 investment | Costs paid as a percentage of a $10,000 investment |
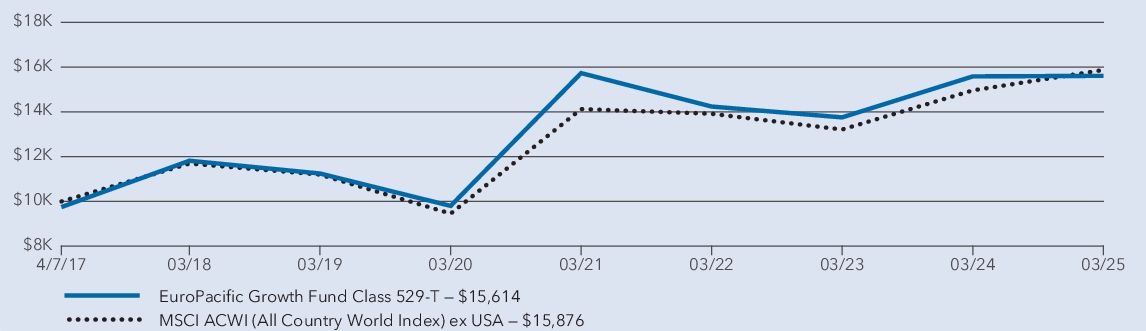
| Class 529-T | $ 62 | 0.62 % |
Management's discussion of fund performance
The fund’s Class 529-T shares gained 0.15% for the year ended March 31, 2025. That result compares with a 6.09% gain for the MSCI ACWI (All Country World Index) ex USA.
What factors influenced results
European stocks rose, aided by looser monetary policy as economic growth remained sluggish. U.K. markets advanced amid slight growth in gross domestic product and persistent inflation. Japanese stocks fell modestly as economic growth remained frail and the Bank of Japan nudged up interest rates. Stocks in China surged, fueled by government stimulus and enthusiasm for the technology sector. India saw a slight positive return in a year marked by weakening economic growth.
Holdings in most equity sectors produced positive returns for the fund, with communication services, financials and utilities particularly additive. Likewise, consumer staples, industrials and real estate saw returns surpassing those of the overall portfolio. Geographically, investments in companies based in the eurozone and the U.K. were significant contributors to absolute returns.
Conversely, the fund’s holdings in the health care, energy and materials sectors detracted from returns. Likewise, holdings in Japan and other European regions had negative returns overall.
Average annual total returns
1 year | 5 years | Since inception 1 | |
| EuroPacific Growth Fund — Class 529-T (with sales charge) 2 | (2.35 ) % | 9.20 % | 5.74 % |
| EuroPacific Growth Fund — Class 529-T (without sales charge) 2 | 0.15 % | 9.76 % | 6.08 % |
| MSCI ACWI (All Country World Index) ex USA 3 | 6.09 % | 10.92 % | 5.96 % |
1
Class 529-T shares were first offered on April 7, 2017.2
Investment results assume all distributions are reinvested and reflect applicable fees and expenses. When applicable, results reflect fee waivers and/or expense reimbursements, without which they would have been lower.3
Results assume all distributions are reinvested. Any market index shown is unmanaged, and therefore, has no expenses. Investors cannot invest directly in an index. Source(s): MSCI.Key fund statistics
| Fund net assets (in millions) | $ 124,209 |
| Total number of portfolio holdings | 342 |
| Total advisory fees paid (in millions) | $ 561 |
| Portfolio turnover rate | 35 % |
Portfolio holdings by sector
(percent of net assets)
Material fund changes
This is a summary of certain changes to the fund since April 1, 2024. For more complete information, you may review the fund’s next prospectus, which we expect to be available by June 1, 2025 at or upon request at
capitalgroup.com/mutual-fund-literature
(800) 421-4225
.Effective June 1, 2025, the fund name is EUPAC Fund.
capitalgroup.com/mutual-fund-literature
(800) 421-4225
.
capitalgroup.com/mutual-fund-literature-529F1
(800) 421-4225
.
What were the fund costs for the last year?
(based on a hypothetical $10,000 investment)Share class | Costs of a $10,000 investment | Costs paid as a percentage of a $10,000 investment |
| Class 529-F-1 | $ 67 | 0.67 % |
Management's discussion of fund performance
The fund’s Class 529-F-1 shares gained 0.10% for the year ended March 31, 2025. That result compares with a 6.09% gain for the MSCI ACWI (All Country World Index) ex USA. For information on returns for additional periods, including the fund lifetime, please refer to .
capitalgroup.com/mutual-fund-returns-529F1
What factors influenced results
European stocks rose, aided by looser monetary policy as economic growth remained sluggish. U.K. markets advanced amid slight growth in gross domestic product and persistent inflation. Japanese stocks fell modestly as economic growth remained frail and the Bank of Japan nudged up interest rates. Stocks in China surged, fueled by government stimulus and enthusiasm for the technology sector. India saw a slight positive return in a year marked by weakening economic growth.
Holdings in most equity sectors produced positive returns for the fund, with communication services, financials and utilities particularly additive. Likewise, consumer staples, industrials and real estate saw returns surpassing those of the overall portfolio. Geographically, investments in companies based in the eurozone and the U.K. were significant contributors to absolute returns.
Conversely, the fund’s holdings in the health care, energy and materials sectors detracted from returns. Likewise, holdings in Japan and other European regions had negative returns overall.

Average annual total returns
1 year | 5 years | 10 years | |
| EuroPacific Growth Fund — Class 529-F-1 * | 0.10 % | 9.71 % | 5.12 % |
| MSCI ACWI (All Country World Index) ex USA † | 6.09 % | 10.92 % | 4.98 % |
*
Investment results assume all distributions are reinvested and reflect applicable fees and expenses. When applicable, results reflect fee waivers and/or expense reimbursements, without which they would have been lower.†
Results assume all distributions are reinvested. Any market index shown is unmanaged, and therefore, has no expenses. Investors cannot invest directly in an index. Source(s): MSCI.Key fund statistics
| Fund net assets (in millions) | $ 124,209 |
| Total number of portfolio holdings | 342 |
| Total advisory fees paid (in millions) | $ 561 |
| Portfolio turnover rate | 35 % |
Portfolio holdings by sector
(percent of net assets)
Material fund changes
This is a summary of certain changes to the fund since April 1, 2024. For more complete information, you may review the fund’s next prospectus, which we expect to be available by June 1, 2025 at or upon request at
capitalgroup.com/mutual-fund-literature-529F1
(800) 421-4225
.Effective June 1, 2025, the fund name is EUPAC Fund.
capitalgroup.com/mutual-fund-literature-529F1
(800) 421-4225
.
capitalgroup.com/mutual-fund-literature-529F2
(800) 421-4225
.
What were the fund costs for the last year?
(based on a hypothetical $10,000 investment)Share class | Costs of a $10,000 investment | Costs paid as a percentage of a $10,000 investment |
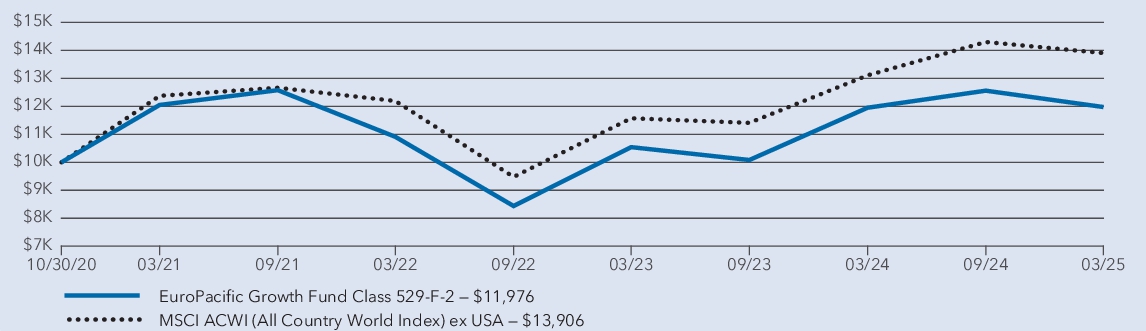
| Class 529-F-2 | $ 59 | 0.59 % |
Management's discussion of fund performance
The fund’s Class 529-F-2 shares gained 0.21% for the year ended March 31, 2025. That result compares with a 6.09% gain for the MSCI ACWI (All Country World Index) ex USA. For information on returns for additional periods, including the fund lifetime, please refer to .
capitalgroup.com/mutual-fund-returns-529F2
What factors influenced results
European stocks rose, aided by looser monetary policy as economic growth remained sluggish. U.K. markets advanced amid slight growth in gross domestic product and persistent inflation. Japanese stocks fell modestly as economic growth remained frail and the Bank of Japan nudged up interest rates. Stocks in China surged, fueled by government stimulus and enthusiasm for the technology sector. India saw a slight positive return in a year marked by weakening economic growth.
Holdings in most equity sectors produced positive returns for the fund, with communication services, financials and utilities particularly additive. Likewise, consumer staples, industrials and real estate saw returns surpassing those of the overall portfolio. Geographically, investments in companies based in the eurozone and the U.K. were significant contributors to absolute returns.
Conversely, the fund’s holdings in the health care, energy and materials sectors detracted from returns. Likewise, holdings in Japan and other European regions had negative returns overall.
Average annual total returns
1 year | Since inception 1 | |
| EuroPacific Growth Fund — Class 529-F-2 2 | 0.21 % | 4.17 % |
| MSCI ACWI (All Country World Index) ex USA 3 | 6.09 % | 7.75 % |
1
Class 529-F-2 shares were first offered on October 30, 2020.2
Investment results assume all distributions are reinvested and reflect applicable fees and expenses. When applicable, results reflect fee waivers and/or expense reimbursements, without which they would have been lower.3
Results assume all distributions are reinvested. Any market index shown is unmanaged, and therefore, has no expenses. Investors cannot invest directly in an index. Source(s): MSCI.Key fund statistics
| Fund net assets (in millions) | $ 124,209 |
| Total number of portfolio holdings | 342 |
| Total advisory fees paid (in millions) | $ 561 |
| Portfolio turnover rate | 35 % |
Portfolio holdings by sector
(percent of net assets)
Material fund changes
This is a summary of certain changes to the fund since April 1, 2024. For more complete information, you may review the fund’s next prospectus, which we expect to be available by June 1, 2025 at or upon request at
capitalgroup.com/mutual-fund-literature-529F2
(800) 421-4225
.Effective June 1, 2025, the fund name is EUPAC Fund.
capitalgroup.com/mutual-fund-literature-529F2
(800) 421-4225
.
capitalgroup.com/mutual-fund-literature-529F3
(800) 421-4225
.
What were the fund costs for the last year?
(based on a hypothetical $10,000 investment)Share class | Costs of a $10,000 investment | Costs paid as a percentage of a $10,000 investment |
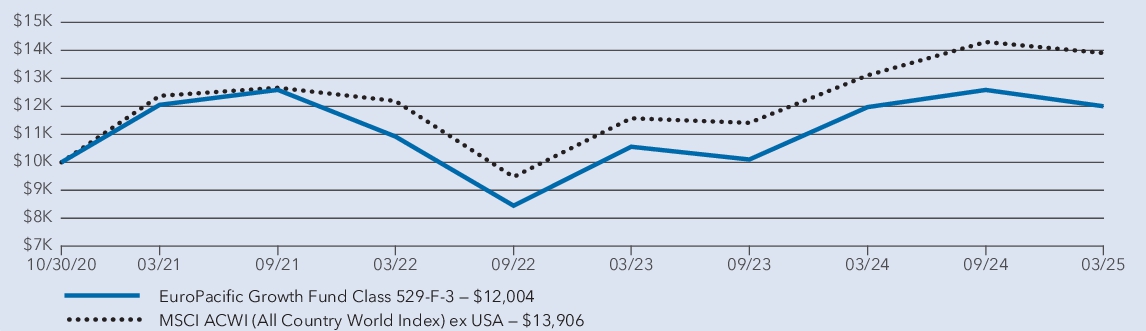
| Class 529-F-3 | $ 52 | 0.52 % |
Management's discussion of fund performance
The fund’s Class 529-F-3 shares gained 0.26% for the year ended March 31, 2025. That result compares with a 6.09% gain for the MSCI ACWI (All Country World Index) ex USA. For information on returns for additional periods, including the fund lifetime, please refer to .
capitalgroup.com/mutual-fund-returns-529F3
What factors influenced results
European stocks rose, aided by looser monetary policy as economic growth remained sluggish. U.K. markets advanced amid slight growth in gross domestic product and persistent inflation. Japanese stocks fell modestly as economic growth remained frail and the Bank of Japan nudged up interest rates. Stocks in China surged, fueled by government stimulus and enthusiasm for the technology sector. India saw a slight positive return in a year marked by weakening economic growth.
Holdings in most equity sectors produced positive returns for the fund, with communication services, financials and utilities particularly additive. Likewise, consumer staples, industrials and real estate saw returns surpassing those of the overall portfolio. Geographically, investments in companies based in the eurozone and the U.K. were significant contributors to absolute returns.
Conversely, the fund’s holdings in the health care, energy and materials sectors detracted from returns. Likewise, holdings in Japan and other European regions had negative returns overall.
Average annual total returns
1 year | Since inception 1 | |
| EuroPacific Growth Fund — Class 529-F-3 2 | 0.26 % | 4.23 % |
| MSCI ACWI (All Country World Index) ex USA 3 | 6.09 % | 7.75 % |
1
Class 529-F-3 shares were first offered on October 30, 2020.2
Investment results assume all distributions are reinvested and reflect applicable fees and expenses. When applicable, results reflect fee waivers and/or expense reimbursements, without which they would have been lower.3
Results assume all distributions are reinvested. Any market index shown is unmanaged, and therefore, has no expenses. Investors cannot invest directly in an index. Source(s): MSCI.Key fund statistics
| Fund net assets (in millions) | $ 124,209 |
| Total number of portfolio holdings | 342 |
| Total advisory fees paid (in millions) | $ 561 |
| Portfolio turnover rate | 35 % |
Portfolio holdings by sector
(percent of net assets)
Material fund changes
This is a summary of certain changes to the fund since April 1, 2024. For more complete information, you may review the fund’s next prospectus, which we expect to be available by June 1, 2025 at or upon request at
capitalgroup.com/mutual-fund-literature-529F3
(800) 421-4225
.Effective June 1, 2025, the fund name is EUPAC Fund.
capitalgroup.com/mutual-fund-literature-529F3
(800) 421-4225
.
capitalgroup.com/mutual-fund-literature-R1
(800) 421-4225
.
What were the fund costs for the last year?
(based on a hypothetical $10,000 investment)Share class | Costs of a $10,000 investment | Costs paid as a percentage of a $10,000 investment |
| Class R-1 | $ 155 | 1.56 % |
Management's discussion of fund performance
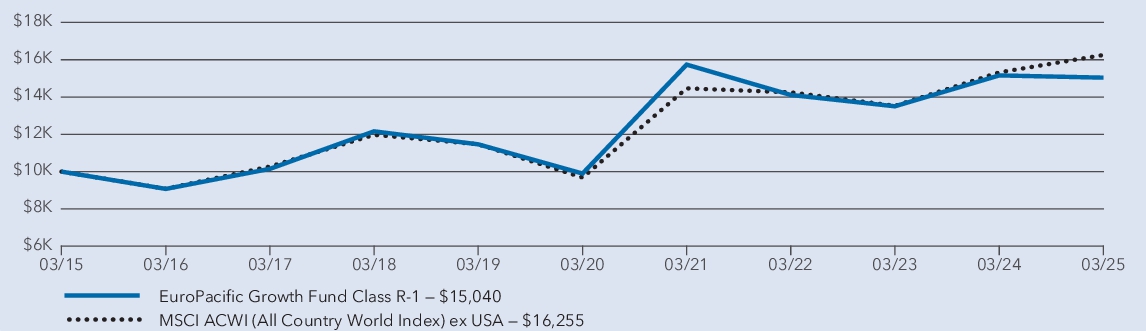
The fund’s Class R-1 shares lost 0.78% for the year ended March 31, 2025. That result compares with a 6.09% gain for the MSCI ACWI (All Country World Index) ex USA. For information on returns for additional periods, including the fund lifetime, please refer to .
capitalgroup.com/mutual-fund-returns-R1
What factors influenced results
European stocks rose, aided by looser monetary policy as economic growth remained sluggish. U.K. markets advanced amid slight growth in gross domestic product and persistent inflation. Japanese stocks fell modestly as economic growth remained frail and the Bank of Japan nudged up interest rates. Stocks in China surged, fueled by government stimulus and enthusiasm for the technology sector. India saw a slight positive return in a year marked by weakening economic growth.
Holdings in most equity sectors produced positive returns for the fund, with communication services, financials and utilities particularly additive. Likewise, consumer staples, industrials and real estate saw returns surpassing those of the overall portfolio. Geographically, investments in companies based in the eurozone and the U.K. were significant contributors to absolute returns.
Conversely, the fund’s holdings in the health care, energy and materials sectors detracted from returns. Likewise, holdings in Japan and other European regions had negative returns overall.
Average annual total returns
1 year | 5 years | 10 years | |
| EuroPacific Growth Fund — Class R-1 * | (0.78 ) % | 8.73 % | 4.16 % |
| MSCI ACWI (All Country World Index) ex USA † | 6.09 % | 10.92 % | 4.98 % |
*
Investment results assume all distributions are reinvested and reflect applicable fees and expenses. When applicable, results reflect fee waivers and/or expense reimbursements, without which they would have been lower.†
Results assume all distributions are reinvested. Any market index shown is unmanaged, and therefore, has no expenses. Investors cannot invest directly in an index. Source(s): MSCI.Key fund statistics
| Fund net assets (in millions) | $ 124,209 |
| Total number of portfolio holdings | 342 |
| Total advisory fees paid (in millions) | $ 561 |
| Portfolio turnover rate | 35 % |
Portfolio holdings by sector
(percent of net assets)
Material fund changes
This is a summary of certain changes to the fund since April 1, 2024. For more complete information, you may review the fund’s next prospectus, which we expect to be available by June 1, 2025 at or upon request at
capitalgroup.com/mutual-fund-literature-R1
(800) 421-4225
.Effective June 1, 2025, the fund name is EUPAC Fund.
capitalgroup.com/mutual-fund-literature-R1
(800) 421-4225
.
capitalgroup.com/mutual-fund-literature-R2
(800) 421-4225
.
What were the fund costs for the last year?
(based on a hypothetical $10,000 investment)Share class | Costs of a $10,000 investment | Costs paid as a percentage of a $10,000 investment |
| Class R-2 | $ 155 | 1.56 % |
Management's discussion of fund performance
The fund’s Class R-2 shares lost 0.76% for the year ended March 31, 2025. That result compares with a 6.09% gain for the MSCI ACWI (All Country World Index) ex USA. For information on returns for additional periods, including the fund lifetime, please refer to .
capitalgroup.com/mutual-fund-returns-R2
What factors influenced results
European stocks rose, aided by looser monetary policy as economic growth remained sluggish. U.K. markets advanced amid slight growth in gross domestic product and persistent inflation. Japanese stocks fell modestly as economic growth remained frail and the Bank of Japan nudged up interest rates. Stocks in China surged, fueled by government stimulus and enthusiasm for the technology sector. India saw a slight positive return in a year marked by weakening economic growth.
Holdings in most equity sectors produced positive returns for the fund, with communication services, financials and utilities particularly additive. Likewise, consumer staples, industrials and real estate saw returns surpassing those of the overall portfolio. Geographically, investments in companies based in the eurozone and the U.K. were significant contributors to absolute returns.
Conversely, the fund’s holdings in the health care, energy and materials sectors detracted from returns. Likewise, holdings in Japan and other European regions had negative returns overall.

Average annual total returns
1 year | 5 years | 10 years | |
| EuroPacific Growth Fund — Class R-2 * | (0.76 ) % | 8.74 % | 4.18 % |
| MSCI ACWI (All Country World Index) ex USA † | 6.09 % | 10.92 % | 4.98 % |
*
Investment results assume all distributions are reinvested and reflect applicable fees and expenses. When applicable, results reflect fee waivers and/or expense reimbursements, without which they would have been lower.†
Results assume all distributions are reinvested. Any market index shown is unmanaged, and therefore, has no expenses. Investors cannot invest directly in an index. Source(s): MSCI.Key fund statistics
| Fund net assets (in millions) | $ 124,209 |
| Total number of portfolio holdings | 342 |
| Total advisory fees paid (in millions) | $ 561 |
| Portfolio turnover rate | 35 % |
Portfolio holdings by sector
(percent of net assets)
Material fund changes
This is a summary of certain changes to the fund since April 1, 2024. For more complete information, you may review the fund’s next prospectus, which we expect to be available by June 1, 2025 at or upon request at
capitalgroup.com/mutual-fund-literature-R2
(800) 421-4225
.Effective June 1, 2025, the fund name is EUPAC Fund.
capitalgroup.com/mutual-fund-literature-R2
(800) 421-4225
.
capitalgroup.com/mutual-fund-literature-R2E
(800) 421-4225
.
What were the fund costs for the last year?
(based on a hypothetical $10,000 investment
)Share class | Costs of a $10,000 investment | Costs paid as a percentage of a $10,000 investment |
| Class R-2E | $ 127 | 1.27 % |
Management's discussion of fund performance
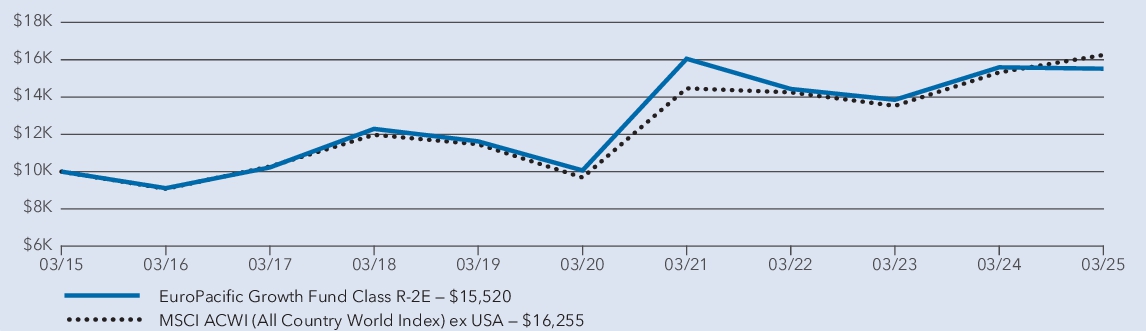
The fund’s Class R-2E shares lost 0.48% for the year ended March 31, 2025. That result compares with a 6.09% gain for the MSCI ACWI (All Country World Index) ex USA. For information on returns for additional periods, including the fund lifetime, please refer to .
capitalgroup.com/mutual-fund-returns-R2E
What factors influenced results
European stocks rose, aided by looser monetary policy as economic growth remained sluggish. U.K. markets advanced amid slight growth in gross domestic product and persistent inflation. Japanese stocks fell modestly as economic growth remained frail and the Bank of Japan nudged up interest rates. Stocks in China surged, fueled by government stimulus and enthusiasm for the technology sector. India saw a slight positive return in a year marked by weakening economic growth.
Holdings in most equity sectors produced positive returns for the fund, with communication services, financials and utilities particularly additive. Likewise, consumer staples, industrials and real estate saw returns surpassing those of the overall portfolio. Geographically, investments in companies based in the eurozone and the U.K. were significant contributors to absolute returns.
Conversely, the fund’s holdings in the health care, energy and materials sectors detracted from returns. Likewise, holdings in Japan and other European regions had negative returns overall.
Average annual total returns
1 year | 5 years | 10 years | |
| EuroPacific Growth Fund — Class R-2E * | (0.48 ) % | 9.05 % | 4.49 % |
| MSCI ACWI (All Country World Index) ex USA † | 6.09 % | 10.92 % | 4.98 % |
*
Investment results assume all distributions are reinvested and reflect applicable fees and expenses. When applicable, results reflect fee waivers and/or expense reimbursements, without which they would have been lower.†
Results assume all distributions are reinvested. Any market index shown is unmanaged, and therefore, has no expenses. Investors cannot invest directly in an index. Source(s): MSCI.Key fund statistics
| Fund net assets (in millions) | $ 124,209 |
| Total number of portfolio holdings | 342 |
| Total advisory fees paid (in millions) | $ 561 |
| Portfolio turnover rate | 35 % |
Portfolio holdings by sector
(percent of net assets)
Material fund changes
This is a summary of certain changes to the fund since April 1, 2024. For more complete information, you may review the fund’s next prospectus, which we expect to be available by June 1, 2025 at or upon request at
capitalgroup.com/mutual-fund-literature-R2E
(800) 421-4225
.Effective June 1, 2025, the fund name is EUPAC Fund.
capitalgroup.com/mutual-fund-literature-R2E
(800) 421-4225
.
capitalgroup.com/mutual-fund-literature-R3
(800) 421-4225
.
What were the fund costs for the last year?
(based on a hypothetical $10,000 investment)Share class | Costs of a $10,000 investment | Costs paid as a percentage of a $10,000 investment |
| Class R-3 | $ 111 | 1.11 % |
Management's discussion of fund performance
The fund’s Class R-3 shares lost 0.33% for the year ended March 31, 2025. That result compares with a 6.09% gain for the MSCI ACWI (All Country World Index) ex USA. For information on returns for additional periods, including the fund lifetime, please refer to .
capitalgroup.com/mutual-fund-returns-R3
What factors influenced results
European stocks rose, aided by looser monetary policy as economic growth remained sluggish. U.K. markets advanced amid slight growth in gross domestic product and persistent inflation. Japanese stocks fell modestly as economic growth remained frail and the Bank of Japan nudged up interest rates. Stocks in China surged, fueled by government stimulus and enthusiasm for the technology sector. India saw a slight positive return in a year marked by weakening economic growth.
Holdings in most equity sectors produced positive returns for the fund, with communication services, financials and utilities particularly additive. Likewise, consumer staples, industrials and real estate saw returns surpassing those of the overall portfolio. Geographically, investments in companies based in the eurozone and the U.K. were significant contributors to absolute returns.
Conversely, the fund’s holdings in the health care, energy and materials sectors detracted from returns. Likewise, holdings in Japan and other European regions had negative returns overall.

Average annual total returns
1 year | 5 years | 10 years | |
| EuroPacific Growth Fund — Class R-3 * | (0.33 ) % | 9.22 % | 4.64 % |
| MSCI ACWI (All Country World Index) ex USA † | 6.09 % | 10.92 % | 4.98 % |
*
Investment results assume all distributions are reinvested and reflect applicable fees and expenses. When applicable, results reflect fee waivers and/or expense reimbursements, without which they would have been lower.†
Results assume all distributions are reinvested. Any market index shown is unmanaged, and therefore, has no expenses. Investors cannot invest directly in an index. Source(s): MSCI.Key fund statistics
| Fund net assets (in millions) | $ 124,209 |
| Total number of portfolio holdings | 342 |
| Total advisory fees paid (in millions) | $ 561 |
| Portfolio turnover rate | 35 % |
Portfolio holdings by sector
(percent of net assets)
Material fund changes
This is a summary of certain changes to the fund since April 1, 2024. For more complete information, you may review the fund’s next prospectus, which we expect to be available by June 1, 2025 at or upon request at
capitalgroup.com/mutual-fund-literature-R3
(800) 421-4225
.Effective June 1, 2025, the fund name is EUPAC Fund.
capitalgroup.com/mutual-fund-literature-R3
(800) 421-4225
.
capitalgroup.com/mutual-fund-literature-R4
(800) 421-4225
.
What were the fund costs for the last year?
(based on a hypothetical $10,000 investment)Share class | Costs of a $10,000 investment | Costs paid as a percentage of a $10,000 investment |
| Class R-4 | $ 81 | 0.81 % |
Management's discussion of fund performance
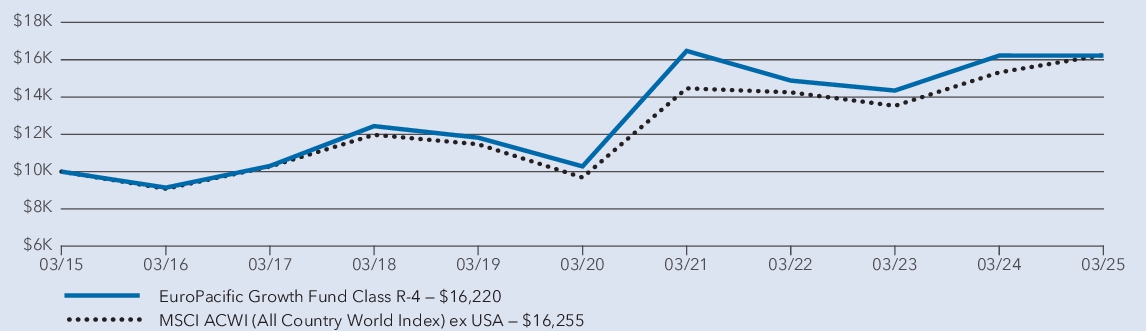
The fund’s Class R-4 shares lost 0.03% for the year ended March 31, 2025. That result compares with a 6.09% gain for the MSCI ACWI (All Country World Index) ex USA. For information on returns for additional periods, including the fund lifetime, please refer to .
capitalgroup.com/mutual-fund-returns-R4
What factors influenced results
European stocks rose, aided by looser monetary policy as economic growth remained sluggish. U.K. markets advanced amid slight growth in gross domestic product and persistent inflation. Japanese stocks fell modestly as economic growth remained frail and the Bank of Japan nudged up interest rates. Stocks in China surged, fueled by government stimulus and enthusiasm for the technology sector. India saw a slight positive return in a year marked by weakening economic growth.
Holdings in most equity sectors produced positive returns for the fund, with communication services, financials and utilities particularly additive. Likewise, consumer staples, industrials and real estate saw returns surpassing those of the overall portfolio. Geographically, investments in companies based in the eurozone and the U.K. were significant contributors to absolute returns.
Conversely, the fund’s holdings in the health care, energy and materials sectors detracted from returns. Likewise, holdings in Japan and other European regions had negative returns overall.
Average annual total returns
1 year | 5 years | 10 years | |
| EuroPacific Growth Fund — Class R-4 * | (0.03 ) % | 9.55 % | 4.96 % |
| MSCI ACWI (All Country World Index) ex USA † | 6.09 % | 10.92 % | 4.98 % |
*
Investment results assume all distributions are reinvested and reflect applicable fees and expenses. When applicable, results reflect fee waivers and/or expense reimbursements, without which they would have been lower.†
Results assume all distributions are reinvested. Any market index shown is unmanaged, and therefore, has no expenses. Investors cannot invest directly in an index. Source(s): MSCI.Key fund statistics
| Fund net assets (in millions) | $ 124,209 |
| Total number of portfolio holdings | 342 |
| Total advisory fees paid (in millions) | $ 561 |
| Portfolio turnover rate | 35 % |
Portfolio holdings by sector
(percent of net assets)
Material fund changes
This is a summary of certain changes to the fund since April 1, 2024. For more complete information, you may review the fund’s next prospectus, which we expect to be available by June 1, 2025 at or upon request at
capitalgroup.com/mutual-fund-literature-R4
(800) 421-4225
.Effective June 1, 2025, the fund name is EUPAC Fund.
capitalgroup.com/mutual-fund-literature-R4
(800) 421-4225
.
capitalgroup.com/mutual-fund-literature-R5E
(800) 421-4225
.
What were the fund costs for the last year?
(based on a hypothetical $10,000 investment)Share class | Costs of a $10,000 investment | Costs paid as a percentage of a $10,000 investment |
| Class R-5E | $ 62 | 0.62 % |
Management's discussion of fund performance
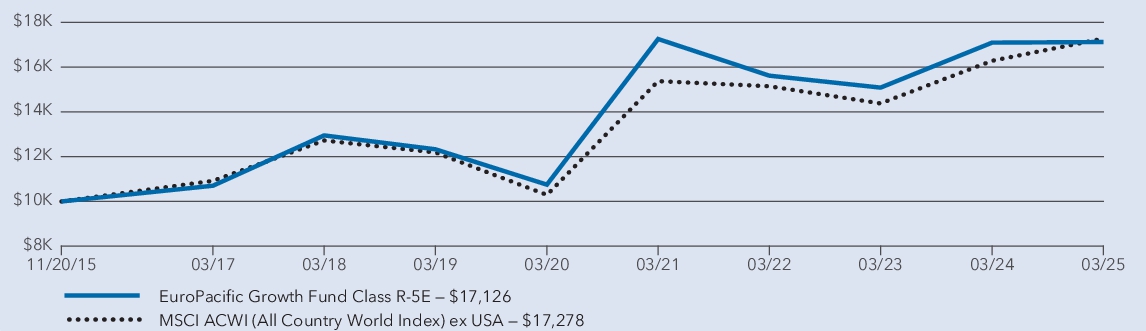
The fund’s Class R-5E shares gained 0.16% for the year ended March 31, 2025. That result compares with a 6.09% gain for the MSCI ACWI (All Country World Index) ex USA. For information on returns for additional periods, including the fund lifetime, please refer to .
capitalgroup.com/mutual-fund-returns-R5E
What factors influenced results
European stocks rose, aided by looser monetary policy as economic growth remained sluggish. U.K. markets advanced amid slight growth in gross domestic product and persistent inflation. Japanese stocks fell modestly as economic growth remained frail and the Bank of Japan nudged up interest rates. Stocks in China surged, fueled by government stimulus and enthusiasm for the technology sector. India saw a slight positive return in a year marked by weakening economic growth.
Holdings in most equity sectors produced positive returns for the fund, with communication services, financials and utilities particularly additive. Likewise, consumer staples, industrials and real estate saw returns surpassing those of the overall portfolio. Geographically, investments in companies based in the eurozone and the U.K. were significant contributors to absolute returns.
Conversely, the fund’s holdings in the health care, energy and materials sectors detracted from returns. Likewise, holdings in Japan and other European regions had negative returns overall.
Average annual total returns
1 year | 5 years | Since inception 1 | |
| EuroPacific Growth Fund — Class R-5E 2 | 0.16 % | 9.76 % | 5.92 % |
| MSCI ACWI (All Country World Index) ex USA 3 | 6.09 % | 10.92 % | 6.02 % |
1
Class R-5E shares were first offered on November 20, 2015.2
Investment results assume all distributions are reinvested and reflect applicable fees and expenses. When applicable, results reflect fee waivers and/or expense reimbursements, without which they would have been lower.3
Results assume all distributions are reinvested. Any market index shown is unmanaged, and therefore, has no expenses. Investors cannot invest directly in an index. Source(s): MSCI.Key fund statistics
| Fund net assets (in millions) | $ 124,209 |
| Total number of portfolio holdings | 342 |
| Total advisory fees paid (in millions) | $ 561 |
| Portfolio turnover rate | 35 % |
Portfolio holdings by sector
(percent of net assets)
Material fund changes
This is a summary of certain changes to the fund since April 1, 2024. For more complete information, you may review the fund’s next prospectus, which we expect to be available by June 1, 2025 at or upon request at
capitalgroup.com/mutual-fund-literature-R5E
(800) 421-4225
.Effective June 1, 2025, the fund name is EUPAC Fund.
capitalgroup.com/mutual-fund-literature-R5E
(800) 421-4225
.
capitalgroup.com/mutual-fund-literature-R5
(800) 421-4225
.
What were the fund costs for the last year?
(based on a hypothetical $10,000 investment)Share class | Costs of a $10,000 investment | Costs paid as a percentage of a $10,000 investment |
| Class R-5 | $ 51 | 0.51 % |
Management's discussion of fund performance
The fund’s Class R-5 shares gained 0.27% for the year ended March 31, 2025. That result compares with a 6.09% gain for the MSCI ACWI (All Country World Index) ex USA. For information on returns for additional periods, including the fund lifetime, please refer to .
capitalgroup.com/mutual-fund-returns-R5
What factors influenced results
European stocks rose, aided by looser monetary policy as economic growth remained sluggish. U.K. markets advanced amid slight growth in gross domestic product and persistent inflation. Japanese stocks fell modestly as economic growth remained frail and the Bank of Japan nudged up interest rates. Stocks in China surged, fueled by government stimulus and enthusiasm for the technology sector. India saw a slight positive return in a year marked by weakening economic growth.
Holdings in most equity sectors produced positive returns for the fund, with communication services, financials and utilities particularly additive. Likewise, consumer staples, industrials and real estate saw returns surpassing those of the overall portfolio. Geographically, investments in companies based in the eurozone and the U.K. were significant contributors to absolute returns.
Conversely, the fund’s holdings in the health care, energy and materials sectors detracted from returns. Likewise, holdings in Japan and other European regions had negative returns overall.
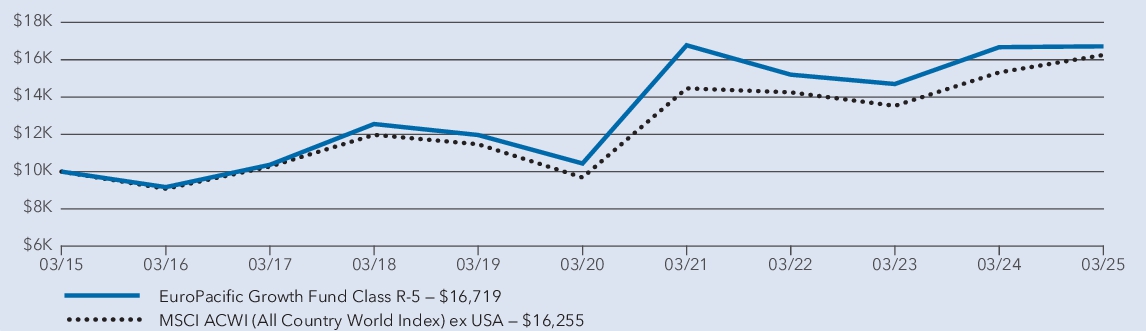
Average annual total returns
1 year | 5 years | 10 years | |
| EuroPacific Growth Fund — Class R-5 * | 0.27 % | 9.88 % | 5.27 % |
| MSCI ACWI (All Country World Index) ex USA † | 6.09 % | 10.92 % | 4.98 % |
*
Investment results assume all distributions are reinvested and reflect applicable fees and expenses. When applicable, results reflect fee waivers and/or expense reimbursements, without which they would have been lower.†
Results assume all distributions are reinvested. Any market index shown is unmanaged, and therefore, has no expenses. Investors cannot invest directly in an index. Source(s): MSCI.Key fund statistics
| Fund net assets (in millions) | $ 124,209 |
| Total number of portfolio holdings | 342 |
| Total advisory fees paid (in millions) | $ 561 |
| Portfolio turnover rate | 35 % |
Portfolio holdings by sector
(percent of net assets)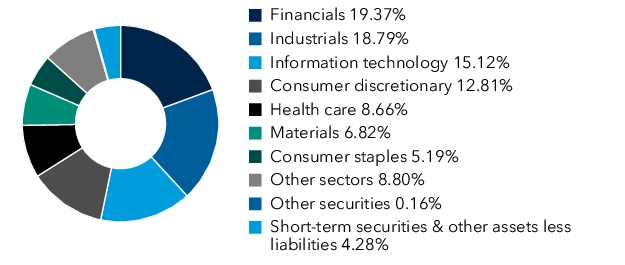
Material fund changes
This is a summary of certain changes to the fund since April 1, 2024. For more complete information, you may review the fund’s next prospectus, which we expect to be available by June 1, 2025 at or upon request at
capitalgroup.com/mutual-fund-literature-R5
(800) 421-4225
.Effective June 1, 2025, the fund name is EUPAC Fund.
capitalgroup.com/mutual-fund-literature-R5
(800) 421-4225
.
capitalgroup.com/mutual-fund-literature-R6
(800) 421-4225
.
What were the fund costs for the last year?
(based on a hypothetical $10,000 investment)Share class | Costs of a $10,000 investment | Costs paid as a percentage of a $10,000 investment |
| Class R-6 | $ 47 | 0.47 % |
Management's discussion of fund performance
The fund’s Class R-6 shares gained 0.34% for the year ended March 31, 2025. That result compares with a 6.09% gain for the MSCI ACWI (All Country World Index) ex USA. For information on returns for additional periods, including the fund lifetime, please refer to .
capitalgroup.com/mutual-fund-returns-R6
What factors influenced results
European stocks rose, aided by looser monetary policy as economic growth remained sluggish. U.K. markets advanced amid slight growth in gross domestic product and persistent inflation. Japanese stocks fell modestly as economic growth remained frail and the Bank of Japan nudged up interest rates. Stocks in China surged, fueled by government stimulus and enthusiasm for the technology sector. India saw a slight positive return in a year marked by weakening economic growth.
Holdings in most equity sectors produced positive returns for the fund, with communication services, financials and utilities particularly additive. Likewise, consumer staples, industrials and real estate saw returns surpassing those of the overall portfolio. Geographically, investments in companies based in the eurozone and the U.K. were significant contributors to absolute returns.
Conversely, the fund’s holdings in the health care, energy and materials sectors detracted from returns. Likewise, holdings in Japan and other European regions had negative returns overall.
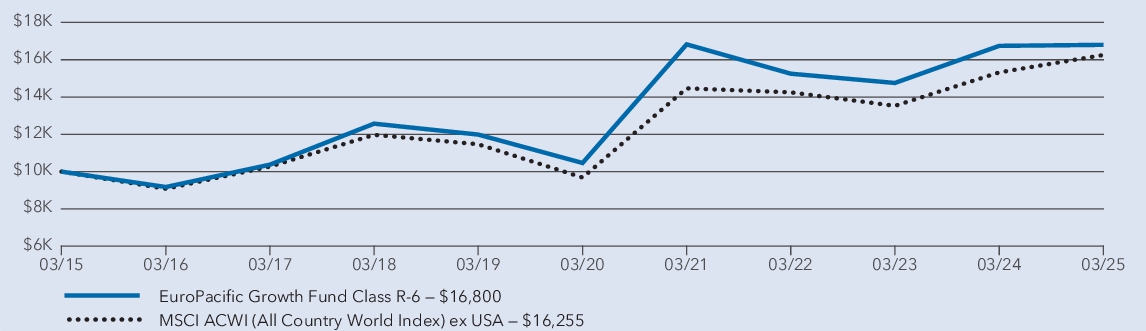
Average annual total returns
1 year | 5 years | 10 years | |
| EuroPacific Growth Fund — Class R-6 * | 0.34 % | 9.93 % | 5.33 % |
| MSCI ACWI (All Country World Index) ex USA † | 6.09 % | 10.92 % | 4.98 % |
*
Investment results assume all distributions are reinvested and reflect applicable fees and expenses. When applicable, results reflect fee waivers and/or expense reimbursements, without which they would have been lower.†
Results assume all distributions are reinvested. Any market index shown is unmanaged, and therefore, has no expenses. Investors cannot invest directly in an index. Source(s): MSCI.Key fund statistics
| Fund net assets (in millions) | $ 124,209 |
| Total number of portfolio holdings | 342 |
| Total advisory fees paid (in millions) | $ 561 |
| Portfolio turnover rate | 35 % |
Portfolio holdings by sector
(percent of net assets)
Material fund changes
This is a summary of certain changes to the fund since April 1, 2024. For more complete information, you may review the fund’s next prospectus, which we expect to be available by June 1, 2025 at or upon request at
capitalgroup.com/mutual-fund-literature-R6
(800) 421-4225
.Effective June 1, 2025, the fund name is EUPAC Fund.
capitalgroup.com/mutual-fund-literature-R6
(800) 421-4225
.