Performance Management - Reynders, McVeigh Core Equity Fund
May 28, 2025
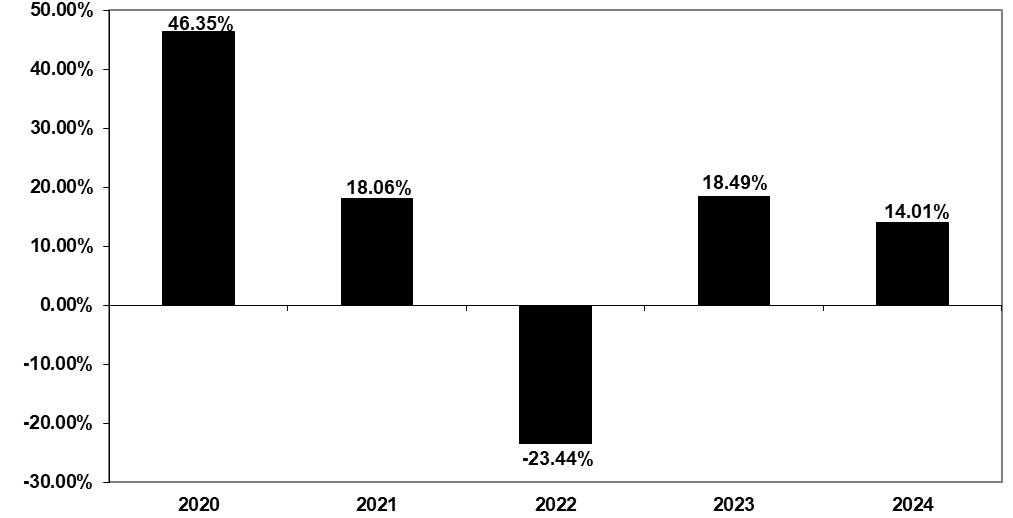
The performance information below provides some indication of the risks of investing in the Fund. The bar chart shows changes in the performance of the Institutional Shares from year to year. The table shows the average annual returns of the Institutional Shares for the periods of 1 Year, 5 Years and Since Inception compared to a broad-based market index.
Visit https://www.reyndersmcveighfunds.com/ or call 1-800-950-6868 for current performance information.
Past performance, before and after taxes, is not necessarily predictive of future performance.
Highest and Lowest Quarter Returns
(for periods shown in the bar chart)
| Highest | 4/1/2020 – 6/30/2020 | 24.82% | |
| Lowest | 4/1/2022 – 6/30/2022 | (17.87)% |
The Fund’s Institutional Shares year-to-date return as of March 31, 2025 was (1.82)%.
| 1 Year | 5 Years | Since Inception (3/29/19) | ||||
| Reynders, McVeigh Core Equity Fund | ||||||
| Institutional Shares - Before Taxes | 14.01% | 12.31% | 12.90% | |||
| Institutional Shares - After Taxes on Distributions(1) | 13.59% | 11.88% | 12.51% | |||
| Institutional Shares - After Tax on Distributions and Sale of Fund Shares(1) | 8.59% | 9.77% | 10.35% | |||
| MSCI World Index (reflects no deduction for fees, expenses or taxes)(2) | 18.67% | 11.17% | 12.07% |
| (1) | After-tax returns are estimated using the highest historical individual federal marginal income tax rates and do not reflect the impact of state and local taxes. Actual after-tax returns depend on an investor’s tax situation and may differ from those shown. After-tax returns are not relevant to investors who hold Fund shares through tax-deferred arrangements such as 401(k) plans or individual retirement accounts. After-tax returns are for Institutional Shares only. |
| (2) | The MSCI World Index is an unmanaged free float-adjusted market capitalization index that is designed to measure global developed market equity performance. Currently the MSCI World Index consists of the following 23 developed market country indices: Australia, Austria, Belgium, Canada, Denmark, Finland, France, Germany, Hong Kong, Ireland, Israel, Italy, Japan, Netherlands, New Zealand, Norway, Portugal, Singapore, Spain, Sweden, Switzerland, the United Kingdom and the United States. The performance of the index is expressed in terms of U.S. dollars, and does not reflect the deduction of fees and expenses, whereas the Fund’s returns are shown net of fees. Individuals cannot invest directly in an index; however, an individual can invest in exchange-traded funds or other investment vehicles that attempt to track the performance of a benchmark index. |