Shareholder Report
Mar. 31, 2025
USD ($)
Holding
What were the Fund’s costs for the last year ?
(based on a hypothetical $10,000 investment)
| Share Class | Costs of a $10,000 investment | Costs paid as a percentage of a $10,000 investment |
| Class A* | $65 | 0.64% |
| * |
During the period, fees were waived and/or expenses reimbursed pursuant to an agreement with the Fund’s investment adviser, BNY Mellon Investment Adviser, Inc. If this agreement is not extended in the future, expenses could be higher.
|
How did the Fund perform last year ?
-
For the 12-month period ended March 31, 2025, the Fund’s Class A shares returned 2.95%.
-
In comparison, the Bloomberg Municipal Bond 1-3 Year Blend Index (the “Index”) returned 3.48% for the same period.
What affected the Fund’s performance?
-
The municipal bond market rose during the reporting period, driven by elevated yields. High-yield municipals and shorter-dated municipals outperformed investment-grade and longer-duration municipals.
-
The Fund’s performance relative to the Index benefited from its excess yield and exposure to lower-rated municipals.
-
Longer-dated exposure, as well as exposure to essential service issuers, detracted from relative returns.
| Not FDIC Insured. Not Bank-Guaranteed. May Lose Value |
How did the Fund perform over the past 10 years?
The Fund’s past performance is not a good predictor of the Fund’s future performance. The graph and table do not reflect the deduction of taxes that a shareholder would pay on fund distributions or redemption of fund shares.
Cumulative Performance from April 1 , 2015 through March 31, 2025
Initial Investment of $10,000
Initial Investment of $10,000
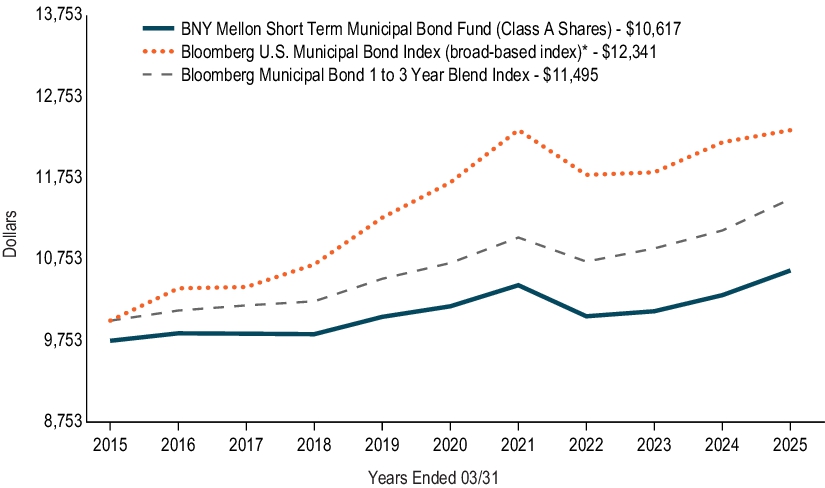
The above graph compares a hypothetical $10,000 investment in the Fund’s Class A shares to a hypothetical investment of $10,000 made in each of the Bloomberg U.S. Municipal Bond Index (a broad-based index) and Bloomberg Municipal Bond 1-3 Year Blend Index on 3/31/2015. The performance shown takes into account the maximum initial sales charge on Class A shares and applicable fees and expenses of the Fund, including management fees and other expenses. The Fund’s performance also assumes the reinvestment of dividends and capital gains. Unlike the Fund, the indexes are not subject to charges, fees and other expenses. Investors cannot invest directly in any index.
|
*
|
In accordance with regulatory changes requiring the Fund’s primary benchmark to represent the overall applicable market, the Fund’s primary prospectus benchmark changed to the indicated benchmark effective as of March 31, 2025.
|
AVERAGE ANNUAL TOTAL RETURNS (AS OF 3/31/25 )
| Class A Shares | 1YR | 5YR | 10YR | |||
| with Maximum Sales Charge - 2.50% | 0.40% | 0.34% | 0.60% | |||
| without Sales Charge | 2.95% | 0.85% | 0.85% | |||
| Bloomberg U.S. Municipal Bond Index (broad-based index)* | 1.22% | 1.07% | 2.13% | |||
| Bloomberg Municipal Bond 1-3 Year Blend Index | 3.48% | 1.43% | 1.40% |
|
*
|
In accordance with regulatory changes requiring the Fund’s primary benchmark to represent the overall applicable market, the Fund’s primary prospectus benchmark changed to the indicated benchmark effective as of March 31, 2025.
|
KEY FUND STATISTICS (AS OF 3/31/25 )
Fund Size (Millions) |
Number of Holdings |
Total Advisory Fee Paid During Period |
Annual Portfolio Turnover |
| $130 | 106 | $278,525 | 41.53% |
| Not FDIC Insured. Not Bank-Guaranteed. May Lose Value |
Portfolio Holdings (as of 3/31/25 )
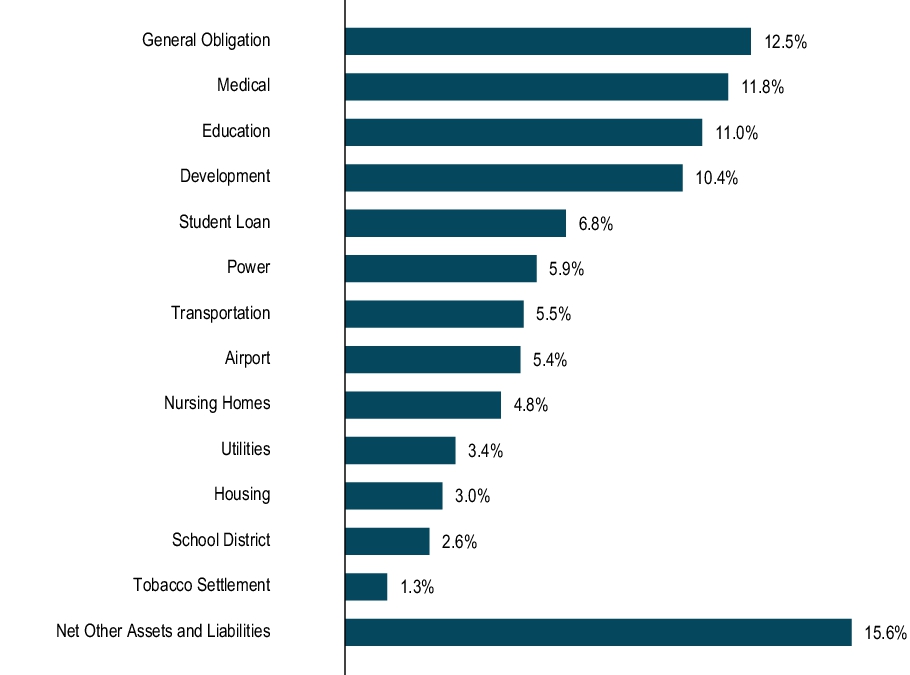
Sector Allocation (Based on Net Assets)

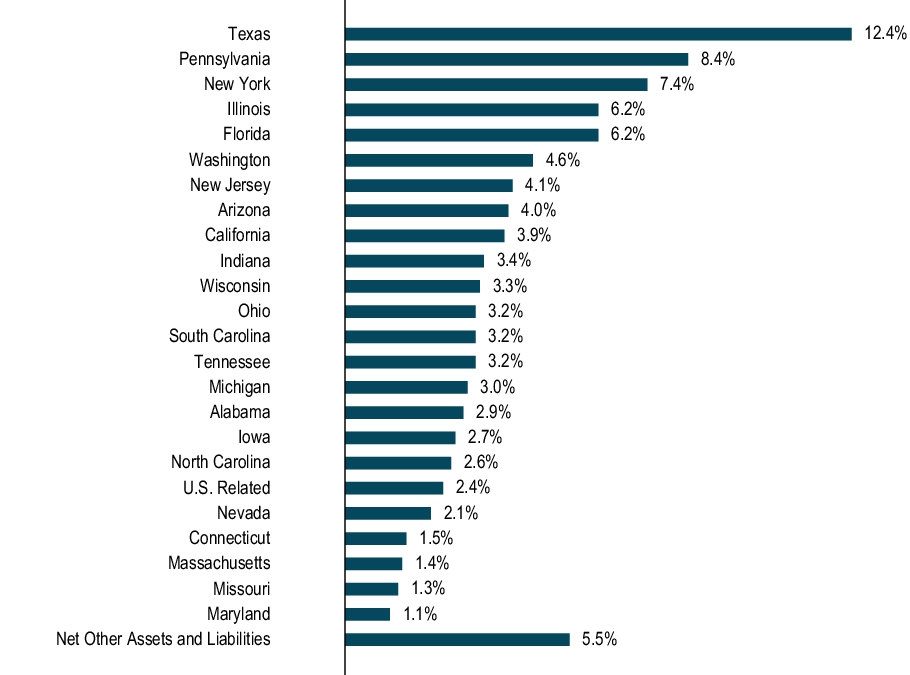
State Allocation (Based on Net Assets)
What were the Fund’s costs for the last year ?
(based on a hypothetical $10,000 investment)
| Share Class | Costs of a $10,000 investment | Costs paid as a percentage of a $10,000 investment |
| Class D* | $50 | 0.49% |
| * |
During the period, fees were waived and/or expenses reimbursed pursuant to an agreement with the Fund’s investment adviser, BNY Mellon Investment Adviser, Inc. If this agreement is not extended in the future, expenses could be higher.
|
How did the Fund perform last year ?
-
For the 12-month period ended March 31, 2025, the Fund’s Class D shares returned 3.10%.
-
In comparison, the Bloomberg Municipal Bond 1-3 Year Blend Index (the “Index”) returned 3.48% for the same period.
What affected the Fund’s performance?
-
The municipal bond market rose during the reporting period, driven by elevated yields. High-yield municipals and shorter-dated municipals outperformed investment-grade and longer-duration municipals.
-
The Fund’s performance relative to the Index benefited from its excess yield and exposure to lower-rated municipals.
-
Longer-dated exposure, as well as exposure to essential service issuers, detracted from relative returns.
| Not FDIC Insured. Not Bank-Guaranteed. May Lose Value |
How did the Fund perform over the past 10 years?
The Fund’s past performance is not a good predictor of the Fund’s future performance. The graph and table do not reflect the deduction of taxes that a shareholder would pay on fund distributions or redemption of fund shares.
Cumulative Performance from April 1 , 2015 through March 31, 2025
Initial Investment of $10,000
Initial Investment of $10,000
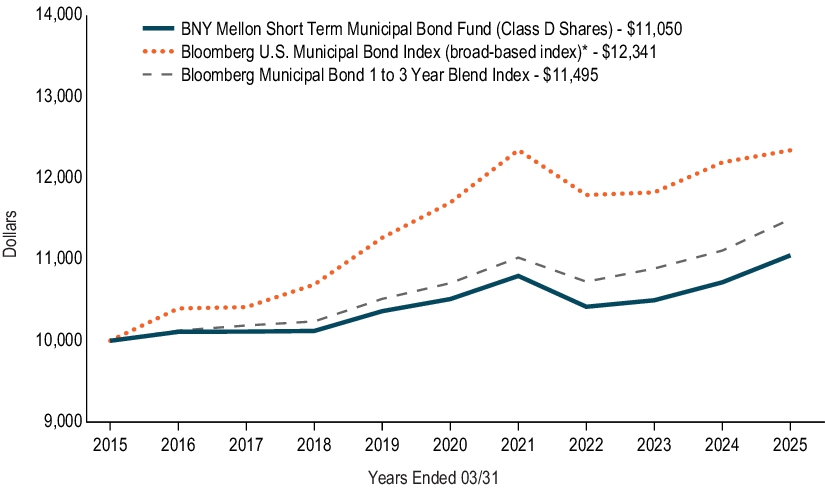
The above graph compares a hypothetical $10,000 investment in the Fund’s Class D shares to a hypothetical investment of $10,000 made in each of the Bloomberg U.S. Municipal Bond Index (a broad-based index) and Bloomberg Municipal Bond 1-3 Year Blend Index on 3/31/2015. The performance shown takes into account applicable fees and expenses of the Fund, including management fees, 12b-1 fees and other expenses. The Fund’s performance also assumes the reinvestment of dividends and capital gains. Unlike the Fund, the indexes are not subject to charges, fees and other expenses. Investors cannot invest directly in any index.
|
*
|
In accordance with regulatory changes requiring the Fund’s primary benchmark to represent the overall applicable market, the Fund’s primary prospectus benchmark changed to the indicated benchmark effective as of March 31, 2025.
|
AVERAGE ANNUAL TOTAL RETURNS (AS OF 3/31/25 )
| Share Class | 1YR | 5YR | 10YR | |||
| Class D | 3.10% | 1.00% | 1.00% | |||
| Bloomberg U.S. Municipal Bond Index (broad-based index)* | 1.22% | 1.07% | 2.13% | |||
| Bloomberg Municipal Bond 1-3 Year Blend Index | 3.48% | 1.43% | 1.40% |
|
*
|
In accordance with regulatory changes requiring the Fund’s primary benchmark to represent the overall applicable market, the Fund’s primary prospectus benchmark changed to the indicated benchmark effective as of March 31, 2025.
|
KEY FUND STATISTICS (AS OF 3/31/25 )
Fund Size (Millions) |
Number of Holdings |
Total Advisory Fee Paid During Period |
Annual Portfolio Turnover |
| $130 | 106 | $278,525 | 41.53% |
| Not FDIC Insured. Not Bank-Guaranteed. May Lose Value |
Portfolio Holdings (as of 3/31/25 )
Sector Allocation (Based on Net Assets)

State Allocation (Based on Net Assets)

What were the Fund’s costs for the last year ?
(based on a hypothetical $10,000 investment)
| Share Class | Costs of a $10,000 investment | Costs paid as a percentage of a $10,000 investment |
| Class I* | $40 | 0.39% |
| * |
During the period, fees were waived and/or expenses reimbursed pursuant to an agreement with the Fund’s investment adviser, BNY Mellon Investment Adviser, Inc. If this agreement is not extended in the future, expenses could be higher.
|
How did the Fund perform last year ?
-
For the 12-month period ended March 31, 2025, the Fund’s Class I shares returned 3.20%.
-
In comparison, the Bloomberg Municipal Bond 1-3 Year Blend Index (the “Index”) returned 3.48% for the same period.
What affected the Fund’s performance?
-
The municipal bond market rose during the reporting period, driven by elevated yields. High-yield municipals and shorter-dated municipals outperformed investment-grade and longer-duration municipals.
-
The Fund’s performance relative to the Index benefited from its excess yield and exposure to lower-rated municipals.
-
Longer-dated exposure, as well as exposure to essential service issuers, detracted from relative returns.
| Not FDIC Insured. Not Bank-Guaranteed. May Lose Value |
How did the Fund perform over the past 10 years?
The Fund’s past performance is not a good predictor of the Fund’s future performance. The graph and table do not reflect the deduction of taxes that a shareholder would pay on fund distributions or redemption of fund shares.
Cumulative Performance from April 1 , 2015 through March 31, 2025
Initial Investment of $10,000
Initial Investment of $10,000
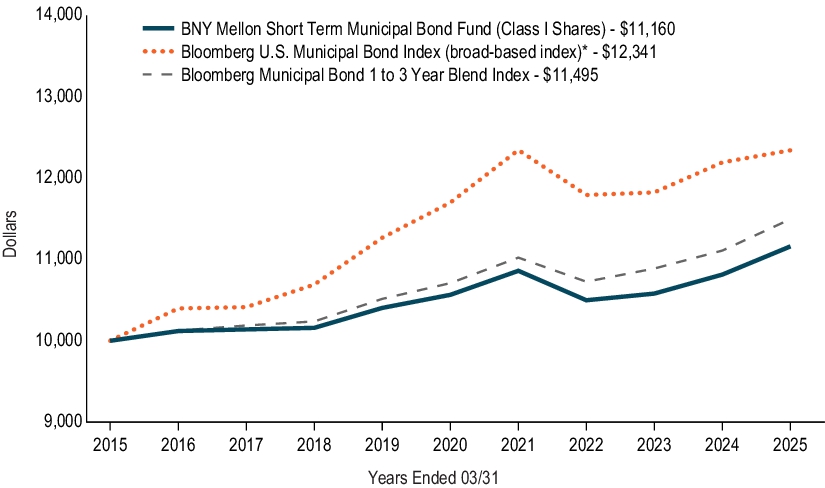
The above graph compares a hypothetical $10,000 investment in the Fund’s Class I shares to a hypothetical investment of $10,000 made in each of the Bloomberg U.S. Municipal Bond Index (a broad-based index) and Bloomberg Municipal Bond 1-3 Year Blend Index on 3/31/2015. The performance shown takes into account applicable fees and expenses of the Fund, including management fees and other expenses. The Fund’s performance also assumes the reinvestment of dividends and capital gains. Unlike the Fund, the indexes are not subject to charges, fees and other expenses. Investors cannot invest directly in any index.
|
*
|
In accordance with regulatory changes requiring the Fund’s primary benchmark to represent the overall applicable market, the Fund’s primary prospectus benchmark changed to the indicated benchmark effective as of March 31, 2025.
|
AVERAGE ANNUAL TOTAL RETURNS (AS OF 3/31/25 )
| Share Class | 1YR | 5YR | 10YR | |||
| Class I | 3.20% | 1.10% | 1.10% | |||
| Bloomberg U.S. Municipal Bond Index (broad-based index)* | 1.22% | 1.07% | 2.13% | |||
| Bloomberg Municipal Bond 1-3 Year Blend Index | 3.48% | 1.43% | 1.40% |
|
*
|
In accordance with regulatory changes requiring the Fund’s primary benchmark to represent the overall applicable market, the Fund’s primary prospectus benchmark changed to the indicated benchmark effective as of March 31, 2025.
|
KEY FUND STATISTICS (AS OF 3/31/25 )
Fund Size (Millions) |
Number of Holdings |
Total Advisory Fee Paid During Period |
Annual Portfolio Turnover |
| $130 | 106 | $278,525 | 41.53% |
| Not FDIC Insured. Not Bank-Guaranteed. May Lose Value |
Portfolio Holdings (as of 3/31/25 )
Sector Allocation (Based on Net Assets)
State Allocation (Based on Net Assets)

What were the Fund’s costs for the last year ?
(based on a hypothetical $10,000 investment)
| Share Class | Costs of a $10,000 investment | Costs paid as a percentage of a $10,000 investment |
| Class Y* | $40 | 0.39% |
| * |
During the period, fees were waived and/or expenses reimbursed pursuant to an agreement with the Fund’s investment adviser, BNY Mellon Investment Adviser, Inc. If this agreement is not extended in the future, expenses could be higher.
|
How did the Fund perform last year ?
-
For the 12-month period ended March 31, 2025, the Fund’s Class Y shares returned 3.27%.
-
In comparison, the Bloomberg Municipal Bond 1-3 Year Blend Index (the “Index”) returned 3.48% for the same period.
What affected the Fund’s performance?
-
The municipal bond market rose during the reporting period, driven by elevated yields. High-yield municipals and shorter-dated municipals outperformed investment-grade and longer-duration municipals.
-
The Fund’s performance relative to the Index benefited from its excess yield and exposure to lower-rated municipals.
-
Longer-dated exposure, as well as exposure to essential service issuers, detracted from relative returns.
| Not FDIC Insured. Not Bank-Guaranteed. May Lose Value |
How did the Fund perform over the past 10 years?
The Fund’s past performance is not a good predictor of the Fund’s future performance. The graph and table do not reflect the deduction of taxes that a shareholder would pay on fund distributions or redemption of fund shares.
Cumulative Performance from April 1 , 2015 through March 31, 2025
Initial Investment of $1,000,000
Initial Investment of $1,000,000
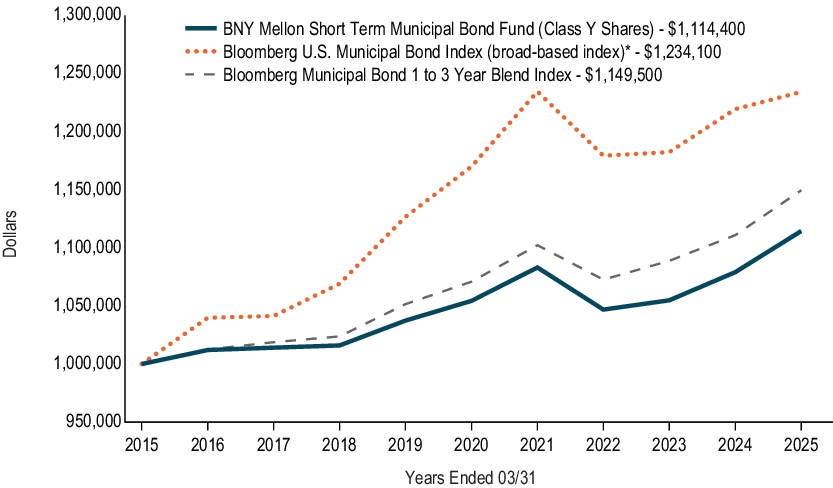
The above graph compares a hypothetical $1,000,000 investment in the Fund’s Class Y shares to a hypothetical investment of $1,000,000 made in each of the Bloomberg U.S. Municipal Bond Index (a broad-based index) and Bloomberg Municipal Bond 1-3 Year Blend Index on 3/31/2015. The performance shown takes into account applicable fees and expenses of the Fund, including management fees and other expenses. The Fund’s performance also assumes the reinvestment of dividends and capital gains. Unlike the Fund, the indexes are not subject to charges, fees and other expenses. Investors cannot invest directly in any index.
|
*
|
In accordance with regulatory changes requiring the Fund’s primary benchmark to represent the overall applicable market, the Fund’s primary prospectus benchmark changed to the indicated benchmark effective as of March 31, 2025.
|
AVERAGE ANNUAL TOTAL RETURNS (AS OF 3/31/25 )
| Share Class | 1YR | 5YR | 10YR | |||
| Class Y | 3.27% | 1.11% | 1.09% | |||
| Bloomberg U.S. Municipal Bond Index (broad-based index)* | 1.22% | 1.07% | 2.13% | |||
| Bloomberg Municipal Bond 1-3 Year Blend Index | 3.48% | 1.43% | 1.40% |
|
*
|
In accordance with regulatory changes requiring the Fund’s primary benchmark to represent the overall applicable market, the Fund’s primary prospectus benchmark changed to the indicated benchmark effective as of March 31, 2025.
|
KEY FUND STATISTICS (AS OF 3/31/25 )
Fund Size (Millions) |
Number of Holdings |
Total Advisory Fee Paid During Period |
Annual Portfolio Turnover |
| $130 | 106 | $278,525 | 41.53% |
| Not FDIC Insured. Not Bank-Guaranteed. May Lose Value |
Portfolio Holdings (as of 3/31/25 )
Sector Allocation (Based on Net Assets)

State Allocation (Based on Net Assets)

| [1] | During the period, fees were waived and/or expenses reimbursed pursuant to an agreement with the Fund’s investment adviser, BNY Mellon Investment Adviser, Inc. If this agreement is not extended in the future, expenses could be higher. |
| [2] | During the period, fees were waived and/or expenses reimbursed pursuant to an agreement with the Fund’s investment adviser, BNY Mellon Investment Adviser, Inc. If this agreement is not extended in the future, expenses could be higher. |
| [3] | During the period, fees were waived and/or expenses reimbursed pursuant to an agreement with the Fund’s investment adviser, BNY Mellon Investment Adviser, Inc. If this agreement is not extended in the future, expenses could be higher. |
| [4] | During the period, fees were waived and/or expenses reimbursed pursuant to an agreement with the Fund’s investment adviser, BNY Mellon Investment Adviser, Inc. If this agreement is not extended in the future, expenses could be higher. |