v3.25.1
Pay vs Performance Disclosure - USD ($)
1 Months Ended 5 Months Ended 12 Months Ended 19 Months Ended
Dec. 31, 2023
Nov. 30, 2023
Dec. 31, 2024
Dec. 31, 2023
Dec. 31, 2022
Dec. 31, 2021
Jul. 31, 2023
Pay vs Performance Disclosure [Table]              
Disclosure - Pay vs Performance Disclosure    
                   Value of Initial     


Summary
Compensation
Table Total
for Principal Executive
Officer (“PEO”)(1)


Compensation
Actually
Paid to PEO(2)


Average
Summary
Compensation
Table Total
for Non-PEO


Average
Compensation
Actually Paid
to Non-PEO


Fixed $100
Investment
Based on
Total
Stockholder


Net
Income
(Loss)


Year  James A. Mish   John J. Miller   Lawrence D. Firestone   James A. Mish   John J. Miller   Lawrence D. Firestone   NEOs(1)   NEOs(3)   Return(4)   ($000’s)(5) 
2024  $ N/A   $N/A   $426,678   $N/A   $ N/A   $426,678   $234,702   $(334,676)  $0.01   $(15,164)
2023  $706,778   $221,468   $32,692   $(529,515)  $25,450   $32,692   $707,165   $425,756   $0.56   $(140,775)
2022  $4,011,094   $ N/A   $N/A   $1,495,978   $N/A   $ N/A   $888,087   $411,232   $42   $(59,801)
2021  $2,534,464   $N/A   $N/A   $2,829,984   $ N/A   $N/A   $1,301,446   $1,492,488   $140   $(32,609)
       
Adjustment To PEO Compensation, Footnote [Text Block]    


Year  


PEO  


Less:
Total
Equity
Compensation


Plus:
Value Of Awards
Granted During
Current Year


Plus (Less):
Year over Year
Change in Fair Value
Of Unvested Awards


Plus (Less):
Vesting Date Value
Of Awards that Vested
During Current Year


Less: Value of
Awards Forfeited
During
Current Year


Total
Adjustments


2024  Lawrence D. Firestone  $   $   $   $   $   $ 
2023  James A. Mish  $(357,904)  $   $   $(37,677)  $(840,712)  $(1,236,293)
2023  John. J. Miller  $   $   $(191,179)  $(4,839)  $   $(196,019)
2023  Lawrence D. Firestone  $   $   $   $   $   $ 
2022  James A. Mish  $(3,025,989)  $1,272,573   $(650,700)  $(111,000)  $   $(2,515,116)
2021  James A. Mish  $(1,440,000)  $1,390,500   $   $345,000   $   $295,500 
       
Non-PEO NEO Average Total Compensation Amount     $ 234,702 $ 707,165 $ 888,087 $ 1,301,446  
Non-PEO NEO Average Compensation Actually Paid Amount [1]     $ (334,676) 425,756 411,232 1,492,488  
Adjustment to Non-PEO NEO Compensation Footnote [Text Block]    


(3)The amounts disclosed reflect the adjustments listed in the tables below to the amounts reported in the Summary Compensation Table for our non-PEO NEO’s:


Year  


Less:
Total
Equity
Compensation


Plus:
Value
Of Awards Granted
During Current Year


Plus (Less):
Year over Year
Change in Fair Value
Of Unvested Awards


Plus (Less):
Vesting Date Value
Of Awards that Vested
During Current Year


Plus:
Value of Award
Granted and Vested
During Current Year


Total
Adjustments


2024  $   $   $   $   $(567,378)  $(569,378)
2023  $(161,568)  $1,140   $(117,994)  $(2,987)  $   $(281,409)
2022  $(396,380)  $160,417   $(52,056)  $(227,908)  $39,072   $(476,855)
2021  $(736,317)  $648,900   $159,275   $119,184   $   $191,042 
       
Compensation Actually Paid vs. Total Shareholder Return [Text Block]    

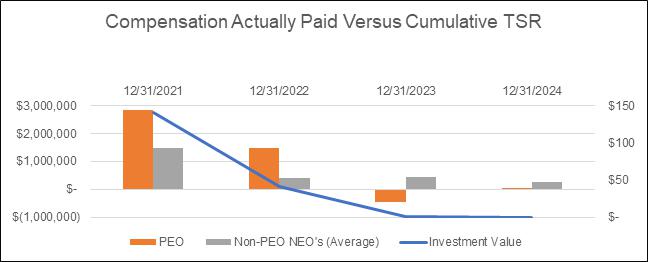
PEO and Non-PEO NEO Compensation Actually Paid and Company Total Stockholder Return (“TSR”)


The following chart sets forth the relationship between Compensation Actually Paid to our PEO, the average of Compensation Actually Paid to our Non-PEO NEOs, and the Company’s TSR over the period covering fiscal years 2021 to 2024. A large component of our executive compensation is equity-based to align compensation with performance, but also includes other appropriate incentives such as cash bonuses that are designed to incentivize our executives to achieve annual corporate goals. We believe the equity-based compensation strongly aligns our PEO and Non-PEO NEOs’ interests with those of our stockholders to maximize long-term value and encourages long-term employment.


Compensation Actually Paid vs. Net Income [Text Block]    


Compensation Actually Paid and Net Income (Loss)


Due to the nature of our Company’s consolidated financial statements and primary focus on research and development for utilizing plant technologies to improve health and wellness with reduced nicotine tobacco, our Company has not historically utilized net income (loss) as a performance measure for our executive compensation program. From 2022 to 2024, our net loss increased and the Compensation Actually Paid to our PEO and Non-PEO NEOs decreased between those years.

       
Total Shareholder Return Amount [2]     $ 0.01 0.56 42 140  
Net Income (Loss) Attributable to Parent [3]     $ (15,164,000) (140,775,000) (59,801,000) (32,609,000)  
PEO Name Lawrence D. Firestone John J. Miller Lawrence D. Firestone       James A. Mish
Total Equity Compensation [Member]              
Pay vs Performance Disclosure [Table]              
Adjustment to Compensation Amount     (161,568) (396,380) (736,317)  
Value of Awards Granted During Current Year [Member]              
Pay vs Performance Disclosure [Table]              
Adjustment to Compensation Amount     1,140 160,417 648,900  
Year Over Year Change In Fair Value of Unvested Awards [Member]              
Pay vs Performance Disclosure [Table]              
Adjustment to Compensation Amount     (117,994) (52,056) 159,275  
Vesting Date Value of Awards That Vested During Current Year [Member]              
Pay vs Performance Disclosure [Table]              
Adjustment to Compensation Amount     (2,987) (227,908) 119,184  
Value of Awards Forfeited During Current Year [Member]              
Pay vs Performance Disclosure [Table]              
Adjustment to Compensation Amount     (567,378) 39,072  
Total Adjustments [Member]              
Pay vs Performance Disclosure [Table]              
Adjustment to Compensation Amount     (569,378) (281,409) (476,855) 191,042  
Lawrence D Firestone [Member]              
Pay vs Performance Disclosure [Table]              
PEO Total Compensation Amount     426,678 32,692      
PEO Actually Paid Compensation Amount [4]     426,678 32,692      
Lawrence D Firestone [Member] | Total Equity Compensation [Member]              
Pay vs Performance Disclosure [Table]              
Adjustment to Compensation Amount          
Lawrence D Firestone [Member] | Value of Awards Granted During Current Year [Member]              
Pay vs Performance Disclosure [Table]              
Adjustment to Compensation Amount          
Lawrence D Firestone [Member] | Year Over Year Change In Fair Value of Unvested Awards [Member]              
Pay vs Performance Disclosure [Table]              
Adjustment to Compensation Amount          
Lawrence D Firestone [Member] | Vesting Date Value of Awards That Vested During Current Year [Member]              
Pay vs Performance Disclosure [Table]              
Adjustment to Compensation Amount          
Lawrence D Firestone [Member] | Value of Awards Forfeited During Current Year [Member]              
Pay vs Performance Disclosure [Table]              
Adjustment to Compensation Amount          
Lawrence D Firestone [Member] | Total Adjustments [Member]              
Pay vs Performance Disclosure [Table]              
Adjustment to Compensation Amount          
James A Mish [Member]              
Pay vs Performance Disclosure [Table]              
PEO Total Compensation Amount       706,778 4,011,094 2,534,464  
PEO Actually Paid Compensation Amount [4]       (529,515) 1,495,978 2,829,984  
James A Mish [Member] | Total Equity Compensation [Member]              
Pay vs Performance Disclosure [Table]              
Adjustment to Compensation Amount       (357,904) (3,025,989) (1,440,000)  
James A Mish [Member] | Value of Awards Granted During Current Year [Member]              
Pay vs Performance Disclosure [Table]              
Adjustment to Compensation Amount       1,272,573 1,390,500  
James A Mish [Member] | Year Over Year Change In Fair Value of Unvested Awards [Member]              
Pay vs Performance Disclosure [Table]              
Adjustment to Compensation Amount       (650,700)  
James A Mish [Member] | Vesting Date Value of Awards That Vested During Current Year [Member]              
Pay vs Performance Disclosure [Table]              
Adjustment to Compensation Amount       (37,677) (111,000) 345,000  
James A Mish [Member] | Value of Awards Forfeited During Current Year [Member]              
Pay vs Performance Disclosure [Table]              
Adjustment to Compensation Amount       (840,712)  
James A Mish [Member] | Total Adjustments [Member]              
Pay vs Performance Disclosure [Table]              
Adjustment to Compensation Amount       (1,236,293) $ (2,515,116) $ 295,500  
John J Miller [Member]              
Pay vs Performance Disclosure [Table]              
PEO Total Compensation Amount       221,468      
PEO Actually Paid Compensation Amount [4]       25,450      
John J Miller [Member] | Total Equity Compensation [Member]              
Pay vs Performance Disclosure [Table]              
Adjustment to Compensation Amount            
John J Miller [Member] | Value of Awards Granted During Current Year [Member]              
Pay vs Performance Disclosure [Table]              
Adjustment to Compensation Amount            
John J Miller [Member] | Year Over Year Change In Fair Value of Unvested Awards [Member]              
Pay vs Performance Disclosure [Table]              
Adjustment to Compensation Amount       (191,179)      
John J Miller [Member] | Vesting Date Value of Awards That Vested During Current Year [Member]              
Pay vs Performance Disclosure [Table]              
Adjustment to Compensation Amount       (4,839)      
John J Miller [Member] | Value of Awards Forfeited During Current Year [Member]              
Pay vs Performance Disclosure [Table]              
Adjustment to Compensation Amount            
John J Miller [Member] | Total Adjustments [Member]              
Pay vs Performance Disclosure [Table]              
Adjustment to Compensation Amount       $ (196,019)      
[1] The amounts disclosed reflect the adjustments listed in the tables below to the amounts reported in the Summary Compensation Table for our non-PEO NEO’s:
[2] Total Stockholder Return illustrates the value, as of the last day of the indicated fiscal year, of an investment of $100 in XXII common stock on January 1, 2021.
[3] The dollar amounts reported represent the amount of net income (loss) reflected in our consolidated audited financial statements for the applicable year.
[4] During 2024, Lawrence D. Firestone was our PEO and our non-PEO NEOs were R. Hugh Kinsman, John J. Miller, Daniel A. Otto, Jonathan Staffeldt, Robert Manfredonia and Scott Marion. From January 2022 through July 2023, James A. Mish was our PEO and our non-PEO NEOs for 2023 were R. Hugh Kinsman, John J. Miller, and Peter Ferola. Additionally, from July 2023 through November 2023, John J. Miller served as interim chief executive officer and PEO. For the period December 1, 2023 through December 31, 2023, our PEO was Lawrence D. Firestone. Our non-PEO NEO’s for 2022 were John Franzino, Michael J. Zercher, R. Hugh Kinsman, John J. Miller and Richard Fitzgerald. The amounts disclosed reflect the adjustments listed in the tables below to the amounts reported in the Summary Compensation Table for PEO: