Shareholder Report
Oct. 31, 2024
USD ($)
Holding
Oct. 31, 2024
USD ($)
Holding
Shareholder Report |
12 Months Ended | 120 Months Ended |
|---|---|---|
|
Oct. 31, 2024
USD ($)
Holding
|
Oct. 31, 2024
USD ($)
Holding
|
|
| Shareholder Report [Line Items] | ||
| Document Type | N-CSR/A | |
| Amendment Flag | true | |
| Amendment Description | vb | |
| Registrant Name | Dunham Funds | |
| Entity Central Index Key | 0001420040 | |
| Entity Investment Company Type | N-1A | |
| Document Period End Date | Oct. 31, 2024 | |
| C000059523 | ||
| Shareholder Report [Line Items] | ||
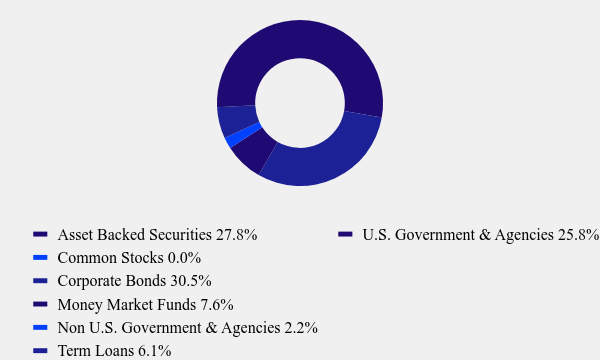
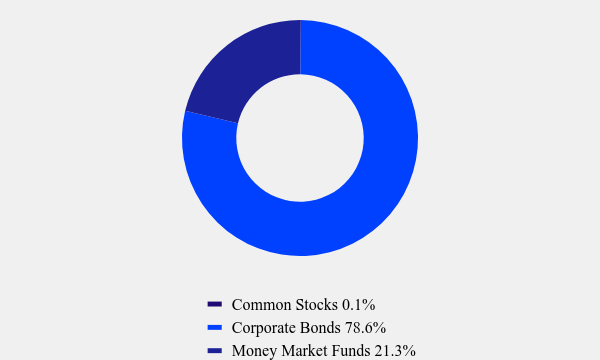
| Fund Name | Dunham Corporate/Government Bond Fund | |
| Class Name | Class A | |
| Trading Symbol | DACGX | |
| Annual or Semi-Annual Statement [Text Block] | This annual shareholder report contains important information about Dunham Corporate/Government Bond Fund ("Fund") for the period of November 1, 2023 to October 31, 2024. | |
| Shareholder Report Annual or Semi-Annual | Annual Shareholder Report | |
| Additional Information [Text Block] | You can find additional information about the Fund at https://Dunham.onlineprospectus.net/Dunham/corpgov/. You can also request this information by contacting us at 1-800-442-4358. | |
| Material Fund Change Notice [Text Block] | This report describes change to the Fund that occurred during the reporting period. | |
| Additional Information Phone Number | 1-800-442-4358 | |
| Additional Information Website | https://Dunham.onlineprospectus.net/Dunham/corpgov/ | |
| Expenses [Text Block] |
|
|
| Expenses Paid, Amount | $ 147 | |
| Expense Ratio, Percent | 1.39% | |
| Performance Past Does Not Indicate Future [Text] | The Fund's past performance is not a good predictor of how the Fund will perform in the future. | |
| Average Annual Return [Table Text Block] |
|
|
| No Deduction of Taxes [Text Block] | The graph and table do not reflect the deduction of taxes that a shareholder would pay on fund distributions or redemption of fund shares. | |
| AssetsNet | $ 204,566,524 | $ 204,566,524 |
| Holdings Count | Holding | 577 | 577 |
| Advisory Fees Paid, Amount | $ 1,463,270 | |
| InvestmentCompanyPortfolioTurnover | 53.00% | |
| Additional Fund Statistics [Text Block] |
|
|
| Holdings [Text Block] |
|
|
| C000059524 | ||
| Shareholder Report [Line Items] | ||
| Fund Name | Dunham Corporate/Government Bond Fund | |
| Class Name | Class C | |
| Trading Symbol | DCCGX | |
| Annual or Semi-Annual Statement [Text Block] | This annual shareholder report contains important information about Dunham Corporate/Government Bond Fund ("Fund") for the period of November 1, 2023 to October 31, 2024. | |
| Shareholder Report Annual or Semi-Annual | Annual Shareholder Report | |
| Additional Information [Text Block] | You can find additional information about the Fund at https://Dunham.onlineprospectus.net/Dunham/corpgov/. You can also request this information by contacting us at 1-800-442-4358. | |
| Material Fund Change Notice [Text Block] | This report describes change to the Fund that occurred during the reporting period. | |
| Additional Information Phone Number | 1-800-442-4358 | |
| Additional Information Website | https://Dunham.onlineprospectus.net/Dunham/corpgov/ | |
| Expenses [Text Block] |
|
|
| Expenses Paid, Amount | $ 199 | |
| Expense Ratio, Percent | 1.89% | |
| Performance Past Does Not Indicate Future [Text] | The Fund's past performance is not a good predictor of how the Fund will perform in the future. | |
| Average Annual Return [Table Text Block] |
|
|
| No Deduction of Taxes [Text Block] | The graph and table do not reflect the deduction of taxes that a shareholder would pay on fund distributions or redemption of fund shares. | |
| AssetsNet | $ 204,566,524 | $ 204,566,524 |
| Holdings Count | Holding | 577 | 577 |
| Advisory Fees Paid, Amount | $ 1,463,270 | |
| InvestmentCompanyPortfolioTurnover | 53.00% | |
| Additional Fund Statistics [Text Block] |
|
|
| Holdings [Text Block] |
|
|
| C000059525 | ||
| Shareholder Report [Line Items] | ||
| Fund Name | Dunham Corporate/Government Bond Fund | |
| Class Name | Class N | |
| Trading Symbol | DNCGX | |
| Annual or Semi-Annual Statement [Text Block] | This annual shareholder report contains important information about Dunham Corporate/Government Bond Fund ("Fund") for the period of November 1, 2023 to October 31, 2024. | |
| Shareholder Report Annual or Semi-Annual | Annual Shareholder Report | |
| Additional Information [Text Block] | You can find additional information about the Fund at https://Dunham.onlineprospectus.net/Dunham/corpgov/. You can also request this information by contacting us at 1-800-442-4358. | |
| Material Fund Change Notice [Text Block] | This report describes change to the Fund that occurred during the reporting period. | |
| Additional Information Phone Number | 1-800-442-4358 | |
| Additional Information Website | https://Dunham.onlineprospectus.net/Dunham/corpgov/ | |
| Expenses [Text Block] |
|
|
| Expenses Paid, Amount | $ 121 | |
| Expense Ratio, Percent | 1.14% | |
| Performance Past Does Not Indicate Future [Text] | The Fund's past performance is not a good predictor of how the Fund will perform in the future. | |
| Average Annual Return [Table Text Block] |
|
|
| No Deduction of Taxes [Text Block] | The graph and table do not reflect the deduction of taxes that a shareholder would pay on fund distributions or redemption of fund shares. | |
| AssetsNet | $ 204,566,524 | $ 204,566,524 |
| Holdings Count | Holding | 577 | 577 |
| Advisory Fees Paid, Amount | $ 1,463,270 | |
| InvestmentCompanyPortfolioTurnover | 53.00% | |
| Additional Fund Statistics [Text Block] |
|
|
| Holdings [Text Block] |
|
|
| C000087895 | ||
| Shareholder Report [Line Items] | ||
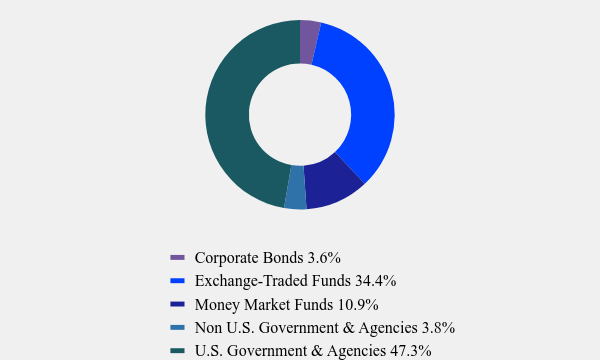
| Fund Name | Dunham Dynamic Macro Fund | |
| Class Name | Class A | |
| Trading Symbol | DAAVX | |
| Annual or Semi-Annual Statement [Text Block] | This annual shareholder report contains important information about Dunham Dynamic Macro Fund ("Fund") for the period of November 1, 2023 to October 31, 2024. | |
| Shareholder Report Annual or Semi-Annual | Annual Shareholder Report | |
| Additional Information [Text Block] | You can find additional information about the Fund at https://Dunham.onlineprospectus.net/Dunham/dynamicmacrofund/. You can also request this information by contacting us at 1-800-442-4358. | |
| Additional Information Phone Number | 1-800-442-4358 | |
| Additional Information Website | https://Dunham.onlineprospectus.net/Dunham/dynamicmacrofund/ | |
| Expenses [Text Block] |
|
|
| Expenses Paid, Amount | $ 241 | |
| Expense Ratio, Percent | 2.21% | |
| Performance Past Does Not Indicate Future [Text] | The Fund's past performance is not a good predictor of how the Fund will perform in the future. | |
| Average Annual Return [Table Text Block] |
|
|
| No Deduction of Taxes [Text Block] | The graph and table do not reflect the deduction of taxes that a shareholder would pay on fund distributions or redemption of fund shares. | |
| Material Change Date | Oct. 31, 2024 | |
| AssetsNet | $ 78,677,152 | $ 78,677,152 |
| Holdings Count | Holding | 44 | 44 |
| Advisory Fees Paid, Amount | $ 895,300 | |
| InvestmentCompanyPortfolioTurnover | 47.00% | |
| Additional Fund Statistics [Text Block] |
|
|
| Holdings [Text Block] |
|
|
| C000087896 | ||
| Shareholder Report [Line Items] | ||
| Fund Name | Dunham Dynamic Macro Fund | |
| Class Name | Class C | |
| Trading Symbol | DCAVX | |
| Annual or Semi-Annual Statement [Text Block] | This annual shareholder report contains important information about Dunham Dynamic Macro Fund ("Fund") for the period of November 1, 2023 to October 31, 2024. | |
| Shareholder Report Annual or Semi-Annual | Annual Shareholder Report | |
| Additional Information [Text Block] | You can find additional information about the Fund at https://Dunham.onlineprospectus.net/Dunham/dynamicmacrofund/. You can also request this information by contacting us at 1-800-442-4358. | |
| Additional Information Phone Number | 1-800-442-4358 | |
| Additional Information Website | https://Dunham.onlineprospectus.net/Dunham/dynamicmacrofund/ | |
| Expenses [Text Block] |
|
|
| Expenses Paid, Amount | $ 318 | |
| Expense Ratio, Percent | 2.93% | |
| Performance Past Does Not Indicate Future [Text] | The Fund's past performance is not a good predictor of how the Fund will perform in the future. | |
| Average Annual Return [Table Text Block] |
|
|
| No Deduction of Taxes [Text Block] | The graph and table do not reflect the deduction of taxes that a shareholder would pay on fund distributions or redemption of fund shares. | |
| Material Change Date | Oct. 31, 2024 | |
| AssetsNet | $ 78,677,152 | $ 78,677,152 |
| Holdings Count | Holding | 44 | 44 |
| Advisory Fees Paid, Amount | $ 895,300 | |
| InvestmentCompanyPortfolioTurnover | 47.00% | |
| Additional Fund Statistics [Text Block] |
|
|
| Holdings [Text Block] |
|
|
| C000087897 | ||
| Shareholder Report [Line Items] | ||
| Fund Name | Dunham Dynamic Macro Fund | |
| Class Name | Class N | |
| Trading Symbol | DNAVX | |
| Annual or Semi-Annual Statement [Text Block] | This annual shareholder report contains important information about Dunham Dynamic Macro Fund ("Fund") for the period of November 1, 2023 to October 31, 2024. | |
| Shareholder Report Annual or Semi-Annual | Annual Shareholder Report | |
| Additional Information [Text Block] | You can find additional information about the Fund at https://Dunham.onlineprospectus.net/Dunham/dynamicmacrofund/. You can also request this information by contacting us at 1-800-442-4358. | |
| Additional Information Phone Number | 1-800-442-4358 | |
| Additional Information Website | https://Dunham.onlineprospectus.net/Dunham/dynamicmacrofund/ | |
| Expenses [Text Block] |
|
|
| Expenses Paid, Amount | $ 212 | |
| Expense Ratio, Percent | 1.94% | |
| Performance Past Does Not Indicate Future [Text] | The Fund's past performance is not a good predictor of how the Fund will perform in the future. | |
| Average Annual Return [Table Text Block] |
|
|
| No Deduction of Taxes [Text Block] | The graph and table do not reflect the deduction of taxes that a shareholder would pay on fund distributions or redemption of fund shares. | |
| Material Change Date | Oct. 31, 2024 | |
| AssetsNet | $ 78,677,152 | $ 78,677,152 |
| Holdings Count | Holding | 44 | 44 |
| Advisory Fees Paid, Amount | $ 895,300 | |
| InvestmentCompanyPortfolioTurnover | 47.00% | |
| Additional Fund Statistics [Text Block] |
|
|
| Holdings [Text Block] |
|
|
| C000059526 | ||
| Shareholder Report [Line Items] | ||
| Fund Name | Dunham Emerging Markets Stock Fund | |
| Class Name | Class A | |
| Trading Symbol | DAEMX | |
| Annual or Semi-Annual Statement [Text Block] | This annual shareholder report contains important information about Dunham Emerging Markets Stock Fund ("Fund") for the period of November 1, 2023 to October 31, 2024. | |
| Shareholder Report Annual or Semi-Annual | Annual Shareholder Report | |
| Additional Information [Text Block] | You can find additional information about the Fund at https://Dunham.onlineprospectus.net/Dunham/emergingmarket/. You can also request this information by contacting us at 1-800-442-4358. | |
| Additional Information Phone Number | 1-800-442-4358 | |
| Additional Information Website | https://Dunham.onlineprospectus.net/Dunham/emergingmarket/ | |
| Expenses [Text Block] |
|
|
| Expenses Paid, Amount | $ 164 | |
| Expense Ratio, Percent | 1.49% | |
| Performance Past Does Not Indicate Future [Text] | The Fund's past performance is not a good predictor of how the Fund will perform in the future. | |
| Average Annual Return [Table Text Block] |
|
|
| No Deduction of Taxes [Text Block] | The graph and table do not reflect the deduction of taxes that a shareholder would pay on fund distributions or redemption of fund shares. | |
| Material Change Date | Oct. 31, 2024 | |
| AssetsNet | $ 115,054,605 | $ 115,054,605 |
| Holdings Count | Holding | 88 | 88 |
| Advisory Fees Paid, Amount | $ 933,929 | |
| InvestmentCompanyPortfolioTurnover | 70.00% | |
| Additional Fund Statistics [Text Block] |
|
|
| Holdings [Text Block] |
|
|
| C000059527 | ||
| Shareholder Report [Line Items] | ||
| Fund Name | Dunham Emerging Markets Stock Fund | |
| Class Name | Class C | |
| Trading Symbol | DCEMX | |
| Annual or Semi-Annual Statement [Text Block] | This annual shareholder report contains important information about Dunham Emerging Markets Stock Fund ("Fund") for the period of November 1, 2023 to October 31, 2024. | |
| Shareholder Report Annual or Semi-Annual | Annual Shareholder Report | |
| Additional Information [Text Block] | You can find additional information about the Fund at https://Dunham.onlineprospectus.net/Dunham/emergingmarket/. You can also request this information by contacting us at 1-800-442-4358. | |
| Additional Information Phone Number | 1-800-442-4358 | |
| Additional Information Website | https://Dunham.onlineprospectus.net/Dunham/emergingmarket/ | |
| Expenses [Text Block] |
|
|
| Expenses Paid, Amount | $ 245 | |
| Expense Ratio, Percent | 2.24% | |
| Performance Past Does Not Indicate Future [Text] | The Fund's past performance is not a good predictor of how the Fund will perform in the future. | |
| Average Annual Return [Table Text Block] |
|
|
| No Deduction of Taxes [Text Block] | The graph and table do not reflect the deduction of taxes that a shareholder would pay on fund distributions or redemption of fund shares. | |
| Material Change Date | Oct. 31, 2024 | |
| AssetsNet | $ 115,054,605 | $ 115,054,605 |
| Holdings Count | Holding | 88 | 88 |
| Advisory Fees Paid, Amount | $ 933,929 | |
| InvestmentCompanyPortfolioTurnover | 70.00% | |
| Additional Fund Statistics [Text Block] |
|
|
| Holdings [Text Block] |
|
|
| C000059528 | ||
| Shareholder Report [Line Items] | ||
| Fund Name | Dunham Emerging Markets Stock Fund | |
| Class Name | Class N | |
| Trading Symbol | DNEMX | |
| Annual or Semi-Annual Statement [Text Block] | This annual shareholder report contains important information about Dunham Emerging Markets Stock Fund ("Fund") for the period of November 1, 2023 to October 31, 2024. | |
| Shareholder Report Annual or Semi-Annual | Annual Shareholder Report | |
| Additional Information [Text Block] | You can find additional information about the Fund at https://Dunham.onlineprospectus.net/Dunham/emergingmarket/. You can also request this information by contacting us at 1-800-442-4358. | |
| Additional Information Phone Number | 1-800-442-4358 | |
| Additional Information Website | https://Dunham.onlineprospectus.net/Dunham/emergingmarket/ | |
| Expenses [Text Block] |
|
|
| Expenses Paid, Amount | $ 137 | |
| Expense Ratio, Percent | 1.24% | |
| Performance Past Does Not Indicate Future [Text] | The Fund's past performance is not a good predictor of how the Fund will perform in the future. | |
| Average Annual Return [Table Text Block] |
|
|
| No Deduction of Taxes [Text Block] | The graph and table do not reflect the deduction of taxes that a shareholder would pay on fund distributions or redemption of fund shares. | |
| Material Change Date | Oct. 31, 2024 | |
| AssetsNet | $ 115,054,605 | $ 115,054,605 |
| Holdings Count | Holding | 88 | 88 |
| Advisory Fees Paid, Amount | $ 933,929 | |
| InvestmentCompanyPortfolioTurnover | 70.00% | |
| Additional Fund Statistics [Text Block] |
|
|
| Holdings [Text Block] |
|
|
| C000131123 | ||
| Shareholder Report [Line Items] | ||
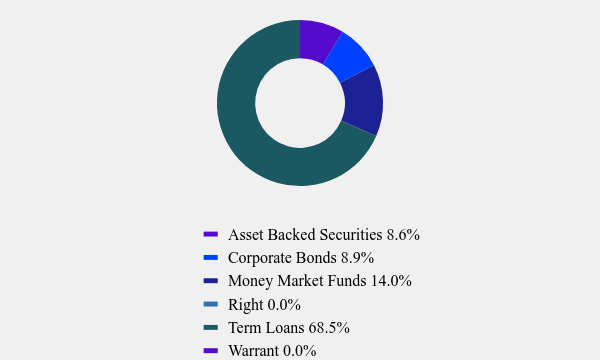
| Fund Name | Dunham Floating Rate Bond Fund | |
| Class Name | Class A | |
| Trading Symbol | DAFRX | |
| Annual or Semi-Annual Statement [Text Block] | This annual shareholder report contains important information about Dunham Floating Rate Bond Fund ("Fund") for the period of November 1, 2023 to December 31, 2024. | |
| Shareholder Report Annual or Semi-Annual | Annual Shareholder Report | |
| Additional Information [Text Block] | You can find additional information about the Fund at https://Dunham.onlineprospectus.net/Dunham/floatingratebond/. You can also request this information by contacting us at 1-800-442-4358. | |
| Material Fund Change Notice [Text Block] | This report describes changes to the Fund that occurred during the reporting period. | |
| Additional Information Phone Number | 1-800-442-4358 | |
| Additional Information Website | https://Dunham.onlineprospectus.net/Dunham/floatingratebond/ | |
| Expenses [Text Block] |
|
|
| Expenses Paid, Amount | $ 136 | |
| Expense Ratio, Percent | 1.29% | |
| Performance Past Does Not Indicate Future [Text] | The Fund's past performance is not a good predictor of how the Fund will perform in the future. | |
| Average Annual Return [Table Text Block] |
|
|
| No Deduction of Taxes [Text Block] | The graph and table do not reflect the deduction of taxes that a shareholder would pay on fund distributions or redemption of fund shares. | |
| Material Change Date | Oct. 31, 2024 | |
| AssetsNet | $ 142,344,370 | $ 142,344,370 |
| Holdings Count | Holding | 231 | 231 |
| Advisory Fees Paid, Amount | $ 970,346 | |
| InvestmentCompanyPortfolioTurnover | 80.00% | |
| Additional Fund Statistics [Text Block] |
|
|
| Holdings [Text Block] |
|
|
| C000131124 | ||
| Shareholder Report [Line Items] | ||
| Fund Name | Dunham Floating Rate Bond Fund | |
| Class Name | Class C | |
| Trading Symbol | DCFRX | |
| Annual or Semi-Annual Statement [Text Block] | This annual shareholder report contains important information about Dunham Floating Rate Bond Fund ("Fund") for the period of November 1, 2023 to December 31, 2024. | |
| Shareholder Report Annual or Semi-Annual | Annual Shareholder Report | |
| Additional Information [Text Block] | You can find additional information about the Fund at https://Dunham.onlineprospectus.net/Dunham/floatingratebond/. You can also request this information by contacting us at 1-800-442-4358. | |
| Material Fund Change Notice [Text Block] | This report describes changes to the Fund that occurred during the reporting period. | |
| Additional Information Phone Number | 1-800-442-4358 | |
| Additional Information Website | https://Dunham.onlineprospectus.net/Dunham/floatingratebond/ | |
| Expenses [Text Block] |
|
|
| Expenses Paid, Amount | $ 188 | |
| Expense Ratio, Percent | 1.79% | |
| Performance Past Does Not Indicate Future [Text] | The Fund's past performance is not a good predictor of how the Fund will perform in the future. | |
| Average Annual Return [Table Text Block] |
|
|
| No Deduction of Taxes [Text Block] | The graph and table do not reflect the deduction of taxes that a shareholder would pay on fund distributions or redemption of fund shares. | |
| Material Change Date | Oct. 31, 2024 | |
| AssetsNet | $ 142,344,370 | $ 142,344,370 |
| Holdings Count | Holding | 231 | 231 |
| Advisory Fees Paid, Amount | $ 970,346 | |
| InvestmentCompanyPortfolioTurnover | 80.00% | |
| Additional Fund Statistics [Text Block] |
|
|
| Holdings [Text Block] |
|
|
| C000131125 | ||
| Shareholder Report [Line Items] | ||
| Fund Name | Dunham Floating Rate Bond Fund | |
| Class Name | Class N | |
| Trading Symbol | DNFRX | |
| Annual or Semi-Annual Statement [Text Block] | This annual shareholder report contains important information about Dunham Floating Rate Bond Fund ("Fund") for the period of November 1, 2023 to December 31, 2024. | |
| Shareholder Report Annual or Semi-Annual | Annual Shareholder Report | |
| Additional Information [Text Block] | You can find additional information about the Fund at https://Dunham.onlineprospectus.net/Dunham/floatingratebond/. You can also request this information by contacting us at 1-800-442-4358. | |
| Material Fund Change Notice [Text Block] | This report describes changes to the Fund that occurred during the reporting period. | |
| Additional Information Phone Number | 1-800-442-4358 | |
| Additional Information Website | https://Dunham.onlineprospectus.net/Dunham/floatingratebond/ | |
| Expenses [Text Block] |
|
|
| Expenses Paid, Amount | $ 107 | |
| Expense Ratio, Percent | 1.02% | |
| Performance Past Does Not Indicate Future [Text] | The Fund's past performance is not a good predictor of how the Fund will perform in the future. | |
| Average Annual Return [Table Text Block] |
|
|
| No Deduction of Taxes [Text Block] | The graph and table do not reflect the deduction of taxes that a shareholder would pay on fund distributions or redemption of fund shares. | |
| Material Change Date | Oct. 31, 2024 | |
| AssetsNet | $ 142,344,370 | $ 142,344,370 |
| Holdings Count | Holding | 231 | 231 |
| Advisory Fees Paid, Amount | $ 970,346 | |
| InvestmentCompanyPortfolioTurnover | 80.00% | |
| Additional Fund Statistics [Text Block] |
|
|
| Holdings [Text Block] |
|
|
| C000107185 | ||
| Shareholder Report [Line Items] | ||
| Fund Name | Dunham Focused Large Cap Growth Fund | |
| Class Name | Class A | |
| Trading Symbol | DAFGX | |
| Annual or Semi-Annual Statement [Text Block] | This annual shareholder report contains important information about Dunham Focused Large Cap Growth Fund ("Fund") for the period of November 1, 2023 to December 31, 2024. | |
| Shareholder Report Annual or Semi-Annual | Annual Shareholder Report | |
| Additional Information [Text Block] | You can find additional information about the Fund at https://Dunham.onlineprospectus.net/Dunham/focusedlargecapgrowth/. You can also request this information by contacting us at 1-800-442-4358. | |
| Material Fund Change Notice [Text Block] | This report describes changes to the Fund that occurred during the reporting period. | |
| Additional Information Phone Number | 1-800-442-4358 | |
| Additional Information Website | https://Dunham.onlineprospectus.net/Dunham/focusedlargecapgrowth/ | |
| Expenses [Text Block] |
|
|
| Expenses Paid, Amount | $ 178 | |
| Expense Ratio, Percent | 1.46% | |
| Performance Past Does Not Indicate Future [Text] | The Fund's past performance is not a good predictor of how the Fund will perform in the future. | |
| Average Annual Return [Table Text Block] |
|
|
| No Deduction of Taxes [Text Block] | The graph and table do not reflect the deduction of taxes that a shareholder would pay on fund distributions or redemption of fund shares. | |
| Material Change Date | Oct. 31, 2024 | |
| AssetsNet | $ 182,127,424 | $ 182,127,424 |
| Holdings Count | Holding | 30 | 30 |
| Advisory Fees Paid, Amount | $ 1,880,684 | |
| InvestmentCompanyPortfolioTurnover | 11.00% | |
| Additional Fund Statistics [Text Block] |
|
|
| Holdings [Text Block] |
|
|
| C000107186 | ||
| Shareholder Report [Line Items] | ||
| Fund Name | Dunham Focused Large Cap Growth Fund | |
| Class Name | Class C | |
| Trading Symbol | DCFGX | |
| Annual or Semi-Annual Statement [Text Block] | This annual shareholder report contains important information about Dunham Focused Large Cap Growth Fund ("Fund") for the period of November 1, 2023 to December 31, 2024. | |
| Shareholder Report Annual or Semi-Annual | Annual Shareholder Report | |
| Additional Information [Text Block] | You can find additional information about the Fund at https://Dunham.onlineprospectus.net/Dunham/focusedlargecapgrowth/. You can also request this information by contacting us at 1-800-442-4358. | |
| Material Fund Change Notice [Text Block] | This report describes changes to the Fund that occurred during the reporting period. | |
| Additional Information Phone Number | 1-800-442-4358 | |
| Additional Information Website | https://Dunham.onlineprospectus.net/Dunham/focusedlargecapgrowth/ | |
| Expenses [Text Block] |
|
|
| Expenses Paid, Amount | $ 266 | |
| Expense Ratio, Percent | 2.20% | |
| Performance Past Does Not Indicate Future [Text] | The Fund's past performance is not a good predictor of how the Fund will perform in the future. | |
| Average Annual Return [Table Text Block] |
|
|
| No Deduction of Taxes [Text Block] | The graph and table do not reflect the deduction of taxes that a shareholder would pay on fund distributions or redemption of fund shares. | |
| Material Change Date | Oct. 31, 2024 | |
| AssetsNet | $ 182,127,424 | $ 182,127,424 |
| Holdings Count | Holding | 30 | 30 |
| Advisory Fees Paid, Amount | $ 1,880,684 | |
| InvestmentCompanyPortfolioTurnover | 11.00% | |
| Additional Fund Statistics [Text Block] |
|
|
| Holdings [Text Block] |
|
|
| C000107187 | ||
| Shareholder Report [Line Items] | ||
| Fund Name | Dunham Focused Large Cap Growth Fund | |
| Class Name | Class N | |
| Trading Symbol | DNFGX | |
| Annual or Semi-Annual Statement [Text Block] | This annual shareholder report contains important information about Dunham Focused Large Cap Growth Fund ("Fund") for the period of November 1, 2023 to December 31, 2024. | |
| Shareholder Report Annual or Semi-Annual | Annual Shareholder Report | |
| Additional Information [Text Block] | You can find additional information about the Fund at https://Dunham.onlineprospectus.net/Dunham/focusedlargecapgrowth/. You can also request this information by contacting us at 1-800-442-4358. | |
| Material Fund Change Notice [Text Block] | This report describes changes to the Fund that occurred during the reporting period. | |
| Additional Information Phone Number | 1-800-442-4358 | |
| Additional Information Website | https://Dunham.onlineprospectus.net/Dunham/focusedlargecapgrowth/ | |
| Expenses [Text Block] |
|
|
| Expenses Paid, Amount | $ 146 | |
| Expense Ratio, Percent | 1.20% | |
| Performance Past Does Not Indicate Future [Text] | The Fund's past performance is not a good predictor of how the Fund will perform in the future. | |
| Average Annual Return [Table Text Block] |
|
|
| No Deduction of Taxes [Text Block] | The graph and table do not reflect the deduction of taxes that a shareholder would pay on fund distributions or redemption of fund shares. | |
| Material Change Date | Oct. 31, 2024 | |
| AssetsNet | $ 182,127,424 | $ 182,127,424 |
| Holdings Count | Holding | 30 | 30 |
| Advisory Fees Paid, Amount | $ 1,880,684 | |
| InvestmentCompanyPortfolioTurnover | 11.00% | |
| Additional Fund Statistics [Text Block] |
|
|
| Holdings [Text Block] |
|
|
| C000059529 | ||
| Shareholder Report [Line Items] | ||
| Fund Name | Dunham High Yield Bond Fund | |
| Class Name | Class A | |
| Trading Symbol | DAHYX | |
| Annual or Semi-Annual Statement [Text Block] | This annual shareholder report contains important information about Dunham High Yield Bond Fund ("Fund") for the period of November 1, 2023 to December 31, 2024. | |
| Shareholder Report Annual or Semi-Annual | Annual Shareholder Report | |
| Additional Information [Text Block] | You can find additional information about the Fund at https://dunham.onlineprospectus.net/Dunham/highyield/. You can also request this information by contacting us at 1-800-442-4358. | |
| Material Fund Change Notice [Text Block] | This report describes changes to the Fund that occurred during the reporting period. | |
| Additional Information Phone Number | 1-800-442-4358 | |
| Additional Information Website | https://dunham.onlineprospectus.net/Dunham/highyield/ | |
| Expenses [Text Block] |
|
|
| Expenses Paid, Amount | $ 153 | |
| Expense Ratio, Percent | 1.43% | |
| Performance Past Does Not Indicate Future [Text] | The Fund's past performance is not a good predictor of how the Fund will perform in the future. | |
| Average Annual Return [Table Text Block] |
|
|
| No Deduction of Taxes [Text Block] | The graph and table do not reflect the deduction of taxes that a shareholder would pay on fund distributions or redemption of fund shares. | |
| Material Change Date | Oct. 31, 2024 | |
| AssetsNet | $ 201,274,690 | $ 201,274,690 |
| Holdings Count | Holding | 280 | 280 |
| Advisory Fees Paid, Amount | $ 1,557,329 | |
| InvestmentCompanyPortfolioTurnover | 57.00% | |
| Additional Fund Statistics [Text Block] |
|
|
| Holdings [Text Block] |
|
|
| C000059530 | ||
| Shareholder Report [Line Items] | ||
| Fund Name | Dunham High Yield Bond Fund | |
| Class Name | Class C | |
| Trading Symbol | DCHYX | |
| Annual or Semi-Annual Statement [Text Block] | This annual shareholder report contains important information about Dunham High Yield Bond Fund ("Fund") for the period of November 1, 2023 to December 31, 2024. | |
| Shareholder Report Annual or Semi-Annual | Annual Shareholder Report | |
| Additional Information [Text Block] | You can find additional information about the Fund at https://dunham.onlineprospectus.net/Dunham/highyield/. You can also request this information by contacting us at 1-800-442-4358. | |
| Material Fund Change Notice [Text Block] | This report describes changes to the Fund that occurred during the reporting period. | |
| Additional Information Phone Number | 1-800-442-4358 | |
| Additional Information Website | https://dunham.onlineprospectus.net/Dunham/highyield/ | |
| Expenses [Text Block] |
|
|
| Expenses Paid, Amount | $ 206 | |
| Expense Ratio, Percent | 1.93% | |
| Performance Past Does Not Indicate Future [Text] | The Fund's past performance is not a good predictor of how the Fund will perform in the future. | |
| Average Annual Return [Table Text Block] |
|
|
| No Deduction of Taxes [Text Block] | The graph and table do not reflect the deduction of taxes that a shareholder would pay on fund distributions or redemption of fund shares. | |
| Material Change Date | Oct. 31, 2024 | |
| AssetsNet | $ 201,274,690 | $ 201,274,690 |
| Holdings Count | Holding | 280 | 280 |
| Advisory Fees Paid, Amount | $ 1,557,329 | |
| InvestmentCompanyPortfolioTurnover | 57.00% | |
| Additional Fund Statistics [Text Block] |
|
|
| Holdings [Text Block] |
|
|
| C000059531 | ||
| Shareholder Report [Line Items] | ||
| Fund Name | Dunham High Yield Bond Fund | |
| Class Name | Class N | |
| Trading Symbol | DNHYX | |
| Annual or Semi-Annual Statement [Text Block] | This annual shareholder report contains important information about Dunham High Yield Bond Fund ("Fund") for the period of November 1, 2023 to December 31, 2024. | |
| Shareholder Report Annual or Semi-Annual | Annual Shareholder Report | |
| Additional Information [Text Block] | You can find additional information about the Fund at https://dunham.onlineprospectus.net/Dunham/highyield/. You can also request this information by contacting us at 1-800-442-4358. | |
| Material Fund Change Notice [Text Block] | This report describes changes to the Fund that occurred during the reporting period. | |
| Additional Information Phone Number | 1-800-442-4358 | |
| Additional Information Website | https://dunham.onlineprospectus.net/Dunham/highyield/ | |
| Expenses [Text Block] |
|
|
| Expenses Paid, Amount | $ 126 | |
| Expense Ratio, Percent | 1.17% | |
| Performance Past Does Not Indicate Future [Text] | The Fund's past performance is not a good predictor of how the Fund will perform in the future. | |
| Average Annual Return [Table Text Block] |
|
|
| No Deduction of Taxes [Text Block] | The graph and table do not reflect the deduction of taxes that a shareholder would pay on fund distributions or redemption of fund shares. | |
| Material Change Date | Oct. 31, 2024 | |
| AssetsNet | $ 201,274,690 | $ 201,274,690 |
| Holdings Count | Holding | 280 | 280 |
| Advisory Fees Paid, Amount | $ 1,557,329 | |
| InvestmentCompanyPortfolioTurnover | 57.00% | |
| Additional Fund Statistics [Text Block] |
|
|
| Holdings [Text Block] |
|
|
| C000131120 | ||
| Shareholder Report [Line Items] | ||
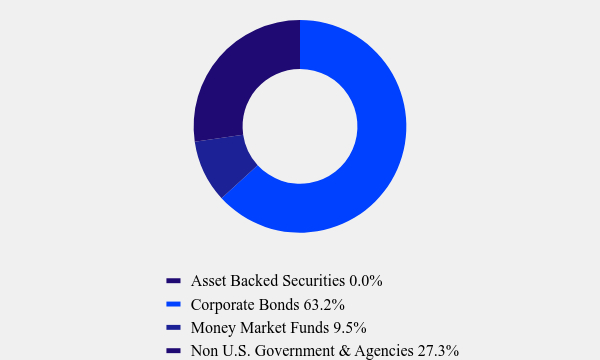
| Fund Name | Dunham International Opportunity Bond Fund | |
| Class Name | Class A | |
| Trading Symbol | DAIOX | |
| Annual or Semi-Annual Statement [Text Block] | This annual shareholder report contains important information about Dunham International Opportunity Bond Fund ("Fund") for the period of November 1, 2023 to October 31, 2024. | |
| Shareholder Report Annual or Semi-Annual | Annual Shareholder Report | |
| Additional Information [Text Block] | You can find additional information about the Fund at https://Dunham.onlineprospectus.net/Dunham/internationalopportunity/. You can also request this information by contacting us at 1-800-442-4358. | |
| Additional Information Phone Number | 1-800-442-4358 | |
| Additional Information Website | https://Dunham.onlineprospectus.net/Dunham/internationalopportunity/ | |
| Expenses [Text Block] |
|
|
| Expenses Paid, Amount | $ 213 | |
| Expense Ratio, Percent | 1.99% | |
| Performance Past Does Not Indicate Future [Text] | The Fund's past performance is not a good predictor of how the Fund will perform in the future. | |
| Average Annual Return [Table Text Block] |
|
|
| No Deduction of Taxes [Text Block] | The graph and table do not reflect the deduction of taxes that a shareholder would pay on fund distributions or redemption of fund shares. | |
| Material Change Date | Oct. 31, 2024 | |
| AssetsNet | $ 76,612,772 | $ 76,612,772 |
| Holdings Count | Holding | 455 | 455 |
| Advisory Fees Paid, Amount | $ 837,775 | |
| InvestmentCompanyPortfolioTurnover | 77.00% | |
| Additional Fund Statistics [Text Block] |
|
|
| Holdings [Text Block] |
|
|
| C000131121 | ||
| Shareholder Report [Line Items] | ||
| Fund Name | Dunham International Opportunity Bond Fund | |
| Class Name | Class C | |
| Trading Symbol | DCIOX | |
| Annual or Semi-Annual Statement [Text Block] | This annual shareholder report contains important information about Dunham International Opportunity Bond Fund ("Fund") for the period of November 1, 2023 to October 31, 2024. | |
| Shareholder Report Annual or Semi-Annual | Annual Shareholder Report | |
| Additional Information [Text Block] | You can find additional information about the Fund at https://Dunham.onlineprospectus.net/Dunham/internationalopportunity/. You can also request this information by contacting us at 1-800-442-4358. | |
| Additional Information Phone Number | 1-800-442-4358 | |
| Additional Information Website | https://Dunham.onlineprospectus.net/Dunham/internationalopportunity/ | |
| Expenses [Text Block] |
|
|
| Expenses Paid, Amount | $ 266 | |
| Expense Ratio, Percent | 2.49% | |
| Performance Past Does Not Indicate Future [Text] | The Fund's past performance is not a good predictor of how the Fund will perform in the future. | |
| Average Annual Return [Table Text Block] |
|
|
| No Deduction of Taxes [Text Block] | The graph and table do not reflect the deduction of taxes that a shareholder would pay on fund distributions or redemption of fund shares. | |
| Material Change Date | Oct. 31, 2024 | |
| AssetsNet | $ 76,612,772 | $ 76,612,772 |
| Holdings Count | Holding | 455 | 455 |
| Advisory Fees Paid, Amount | $ 837,775 | |
| InvestmentCompanyPortfolioTurnover | 77.00% | |
| Additional Fund Statistics [Text Block] |
|
|
| Holdings [Text Block] |
|
|
| C000131122 | ||
| Shareholder Report [Line Items] | ||
| Fund Name | Dunham International Opportunity Bond Fund | |
| Class Name | Class N | |
| Trading Symbol | DNIOX | |
| Annual or Semi-Annual Statement [Text Block] | This annual shareholder report contains important information about Dunham International Opportunity Bond Fund ("Fund") for the period of November 1, 2023 to October 31, 2024. | |
| Shareholder Report Annual or Semi-Annual | Annual Shareholder Report | |
| Additional Information [Text Block] | You can find additional information about the Fund at https://Dunham.onlineprospectus.net/Dunham/internationalopportunity/. You can also request this information by contacting us at 1-800-442-4358. | |
| Additional Information Phone Number | 1-800-442-4358 | |
| Additional Information Website | https://Dunham.onlineprospectus.net/Dunham/internationalopportunity/ | |
| Expenses [Text Block] |
|
|
| Expenses Paid, Amount | $ 187 | |
| Expense Ratio, Percent | 1.74% | |
| Performance Past Does Not Indicate Future [Text] | The Fund's past performance is not a good predictor of how the Fund will perform in the future. | |
| Average Annual Return [Table Text Block] |
|
|
| No Deduction of Taxes [Text Block] | The graph and table do not reflect the deduction of taxes that a shareholder would pay on fund distributions or redemption of fund shares. | |
| Material Change Date | Oct. 31, 2024 | |
| AssetsNet | $ 76,612,772 | $ 76,612,772 |
| Holdings Count | Holding | 455 | 455 |
| Advisory Fees Paid, Amount | $ 837,775 | |
| InvestmentCompanyPortfolioTurnover | 77.00% | |
| Additional Fund Statistics [Text Block] |
|
|
| Holdings [Text Block] |
|
|
| C000059532 | ||
| Shareholder Report [Line Items] | ||
| Fund Name | Dunham International Stock Fund | |
| Class Name | Class A | |
| Trading Symbol | DAINX | |
| Annual or Semi-Annual Statement [Text Block] | This annual shareholder report contains important information about Dunham International Stock Fund ("Fund") for the period of November 1, 2023 to October 31, 2024. | |
| Shareholder Report Annual or Semi-Annual | Annual Shareholder Report | |
| Additional Information [Text Block] | You can find additional information about the Fund at https://Dunham.onlineprospectus.net/Dunham/internationalstock/. You can also request this information by contacting us at 1-800-442-4358. | |
| Additional Information Phone Number | 1-800-442-4358 | |
| Additional Information Website | https://Dunham.onlineprospectus.net/Dunham/internationalstock/ | |
| Expenses [Text Block] |
|
|
| Expenses Paid, Amount | $ 242 | |
| Expense Ratio, Percent | 2.16% | |
| Performance Past Does Not Indicate Future [Text] | The Fund's past performance is not a good predictor of how the Fund will perform in the future. | |
| Average Annual Return [Table Text Block] |
|
|
| No Deduction of Taxes [Text Block] | The graph and table do not reflect the deduction of taxes that a shareholder would pay on fund distributions or redemption of fund shares. | |
| Material Change Date | Oct. 31, 2024 | |
| AssetsNet | $ 143,325,896 | $ 143,325,896 |
| Holdings Count | Holding | 323 | 323 |
| Advisory Fees Paid, Amount | $ 2,210,700 | |
| InvestmentCompanyPortfolioTurnover | 134.00% | |
| Additional Fund Statistics [Text Block] |
|
|
| Holdings [Text Block] |
|
|
| C000059533 | ||
| Shareholder Report [Line Items] | ||
| Fund Name | Dunham International Stock Fund | |
| Class Name | Class C | |
| Trading Symbol | DCINX | |
| Annual or Semi-Annual Statement [Text Block] | This annual shareholder report contains important information about Dunham International Stock Fund ("Fund") for the period of November 1, 2023 to October 31, 2024. | |
| Shareholder Report Annual or Semi-Annual | Annual Shareholder Report | |
| Additional Information [Text Block] | You can find additional information about the Fund at https://Dunham.onlineprospectus.net/Dunham/internationalstock/. You can also request this information by contacting us at 1-800-442-4358. | |
| Additional Information Phone Number | 1-800-442-4358 | |
| Additional Information Website | https://Dunham.onlineprospectus.net/Dunham/internationalstock/ | |
| Expenses [Text Block] |
|
|
| Expenses Paid, Amount | $ 325 | |
| Expense Ratio, Percent | 2.91% | |
| Performance Past Does Not Indicate Future [Text] | The Fund's past performance is not a good predictor of how the Fund will perform in the future. | |
| Average Annual Return [Table Text Block] |
|
|
| No Deduction of Taxes [Text Block] | The graph and table do not reflect the deduction of taxes that a shareholder would pay on fund distributions or redemption of fund shares. | |
| Material Change Date | Oct. 31, 2024 | |
| AssetsNet | $ 143,325,896 | $ 143,325,896 |
| Holdings Count | Holding | 323 | 323 |
| Advisory Fees Paid, Amount | $ 2,210,700 | |
| InvestmentCompanyPortfolioTurnover | 134.00% | |
| Additional Fund Statistics [Text Block] |
|
|
| Holdings [Text Block] |
|
|
| C000059534 | ||
| Shareholder Report [Line Items] | ||
| Fund Name | Dunham International Stock Fund | |
| Class Name | Class N | |
| Trading Symbol | DNINX | |
| Annual or Semi-Annual Statement [Text Block] | This annual shareholder report contains important information about Dunham International Stock Fund ("Fund") for the period of November 1, 2023 to October 31, 2024. | |
| Shareholder Report Annual or Semi-Annual | Annual Shareholder Report | |
| Additional Information [Text Block] | You can find additional information about the Fund at https://Dunham.onlineprospectus.net/Dunham/internationalstock/. You can also request this information by contacting us at 1-800-442-4358. | |
| Additional Information Phone Number | 1-800-442-4358 | |
| Additional Information Website | https://Dunham.onlineprospectus.net/Dunham/internationalstock/ | |
| Expenses [Text Block] |
|
|
| Expenses Paid, Amount | $ 214 | |
| Expense Ratio, Percent | 1.91% | |
| Performance Past Does Not Indicate Future [Text] | The Fund's past performance is not a good predictor of how the Fund will perform in the future. | |
| Average Annual Return [Table Text Block] |
|
|
| No Deduction of Taxes [Text Block] | The graph and table do not reflect the deduction of taxes that a shareholder would pay on fund distributions or redemption of fund shares. | |
| Material Change Date | Oct. 31, 2024 | |
| AssetsNet | $ 143,325,896 | $ 143,325,896 |
| Holdings Count | Holding | 323 | 323 |
| Advisory Fees Paid, Amount | $ 2,210,700 | |
| InvestmentCompanyPortfolioTurnover | 134.00% | |
| Additional Fund Statistics [Text Block] |
|
|
| Holdings [Text Block] |
|
|
| C000059511 | ||
| Shareholder Report [Line Items] | ||
| Fund Name | Dunham Large Cap Value Fund | |
| Class Name | Class A | |
| Trading Symbol | DALVX | |
| Annual or Semi-Annual Statement [Text Block] | This annual shareholder report contains important information about Dunham Large Cap Value Fund ("Fund") for the period of November 1, 2023 to October 31, 2024. | |
| Shareholder Report Annual or Semi-Annual | Annual Shareholder Report | |
| Additional Information [Text Block] | You can find additional information about the Fund at https://Dunham.onlineprospectus.net/Dunham/largecapvalue/. You can also request this information by contacting us at 1-800-442-4358. | |
| Additional Information Phone Number | 1-800-442-4358 | |
| Additional Information Website | https://Dunham.onlineprospectus.net/Dunham/largecapvalue/ | |
| Expenses [Text Block] |
|
|
| Expenses Paid, Amount | $ 167 | |
| Expense Ratio, Percent | 1.44% | |
| Performance Past Does Not Indicate Future [Text] | The Fund's past performance is not a good predictor of how the Fund will perform in the future. | |
| Average Annual Return [Table Text Block] |
|
|
| No Deduction of Taxes [Text Block] | The graph and table do not reflect the deduction of taxes that a shareholder would pay on fund distributions or redemption of fund shares. | |
| Material Change Date | Oct. 31, 2024 | |
| AssetsNet | $ 155,862,173 | $ 155,862,173 |
| Holdings Count | Holding | 76 | 76 |
| Advisory Fees Paid, Amount | $ 1,545,700 | |
| InvestmentCompanyPortfolioTurnover | 23.00% | |
| Additional Fund Statistics [Text Block] |
|
|
| Holdings [Text Block] |
|
|
| C000059512 | ||
| Shareholder Report [Line Items] | ||
| Fund Name | Dunham Large Cap Value Fund | |
| Class Name | Class C | |
| Trading Symbol | DCLVX | |
| Annual or Semi-Annual Statement [Text Block] | This annual shareholder report contains important information about Dunham Large Cap Value Fund ("Fund") for the period of November 1, 2023 to October 31, 2024. | |
| Shareholder Report Annual or Semi-Annual | Annual Shareholder Report | |
| Additional Information [Text Block] | You can find additional information about the Fund at https://Dunham.onlineprospectus.net/Dunham/largecapvalue/. You can also request this information by contacting us at 1-800-442-4358. | |
| Additional Information Phone Number | 1-800-442-4358 | |
| Additional Information Website | https://Dunham.onlineprospectus.net/Dunham/largecapvalue/ | |
| Expenses [Text Block] |
|
|
| Expenses Paid, Amount | $ 253 | |
| Expense Ratio, Percent | 2.19% | |
| Performance Past Does Not Indicate Future [Text] | The Fund's past performance is not a good predictor of how the Fund will perform in the future. | |
| Average Annual Return [Table Text Block] |
|
|
| No Deduction of Taxes [Text Block] | The graph and table do not reflect the deduction of taxes that a shareholder would pay on fund distributions or redemption of fund shares. | |
| Material Change Date | Oct. 31, 2024 | |
| AssetsNet | $ 155,862,173 | $ 155,862,173 |
| Holdings Count | Holding | 76 | 76 |
| Advisory Fees Paid, Amount | $ 1,545,700 | |
| InvestmentCompanyPortfolioTurnover | 23.00% | |
| Additional Fund Statistics [Text Block] |
|
|
| Holdings [Text Block] |
|
|
| C000059513 | ||
| Shareholder Report [Line Items] | ||
| Fund Name | Dunham Large Cap Value Fund | |
| Class Name | Class N | |
| Trading Symbol | DNLVX | |
| Annual or Semi-Annual Statement [Text Block] | This annual shareholder report contains important information about Dunham Large Cap Value Fund ("Fund") for the period of November 1, 2023 to October 31, 2024. | |
| Shareholder Report Annual or Semi-Annual | Annual Shareholder Report | |
| Additional Information [Text Block] | You can find additional information about the Fund at https://Dunham.onlineprospectus.net/Dunham/largecapvalue/. You can also request this information by contacting us at 1-800-442-4358. | |
| Additional Information Phone Number | 1-800-442-4358 | |
| Additional Information Website | https://Dunham.onlineprospectus.net/Dunham/largecapvalue/ | |
| Expenses [Text Block] |
|
|
| Expenses Paid, Amount | $ 138 | |
| Expense Ratio, Percent | 1.19% | |
| Performance Past Does Not Indicate Future [Text] | The Fund's past performance is not a good predictor of how the Fund will perform in the future. | |
| Average Annual Return [Table Text Block] |
|
|
| No Deduction of Taxes [Text Block] | The graph and table do not reflect the deduction of taxes that a shareholder would pay on fund distributions or redemption of fund shares. | |
| Material Change Date | Oct. 31, 2024 | |
| AssetsNet | $ 155,862,173 | $ 155,862,173 |
| Holdings Count | Holding | 76 | 76 |
| Advisory Fees Paid, Amount | $ 1,545,700 | |
| InvestmentCompanyPortfolioTurnover | 23.00% | |
| Additional Fund Statistics [Text Block] |
|
|
| Holdings [Text Block] |
|
|
| C000059520 | ||
| Shareholder Report [Line Items] | ||
| Fund Name | Dunham Long/Short Credit Fund | |
| Class Name | Class A | |
| Trading Symbol | DAAIX | |
| Annual or Semi-Annual Statement [Text Block] | This annual shareholder report contains important information about Dunham Long/Short Credit Fund ("Fund") for the period of November 1, 2023 to December 31, 2024. | |
| Shareholder Report Annual or Semi-Annual | Annual Shareholder Report | |
| Additional Information [Text Block] | You can find additional information about the Fund at https://dunham.onlineprospectus.net/Dunham/longshortcredit/. You can also request this information by contacting us at 1-800-442-4358. | |
| Material Fund Change Notice [Text Block] | This report describes changes to the Fund that occurred during the reporting period. | |
| Additional Information Phone Number | 1-800-442-4358 | |
| Additional Information Website | https://dunham.onlineprospectus.net/Dunham/longshortcredit/ | |
| Expenses [Text Block] |
|
|
| Expenses Paid, Amount | $ 114 | |
| Expense Ratio, Percent | 1.11% | |
| Performance Past Does Not Indicate Future [Text] | The Fund's past performance is not a good predictor of how the Fund will perform in the future. | |
| Average Annual Return [Table Text Block] |
|
|
| No Deduction of Taxes [Text Block] | The graph and table do not reflect the deduction of taxes that a shareholder would pay on fund distributions or redemption of fund shares. | |
| Material Change Date | Oct. 31, 2024 | |
| AssetsNet | $ 230,291,404 | $ 230,291,404 |
| Holdings Count | Holding | 64 | 64 |
| Advisory Fees Paid, Amount | $ 1,401,654 | |
| InvestmentCompanyPortfolioTurnover | 274.00% | |
| Additional Fund Statistics [Text Block] |
|
|
| Holdings [Text Block] |
|
|
| C000059521 | ||
| Shareholder Report [Line Items] | ||
| Fund Name | Dunham Long/Short Credit Fund | |
| Class Name | Class C | |
| Trading Symbol | DCAIX | |
| Annual or Semi-Annual Statement [Text Block] | This annual shareholder report contains important information about Dunham Long/Short Credit Fund ("Fund") for the period of November 1, 2023 to December 31, 2024. | |
| Shareholder Report Annual or Semi-Annual | Annual Shareholder Report | |
| Additional Information [Text Block] | You can find additional information about the Fund at https://dunham.onlineprospectus.net/Dunham/longshortcredit/. You can also request this information by contacting us at 1-800-442-4358. | |
| Material Fund Change Notice [Text Block] | This report describes changes to the Fund that occurred during the reporting period. | |
| Additional Information Phone Number | 1-800-442-4358 | |
| Additional Information Website | https://dunham.onlineprospectus.net/Dunham/longshortcredit/ | |
| Expenses [Text Block] |
|
|
| Expenses Paid, Amount | $ 192 | |
| Expense Ratio, Percent | 1.88% | |
| Performance Past Does Not Indicate Future [Text] | The Fund's past performance is not a good predictor of how the Fund will perform in the future. | |
| Average Annual Return [Table Text Block] |
|
|
| No Deduction of Taxes [Text Block] | The graph and table do not reflect the deduction of taxes that a shareholder would pay on fund distributions or redemption of fund shares. | |
| Material Change Date | Oct. 31, 2024 | |
| AssetsNet | $ 230,291,404 | $ 230,291,404 |
| Holdings Count | Holding | 64 | 64 |
| Advisory Fees Paid, Amount | $ 1,401,654 | |
| InvestmentCompanyPortfolioTurnover | 274.00% | |
| Additional Fund Statistics [Text Block] |
|
|
| Holdings [Text Block] |
|
|
| C000059522 | ||
| Shareholder Report [Line Items] | ||
| Fund Name | Dunham Long/Short Credit Fund | |
| Class Name | Class N | |
| Trading Symbol | DNAIX | |
| Annual or Semi-Annual Statement [Text Block] | This annual shareholder report contains important information about Dunham Long/Short Credit Fund ("Fund") for the period of November 1, 2023 to December 31, 2024. | |
| Shareholder Report Annual or Semi-Annual | Annual Shareholder Report | |
| Additional Information [Text Block] | You can find additional information about the Fund at https://dunham.onlineprospectus.net/Dunham/longshortcredit/. You can also request this information by contacting us at 1-800-442-4358. | |
| Material Fund Change Notice [Text Block] | This report describes changes to the Fund that occurred during the reporting period. | |
| Additional Information Phone Number | 1-800-442-4358 | |
| Additional Information Website | https://dunham.onlineprospectus.net/Dunham/longshortcredit/ | |
| Expenses [Text Block] |
|
|
| Expenses Paid, Amount | $ 90 | |
| Expense Ratio, Percent | 0.88% | |
| Performance Past Does Not Indicate Future [Text] | The Fund's past performance is not a good predictor of how the Fund will perform in the future. | |
| Average Annual Return [Table Text Block] |
|
|
| No Deduction of Taxes [Text Block] | The graph and table do not reflect the deduction of taxes that a shareholder would pay on fund distributions or redemption of fund shares. | |
| Material Change Date | Oct. 31, 2024 | |
| AssetsNet | $ 230,291,404 | $ 230,291,404 |
| Holdings Count | Holding | 64 | 64 |
| Advisory Fees Paid, Amount | $ 1,401,654 | |
| InvestmentCompanyPortfolioTurnover | 274.00% | |
| Additional Fund Statistics [Text Block] |
|
|
| Holdings [Text Block] |
|
|
| C000066378 | ||
| Shareholder Report [Line Items] | ||
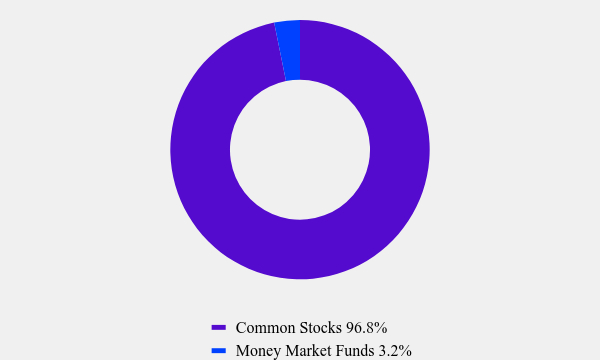
| Fund Name | Dunham Monthly Distribution Fund | |
| Class Name | Class A | |
| Trading Symbol | DAMDX | |
| Annual or Semi-Annual Statement [Text Block] | This annual shareholder report contains important information about Dunham Monthly Distribution Fund ("Fund") for the period of November 1, 2023 to October 31, 2024. | |
| Shareholder Report Annual or Semi-Annual | Annual Shareholder Report | |
| Additional Information [Text Block] | You can find additional information about the Fund at https://Dunham.onlineprospectus.net/Dunham/monthlydistribution/. You can also request this information by contacting us at 1-800-442-4358. | |
| Additional Information Phone Number | 1-800-442-4358 | |
| Additional Information Website | https://Dunham.onlineprospectus.net/Dunham/monthlydistribution/ | |
| Expenses [Text Block] |
|
|
| Expenses Paid, Amount | $ 272 | |
| Expense Ratio, Percent | 2.63% | |
| Performance Past Does Not Indicate Future [Text] | The Fund's past performance is not a good predictor of how the Fund will perform in the future. | |
| Average Annual Return [Table Text Block] |
|
|
| No Deduction of Taxes [Text Block] | The graph and table do not reflect the deduction of taxes that a shareholder would pay on fund distributions or redemption of fund shares. | |
| AssetsNet | $ 229,611,203 | $ 229,611,203 |
| Holdings Count | Holding | 45 | 45 |
| Advisory Fees Paid, Amount | $ 2,307,370 | |
| InvestmentCompanyPortfolioTurnover | 209.00% | |
| Additional Fund Statistics [Text Block] |
|
|
| Holdings [Text Block] |
|
|
| C000066379 | ||
| Shareholder Report [Line Items] | ||
| Fund Name | Dunham Monthly Distribution Fund | |
| Class Name | Class C | |
| Trading Symbol | DCMDX | |
| Annual or Semi-Annual Statement [Text Block] | This annual shareholder report contains important information about Dunham Monthly Distribution Fund ("Fund") for the period of November 1, 2023 to October 31, 2024. | |
| Shareholder Report Annual or Semi-Annual | Annual Shareholder Report | |
| Additional Information [Text Block] | You can find additional information about the Fund at https://Dunham.onlineprospectus.net/Dunham/monthlydistribution/. You can also request this information by contacting us at 1-800-442-4358. | |
| Additional Information Phone Number | 1-800-442-4358 | |
| Additional Information Website | https://Dunham.onlineprospectus.net/Dunham/monthlydistribution/ | |
| Expenses [Text Block] |
|
|
| Expenses Paid, Amount | $ 349 | |
| Expense Ratio, Percent | 3.39% | |
| Performance Past Does Not Indicate Future [Text] | The Fund's past performance is not a good predictor of how the Fund will perform in the future. | |
| Average Annual Return [Table Text Block] |
|
|
| No Deduction of Taxes [Text Block] | The graph and table do not reflect the deduction of taxes that a shareholder would pay on fund distributions or redemption of fund shares. | |
| AssetsNet | $ 229,611,203 | $ 229,611,203 |
| Holdings Count | Holding | 45 | 45 |
| Advisory Fees Paid, Amount | $ 2,307,370 | |
| InvestmentCompanyPortfolioTurnover | 209.00% | |
| Additional Fund Statistics [Text Block] |
|
|
| Holdings [Text Block] |
|
|
| C000066380 | ||
| Shareholder Report [Line Items] | ||
| Fund Name | Dunham Monthly Distribution Fund | |
| Class Name | Class N | |
| Trading Symbol | DNMDX | |
| Annual or Semi-Annual Statement [Text Block] | This annual shareholder report contains important information about Dunham Monthly Distribution Fund ("Fund") for the period of November 1, 2023 to October 31, 2024. | |
| Shareholder Report Annual or Semi-Annual | Annual Shareholder Report | |
| Additional Information [Text Block] | You can find additional information about the Fund at https://Dunham.onlineprospectus.net/Dunham/monthlydistribution/. You can also request this information by contacting us at 1-800-442-4358. | |
| Additional Information Phone Number | 1-800-442-4358 | |
| Additional Information Website | https://Dunham.onlineprospectus.net/Dunham/monthlydistribution/ | |
| Expenses [Text Block] |
|
|
| Expenses Paid, Amount | $ 245 | |
| Expense Ratio, Percent | 2.36% | |
| Performance Past Does Not Indicate Future [Text] | The Fund's past performance is not a good predictor of how the Fund will perform in the future. | |
| Average Annual Return [Table Text Block] |
|
|
| No Deduction of Taxes [Text Block] | The graph and table do not reflect the deduction of taxes that a shareholder would pay on fund distributions or redemption of fund shares. | |
| AssetsNet | $ 229,611,203 | $ 229,611,203 |
| Holdings Count | Holding | 45 | 45 |
| Advisory Fees Paid, Amount | $ 2,307,370 | |
| InvestmentCompanyPortfolioTurnover | 209.00% | |
| Additional Fund Statistics [Text Block] |
|
|
| Holdings [Text Block] |
|
|
| C000059508 | ||
| Shareholder Report [Line Items] | ||
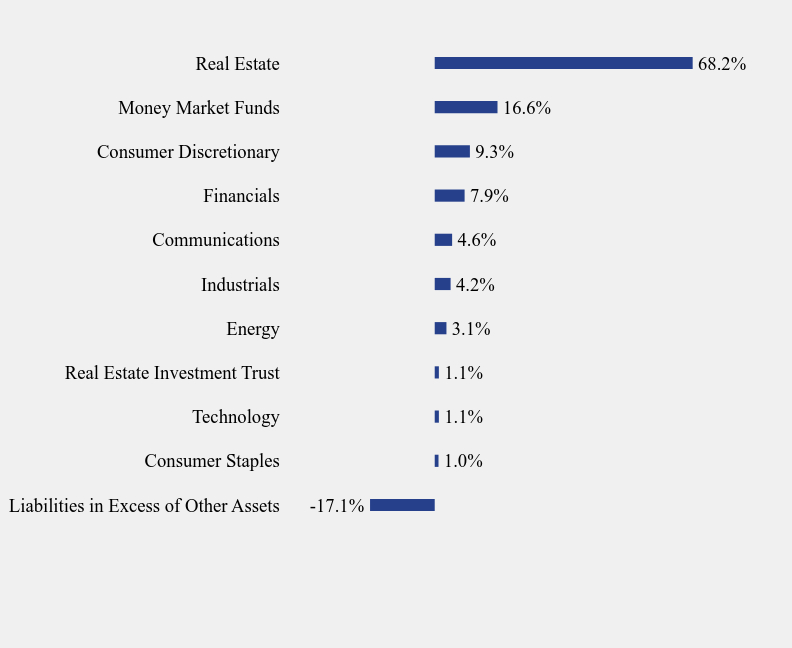
| Fund Name | Dunham Real Estate Stock Fund | |
| Class Name | Class A | |
| Trading Symbol | DAREX | |
| Annual or Semi-Annual Statement [Text Block] | This annual shareholder report contains important information about Dunham Real Estate Stock Fund ("Fund") for the period of November 1, 2023 to December 31, 2024. | |
| Shareholder Report Annual or Semi-Annual | Annual Shareholder Report | |
| Additional Information [Text Block] | You can find additional information about the Fund at https://Dunham.onlineprospectus.net/Dunham/realestate/. You can also request this information by contacting us at 1-800-442-4358. | |
| Material Fund Change Notice [Text Block] | This report describes changes to the Fund that occurred during the reporting period. | |
| Additional Information Phone Number | 1-800-442-4358 | |
| Additional Information Website | https://Dunham.onlineprospectus.net/Dunham/realestate/ | |
| Expenses [Text Block] |
|
|
| Expenses Paid, Amount | $ 193 | |
| Expense Ratio, Percent | 1.78% | |
| Performance Past Does Not Indicate Future [Text] | The Fund's past performance is not a good predictor of how the Fund will perform in the future. | |
| Average Annual Return [Table Text Block] |
|
|
| No Deduction of Taxes [Text Block] | The graph and table do not reflect the deduction of taxes that a shareholder would pay on fund distributions or redemption of fund shares. | |
| Material Change Date | Oct. 31, 2024 | |
| AssetsNet | $ 46,725,325 | $ 46,725,325 |
| Holdings Count | Holding | 42 | 42 |
| Advisory Fees Paid, Amount | $ 642,956 | |
| InvestmentCompanyPortfolioTurnover | 78.00% | |
| Additional Fund Statistics [Text Block] |
|
|
| Holdings [Text Block] |
|
|
| C000059509 | ||
| Shareholder Report [Line Items] | ||
| Fund Name | Dunham Real Estate Stock Fund | |
| Class Name | Class C | |
| Trading Symbol | DCREX | |
| Annual or Semi-Annual Statement [Text Block] | This annual shareholder report contains important information about Dunham Real Estate Stock Fund ("Fund") for the period of November 1, 2023 to October 31, 2024. | |
| Shareholder Report Annual or Semi-Annual | Annual Shareholder Report | |
| Additional Information [Text Block] | You can find additional information about the Fund at https://Dunham.onlineprospectus.net/Dunham/realestate/. You can also request this information by contacting us at 1-800-442-4358. | |
| Additional Information Phone Number | 1-800-442-4358 | |
| Additional Information Website | https://Dunham.onlineprospectus.net/Dunham/realestate/ | |
| Expenses [Text Block] |
|
|
| Expenses Paid, Amount | $ 256 | |
| Expense Ratio, Percent | 2.57% | |
| Performance Past Does Not Indicate Future [Text] | The Fund's past performance is not a good predictor of how the Fund will perform in the future. | |
| Average Annual Return [Table Text Block] |
|
|
| No Deduction of Taxes [Text Block] | The graph and table do not reflect the deduction of taxes that a shareholder would pay on fund distributions or redemption of fund shares. | |
| AssetsNet | $ 46,725,325 | $ 46,725,325 |
| Holdings Count | Holding | 42 | 42 |
| Advisory Fees Paid, Amount | $ 642,956 | |
| InvestmentCompanyPortfolioTurnover | 78.00% | |
| Additional Fund Statistics [Text Block] |
|
|
| Holdings [Text Block] |
|
|
| C000059510 | ||
| Shareholder Report [Line Items] | ||
| Fund Name | Dunham Real Estate Stock Fund | |
| Class Name | Class N | |
| Trading Symbol | DNREX | |
| Annual or Semi-Annual Statement [Text Block] | This annual shareholder report contains important information about Dunham Real Estate Stock Fund ("Fund") for the period of November 1, 2023 to December 31, 2024. | |
| Shareholder Report Annual or Semi-Annual | Annual Shareholder Report | |
| Additional Information [Text Block] | You can find additional information about the Fund at https://Dunham.onlineprospectus.net/Dunham/realestate/. You can also request this information by contacting us at 1-800-442-4358. | |
| Material Fund Change Notice [Text Block] | This report describes changes to the Fund that occurred during the reporting period. | |
| Additional Information Phone Number | 1-800-442-4358 | |
| Additional Information Website | https://Dunham.onlineprospectus.net/Dunham/realestate/ | |
| Expenses [Text Block] |
|
|
| Expenses Paid, Amount | $ 166 | |
| Expense Ratio, Percent | 1.55% | |
| Performance Past Does Not Indicate Future [Text] | The Fund's past performance is not a good predictor of how the Fund will perform in the future. | |
| Average Annual Return [Table Text Block] |
|
|
| No Deduction of Taxes [Text Block] | The graph and table do not reflect the deduction of taxes that a shareholder would pay on fund distributions or redemption of fund shares. | |
| Material Change Date | Oct. 31, 2024 | |
| AssetsNet | $ 46,725,325 | $ 46,725,325 |
| Holdings Count | Holding | 42 | 42 |
| Advisory Fees Paid, Amount | $ 642,956 | |
| InvestmentCompanyPortfolioTurnover | 78.00% | |
| Additional Fund Statistics [Text Block] |
|
|
| Holdings [Text Block] |
|
|
| C000059514 | ||
| Shareholder Report [Line Items] | ||
| Fund Name | Dunham Small Cap Growth Fund | |
| Class Name | Class A | |
| Trading Symbol | DADGX | |
| Annual or Semi-Annual Statement [Text Block] | This annual shareholder report contains important information about Dunham Small Cap Growth Fund ("Fund") for the period of November 1, 2023 to December 31, 2024. | |
| Shareholder Report Annual or Semi-Annual | Annual Shareholder Report | |
| Additional Information [Text Block] | You can find additional information about the Fund at https://dunham.onlineprospectus.net/Dunham/smallcapgrowth/. You can also request this information by contacting us at 1-800-442-4358. | |
| Material Fund Change Notice [Text Block] | This report describes changes to the Fund that occurred during the reporting period. | |
| Additional Information Phone Number | 1-800-442-4358 | |
| Additional Information Website | https://dunham.onlineprospectus.net/Dunham/smallcapgrowth/ | |
| Expenses [Text Block] |
|
|
| Expenses Paid, Amount | $ 185 | |
| Expense Ratio, Percent | 1.59% | |
| Performance Past Does Not Indicate Future [Text] | The Fund's past performance is not a good predictor of how the Fund will perform in the future. | |
| Average Annual Return [Table Text Block] |
|
|
| No Deduction of Taxes [Text Block] | The graph and table do not reflect the deduction of taxes that a shareholder would pay on fund distributions or redemption of fund shares. | |
| Material Change Date | Oct. 31, 2024 | |
| AssetsNet | $ 75,234,150 | $ 75,234,150 |
| Holdings Count | Holding | 109 | 109 |
| Advisory Fees Paid, Amount | $ 804,926 | |
| InvestmentCompanyPortfolioTurnover | 100.00% | |
| Additional Fund Statistics [Text Block] |
|
|
| Holdings [Text Block] |
|
|
| C000059515 | ||
| Shareholder Report [Line Items] | ||
| Fund Name | Dunham Small Cap Growth Fund | |
| Class Name | Class C | |
| Trading Symbol | DCDGX | |
| Annual or Semi-Annual Statement [Text Block] | This annual shareholder report contains important information about Dunham Small Cap Growth Fund ("Fund") for the period of November 1, 2023 to December 31, 2024. | |
| Shareholder Report Annual or Semi-Annual | Annual Shareholder Report | |
| Additional Information [Text Block] | You can find additional information about the Fund at https://dunham.onlineprospectus.net/Dunham/smallcapgrowth/. You can also request this information by contacting us at 1-800-442-4358. | |
| Material Fund Change Notice [Text Block] | This report describes changes to the Fund that occurred during the reporting period. | |
| Additional Information Phone Number | 1-800-442-4358 | |
| Additional Information Website | https://dunham.onlineprospectus.net/Dunham/smallcapgrowth/ | |
| Expenses [Text Block] |
|
|
| Expenses Paid, Amount | $ 269 | |
| Expense Ratio, Percent | 2.33% | |
| Performance Past Does Not Indicate Future [Text] | The Fund's past performance is not a good predictor of how the Fund will perform in the future. | |
| Average Annual Return [Table Text Block] |
|
|
| No Deduction of Taxes [Text Block] | The graph and table do not reflect the deduction of taxes that a shareholder would pay on fund distributions or redemption of fund shares. | |
| Material Change Date | Oct. 31, 2024 | |
| AssetsNet | $ 75,234,150 | $ 75,234,150 |
| Holdings Count | Holding | 109 | 109 |
| Advisory Fees Paid, Amount | $ 804,926 | |
| InvestmentCompanyPortfolioTurnover | 100.00% | |
| Additional Fund Statistics [Text Block] |
|
|
| Holdings [Text Block] |
|
|
| C000059516 | ||
| Shareholder Report [Line Items] | ||
| Fund Name | Dunham Small Cap Growth Fund | |
| Class Name | Class N | |
| Trading Symbol | DNDGX | |
| Annual or Semi-Annual Statement [Text Block] | This annual shareholder report contains important information about Dunham Small Cap Growth Fund ("Fund") for the period of November 1, 2023 to December 31, 2024. | |
| Shareholder Report Annual or Semi-Annual | Annual Shareholder Report | |
| Additional Information [Text Block] | You can find additional information about the Fund at https://dunham.onlineprospectus.net/Dunham/smallcapgrowth/. You can also request this information by contacting us at 1-800-442-4358. | |
| Material Fund Change Notice [Text Block] | This report describes changes to the Fund that occurred during the reporting period. | |
| Additional Information Phone Number | 1-800-442-4358 | |
| Additional Information Website | https://dunham.onlineprospectus.net/Dunham/smallcapgrowth/ | |
| Expenses [Text Block] |
|
|
| Expenses Paid, Amount | $ 154 | |
| Expense Ratio, Percent | 1.32% | |
| Performance Past Does Not Indicate Future [Text] | The Fund's past performance is not a good predictor of how the Fund will perform in the future. | |
| Average Annual Return [Table Text Block] |
|
|
| No Deduction of Taxes [Text Block] | The graph and table do not reflect the deduction of taxes that a shareholder would pay on fund distributions or redemption of fund shares. | |
| Material Change Date | Oct. 31, 2024 | |
| AssetsNet | $ 75,234,150 | $ 75,234,150 |
| Holdings Count | Holding | 109 | 109 |
| Advisory Fees Paid, Amount | $ 804,926 | |
| InvestmentCompanyPortfolioTurnover | 100.00% | |
| Additional Fund Statistics [Text Block] |
|
|
| Holdings [Text Block] |
|
|
| C000059517 | ||
| Shareholder Report [Line Items] | ||
| Fund Name | Dunham Small Cap Value Fund | |
| Class Name | Class A | |
| Trading Symbol | DASVX | |
| Annual or Semi-Annual Statement [Text Block] | This annual shareholder report contains important information about Dunham Small Cap Value Fund ("Fund") for the period of November 1, 2023 to October 31, 2024. | |
| Shareholder Report Annual or Semi-Annual | Annual Shareholder Report | |
| Additional Information [Text Block] | You can find additional information about the Fund at https://Dunham.onlineprospectus.net/Dunham/smallcapvalue/. You can also request this information by contacting us at 1-800-442-4358. | |
| Material Fund Change Notice [Text Block] | This report describes change to the Fund that occurred during the reporting period. | |
| Additional Information Phone Number | 1-800-442-4358 | |
| Additional Information Website | https://Dunham.onlineprospectus.net/Dunham/smallcapvalue/ | |
| Expenses [Text Block] |
|
|
| Expenses Paid, Amount | $ 177 | |
| Expense Ratio, Percent | 1.56% | |
| Performance Past Does Not Indicate Future [Text] | The Fund's past performance is not a good predictor of how the Fund will perform in the future. | |
| Average Annual Return [Table Text Block] |
|
|
| No Deduction of Taxes [Text Block] | The graph and table do not reflect the deduction of taxes that a shareholder would pay on fund distributions or redemption of fund shares. | |
| AssetsNet | $ 99,177,987 | $ 99,177,987 |
| Holdings Count | Holding | 207 | 207 |
| Advisory Fees Paid, Amount | $ 868,807 | |
| InvestmentCompanyPortfolioTurnover | 159.00% | |
| Additional Fund Statistics [Text Block] |
|
|
| Holdings [Text Block] |
|
|
| C000059518 | ||
| Shareholder Report [Line Items] | ||
| Fund Name | Dunham Small Cap Value Fund | |
| Class Name | Class C | |
| Trading Symbol | DCSVX | |
| Annual or Semi-Annual Statement [Text Block] | This annual shareholder report contains important information about Dunham Small Cap Value Fund ("Fund") for the period of November 1, 2023 to October 31, 2024. | |
| Shareholder Report Annual or Semi-Annual | Annual Shareholder Report | |
| Additional Information [Text Block] | You can find additional information about the Fund at https://Dunham.onlineprospectus.net/Dunham/smallcapvalue/. You can also request this information by contacting us at 1-800-442-4358. | |
| Material Fund Change Notice [Text Block] | This report describes change to the Fund that occurred during the reporting period. | |
| Additional Information Phone Number | 1-800-442-4358 | |
| Additional Information Website | https://Dunham.onlineprospectus.net/Dunham/smallcapvalue/ | |
| Expenses [Text Block] |
|
|
| Expenses Paid, Amount | $ 262 | |
| Expense Ratio, Percent | 2.32% | |
| Performance Past Does Not Indicate Future [Text] | The Fund's past performance is not a good predictor of how the Fund will perform in the future. | |
| Average Annual Return [Table Text Block] |
|
|
| No Deduction of Taxes [Text Block] | The graph and table do not reflect the deduction of taxes that a shareholder would pay on fund distributions or redemption of fund shares. | |
| AssetsNet | $ 99,177,987 | $ 99,177,987 |
| Holdings Count | Holding | 207 | 207 |
| Advisory Fees Paid, Amount | $ 868,807 | |
| InvestmentCompanyPortfolioTurnover | 159.00% | |
| Additional Fund Statistics [Text Block] |
|
|
| Holdings [Text Block] |
|
|
| C000059519 | ||
| Shareholder Report [Line Items] | ||
| Fund Name | Dunham Small Cap Value Fund | |
| Class Name | Class N | |
| Trading Symbol | DNSVX | |
| Annual or Semi-Annual Statement [Text Block] | This annual shareholder report contains important information about Dunham Small Cap Value Fund ("Fund") for the period of November 1, 2023 to October 31, 2024. | |
| Shareholder Report Annual or Semi-Annual | Annual Shareholder Report | |
| Additional Information [Text Block] | You can find additional information about the Fund at https://Dunham.onlineprospectus.net/Dunham/smallcapvalue/. You can also request this information by contacting us at 1-800-442-4358. | |
| Material Fund Change Notice [Text Block] | This report describes change to the Fund that occurred during the reporting period. | |
| Additional Information Phone Number | 1-800-442-4358 | |
| Additional Information Website | https://Dunham.onlineprospectus.net/Dunham/smallcapvalue/ | |
| Expenses [Text Block] |
|
|
| Expenses Paid, Amount | $ 148 | |
| Expense Ratio, Percent | 1.30% | |
| Performance Past Does Not Indicate Future [Text] | The Fund's past performance is not a good predictor of how the Fund will perform in the future. | |
| Average Annual Return [Table Text Block] |
|
|
| No Deduction of Taxes [Text Block] | The graph and table do not reflect the deduction of taxes that a shareholder would pay on fund distributions or redemption of fund shares. | |
| AssetsNet | $ 99,177,987 | $ 99,177,987 |
| Holdings Count | Holding | 207 | 207 |
| Advisory Fees Paid, Amount | $ 868,807 | |
| InvestmentCompanyPortfolioTurnover | 159.00% | |
| Additional Fund Statistics [Text Block] |
|
|
| Holdings [Text Block] |
|
|
| C000241914 | ||
| Shareholder Report [Line Items] | ||
| Fund Name | Dunham U.S. Enhanced Market Fund | |
| Class Name | Class A | |
| Trading Symbol | DASPX | |
| Annual or Semi-Annual Statement [Text Block] | This annual shareholder report contains important information about Dunham U.S. Enhanced Market Fund ("Fund") for the period of November 1, 2023 to October 31, 2024. | |
| Shareholder Report Annual or Semi-Annual | Annual Shareholder Report | |
| Additional Information [Text Block] | You can find additional information about the Fund at https://Dunham.onlineprospectus.net/Dunham/usenhancedmarket/. You can also request this information by contacting us at 1-800-442-4358. | |
| Additional Information Phone Number | 1-800-442-4358 | |
| Additional Information Website | https://Dunham.onlineprospectus.net/Dunham/usenhancedmarket/ | |
| Expenses [Text Block] |
|
|
| Expenses Paid, Amount | $ 184 | |
| Expense Ratio, Percent | 1.54% | |
| Performance Past Does Not Indicate Future [Text] | The Fund's past performance is not a good predictor of how the Fund will perform in the future. | |
| Average Annual Return [Table Text Block] |
|
|
| Performance Inception Date | May 01, 2023 | |
| No Deduction of Taxes [Text Block] | The graph and table do not reflect the deduction of taxes that a shareholder would pay on fund distributions or redemption of fund shares. | |
| Material Change Date | Oct. 31, 2024 | |
| AssetsNet | $ 99,352,055 | $ 99,352,055 |
| Holdings Count | Holding | 12 | 12 |
| Advisory Fees Paid, Amount | $ 1,014,241 | |
| InvestmentCompanyPortfolioTurnover | 66.00% | |
| Additional Fund Statistics [Text Block] |
|
|
| Holdings [Text Block] |
|
|
| C000241912 | ||
| Shareholder Report [Line Items] | ||
| Fund Name | Dunham U.S. Enhanced Market Fund | |
| Class Name | Class C | |
| Trading Symbol | DCSPX | |
| Annual or Semi-Annual Statement [Text Block] | This annual shareholder report contains important information about Dunham U.S. Enhanced Market Fund ("Fund") for the period of November 1, 2023 to October 31, 2024. | |
| Shareholder Report Annual or Semi-Annual | Annual Shareholder Report | |
| Additional Information [Text Block] | You can find additional information about the Fund at https://Dunham.onlineprospectus.net/Dunham/usenhancedmarket/. You can also request this information by contacting us at 1-800-442-4358. | |
| Additional Information Phone Number | 1-800-442-4358 | |
| Additional Information Website | https://Dunham.onlineprospectus.net/Dunham/usenhancedmarket/ | |
| Expenses [Text Block] |
|
|
| Expenses Paid, Amount | $ 273 | |
| Expense Ratio, Percent | 2.29% | |
| Performance Past Does Not Indicate Future [Text] | The Fund's past performance is not a good predictor of how the Fund will perform in the future. | |
| Average Annual Return [Table Text Block] |
|
|
| Performance Inception Date | May 01, 2023 | |
| No Deduction of Taxes [Text Block] | The graph and table do not reflect the deduction of taxes that a shareholder would pay on fund distributions or redemption of fund shares. | |
| Material Change Date | Oct. 31, 2024 | |
| AssetsNet | $ 99,352,055 | $ 99,352,055 |
| Holdings Count | Holding | 12 | 12 |
| Advisory Fees Paid, Amount | $ 1,014,241 | |
| InvestmentCompanyPortfolioTurnover | 66.00% | |
| Additional Fund Statistics [Text Block] |
|
|
| Holdings [Text Block] |
|
|
| C000241913 | ||
| Shareholder Report [Line Items] | ||
| Fund Name | Dunham U.S. Enhanced Market Fund | |
| Class Name | Class N | |
| Trading Symbol | DNSPX | |
| Annual or Semi-Annual Statement [Text Block] | This annual shareholder report contains important information about Dunham U.S. Enhanced Market Fund ("Fund") for the period of November 1, 2023 to October 31, 2024. | |
| Shareholder Report Annual or Semi-Annual | Annual Shareholder Report | |
| Additional Information [Text Block] | You can find additional information about the Fund at https://Dunham.onlineprospectus.net/Dunham/usenhancedmarket/. You can also request this information by contacting us at 1-800-442-4358. | |
| Additional Information Phone Number | 1-800-442-4358 | |
| Additional Information Website | https://Dunham.onlineprospectus.net/Dunham/usenhancedmarket/ | |
| Expenses [Text Block] |
|
|
| Expenses Paid, Amount | $ 155 | |
| Expense Ratio, Percent | 1.29% | |
| Performance Past Does Not Indicate Future [Text] | The Fund's past performance is not a good predictor of how the Fund will perform in the future. | |
| Average Annual Return [Table Text Block] |
|
|
| Performance Inception Date | May 01, 2023 | |
| No Deduction of Taxes [Text Block] | The graph and table do not reflect the deduction of taxes that a shareholder would pay on fund distributions or redemption of fund shares. | |
| Material Change Date | Oct. 31, 2024 | |
| AssetsNet | $ 99,352,055 | $ 99,352,055 |
| Holdings Count | Holding | 12 | 12 |
| Advisory Fees Paid, Amount | $ 1,014,241 | |
| InvestmentCompanyPortfolioTurnover | 66.00% | |
| Additional Fund Statistics [Text Block] |
|
|
| Holdings [Text Block] |
|