Pay vs Performance Disclosure
number in Millions |
12 Months Ended |
|
Dec. 31, 2024
USD ($)
|
Dec. 31, 2023
USD ($)
|
Dec. 31, 2022
USD ($)
|
| Pay vs Performance Disclosure |
|
|
|
| Pay vs Performance Disclosure, Table |
| | | | | | | | | | | | | | | | | | | | | | | | | | | | | | | | | | | | | | | | | | | | | | | | | | | Fiscal Year(1) | | Summary Compensation Table Total for PEO(2) | | Compensation Actually Paid to PEO(3) | | Average Summary Compensation Table Total for non-PEO NEOs(2) | | Average Compensation Actually Paid to non-PEO NEOs(3) | | Value of Initial Fixed $100 Investment Based On:(4) | | Net Income ($ millions)(6) | | Adjusted EBITDA ($ millions)(7) | | | | | | Total Shareholder Return | | Peer Group Total Shareholder Return(5) | | | | (a) | | (b) | | (c) | | (d) | | (e) | | (f) | | (g) | | (h) | | (i) | 2024 | | $3,140,924.00 | | $2,418,955.00 | | $1,005,791.00 | | $929,884.00 | | $34.34 | | $107.05 | | $(154.00) | | $100.10 | | 2023 | | $3,344,902.00 | | $1,623,393.00 | | $859,491.00 | | $608,623.00 | | $45.51 | | $104.88 | | $(79.00) | | $97.60 | 2022 | | $7,306,431.00 | | $3,576,015.00 | | $1,163,613.00 | | $709,649.00 | | $57.87 | | $99.72 | | $(38.30) | | $149.30 |
|
|
|
| Company Selected Measure Name |
Adjusted EBITDA
|
|
|
| Named Executive Officers, Footnote |
Ms. Jacobsmeyer served as our Principal Executive Officer (PEO) for each of 2022, 2023, and 2024. Our non-PEO NEOs for 2024 were Mses. Carlisle, Jolley and Marion and Messrs. Black and Solomon; for 2023 were Mses. Carlisle, Jolley, and Marion and Mr. Black, and for 2022 were Mses. Carlisle, Jolley, Kalvaitis, and Marion and Mr. Knight.
|
|
|
| Peer Group Issuers, Footnote |
The peer group for which TSR is provided in column (g) is the S&P Health Care Service Select Constituents Industry Index, (the Peer Group) which is used for the Company’s stock performance chart in the 2024 Form 10-K.
|
|
|
| PEO Total Compensation Amount |
$ 3,140,924
|
$ 3,344,902
|
$ 7,306,431
|
| PEO Actually Paid Compensation Amount |
$ 2,418,955
|
1,623,393
|
3,576,015
|
| Adjustment To PEO Compensation, Footnote |
The following amounts were deducted from / added to the SCT total compensation in accordance with the SEC-mandated adjustments to calculate CAP to our PEO and average CAP to our Non-PEO NEOs. The fair value of equity awards was determined using methodologies and assumptions developed in a manner substantively consistent with those used to determine the grant date fair value of such awards. PEO SCT Total to CAP Reconciliation
| | | | | | | Fiscal Year | 2024 | | SCT Total | $3,140,924 | – Grant Date Fair Value of Stock Awards Granted in Fiscal Year | (2,065,211) | | ± Fair Value at Fiscal Year-End of Outstanding and Unvested Option Awards and Stock Awards Granted in Fiscal Year | 2,212,440 | ± Change in Fair Value of Outstanding and Unvested Option Awards and Stock Awards Granted in Prior Fiscal Years | (788,415) | | ± Fair Value at Vesting of Option Awards and Stock Awards Granted in Fiscal Year That Vested During Fiscal Year | — | ± Change in Fair Value of Option Awards and Stock Awards Granted in Prior Fiscal Years For Which Applicable Vesting Conditions Were Satisfied During Fiscal Year | (80,783) | | - Fair Value as of Prior Fiscal Year-End of Option Awards and Stock Awards Granted in Prior Fiscal Years That Failed to Meet Applicable Vesting Conditions During Fiscal Year | — | ∓ Dividends or Other Earnings Paid on Stock or Option Awards in the Fiscal Year Prior to the Vesting Date that are not otherwise included in the Total Compensation for the Fiscal Year | — | Compensation Actually Paid | $ | 2,418,955 | |
|
|
|
| Non-PEO NEO Average Total Compensation Amount |
$ 1,005,791
|
859,491
|
1,163,613
|
| Non-PEO NEO Average Compensation Actually Paid Amount |
$ 929,884
|
608,623
|
709,649
|
| Adjustment to Non-PEO NEO Compensation Footnote |
The following amounts were deducted from / added to the SCT total compensation in accordance with the SEC-mandated adjustments to calculate CAP to our PEO and average CAP to our Non-PEO NEOs. The fair value of equity awards was determined using methodologies and assumptions developed in a manner substantively consistent with those used to determine the grant date fair value of such awards. Non-PEO NEO Average SCT Total to Average CAP Reconciliation | | | | | | | Fiscal Year | 2024 | | Average SCT Total | $ | 1,005,791 | | – Grant Date Fair Value of Option Awards and Stock Awards Granted in Fiscal Year | (449,509) | Fair Value at Fiscal Year-End of Outstanding and Unvested Option Awards and Stock Awards Granted in Fiscal Year | 448,586 | ± Change in Fair Value of Outstanding and Unvested Option Awards and Stock Awards Granted in Prior Fiscal Years | (64,665) | Fair Value at Vesting of Option Awards and Stock Awards Granted in Fiscal Year That Vested During Fiscal Year | — | ± Change in Fair Value of Option Awards and Stock Awards Granted in Prior Fiscal Years For Which Applicable Vesting Conditions Were Satisfied During Fiscal Year | (10,319) | | - Fair Value as of Prior Fiscal Year-End of Option Awards and Stock Awards Granted in Prior Fiscal Years That Failed to Meet Applicable Vesting Conditions During Fiscal Year | — | | ∓ Dividends or Other Earnings Paid on Stock or Option Awards in the Fiscal Year Prior to the Vesting Date that are not otherwise included in the Total Compensation for the Fiscal Year | — | Average Compensation Actually Paid | $ | 929,884 | |
|
|
|
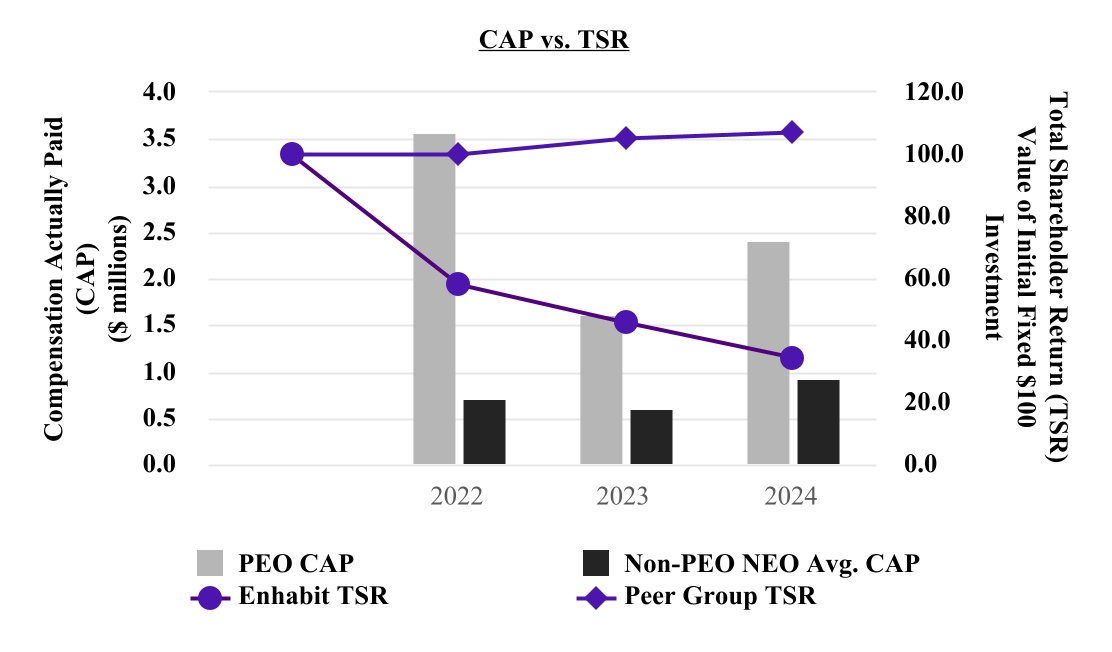
| Compensation Actually Paid vs. Total Shareholder Return |
The chart below illustrates the relationship between the PEO CAP and Non-PEO NEO average CAP amounts and the Company’s and Peer Group’s TSR during 2022 - 2024 assuming a $100 initial investment on July 1, 2022.
|
|
|
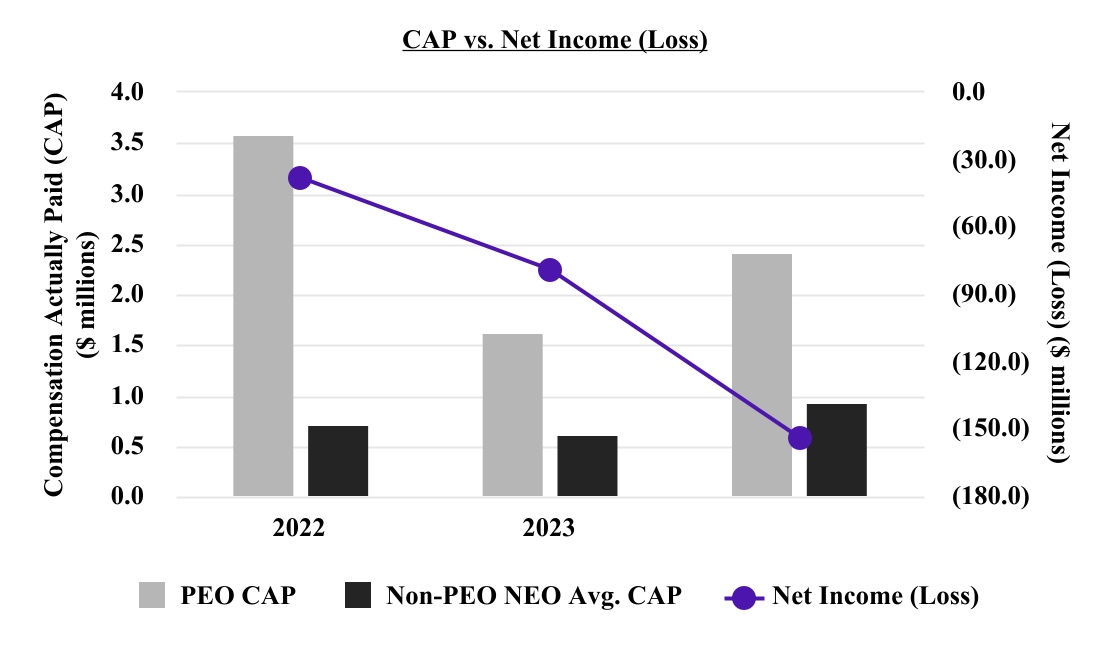
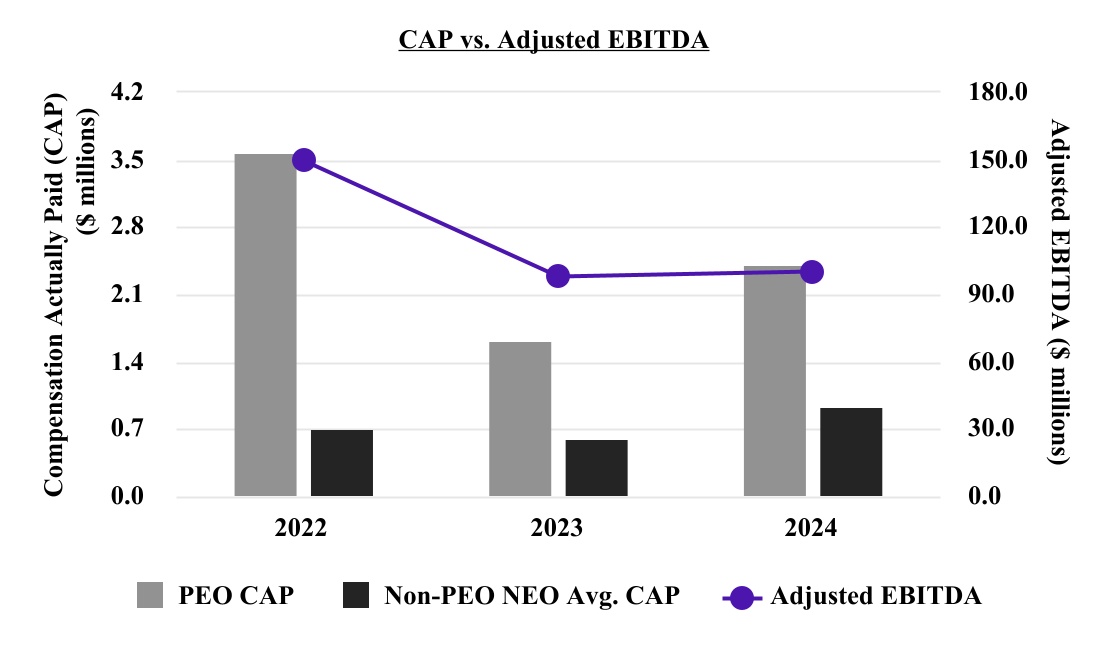
| Compensation Actually Paid vs. Net Income |
The charts below illustrate the relationship between the PEO CAP and Non-PEO NEO average CAP amounts and the Company’s Net Income and Adjusted EBITDA during 2022 - 2024.
|
|
|
| Compensation Actually Paid vs. Company Selected Measure |
|
|
|
| Total Shareholder Return Vs Peer Group |
The chart below illustrates the relationship between the PEO CAP and Non-PEO NEO average CAP amounts and the Company’s and Peer Group’s TSR during 2022 - 2024 assuming a $100 initial investment on July 1, 2022.
|
|
|
| Tabular List, Table |
| | | Most Important Performance Measures | Adjusted EBITDA | Adjusted Free Cash Flow | Relative Total Shareholder Return |
|
|
|
| Total Shareholder Return Amount |
$ 34.34
|
45.51
|
57.87
|
| Peer Group Total Shareholder Return Amount |
107.05
|
104.88
|
99.72
|
| Net Income (Loss) |
$ (154,000,000.00)
|
$ (79,000,000.00)
|
$ (38,300,000)
|
| Company Selected Measure Amount |
100.1
|
97.6
|
149.3
|
| PEO Name |
Ms. Jacobsmeyer
|
|
|
| Additional 402(v) Disclosure |
Amounts reported represent (i) the total compensation reported in the Summary Compensation Table (“SCT”) for each respective year in the case of our PEO and (ii) the average of the total compensation reported in the SCT for each respective year for our Non-PEO NEOs for such years.Pursuant to rules of the SEC, total shareholder return (TSR) assumes $100 was invested on July 1, 2022 (i.e., the date we became a publicly traded company) in our common stock or the common stock of the Peer Group (as defined below), as applicable.Net income (loss) for periods prior the Separation is attributable to Encompass’ home health and hospice segment.
|
|
|
| Measure:: 1 |
|
|
|
| Pay vs Performance Disclosure |
|
|
|
| Name |
Adjusted EBITDA
|
|
|
| Non-GAAP Measure Description |
Adjusted EBITDA is a non-GAAP measure and calculated as GAAP Net income (loss) adjusted to exclude (i) income tax (benefit) expense, (ii) interest expense and amortization of debt discounts and fees, (iii) depreciation and amortization, (iv) gains or losses on disposal or impairment of assets or goodwill, (v) stock‑based compensation, (vi) net income attributable to noncontrolling interest, (vii) unusual or nonrecurring items not typical of ongoing operations, and (viii) gain on consolidation of joint venture formerly accounted for under the equity method of accounting.
|
|
|
| Measure:: 2 |
|
|
|
| Pay vs Performance Disclosure |
|
|
|
| Name |
Adjusted Free Cash Flow
|
|
|
| Measure:: 3 |
|
|
|
| Pay vs Performance Disclosure |
|
|
|
| Name |
Relative Total Shareholder Return
|
|
|
| PEO | Aggregate Grant Date Fair Value of Equity Award Amounts Reported in Summary Compensation Table |
|
|
|
| Pay vs Performance Disclosure |
|
|
|
| Adjustment to Compensation, Amount |
$ (2,065,211)
|
|
|
| PEO | Year-end Fair Value of Equity Awards Granted in Covered Year that are Outstanding and Unvested |
|
|
|
| Pay vs Performance Disclosure |
|
|
|
| Adjustment to Compensation, Amount |
2,212,440
|
|
|
| PEO | Year-over-Year Change in Fair Value of Equity Awards Granted in Prior Years That are Outstanding and Unvested |
|
|
|
| Pay vs Performance Disclosure |
|
|
|
| Adjustment to Compensation, Amount |
(788,415)
|
|
|
| PEO | Vesting Date Fair Value of Equity Awards Granted and Vested in Covered Year |
|
|
|
| Pay vs Performance Disclosure |
|
|
|
| Adjustment to Compensation, Amount |
0
|
|
|
| PEO | Change in Fair Value as of Vesting Date of Prior Year Equity Awards Vested in Covered Year |
|
|
|
| Pay vs Performance Disclosure |
|
|
|
| Adjustment to Compensation, Amount |
(80,783)
|
|
|
| PEO | Prior Year End Fair Value of Equity Awards Granted in Any Prior Year that Fail to Meet Applicable Vesting Conditions During Covered Year |
|
|
|
| Pay vs Performance Disclosure |
|
|
|
| Adjustment to Compensation, Amount |
0
|
|
|
| PEO | Dividends or Other Earnings Paid on Equity Awards not Otherwise Reflected in Total Compensation for Covered Year |
|
|
|
| Pay vs Performance Disclosure |
|
|
|
| Adjustment to Compensation, Amount |
0
|
|
|
| Non-PEO NEO | Aggregate Grant Date Fair Value of Equity Award Amounts Reported in Summary Compensation Table |
|
|
|
| Pay vs Performance Disclosure |
|
|
|
| Adjustment to Compensation, Amount |
(449,509)
|
|
|
| Non-PEO NEO | Year-end Fair Value of Equity Awards Granted in Covered Year that are Outstanding and Unvested |
|
|
|
| Pay vs Performance Disclosure |
|
|
|
| Adjustment to Compensation, Amount |
448,586
|
|
|
| Non-PEO NEO | Year-over-Year Change in Fair Value of Equity Awards Granted in Prior Years That are Outstanding and Unvested |
|
|
|
| Pay vs Performance Disclosure |
|
|
|
| Adjustment to Compensation, Amount |
(64,665)
|
|
|
| Non-PEO NEO | Vesting Date Fair Value of Equity Awards Granted and Vested in Covered Year |
|
|
|
| Pay vs Performance Disclosure |
|
|
|
| Adjustment to Compensation, Amount |
0
|
|
|
| Non-PEO NEO | Change in Fair Value as of Vesting Date of Prior Year Equity Awards Vested in Covered Year |
|
|
|
| Pay vs Performance Disclosure |
|
|
|
| Adjustment to Compensation, Amount |
(10,319)
|
|
|
| Non-PEO NEO | Prior Year End Fair Value of Equity Awards Granted in Any Prior Year that Fail to Meet Applicable Vesting Conditions During Covered Year |
|
|
|
| Pay vs Performance Disclosure |
|
|
|
| Adjustment to Compensation, Amount |
0
|
|
|
| Non-PEO NEO | Dividends or Other Earnings Paid on Equity Awards not Otherwise Reflected in Total Compensation for Covered Year |
|
|
|
| Pay vs Performance Disclosure |
|
|
|
| Adjustment to Compensation, Amount |
$ 0
|
|
|