| Q1 2025 | Company Update |

| Statement Regarding Non-IFRS Measures Key Business Measures This presentation may contain “forward-looking statements” which include, but are not limited to, statements regarding future events and other statements that are not historical facts. Forward-looking statements are generally accompanied by words such as “believe,” “may,” “will,” “estimate,” “continue,” “anticipate,” “intend,” “expect,” “should,” “would,” “plan,” “predict,” “potential,” “seem,” “seek,” “future,” “outlook” and similar expressions that predict or indicate future events or trends or that are not statements of historical matters. For example, Swvl is using forward-looking statements when it discusses its technology, solutions and product suite capabilities; the belief that its solutions will enable the operation of a fully optimized transportation network, empowering accessible, ecient and reliable transportation; the expansion of its business in the United States and the United Kingdom; its long-term sustainability and dollar-pegged growth; the expansion of dollar-pegged revenue to reduce exposure to changes in foreign currencies; the expansion of engineering operations and support teams in some of the cost-eective markets it operates in; the expectation that its new cohort of contracts will continue to grow year-over-year (YoY) while its commercial engine will consistently bring in new cohorts of contracts at an accelerating pace; and the expectation that its strong gross prot growth positions Swvl for continued success in the years ahead and the expected revenue and gross margin in the upcoming scal year. These statements are based on the current expectations of Swvl’s management and are not predictions of actual performance. These forward-looking statements must not be relied on by any investor as a guarantee, assurance, prediction, or denitive statement of fact or probability. Actual results and outcomes could dier materially for a variety of reasons, including, among others, general economic, political and business conditions; the ability of Swvl to execute its growth strategy, manage growth protably and retain its key employees; competition with other companies in the mobility industry; Swvl’s limited operating history and lack of experience as a public company; recent implementation of certain policies and procedures to ensure compliance with applicable laws and regulations, including with respect to anti-bribery, anti-corruption, and cyber protection; the risk that Swvl is not able to execute its portfolio optimization plan; the risk that Swvl is unable to attract and retain consumers and qualied drivers and other high quality personnel; the risk that Swvl is unable to protect and enforce its intellectual property rights; the risk that Swvl is unable to determine rider demand to develop new oerings on its platform; the diculty of obtaining required registrations, licenses, permits or approvals in jurisdictions in which Swvl currently operates or may in the future operate; the fact that Swvl currently operates in and intends to expand into jurisdictions that are, or have been, characterized by political instability, may have inadequate or limited regulatory and legal frameworks and may have limited, if any, treaties or other arrangements in place to protect foreign investment or involvement; the risk that Swvl’s drivers could be classied as employees, workers or quasi-employees in the jurisdictions they operate; the fact that Swvl has operations in countries known to experience high levels of corruption and is subject to territorial anticorruption laws in these jurisdictions; the ability of Swvl to maintain the listing of its securities on Nasdaq; Swvl’s acquisitions may not be benecial to Swvl as a result of the cost of integrating geographically disparate operations and the diversion of management’s attention from its existing business, among other things; and other risks that will be detailed from time to time in lings with the U.S. Securities and Exchange Commission. The foregoing list of risk factors is not exhaustive. There may be additional risks that Swvl presently does not know or that Swvl currently believes are immaterial that could also cause actual results to dier from those contained in forward-looking statements. In addition, forward-looking statements provide Swvl’s expectations, plans or forecasts of future events and views as of the date of this communication. Swvl anticipates that subsequent events and developments will cause Swvl’s assessments and projections to change. However, while Swvl may elect to update these forward-looking statements in the future, Swvl specically disclaims any obligation to do so. These forward-looking statements should not be relied upon as representing Swvl’s assessments as of any date subsequent to the date of this presentation. Accordingly, undue reliance should not be placed upon the forward-looking statements. This presentation includes references to non-IFRS nancial measures, which include amounts presented in local currencies. However, the presentation of these non-IFRS nancial measures is not intended to be considered in isolation from, or as an alternative to, nancial measures determined in accordance with IFRS. In addition, these non-IFRS nancial measures may dier from non-IFRS nancial measures with comparable names used by other companies. Swvl uses these non-IFRS nancial measures for nancial and operational decision-making and as a means to evaluate period-to-period comparisons, and Swvl’s management believes that these non-IFRS nancial measures providemeaningful supplemental information regarding its performance by excluding certain items that may not be indicative of recurring core business operating results. There are a number of limitations related to the use of non-IFRS nancial measures. In light of these limitations, we provide specic information regarding the IFRS amounts excluded from these non-IFRS nancial measures and evaluate these non-IFRS nancial measures together with their relevant nancial measures in accordance with IFRS. An explanation of the non-IFRS nancial measures referenced in this presentation can be found below: For a reconciliation to the most directly comparable IFRS measures please see Appendix A. In addition to the measures presented in our consolidated nancial statements, this presentation includes references to certain key business measures that Swvl’s management uses to help evaluate and identify trends aecting Swvl’s business, formulate business plans and make strategic decisions. The key business measures referenced in this presentation are set forth below. Dollar-Pegged Revenue, Recurring Revenue, Transactional Revenue and Exit Margin, which are dened in Appendix A Disclaimer 2 |
| About Swvl Swvl is an end-to-end mobility operating system designed to transform urban transportation by making it more accessible, ecient, and reliable. Our platform leverages real-time data, adaptive networks, and advanced technology to optimize mobility solutions for riders and drivers, ensuring seamless, dynamic operations. By oering tailored mobility solutions for various use cases, such as rst- and last-mile connectivity, schools, universities, corporations, and factories hubs, Swvl empowers cities to create more inclusive and ecient transit systems. Through flexible access options and a focus on reducing CO2 emissions and operational costs, Swvl enhances shared mobility's overall reliability and sustainability in smarter cities. With products like the Rider & Captain app, Admin Console, and real-time data capabilities, Swvl is the future of smart shared mobility. 3 |

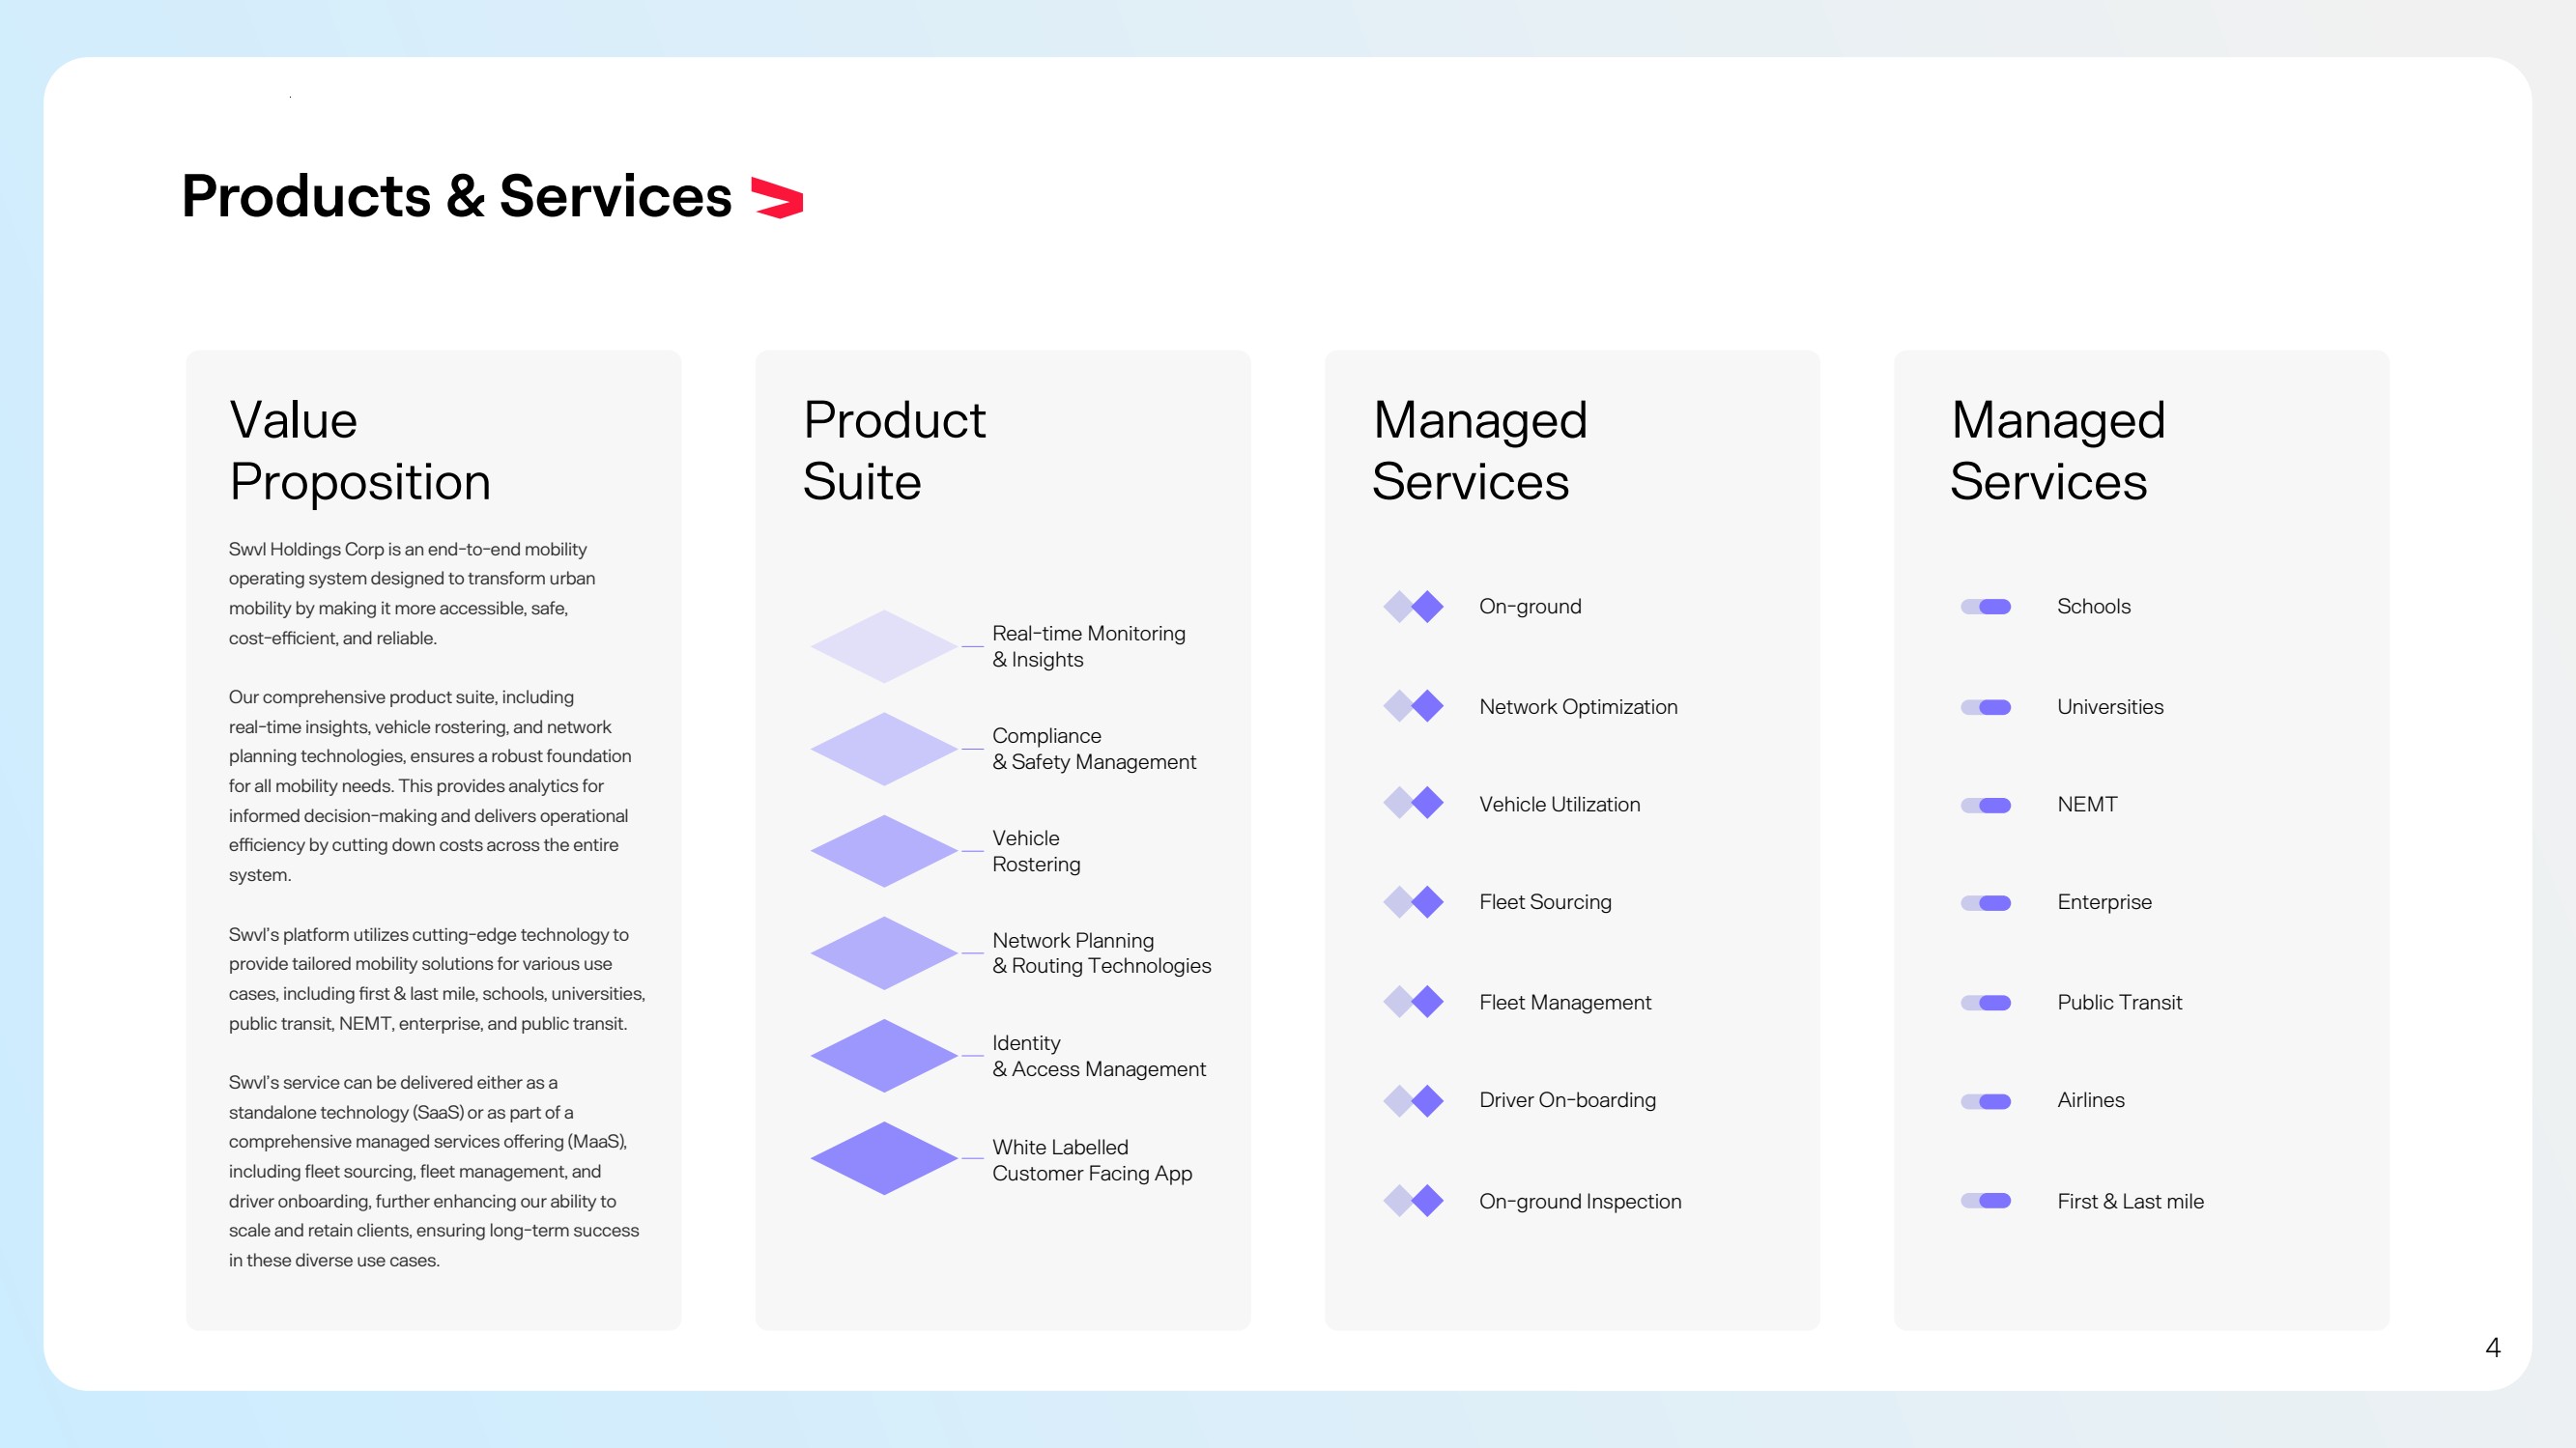
| Products & Services Value Proposition Product Suite Managed Services Real-time Monitoring & Insights Compliance & Safety Management Vehicle Rostering Network Planning & Routing Technologies Identity & Access Management White Labelled Customer Facing App On-ground Network Optimization Vehicle Utilization Fleet Sourcing Fleet Management Driver On-boarding On-ground Inspection Swvl Holdings Corp is an end-to-end mobility operating system designed to transform urban mobility by making it more accessible, safe, cost-ecient, and reliable. Our comprehensive product suite, including real-time insights, vehicle rostering, and network planning technologies, ensures a robust foundation for all mobility needs. This provides analytics for informed decision-making and delivers operational eciency by cutting down costs across the entire system. Swvl’s platform utilizes cutting-edge technology to provide tailored mobility solutions for various use cases, including rst & last mile, schools, universities, public transit, NEMT, enterprise, and public transit. Swvl’s service can be delivered either as a standalone technology (SaaS) or as part of a comprehensive managed services oering (MaaS), including fleet sourcing, fleet management, and driver onboarding, further enhancing our ability to scale and retain clients, ensuring long-term success in these diverse use cases. Managed Services Schools Universities NEMT Enterprise Public Transit Airlines First & Last mile 4 |
| Strategy Highlight 5 |

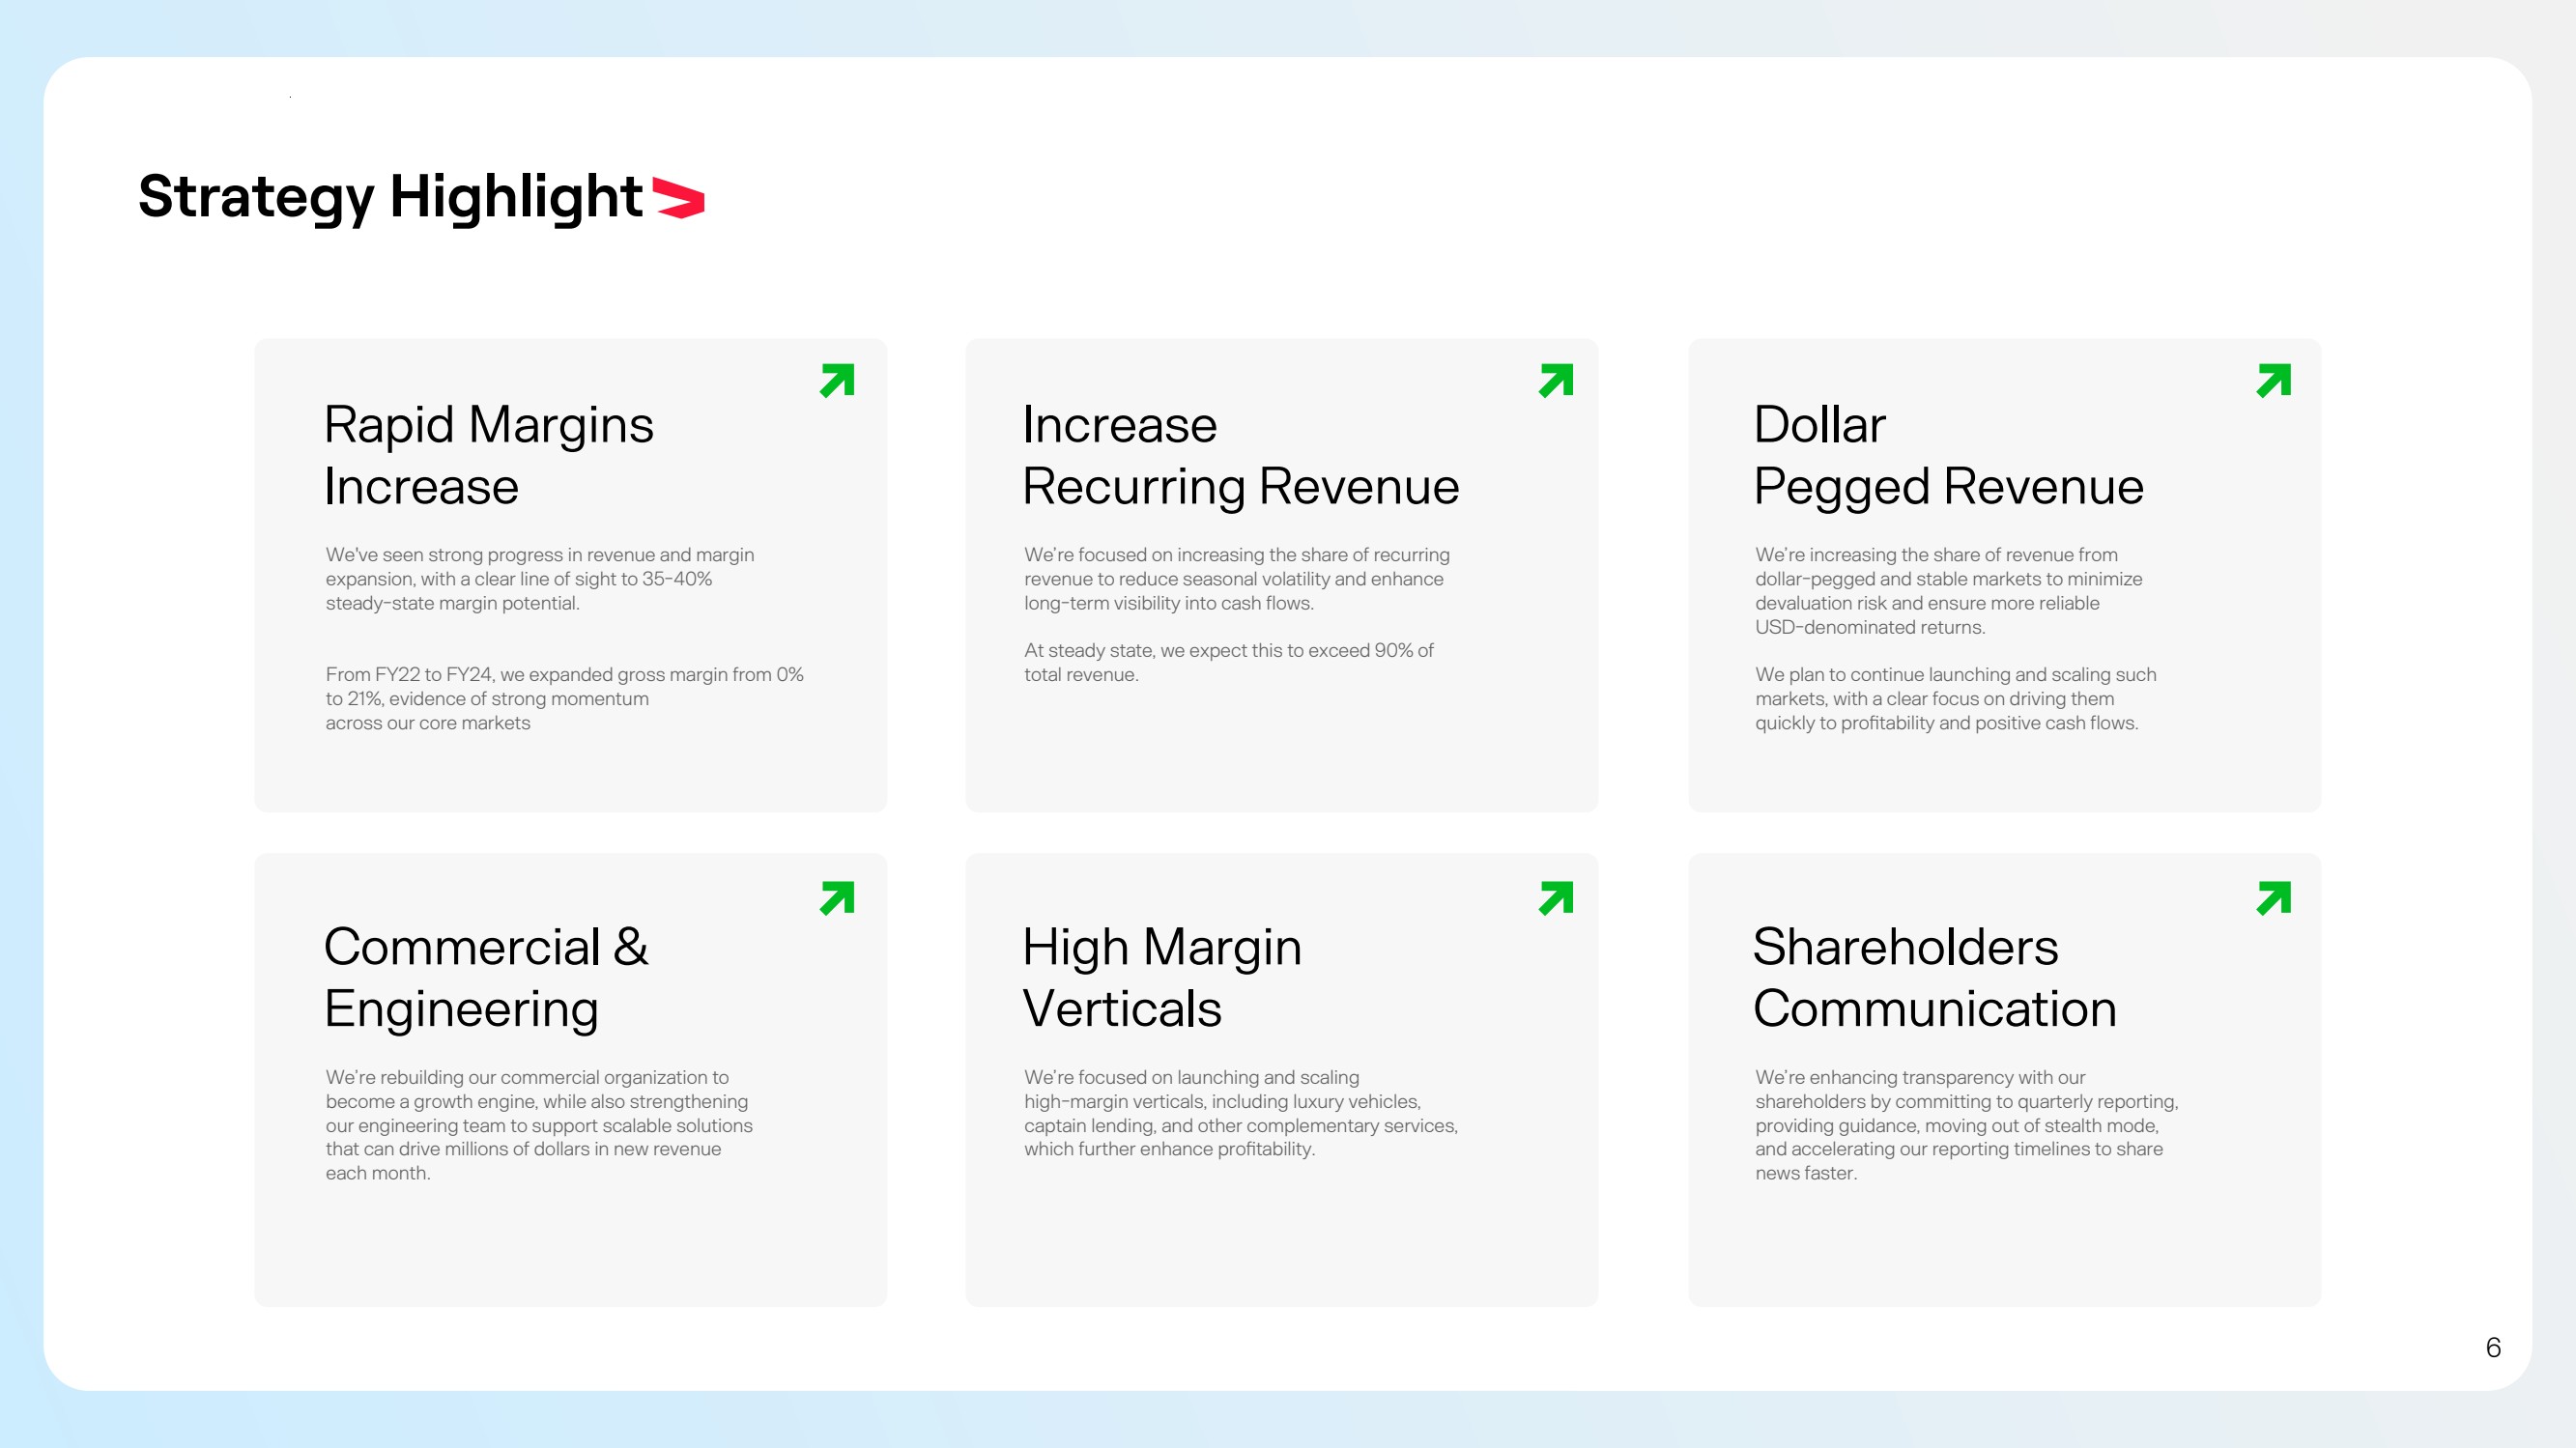
| Strategy Highlight Rapid Margins Increase We've seen strong progress in revenue and margin expansion, with a clear line of sight to 35-40% steady-state margin potential. From FY22 to FY24, we expanded gross margin from 0% to 21%, evidence of strong momentum across our core markets Increase Recurring Revenue We’re focused on increasing the share of recurring revenue to reduce seasonal volatility and enhance long-term visibility into cash flows. At steady state, we expect this to exceed 90% of total revenue. Dollar Pegged Revenue We’re increasing the share of revenue from dollar-pegged and stable markets to minimize devaluation risk and ensure more reliable USD-denominated returns. We plan to continue launching and scaling such markets, with a clear focus on driving them quickly to protability and positive cash flows. Commercial & Engineering We’re rebuilding our commercial organization to become a growth engine, while also strengthening our engineering team to support scalable solutions that can drive millions of dollars in new revenue each month. High Margin Verticals We’re focused on launching and scaling high-margin verticals, including luxury vehicles, captain lending, and other complementary services, which further enhance protability. Shareholders Communication We’re enhancing transparency with our shareholders by committing to quarterly reporting, providing guidance, moving out of stealth mode, and accelerating our reporting timelines to share news faster. 6 |
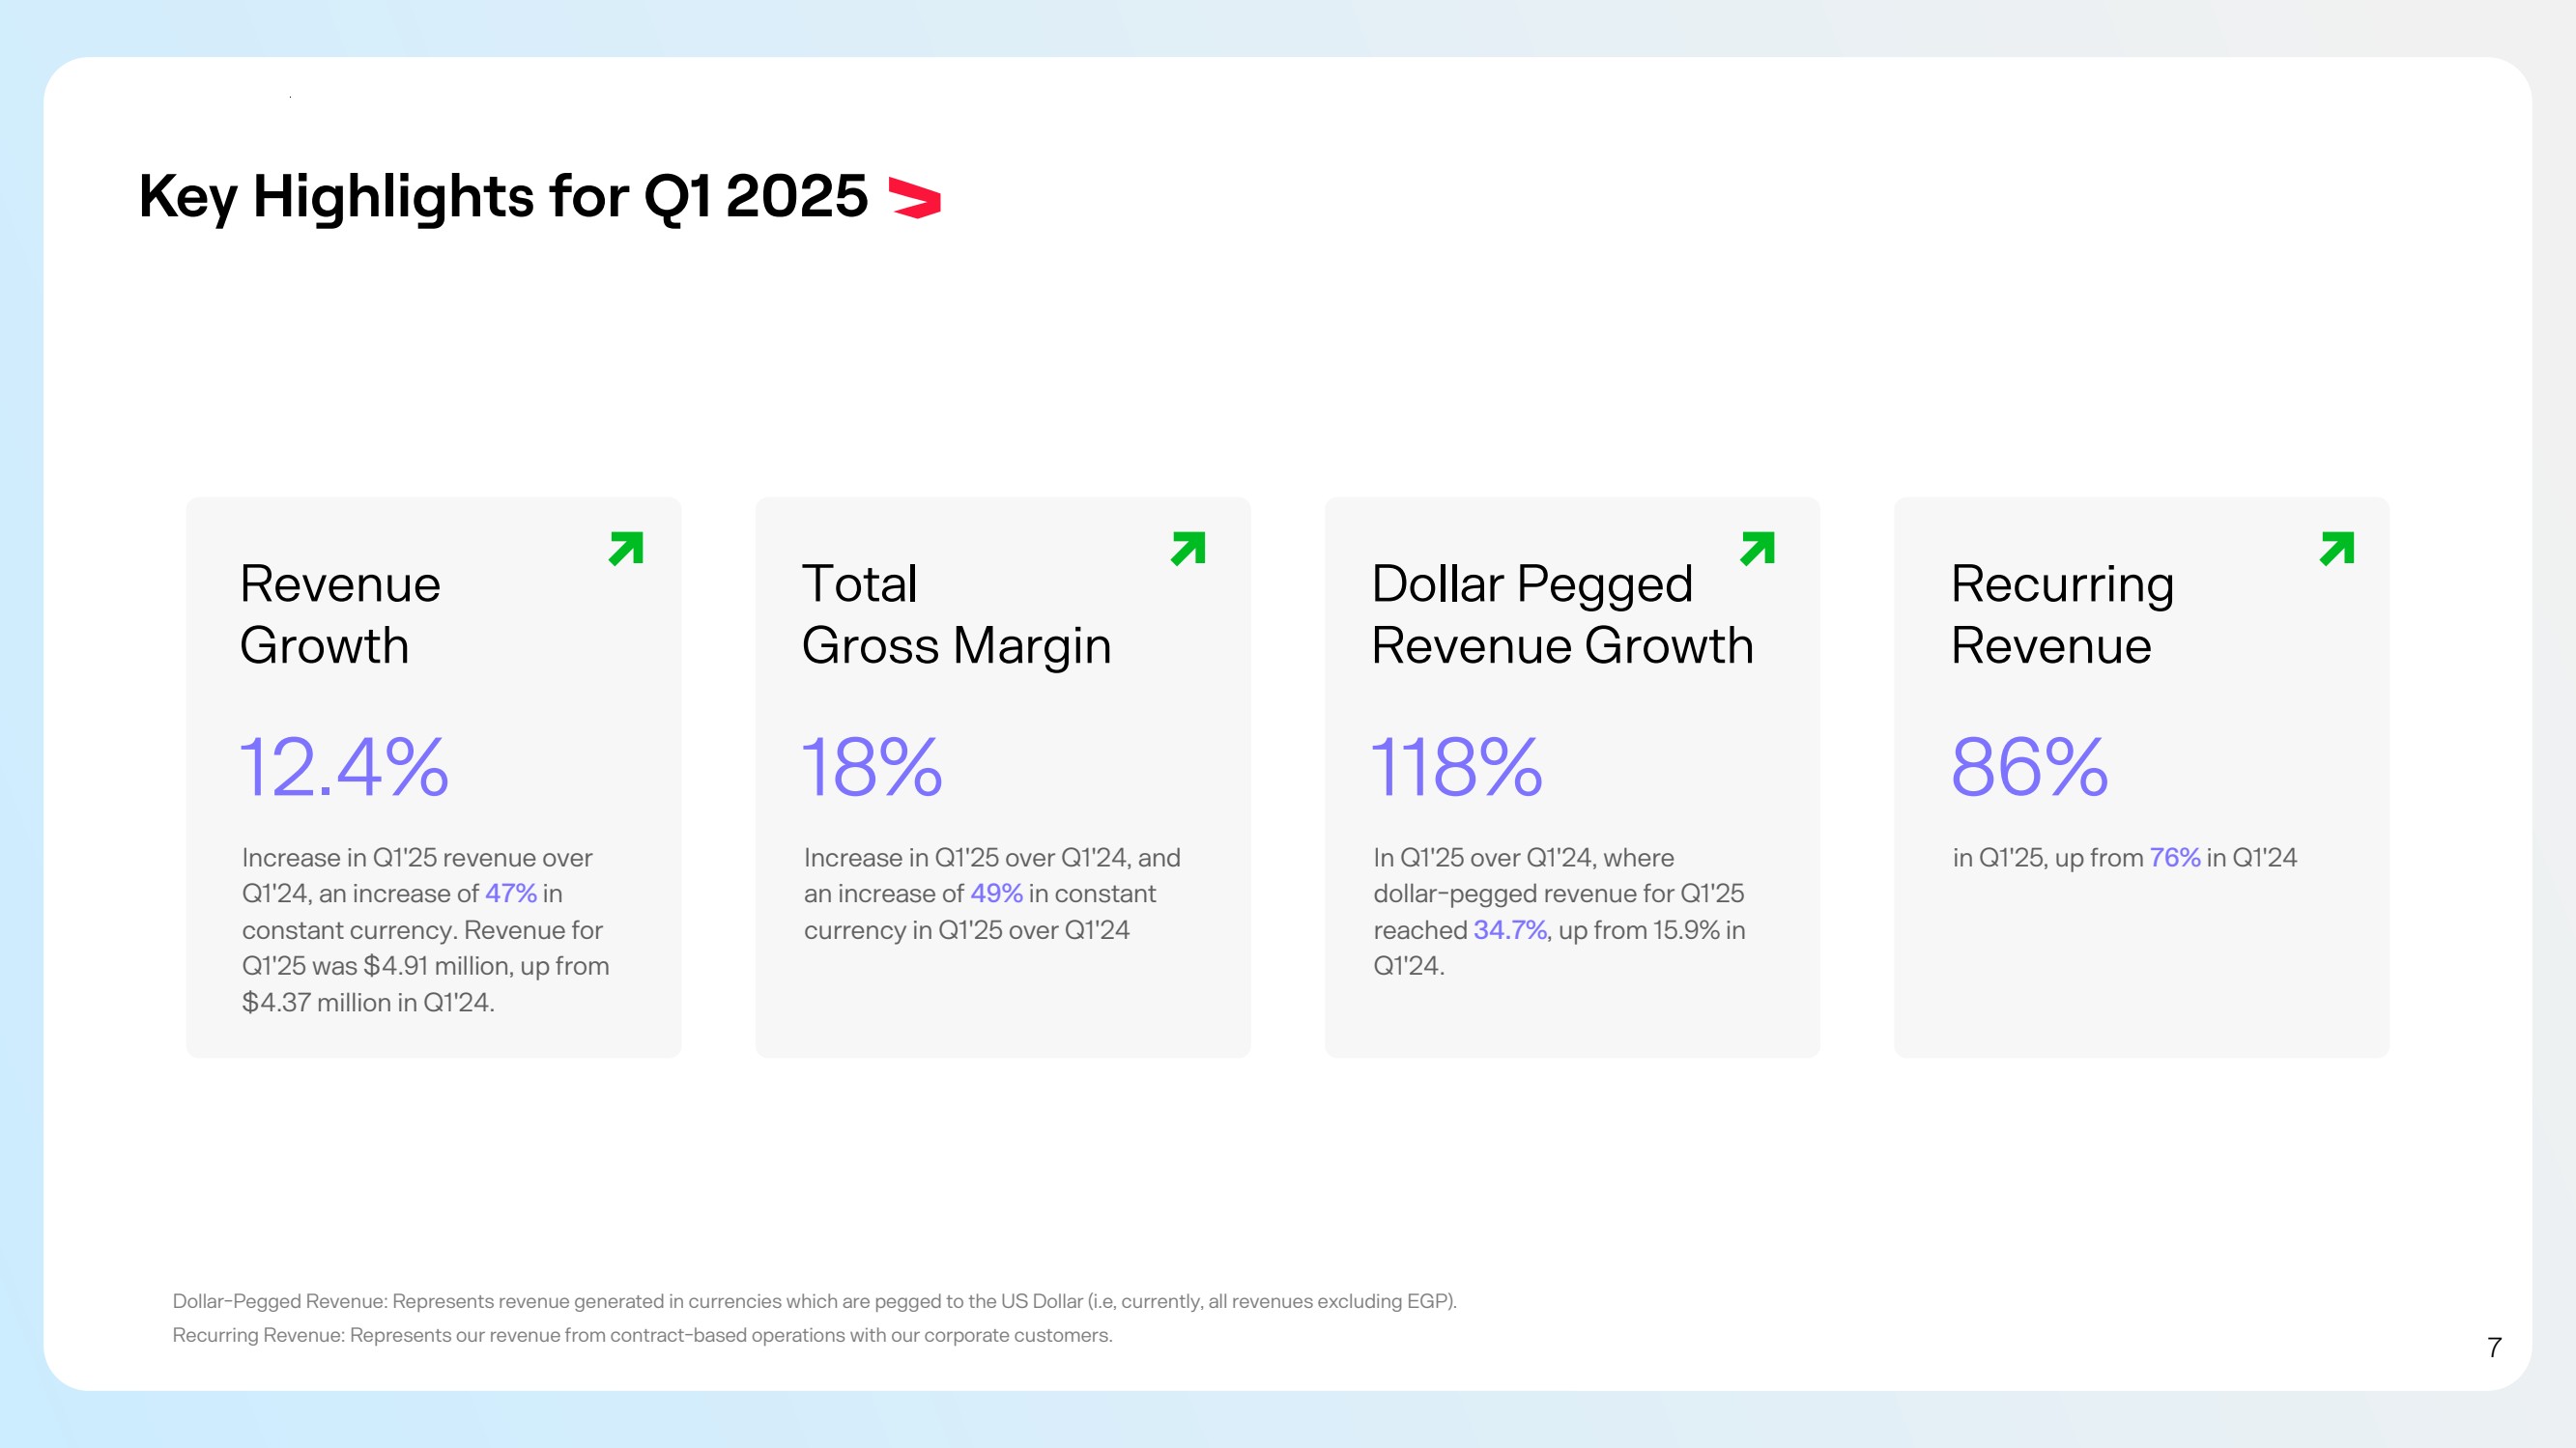
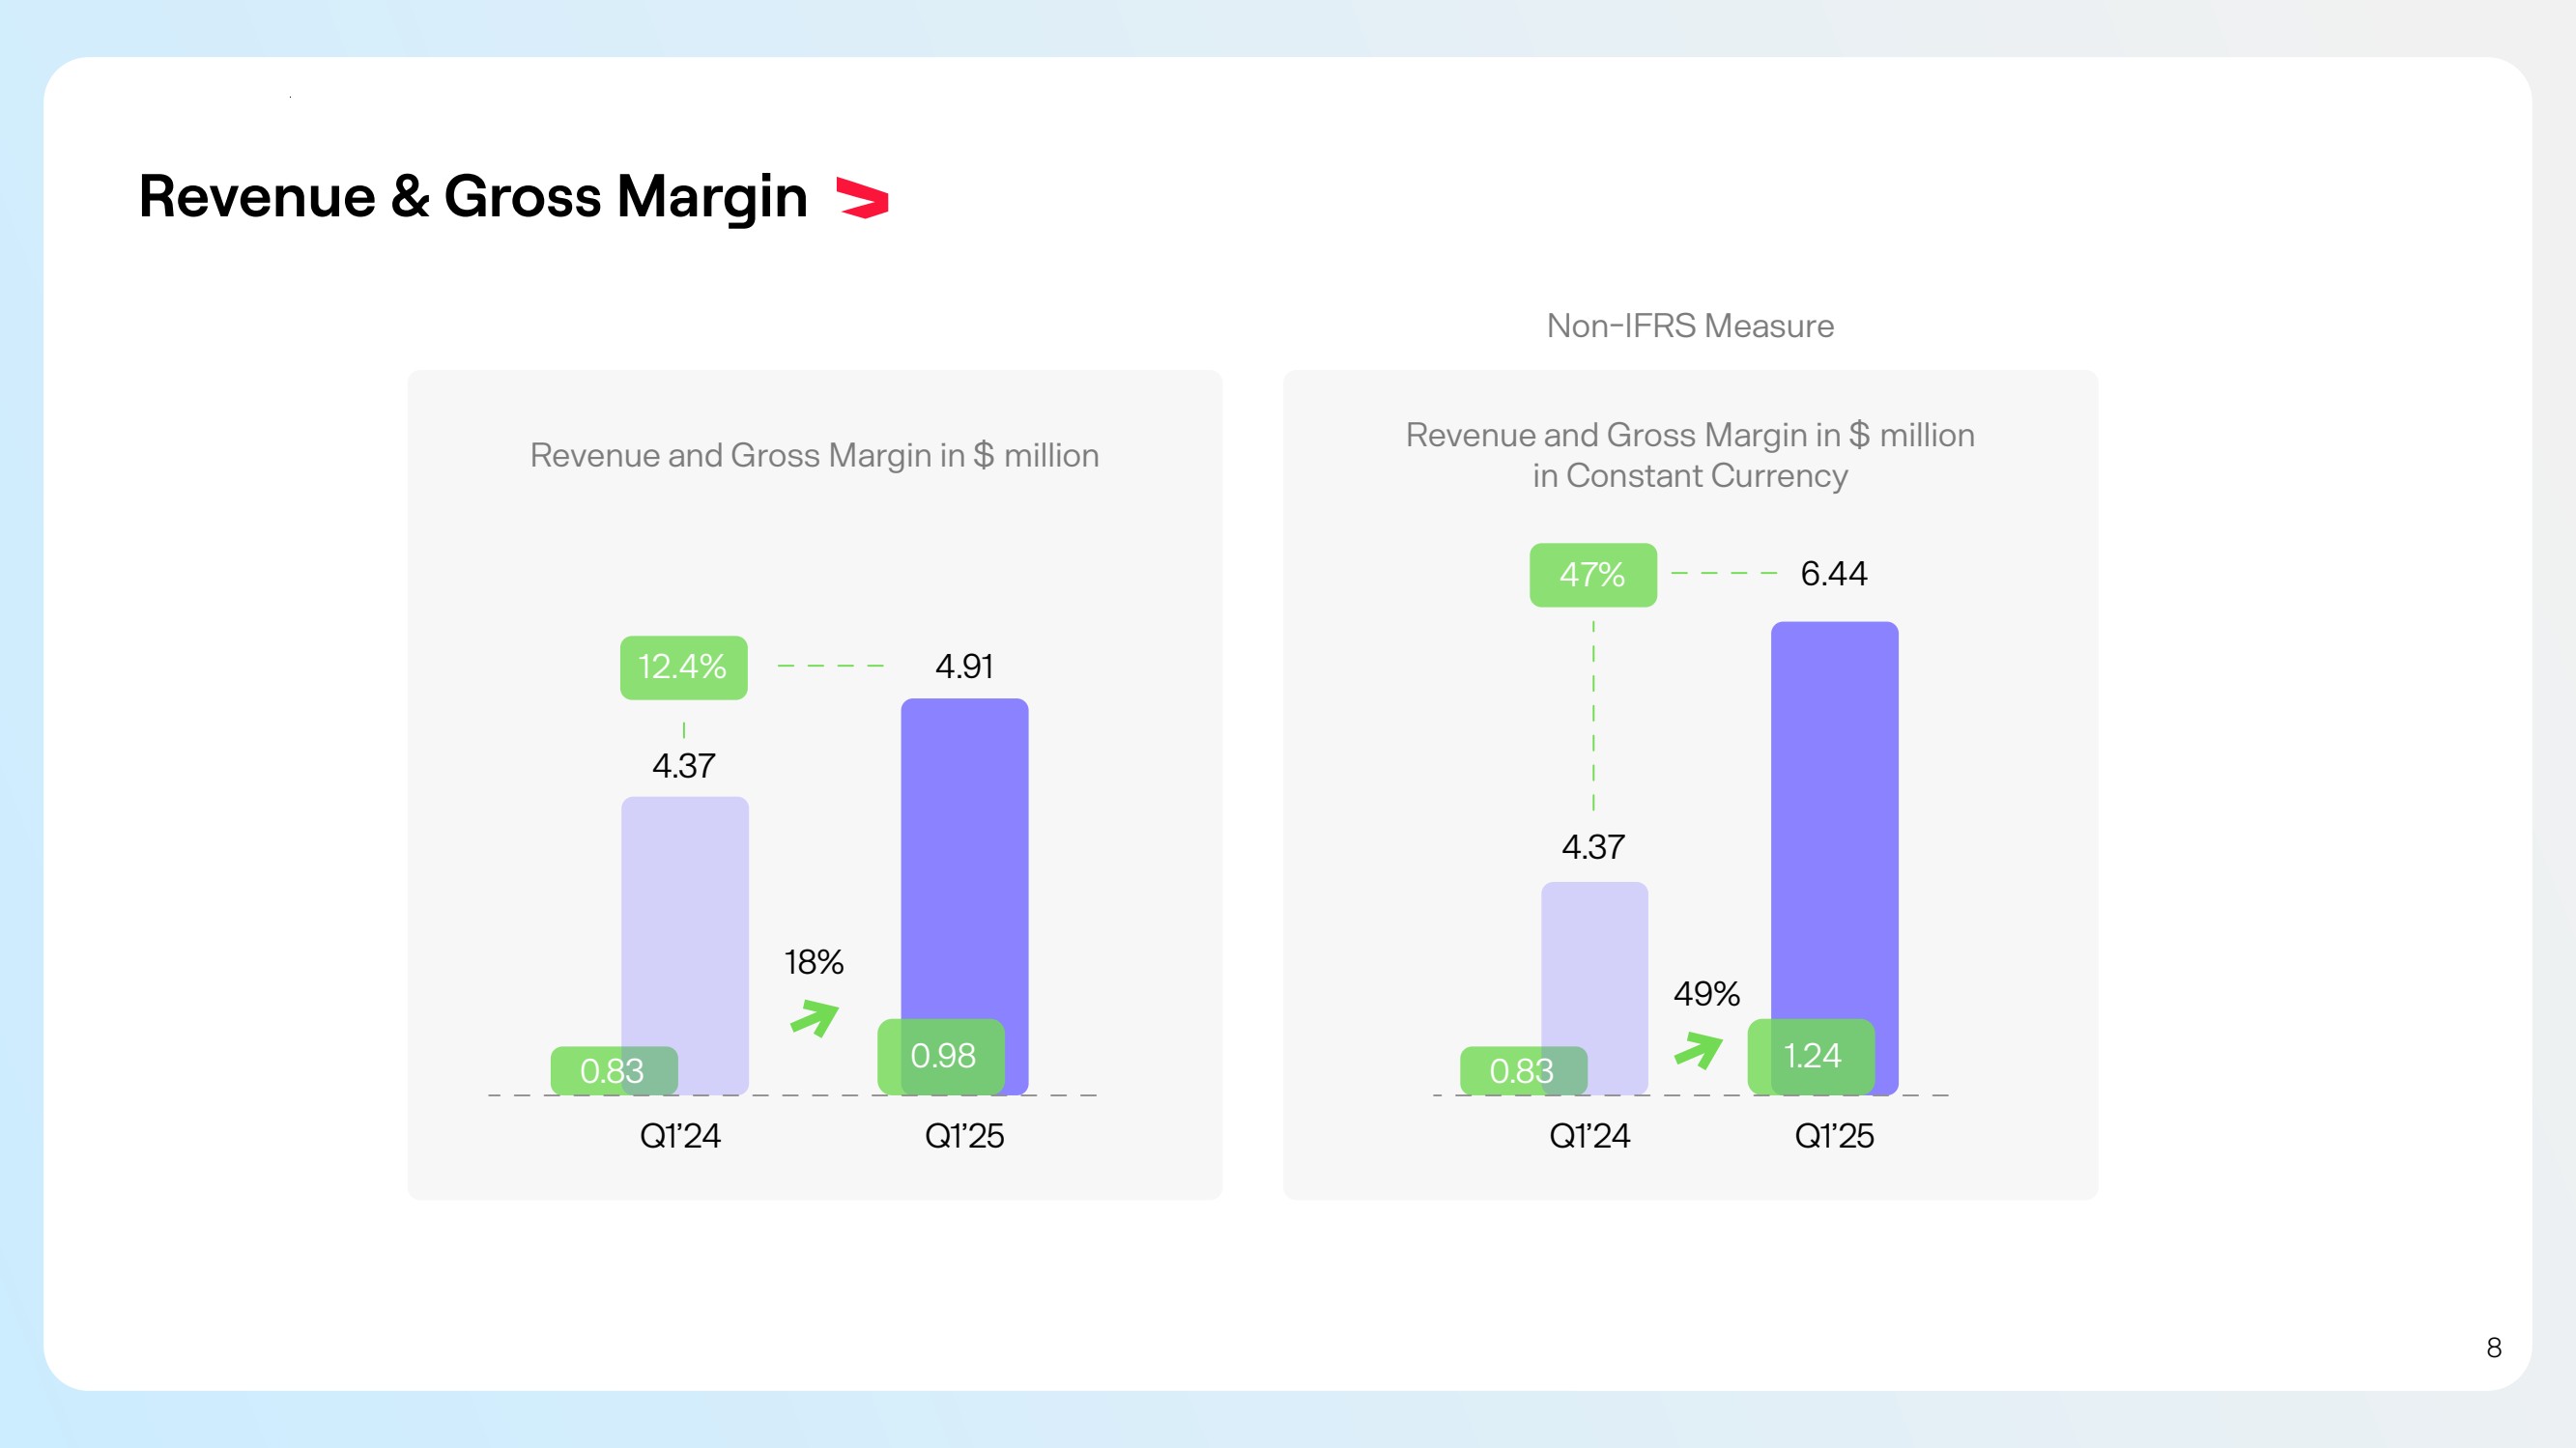
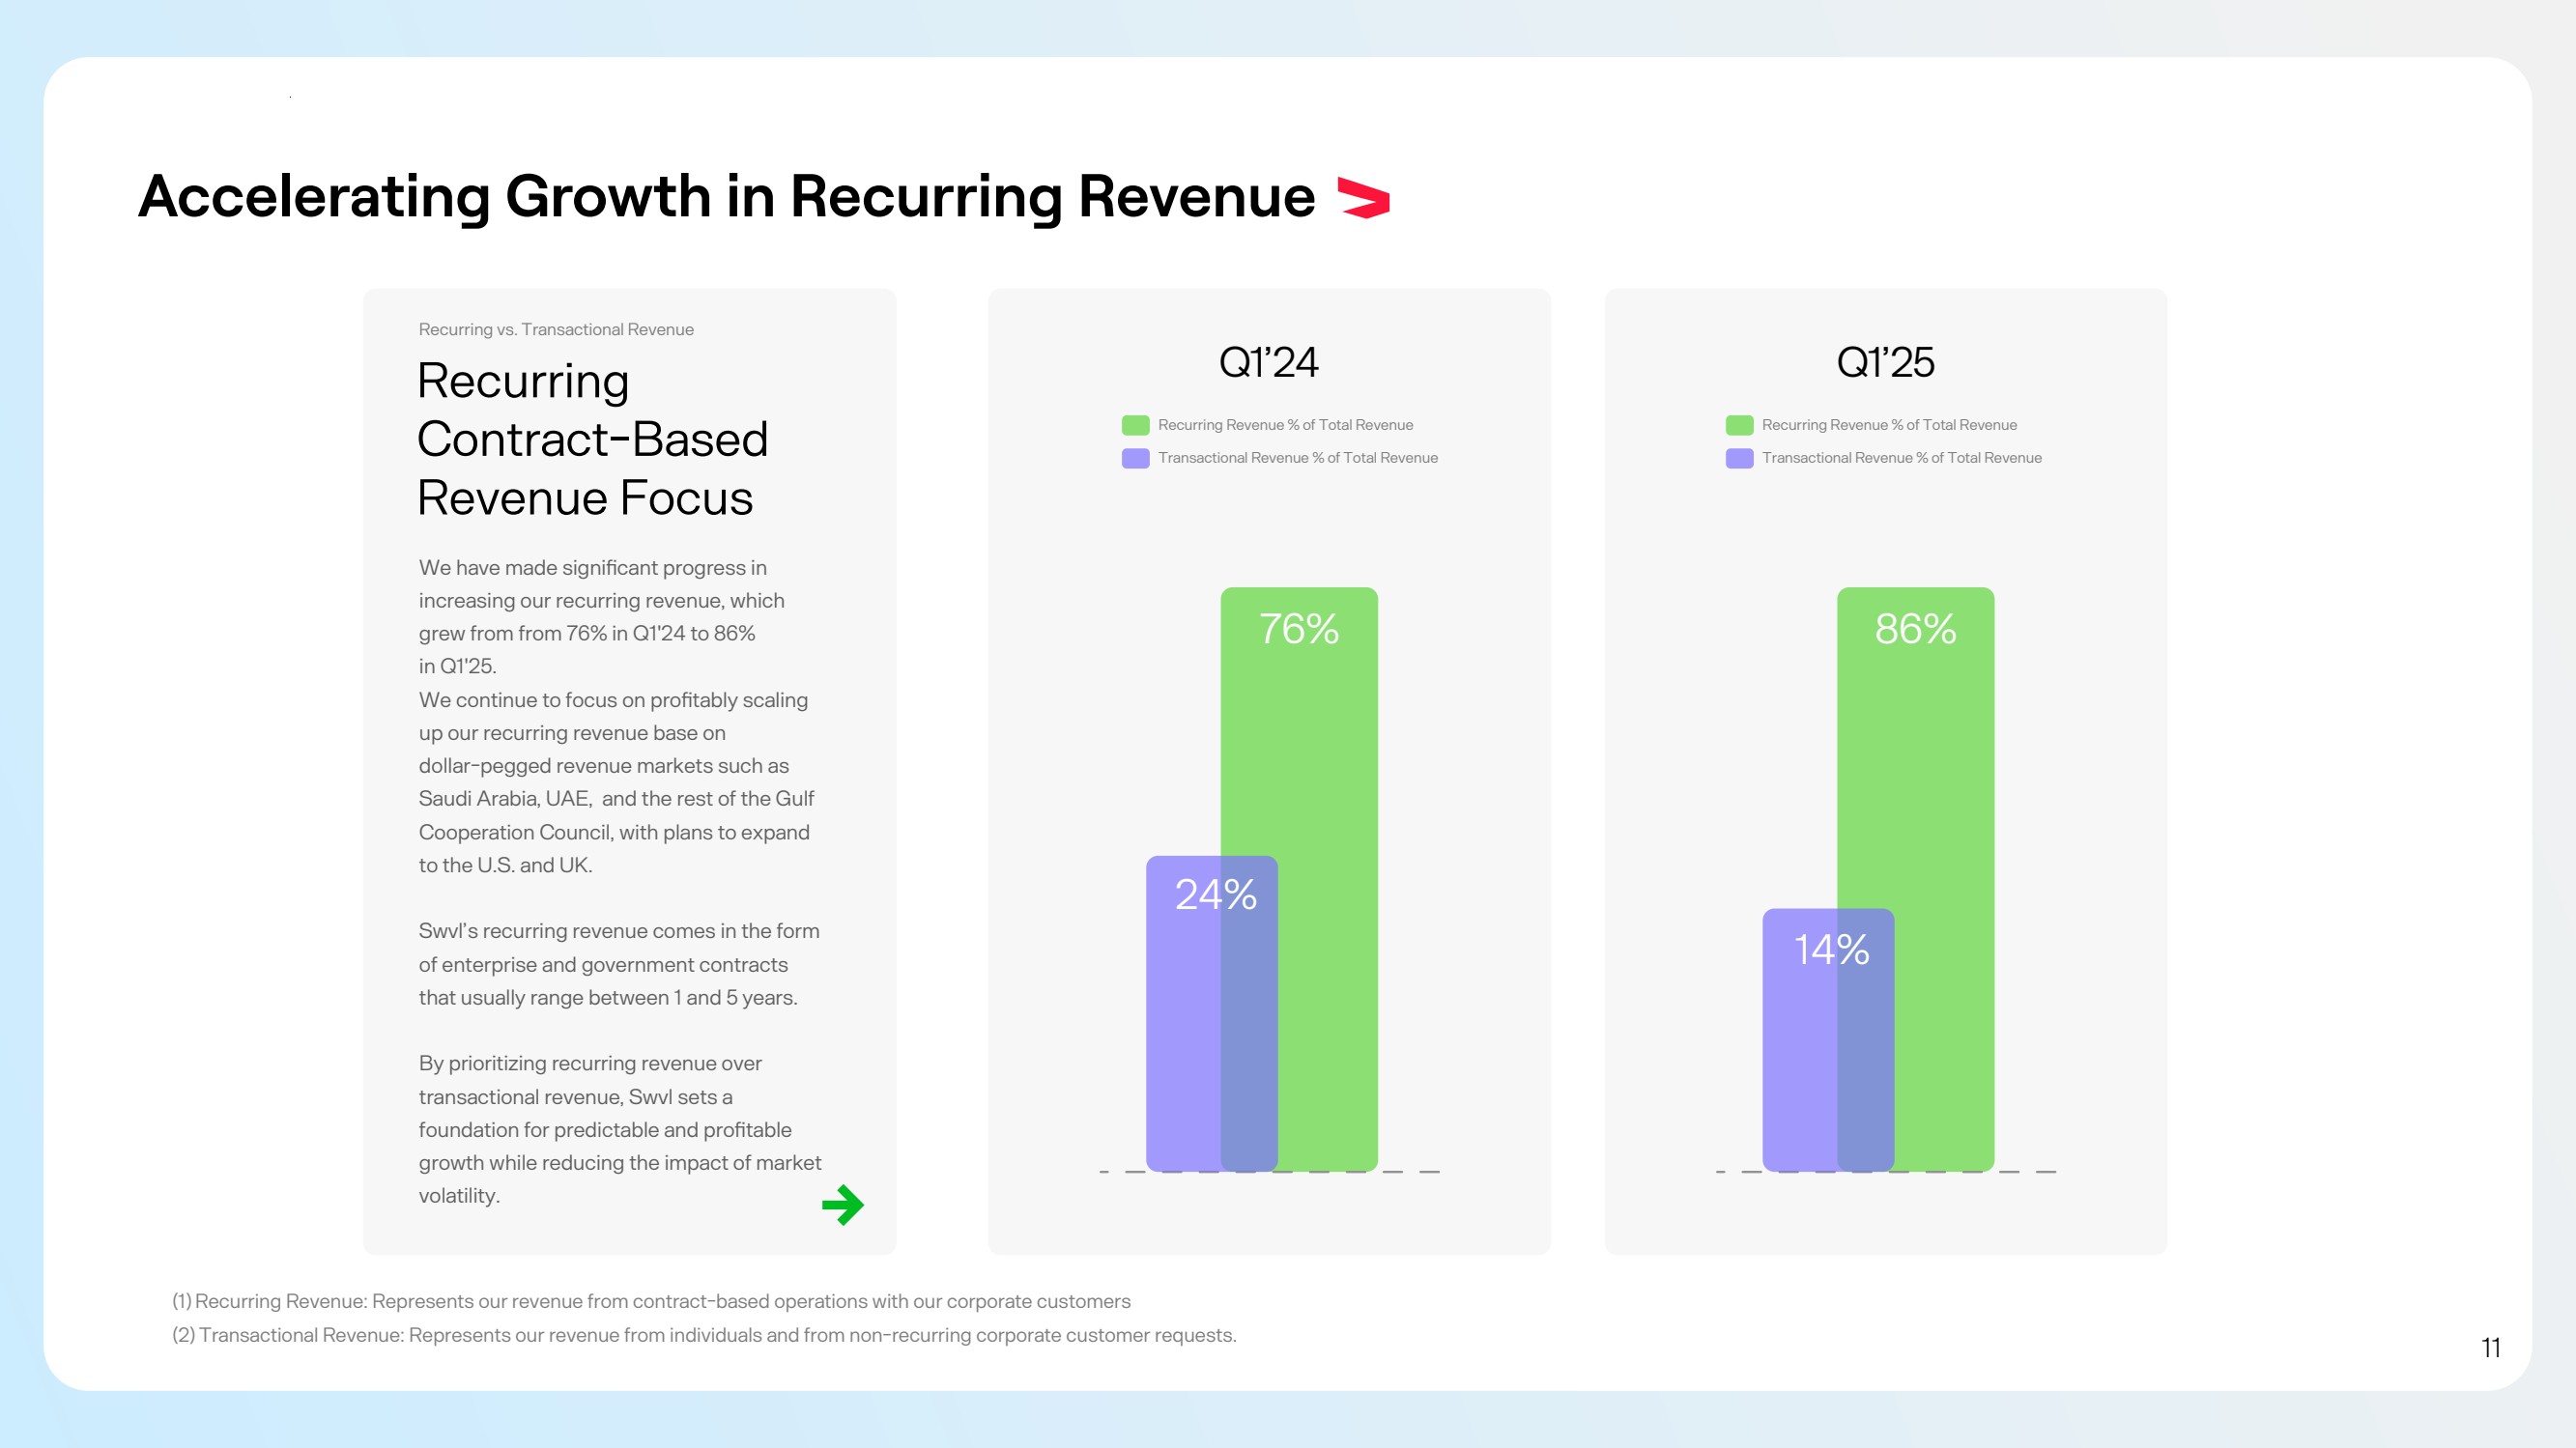
| Key Highlights for Q1 2025 Revenue Growth 12.4% Increase in Q1'25 revenue over Q1'24, an increase of 47% in constant currency. Revenue for Q1'25 was $4.91 million, up from $4.37 million in Q1'24. Total Gross Margin 18% Increase in Q1'25 over Q1'24, and an increase of 49% in constant currency in Q1'25 over Q1'24 Dollar Pegged Revenue Growth 118% In Q1'25 over Q1'24, where dollar-pegged revenue for Q1'25 reached 34.7%, up from 15.9% in Q1'24. Recurring Revenue 86% in Q1'25, up from 76% in Q1'24 Dollar-Pegged Revenue: Represents revenue generated in currencies which are pegged to the US Dollar (i.e, currently, all revenues excluding EGP). Recurring Revenue: Represents our revenue from contract-based operations with our corporate customers. 7 |
| Revenue & Gross Margin Revenue and Gross Margin in $ million Non-IFRS Measure 4.37 12.4% 4.91 Q1’24 Q1’25 0.83 0.98 18% 4.37 47% 6.44 Q1’24 Q1’25 0.83 1.24 49% Revenue and Gross Margin in $ million in Constant Currency 8 |
| Net Income Net Income $ million 0.8 -3.7 Q1’24 Q1’25 9 |
| Strong Growth in Dollar-Pegged Revenue 15.90% 34.7% Q1’24 Q1’25 Dollar-Pegged Revenue as a Percentage of Total Revenue Dollar-Pegged Revenue: Represents revenue generated in currencies which are pegged to the US Dollar (i.e, currently, all revenues excluding EGP). Dollar-Pegged Revenue Focus Swvl continues to focus on dollar-pegged revenue across the GCC, with plans to expand into the UK and U.S. to ensure long-term sustainability and dollar-pegged growth. In Q1’25, our Dollar-Pegged Revenue increased to 34.7% from 15.9% in Q1’24. We will continue to aim at expanding our dollar-pegged revenue to reduce our exposure to changes in foreign currencies. While expanding our engineering, operations, and support teams in some of the cost-eective markets we operate in. 10 |

| Accelerating Growth in Recurring Revenue Recurring Contract-Based Revenue Focus We have made signicant progress in increasing our recurring revenue, which grew from from 76% in Q1'24 to 86% in Q1'25. We continue to focus on protably scaling up our recurring revenue base on dollar-pegged revenue markets such as Saudi Arabia, UAE, and the rest of the Gulf Cooperation Council, with plans to expand to the U.S. and UK. Swvl’s recurring revenue comes in the form of enterprise and government contracts that usually range between 1 and 5 years. By prioritizing recurring revenue over transactional revenue, Swvl sets a foundation for predictable and protable growth while reducing the impact of market volatility. Q1’24 24% 76% Transactional Revenue % of Total Revenue Recurring Revenue % of Total Revenue Q1’25 14% 86% Transactional Revenue % of Total Revenue Recurring Revenue % of Total Revenue Recurring vs. Transactional Revenue (1) Recurring Revenue: Represents our revenue from contract-based operations with our corporate customers (2) Transactional Revenue: Represents our revenue from individuals and from non-recurring corporate customer requests. 11 |
| Q1 2025 | Results of Operations 12 |
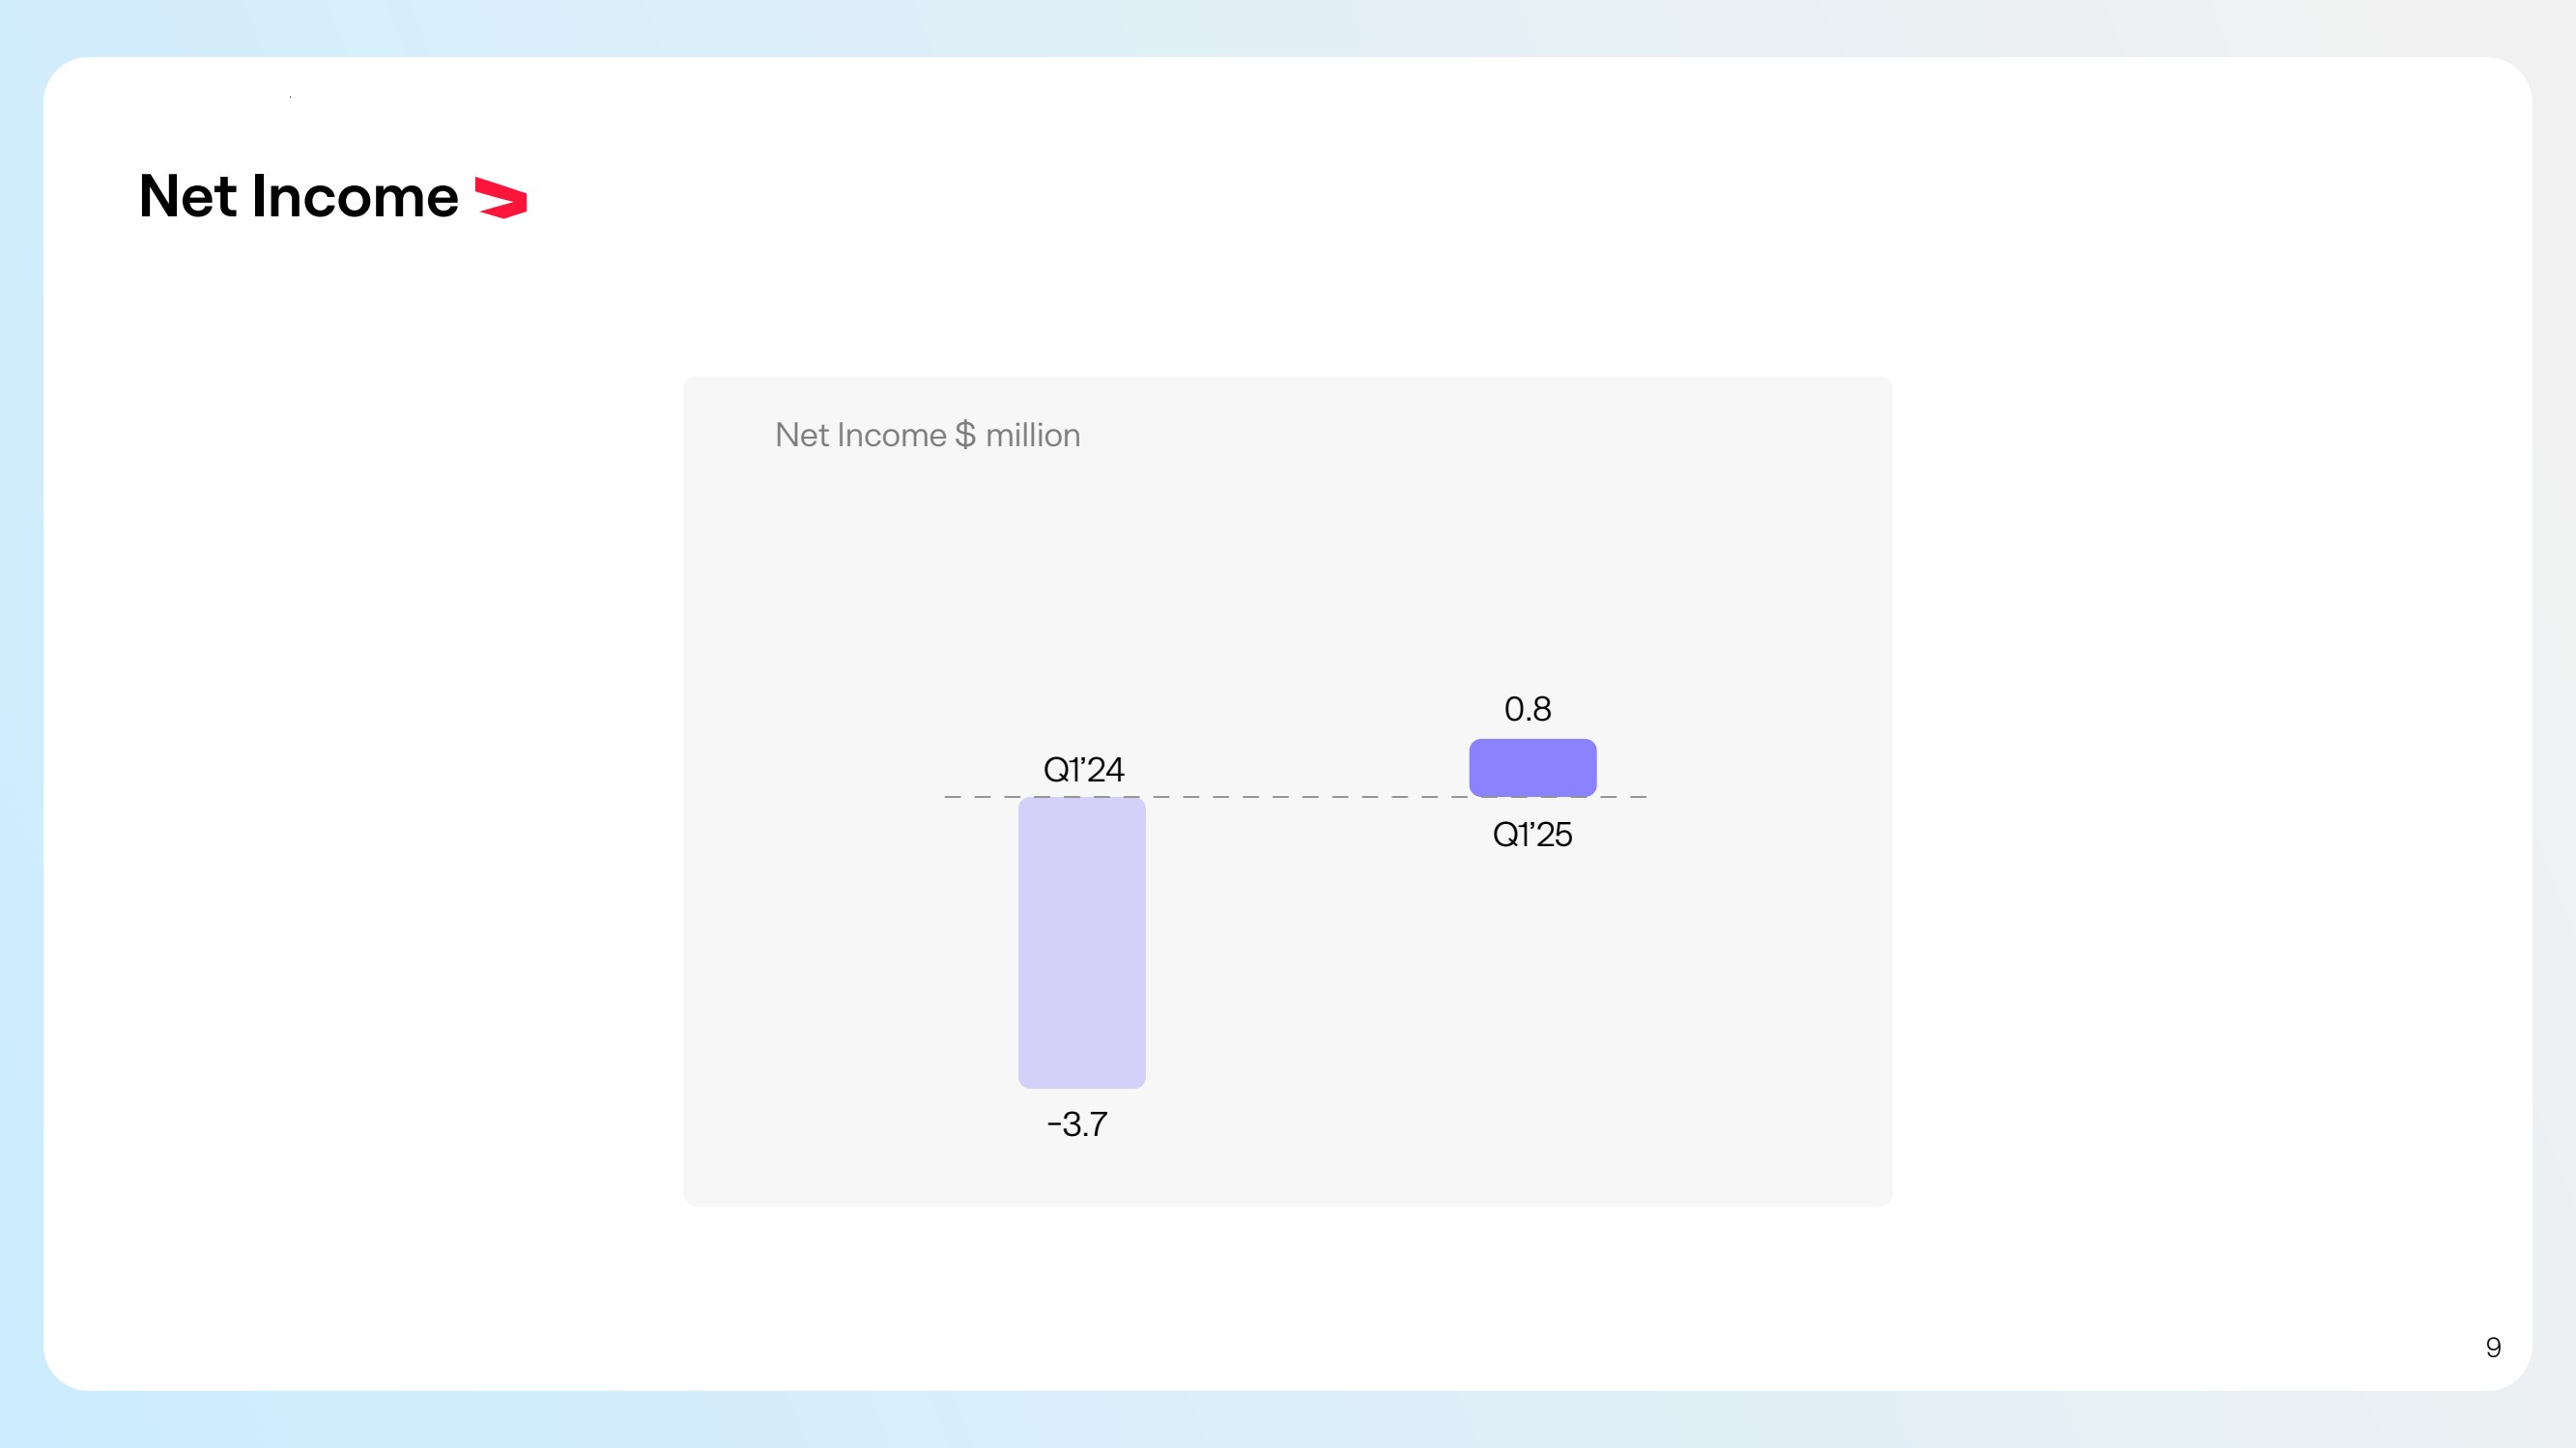
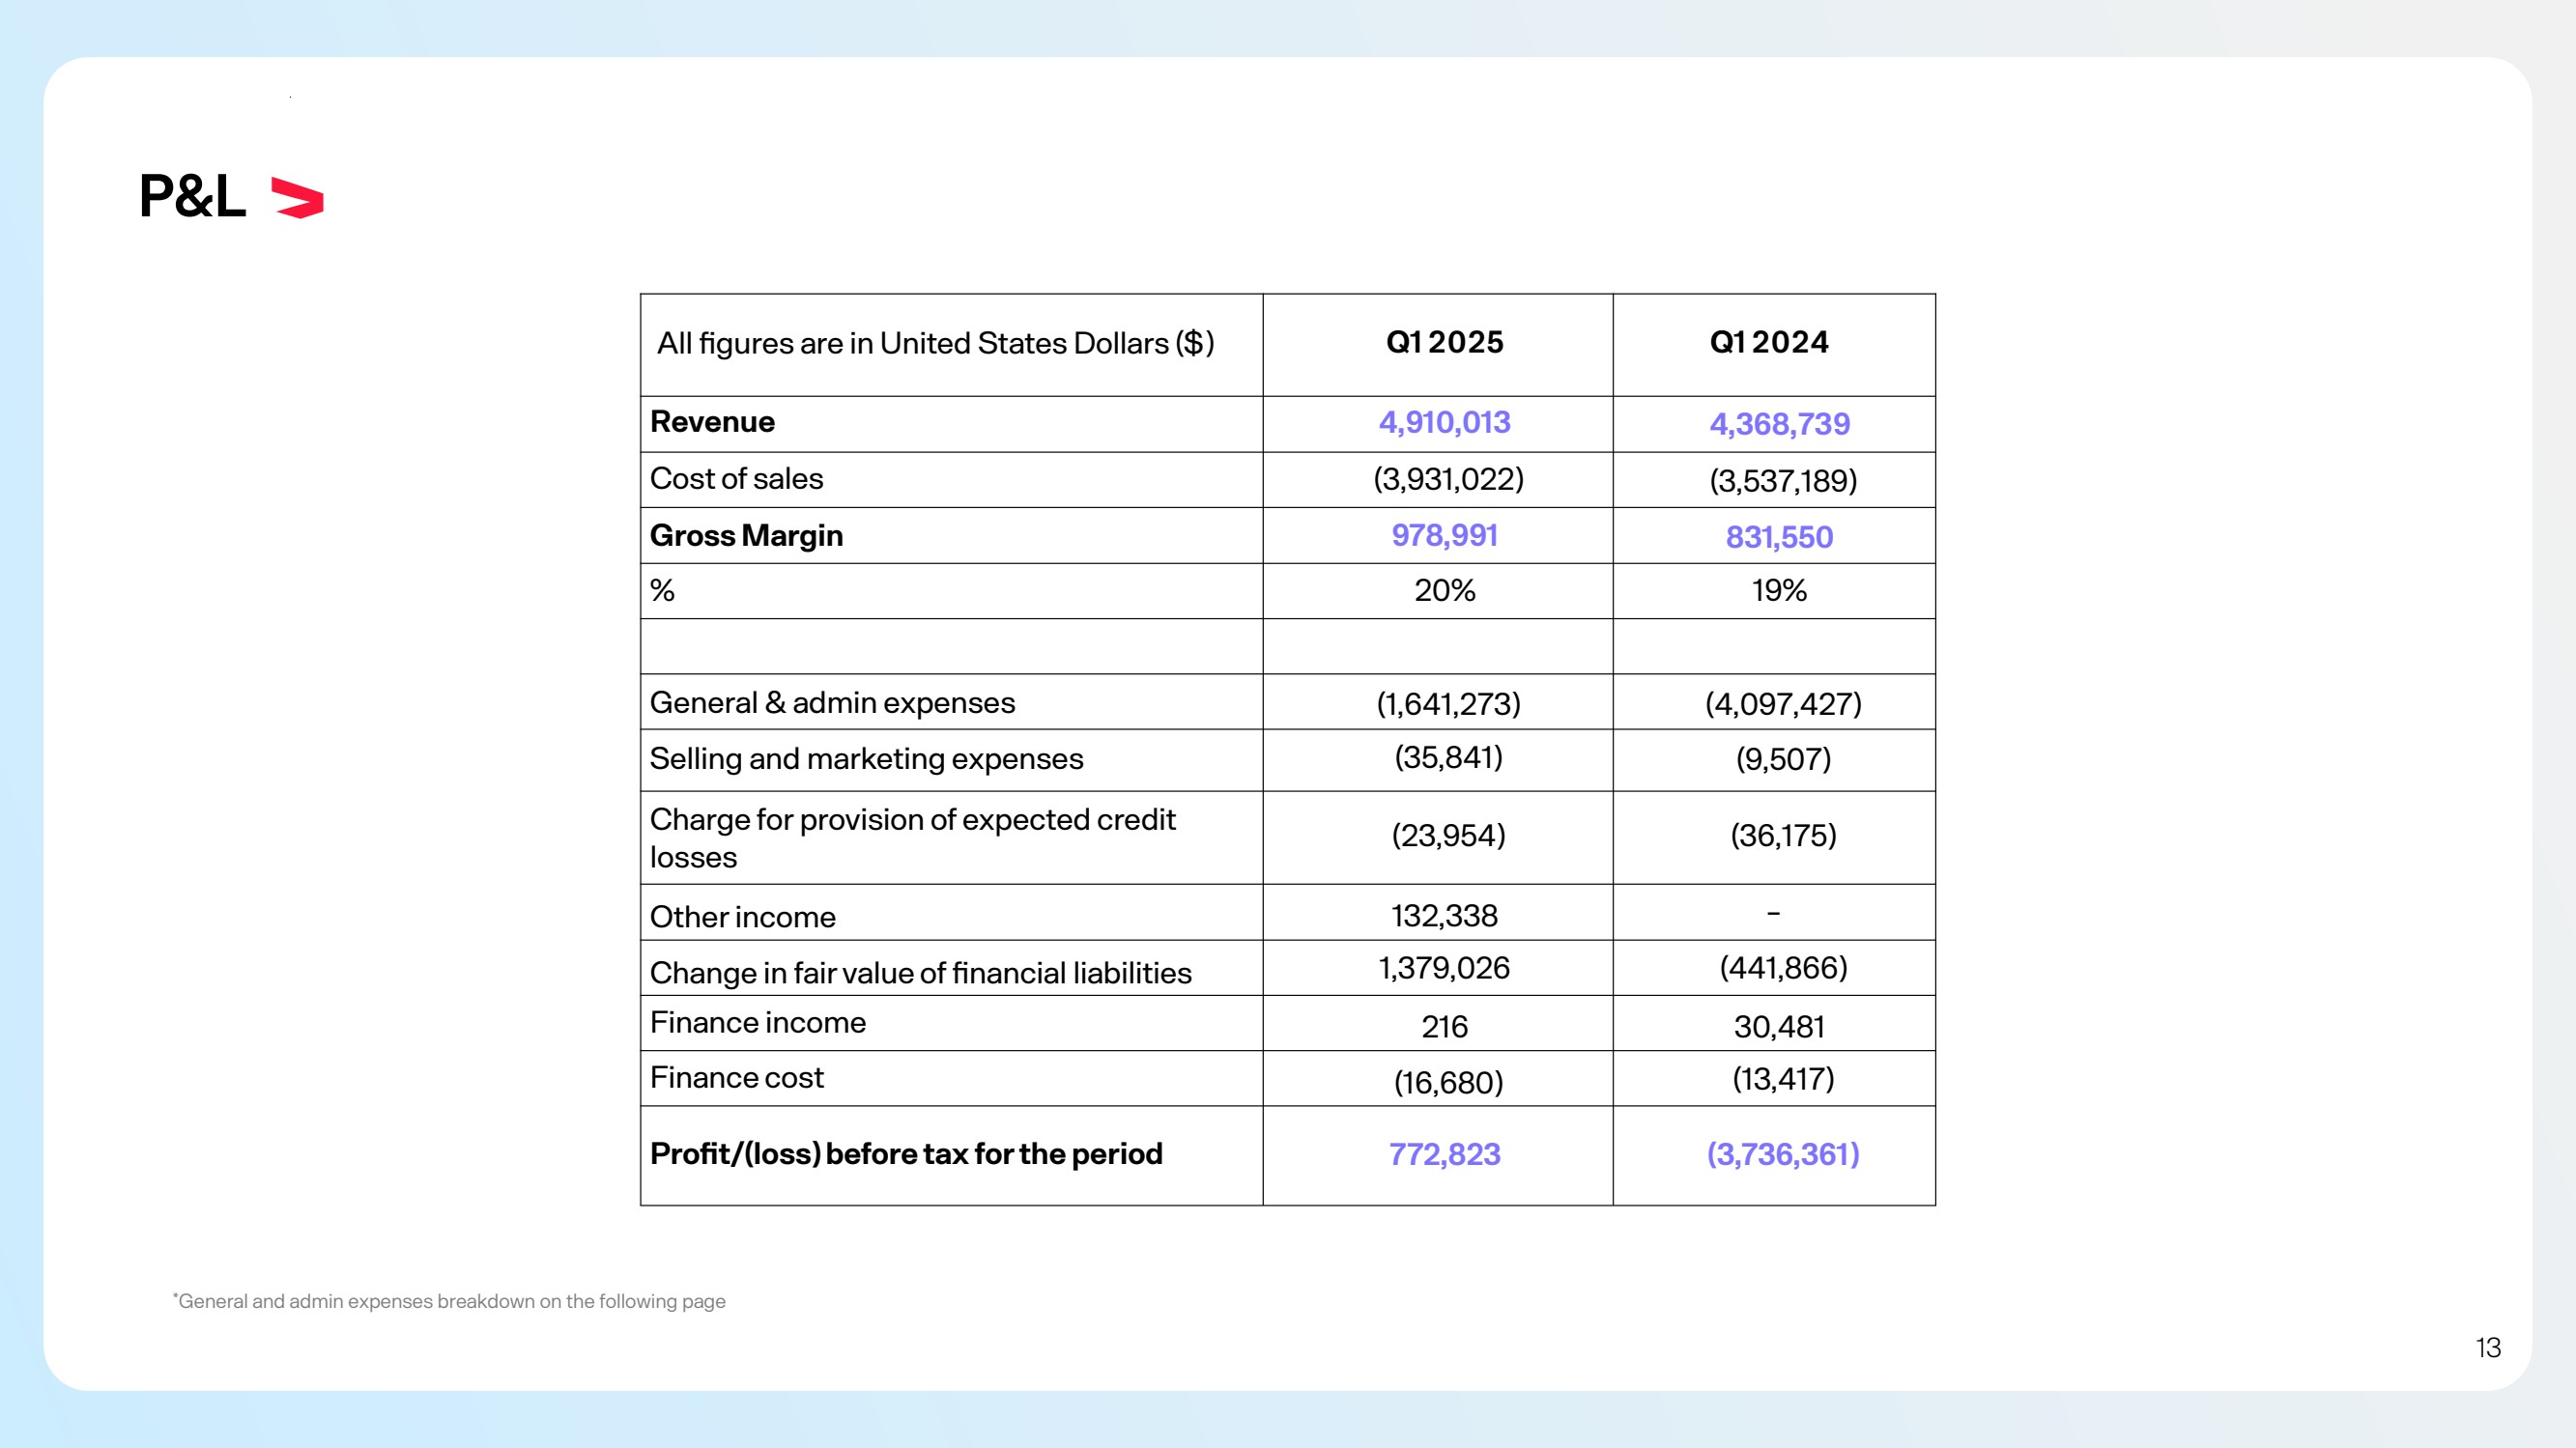
| P&L *General and admin expenses breakdown on the following page Q1 2025 Q1 2024 Revenue 4,910,013 4,368,739 Cost of sales All gures are in United States Dollars ($) (3,931,022) (3,537,189) Gross Margin 978,991 831,550 General & admin expenses (1,641,273) (4,097,427) % 20% 19% Selling and marketing expenses (35,841) (9,507) Charge for provision of expected credit losses (23,954) (36,175) Other income 132,338 - Change in fair value of nancial liabilities 1,379,026 (441,866) Finance income 216 30,481 Finance cost (16,680) (13,417) Prot/(loss) before tax for the period 772,823 (3,736,361) 13 |
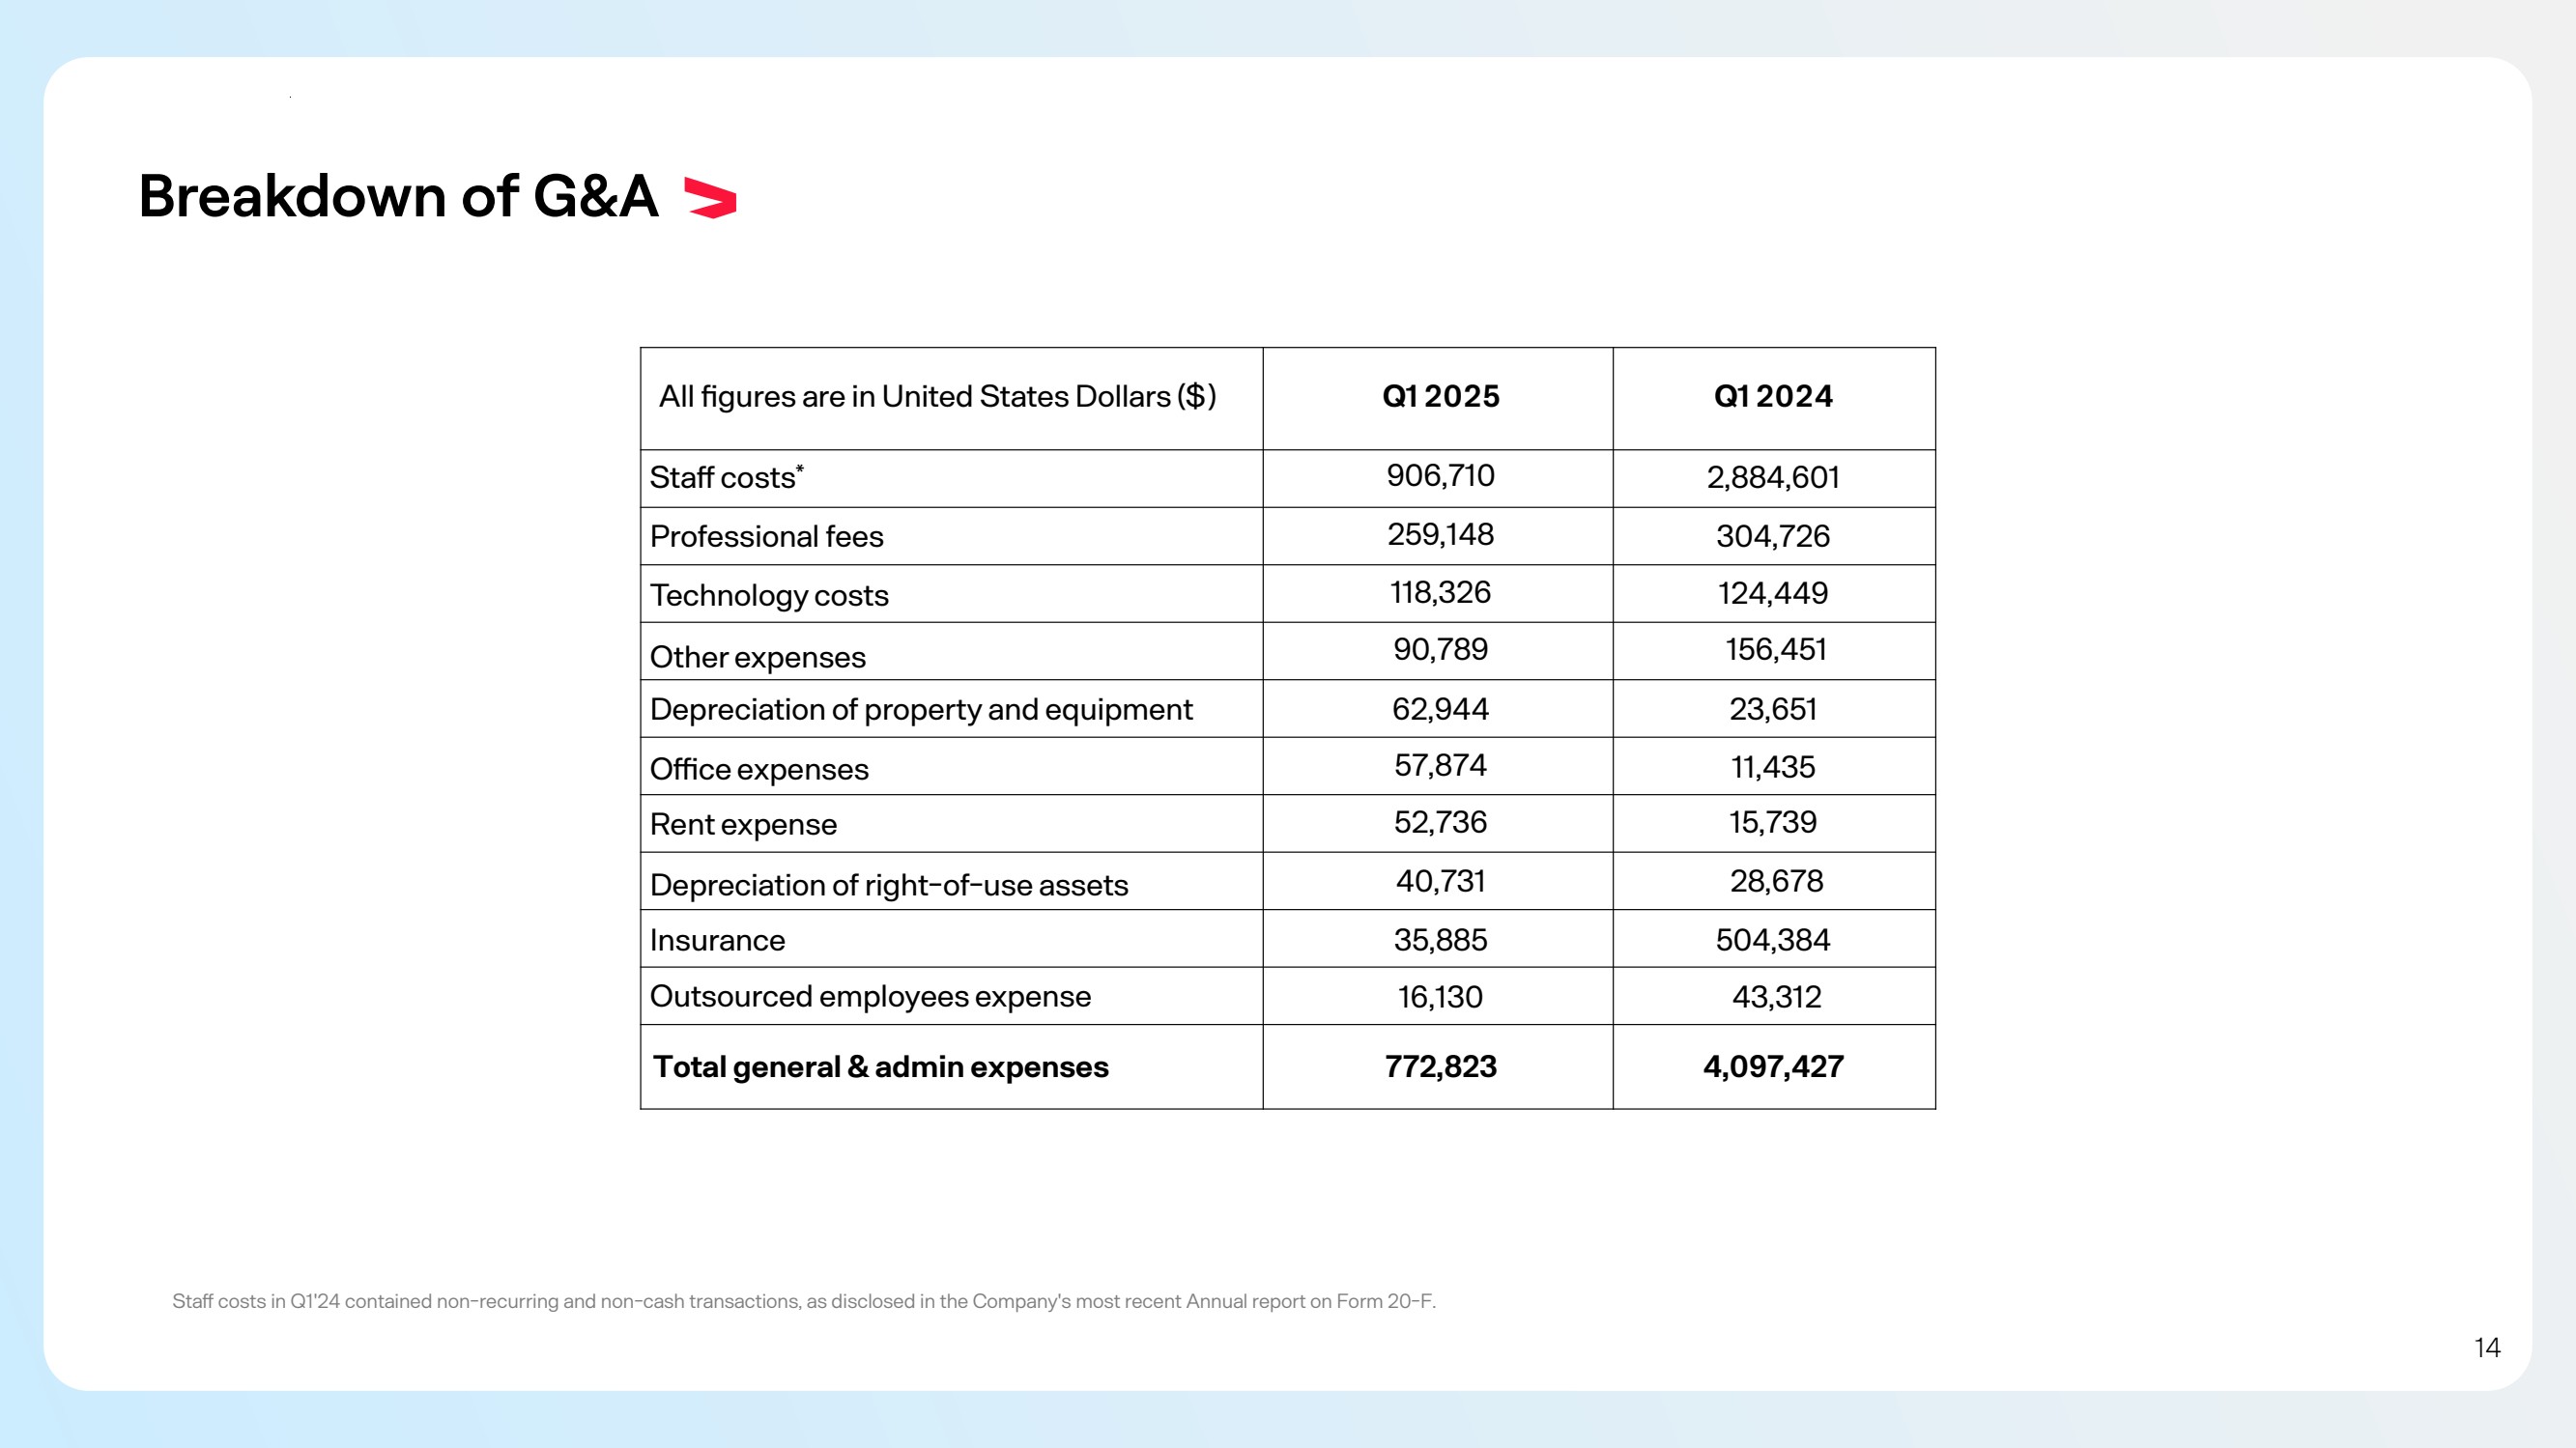
| Breakdown of G&A Sta costs in Q1'24 contained non-recurring and non-cash transactions, as disclosed in the Company's most recent Annual report on Form 20-F. Q1 2025 Q1 2024 Sta costs* 906,710 2,884,601 Professional fees 259,148 304,726 Technology costs 118,326 124,449 Depreciation of property and equipment 62,944 23,651 Other expenses 90,789 156,451 Oce expenses 57,874 11,435 Rent expense 52,736 15,739 Depreciation of right-of-use assets 40,731 28,678 Insurance 35,885 504,384 Outsourced employees expense Total general & admin expenses 16,130 43,312 772,823 4,097,427 All gures are in United States Dollars ($) 14 |
| Markets’ Performance 15 |

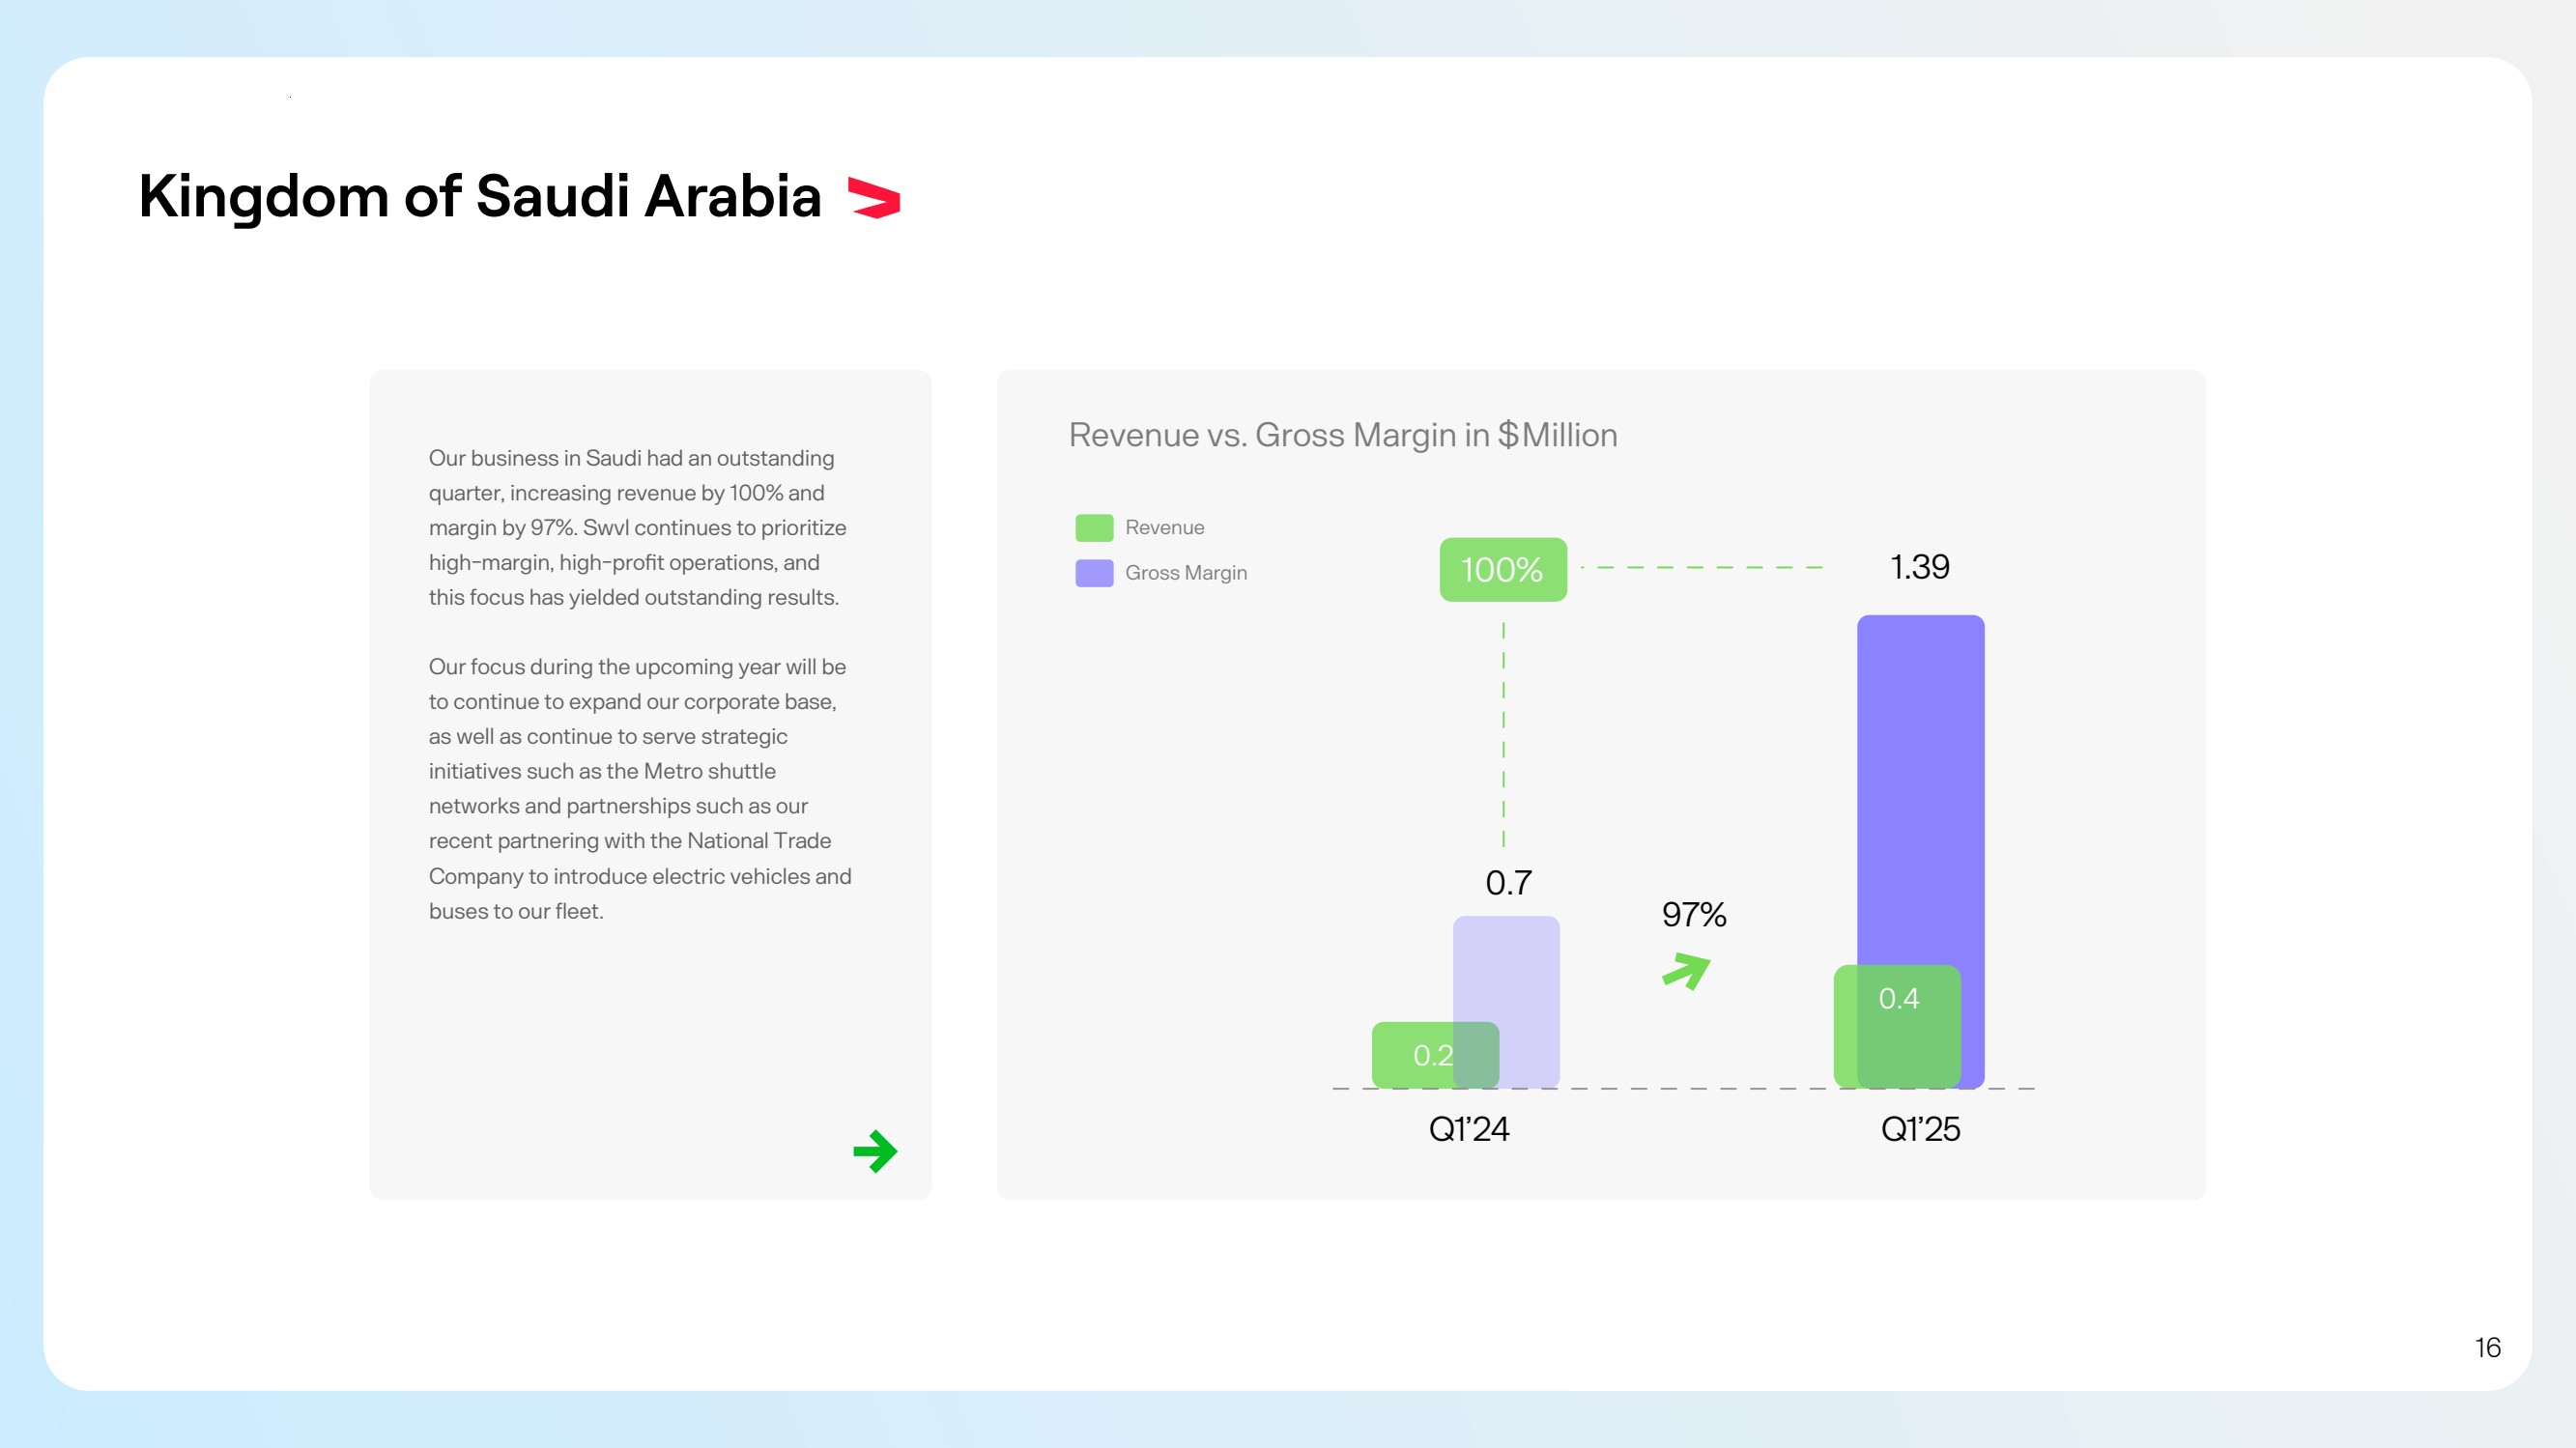
| Kingdom of Saudi Arabia Revenue vs. Gross Margin in $Million Our business in Saudi had an outstanding quarter, increasing revenue by 100% and margin by 97%. Swvl continues to prioritize high-margin, high-prot operations, and this focus has yielded outstanding results. Our focus during the upcoming year will be to continue to expand our corporate base, as well as continue to serve strategic initiatives such as the Metro shuttle networks and partnerships such as our recent partnering with the National Trade Company to introduce electric vehicles and buses to our fleet. Gross Margin Revenue 0.7 1.39 Q1’24 Q1’25 0.2 0.4 97% 100% 16 |
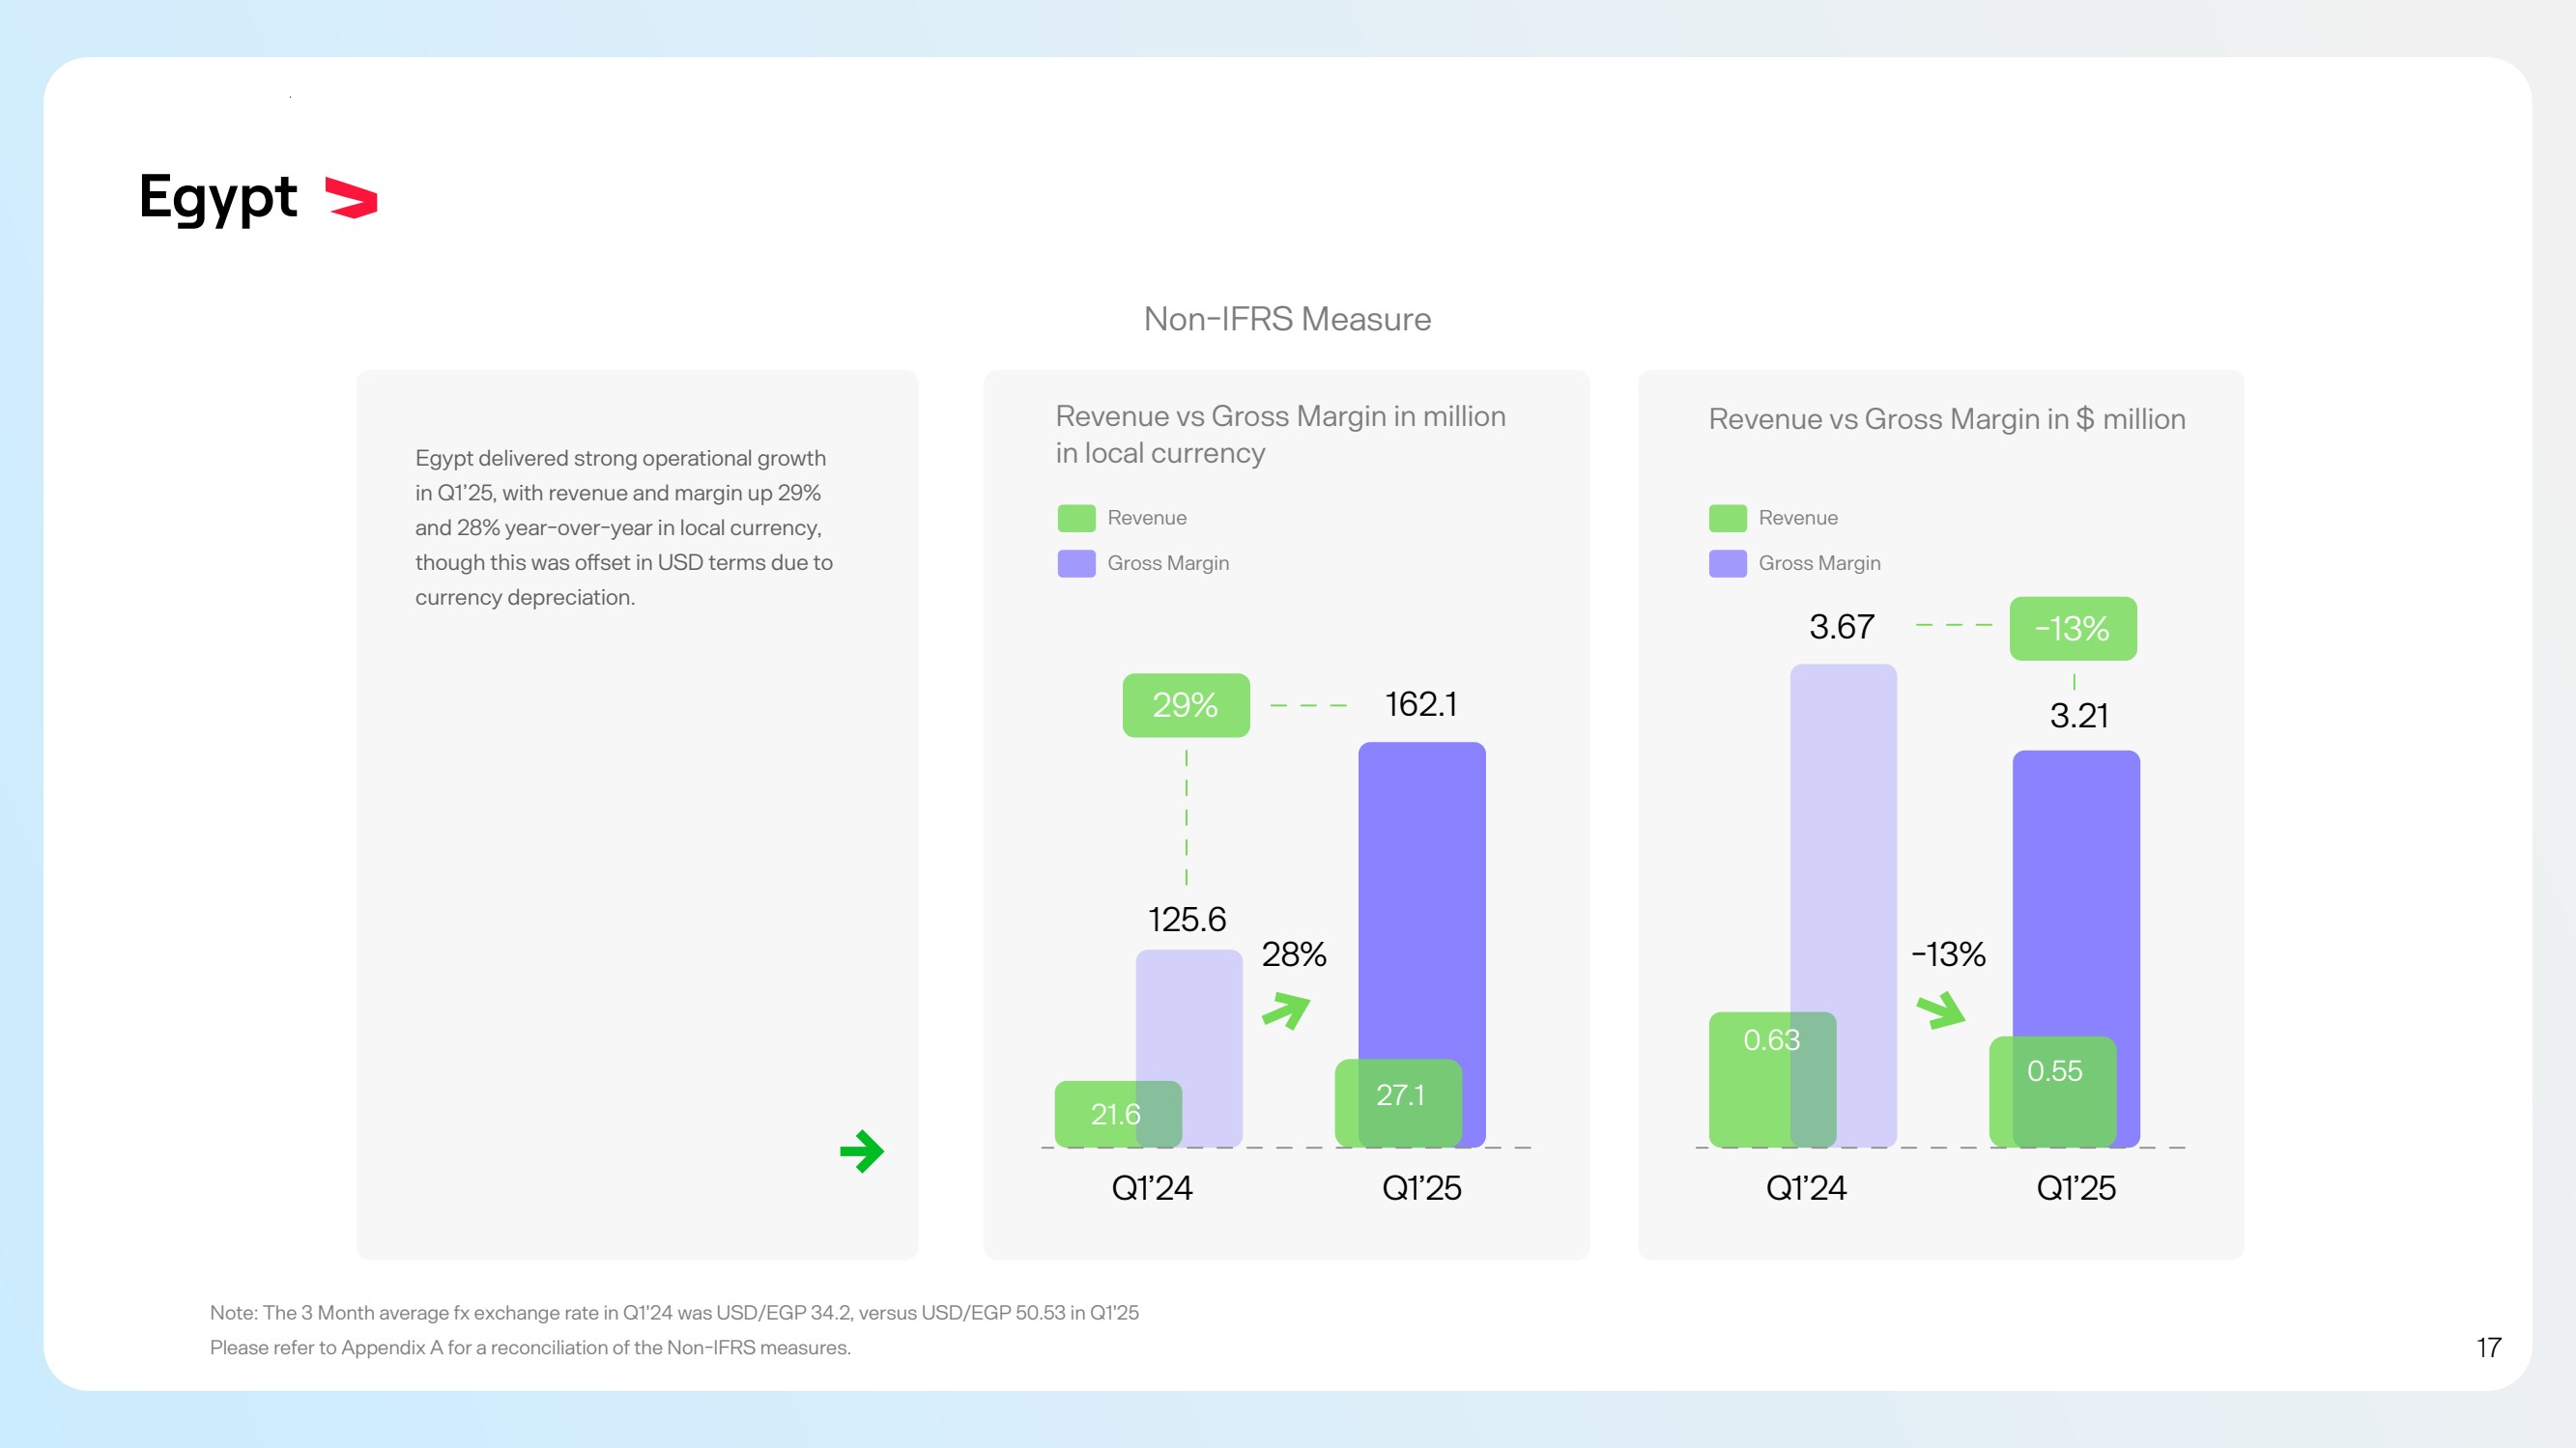
| Egypt Revenue vs Gross Margin in million in local currency Note: The 3 Month average fx exchange rate in Q1'24 was USD/EGP 34.2, versus USD/EGP 50.53 in Q1'25 Please refer to Appendix A for a reconciliation of the Non-IFRS measures. Egypt delivered strong operational growth in Q1’25, with revenue and margin up 29% and 28% year-over-year in local currency, though this was oset in USD terms due to currency depreciation. 125.6 162.1 Q1’24 Q1’25 21.6 27.1 28% 29% 3.67 3.21 Q1’24 Q1’25 0.63 0.55 -13% -13% Non-IFRS Measure Gross Margin Revenue Gross Margin Revenue Revenue vs Gross Margin in $ million 17 |
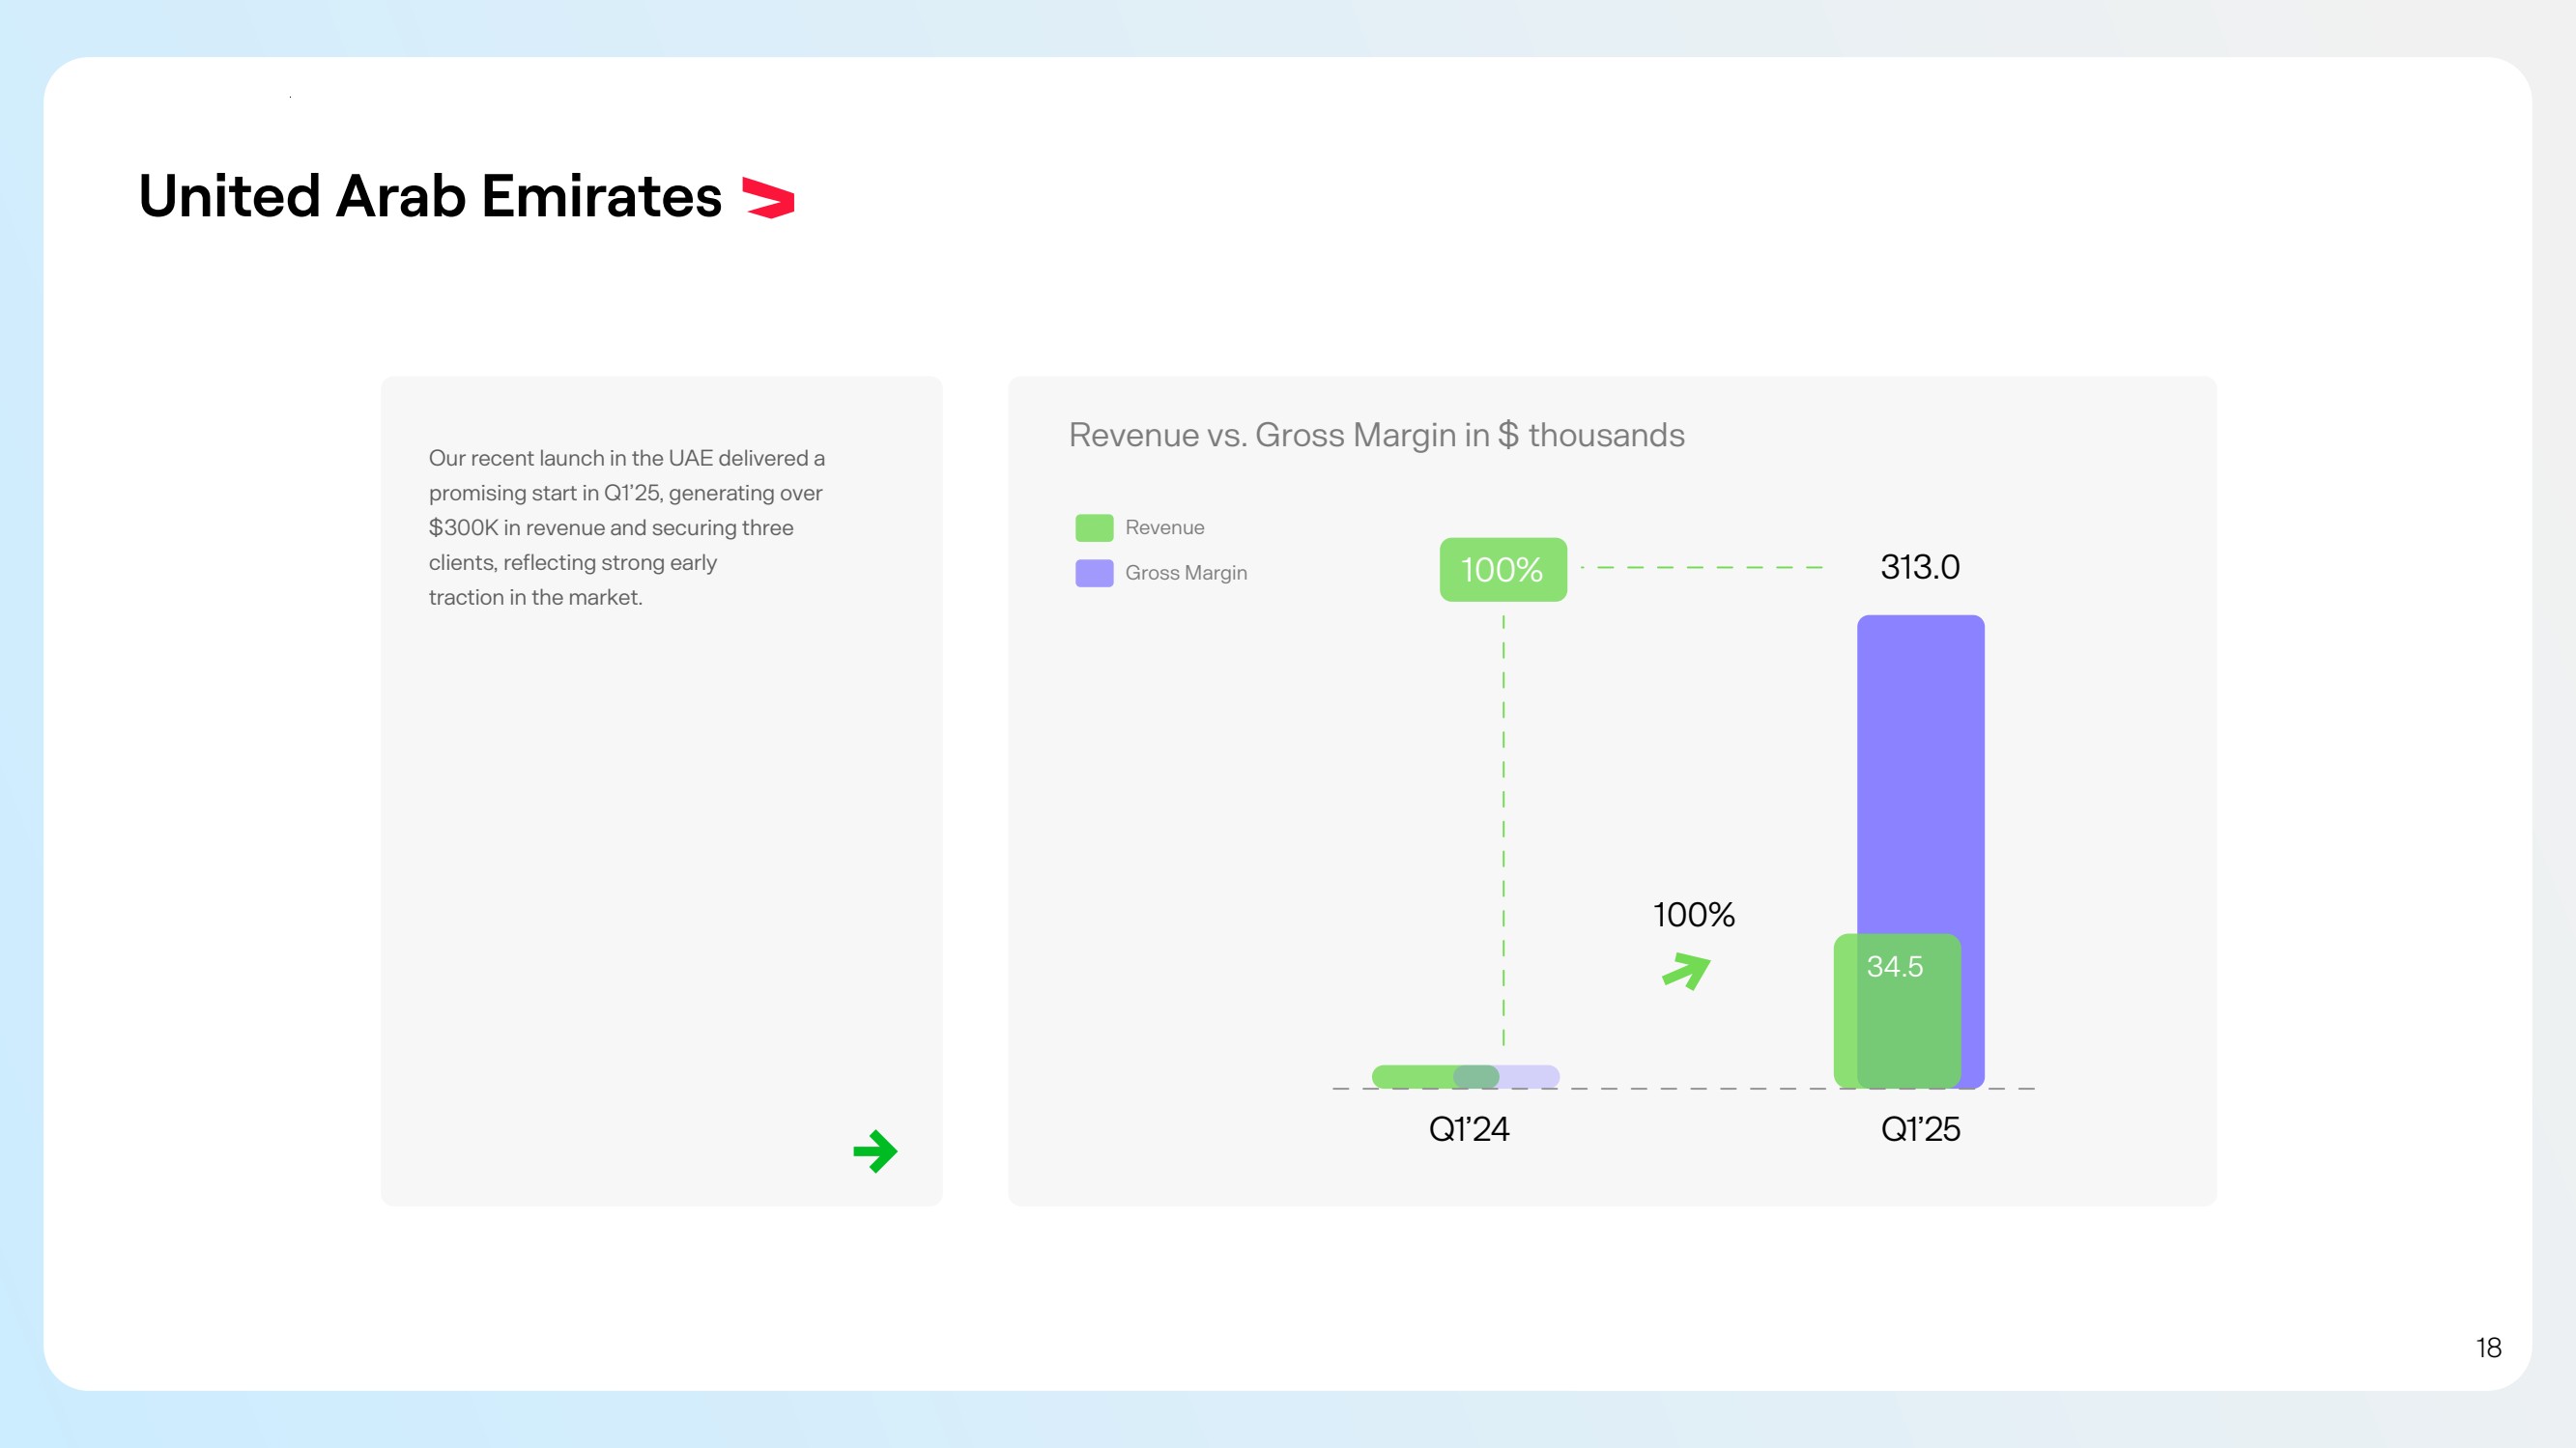
| United Arab Emirates Revenue vs. Gross Margin in $ thousands Our recent launch in the UAE delivered a promising start in Q1’25, generating over $300K in revenue and securing three clients, reflecting strong early traction in the market. Gross Margin Revenue 313.0 Q1’24 Q1’25 34.5 100% 100% 18 |
| Other Highlights 19 |

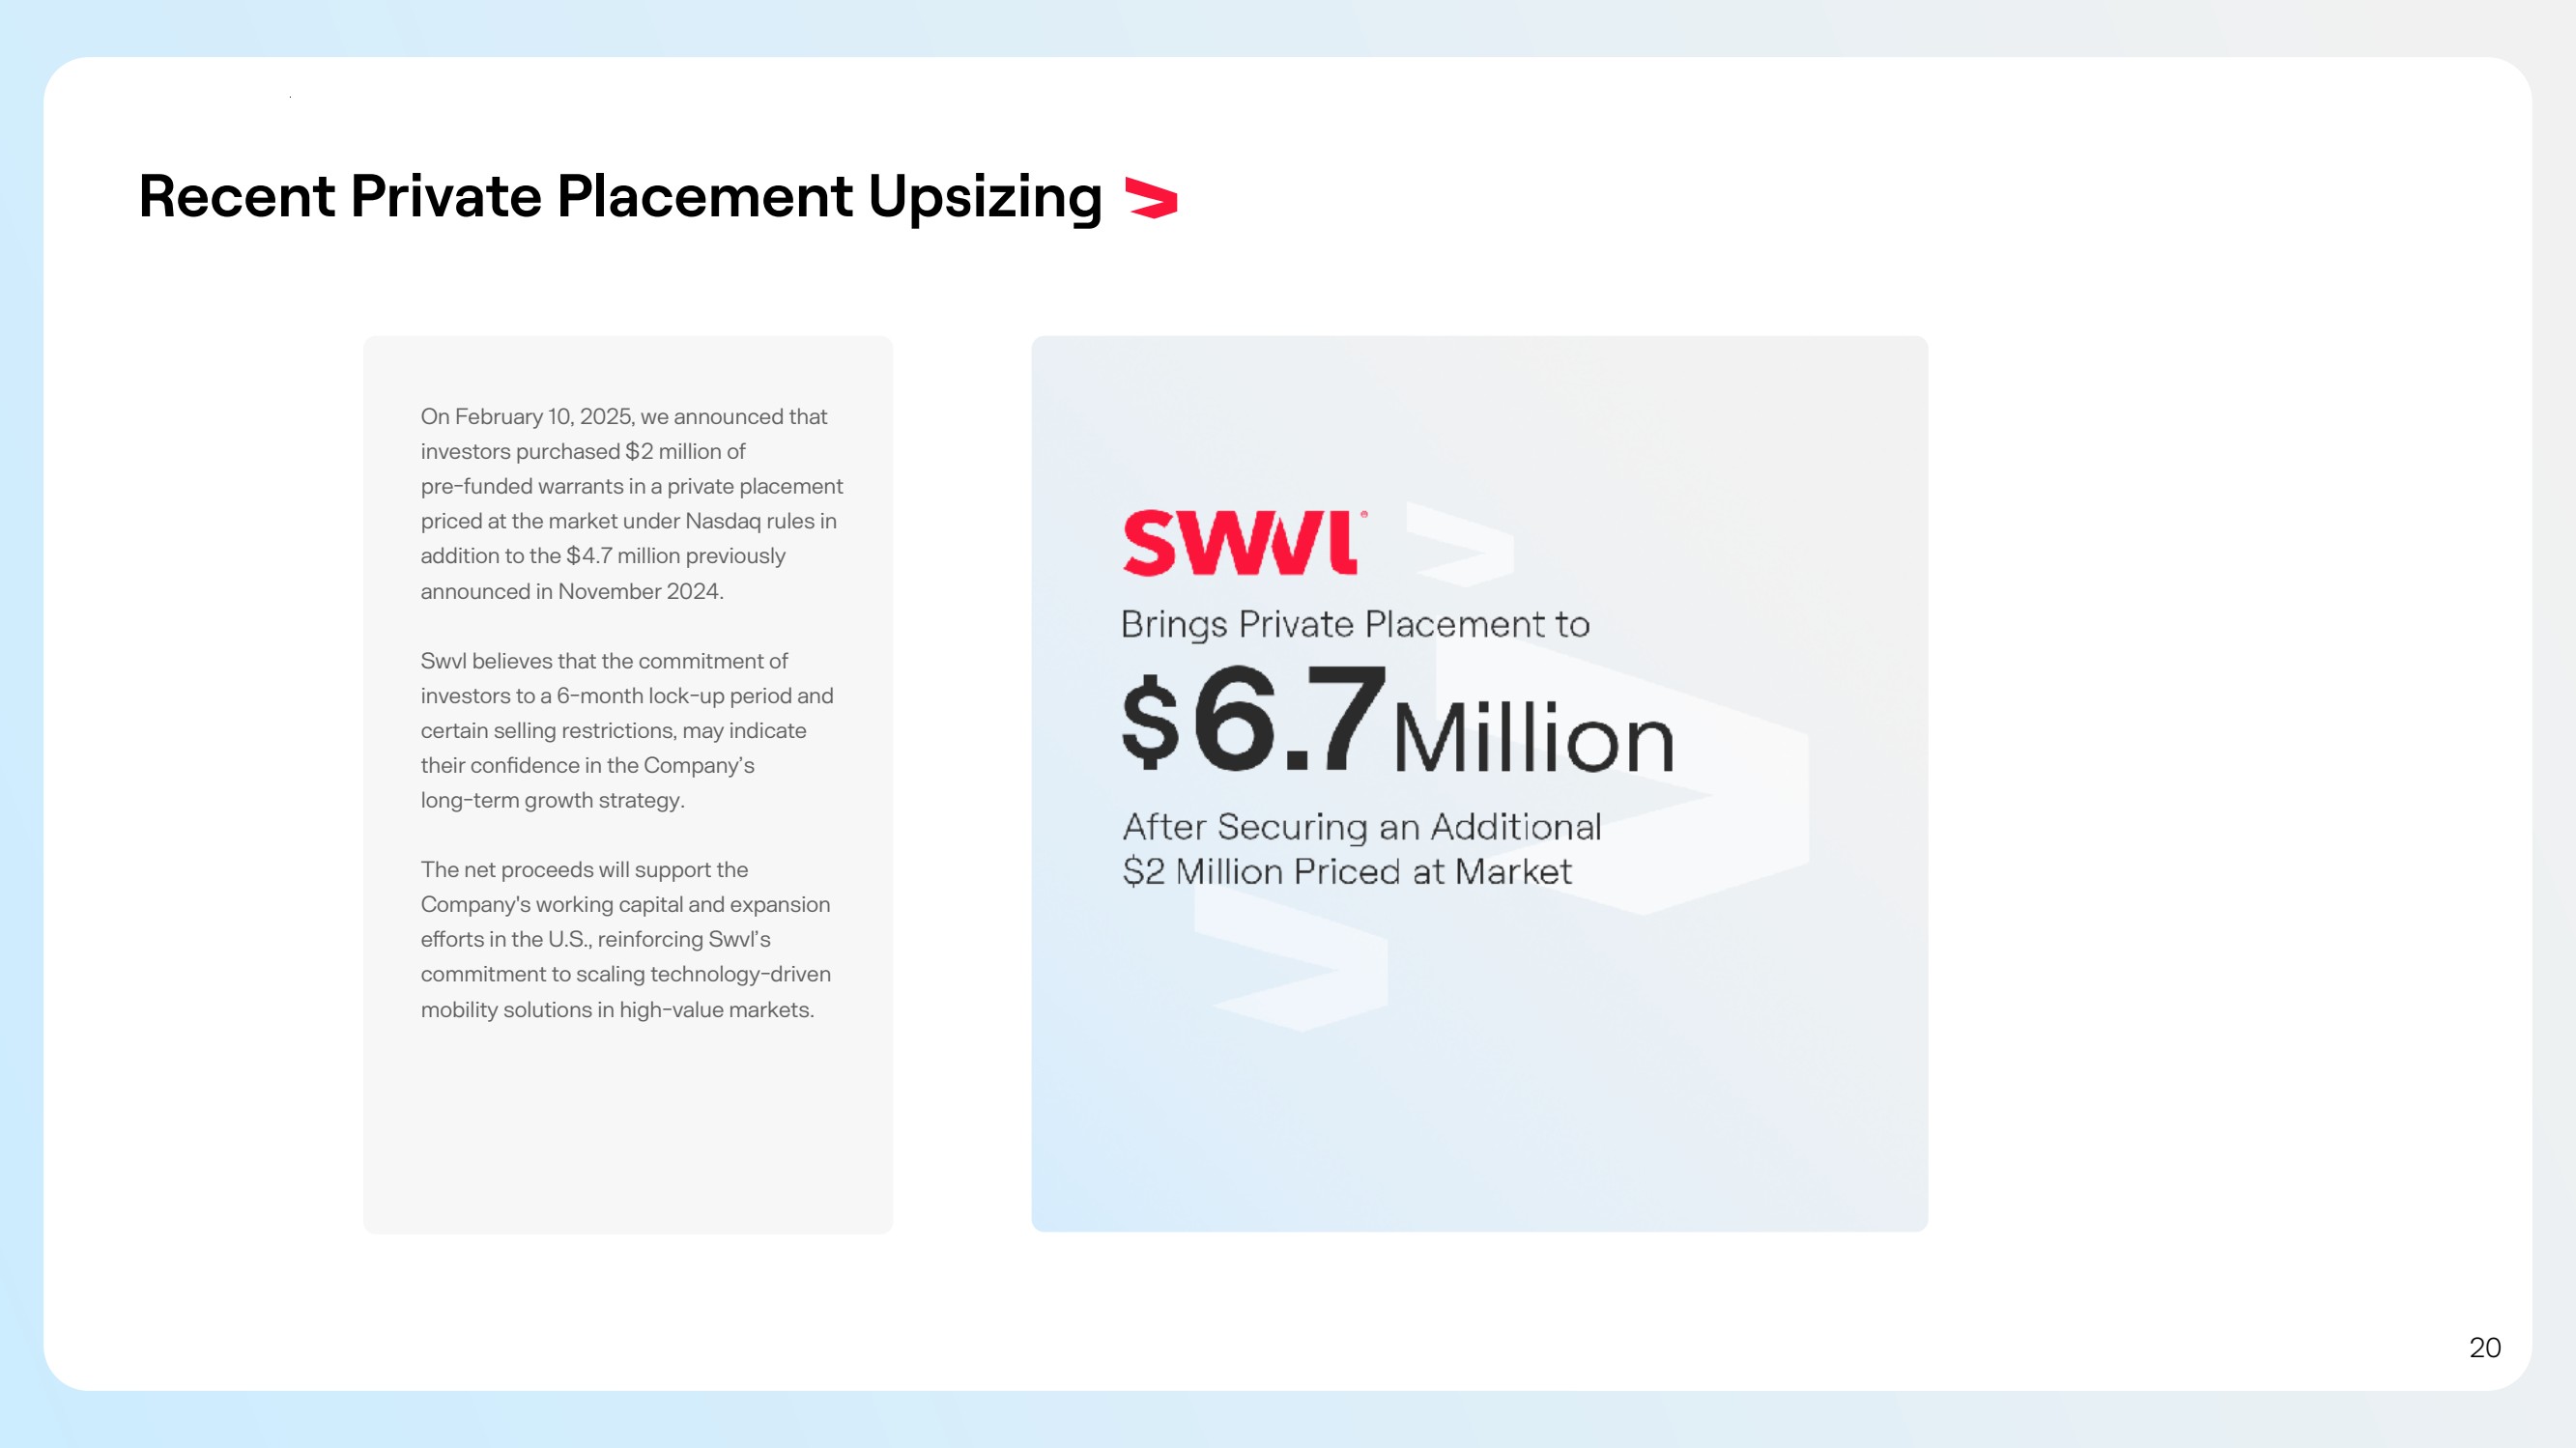
| Recent Private Placement Upsizing On February 10, 2025, we announced that investors purchased $2 million of pre-funded warrants in a private placement priced at the market under Nasdaq rules in addition to the $4.7 million previously announced in November 2024. Swvl believes that the commitment of investors to a 6-month lock-up period and certain selling restrictions, may indicate their condence in the Company’s long-term growth strategy. The net proceeds will support the Company's working capital and expansion eorts in the U.S., reinforcing Swvl’s commitment to scaling technology-driven mobility solutions in high-value markets. 20 |
| Introducing Swvl Luxury Service 21 |

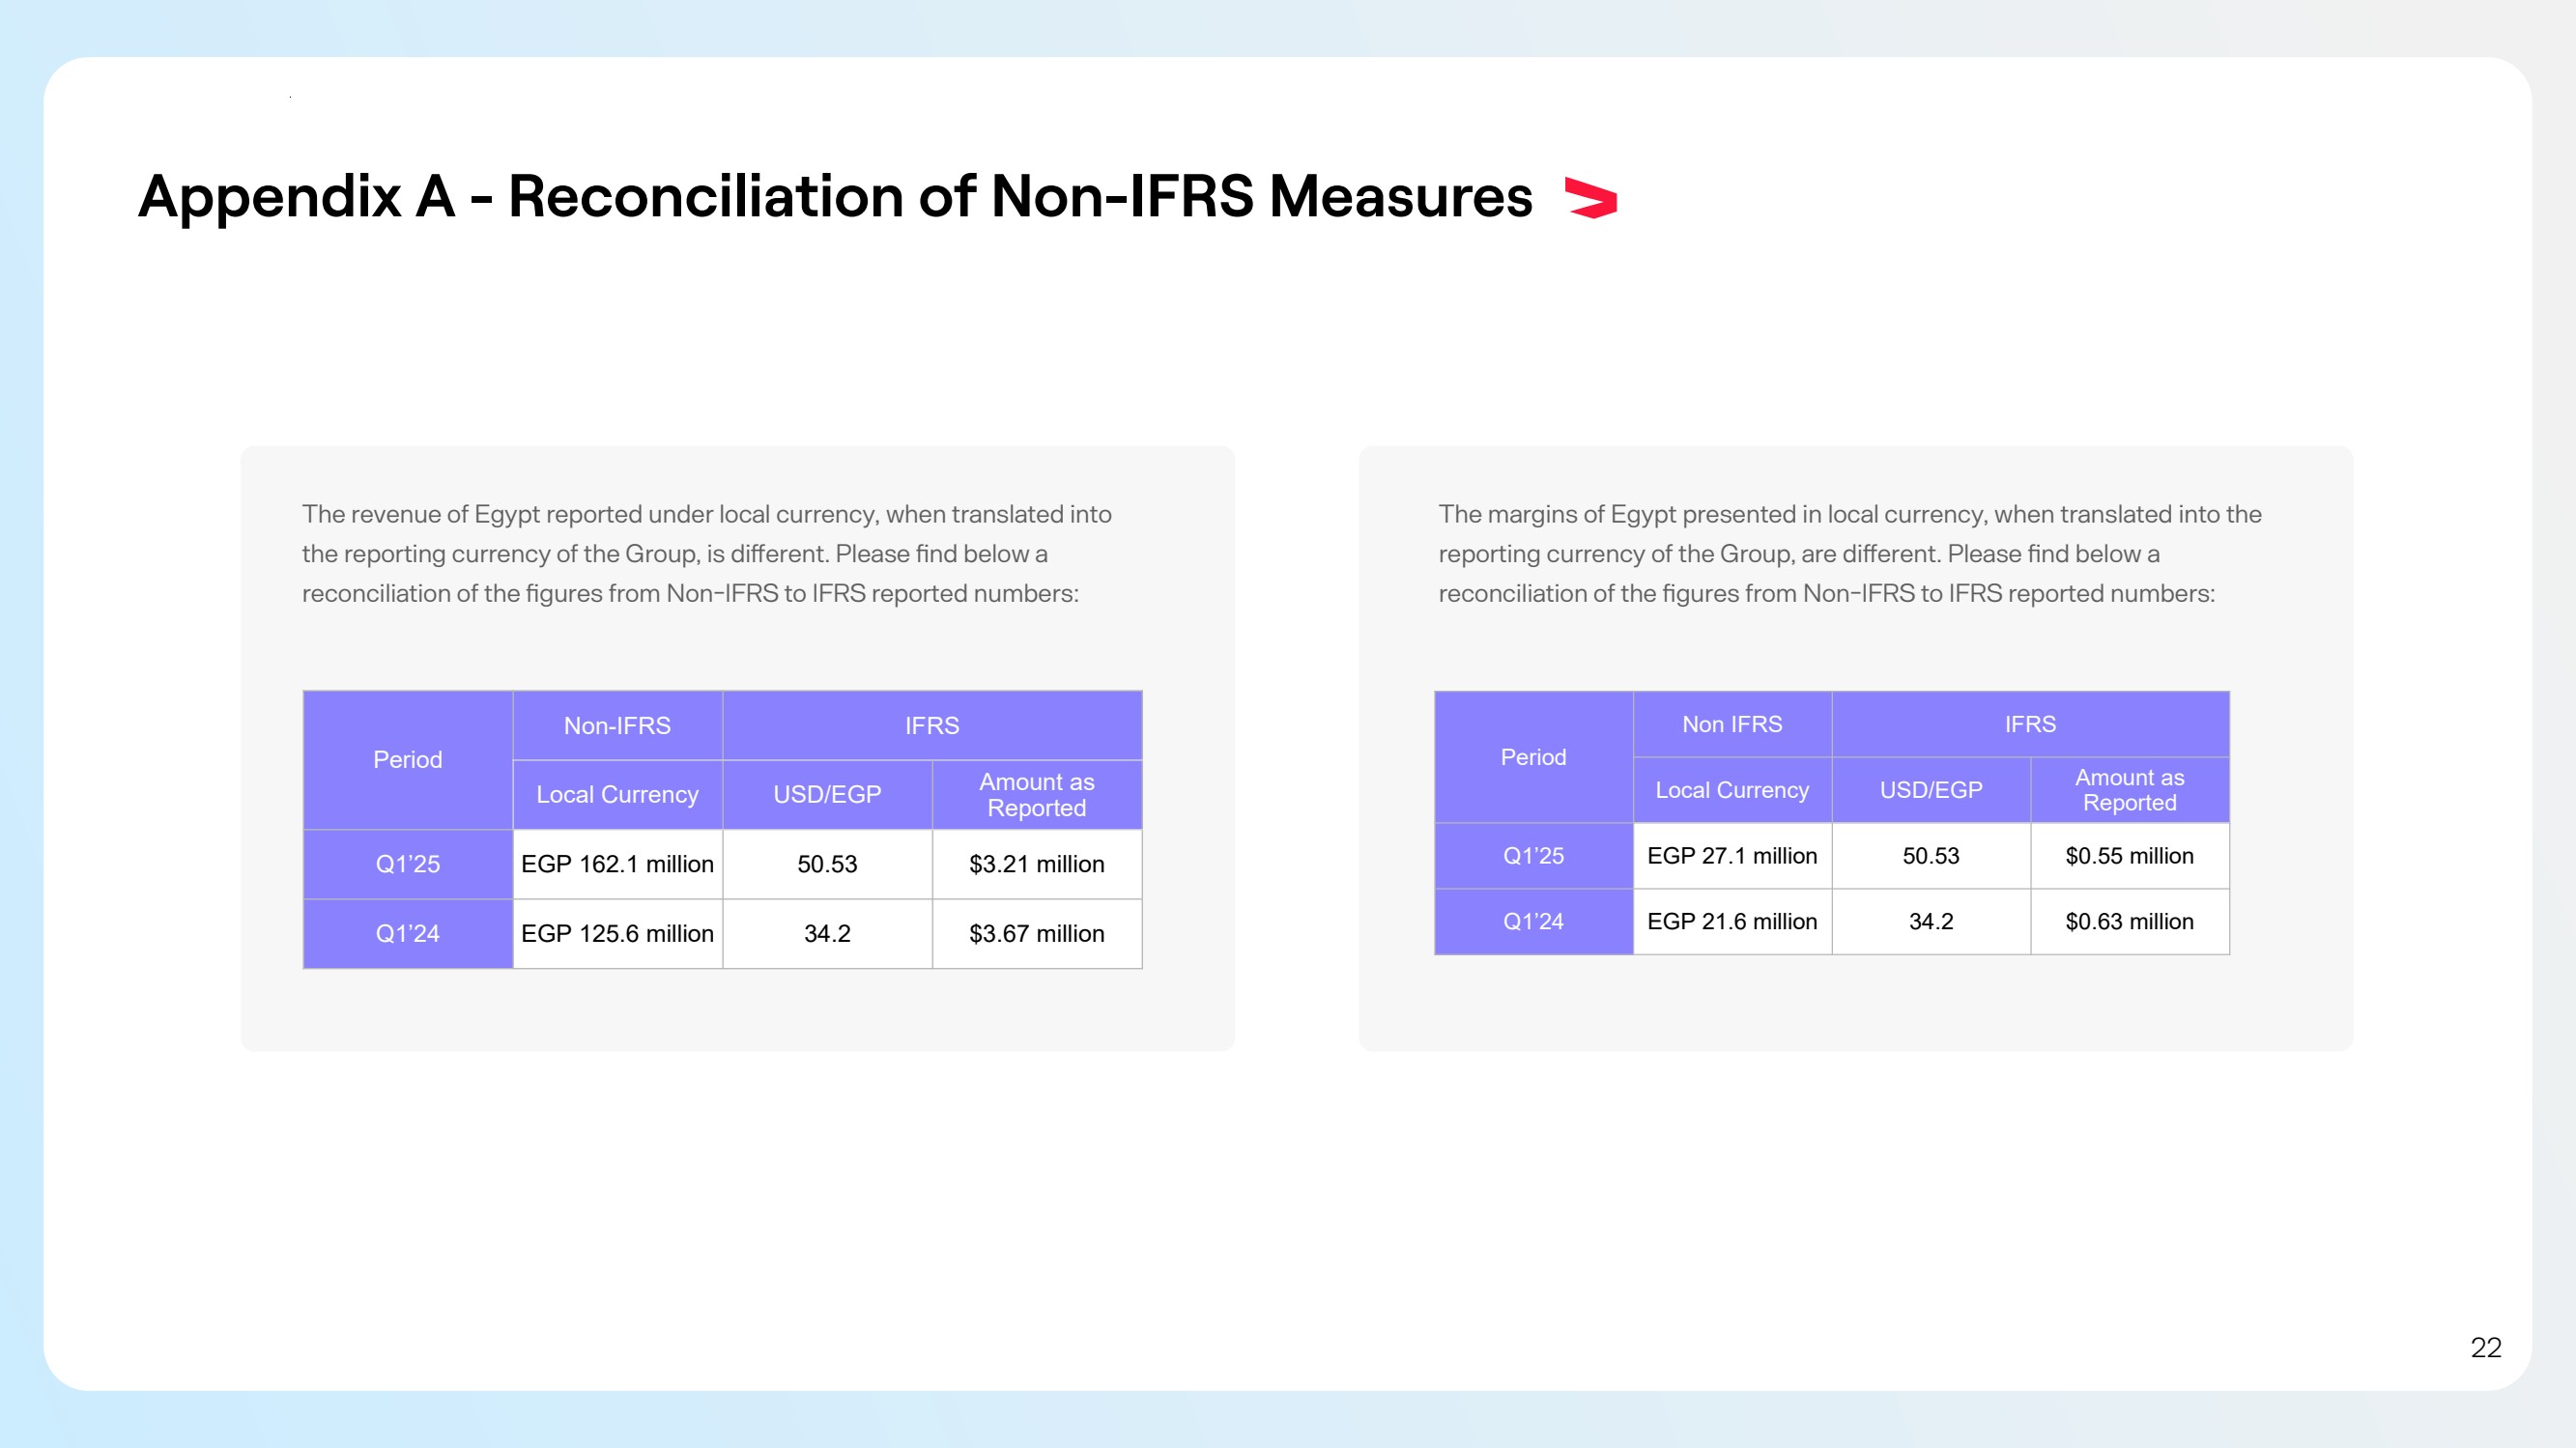
| Appendix A - Reconciliation of Non-IFRS Measures The revenue of Egypt reported under local currency, when translated into the reporting currency of the Group, is dierent. Please nd below a reconciliation of the gures from Non-IFRS to IFRS reported numbers: The margins of Egypt presented in local currency, when translated into the reporting currency of the Group, are dierent. Please nd below a reconciliation of the gures from Non-IFRS to IFRS reported numbers: Period Non-IFRS IFRS Local Currency USD/EGP Amount as Reported Q1’25 EGP 162.1 million 50.53 $3.21 million Q1’24 EGP 125.6 million 34.2 $3.67 million Period Non IFRS IFRS Local Currency USD/EGP Amount as Reported Q1’25 EGP 27.1 million 50.53 $0.55 million Q1’24 EGP 21.6 million 34.2 $0.63 million 22 |
| Definitions Dollar Pegged Revenue Recurring Revenue Transactional revenue Gross Margin Represents revenue generated in currencies that are pegged to the US Dollar (i.e., currently, all revenues excluding EGP). Revenue that is from our contracts with corporate customers. Revenue from individual users taking trips. Represents IFRS revenue minus the cost of sales. 23 |
|