Pay vs Performance Disclosure - USD ($)
Jan. 26, 2025
Jan. 28, 2024
Jan. 29, 2023
Jan. 30, 2022
Jan. 31, 2021
Pay Versus Performance
NVIDIA’s executive compensation program is guided by a pay for performance philosophy and is designed to align NEO pay with our stockholders’ interests. Accordingly, a substantial portion of our NEOs’ total compensation is based on the Company’s performance under certain corporate financial metric goals, which for Fiscal 2025 included annual revenue, annual Non-GAAP Operating Income, and 3-year TSR relative to the S&P 500.
Amounts set forth below as “compensation actually paid,” or CAP, have been calculated in accordance with Item 402(v) of Regulation S-K under the Securities Act, and do not represent the value of compensation actually paid to or received by our NEOs. For a discussion of our executive compensation program and philosophy, refer to our CD&A above.
The following table summarizes information regarding compensation for our NEOs, including CAP as well as certain financial performance metrics, during Fiscal 2021-2025. Fiscal 2022-2025 were 52-week years. Fiscal 2021 was a 53-week year.
Value of Initial Fixed $100 Investment Based on (7): | ||||||||||||||||||||||||||||||||||||||||||||||||||
| Fiscal Year | Summary Compensation Table Total for CEO ($) (1) (2) | Compensation Actually Paid to CEO ($) (1) (3) | Average Summary Compensation Table Total for Non-CEO NEOs ($) (4) (5) | Average Compensation Actually Paid to Non-CEO NEOs ($) (4) (6) | Total Shareholder Return ($) | Peer Group Total Shareholder Return ($) (8) | Net Income (in millions) ($) | Non-GAAP Operating Income (in millions) ($) (9) | ||||||||||||||||||||||||||||||||||||||||||
| 2025 | 49,866,251 | 344,188,027 | 20,343,288 | 125,583,913 | 2,287.07 | 238.19 | 72,880 | 86,789 | ||||||||||||||||||||||||||||||||||||||||||
| 2024 | 34,167,902 | 234,132,305 | 12,247,411 | 85,558,057 | 978.42 | 190.57 | 29,760 | 37,134 | ||||||||||||||||||||||||||||||||||||||||||
| 2023 | 21,356,924 | (4,118,947) | 9,941,838 | (1,364,661) | 326.34 | 133.09 | 4,368 | 9,040 | ||||||||||||||||||||||||||||||||||||||||||
| 2022 | 23,737,661 | 105,543,768 | 8,910,802 | 38,453,071 | 365.66 | 158.12 | 9,752 | 12,690 | ||||||||||||||||||||||||||||||||||||||||||
| 2021 | 19,316,401 | 79,631,875 | 7,224,018 | 27,879,337 | 207.79 | 141.39 | 4,332 | 6,803 | ||||||||||||||||||||||||||||||||||||||||||
(1) For Fiscal 2021-2025, our CEO was Jen-Hsun Huang.
(2) The amounts in this column correspond with total compensation for our CEO as reported in our Summary Compensation Table above for the listed fiscal years.
(3) The amounts in this column represent CAP calculated in accordance with Item 402(v) of Regulation S-K during the listed fiscal years. Adjustments to the Summary Compensation Table total compensation for our CEO to arrive at CAP for Fiscal 2025 were as follows:
Reconciliation of Summary Compensation Table Total Compensation for CEO to CAP
| Equity Award Adjustments | ||||||||||||||||||||||||||||||||||||||||||||
| (Deduct): | Add: | Add/(Deduct): | Add/(Deduct): | |||||||||||||||||||||||||||||||||||||||||
| Fiscal Year | Summary Compensation Table Total for CEO ($) | Value of Equity Awards Reported in Summary Compensation Table ($) (a) | Year End Fair Value of Awards Granted During the Year which were Unvested at Year End ($) (b) | Year Over Year Change in Fair Value of Outstanding and Unvested Awards ($) (b) | Change in Fair Value of Awards Granted in Prior Years which Vested During the Year ($) (b) | Total Equity Award Adjustments ($) (b) (c) | Compensation Actually Paid to CEO ($) | |||||||||||||||||||||||||||||||||||||
| 2025 | 49,866,251 | (38,811,306) | 80,241,370 | 182,049,999 | 70,841,712 | 333,133,082 | 344,188,027 | |||||||||||||||||||||||||||||||||||||
(a) The amount in this column corresponds with the full grant date fair value, calculated in accordance with ASC 718, of “Stock Awards” for our CEO as reported in our Summary Compensation Table above for Fiscal 2025.
(b) The equity award adjustments were calculated in accordance with the SEC methodology for determining CAP for each year shown. The amounts in these columns were determined by reference to (i) for MY PSU awards where the performance period was complete as of or prior to the applicable year end date and for SY PSU awards, the closing price of our common stock on the applicable year end date, as reduced by the present value of dividends expected to be paid on the underlying shares during the requisite service period, or the closing price of our common stock on the applicable vesting dates, and (ii) for MY PSU awards where the performance period was not yet complete as of the applicable year end date, the fair value as calculated by a Monte Carlo simulation model as of the respective year end date, for the listed fiscal years.
(c) The valuation assumptions used to calculate fair values did not materially differ from those disclosed at the time of grant.
(4) For Fiscal 2021-2025, our non-CEO NEOs were Colette M. Kress, Ajay K. Puri, Debora Shoquist, and Timothy S. Teter.
(5) The amounts in this column correspond with the average of the total compensation for our non-CEO NEOs as reported in our Summary Compensation Table above for the listed fiscal years.
(6) The amounts in this column represent average CAP calculated in accordance with Item 402(v) of Regulation S-K during the listed fiscal years. Adjustments to the Summary Compensation Table average total compensation for our non-CEO NEOs to arrive at average CAP for Fiscal 2025 were as follows:
Reconciliation of Summary Compensation Table Average Total Compensation for Non-CEO NEOs to CAP
| Equity Award Adjustments | ||||||||||||||||||||||||||||||||||||||||||||||||||
| (Deduct): | Add: | Add/(Deduct): | Add: | Add/(Deduct): | ||||||||||||||||||||||||||||||||||||||||||||||
| Fiscal Year | Average Summary Compensation Table Total for Non-CEO NEOs ($) | Value of Equity Awards Reported in Summary Compensation Table ($) (a) | Year End Fair Value of Awards Granted During the Year which were Unvested at Year End ($) (b) | Year Over Year Change in Fair Value of Outstanding and Unvested Awards ($) (b) | Vesting Date Fair Value of Awards Granted and Vested During the Year ($) (b) | Change in Fair Value of Awards Granted in Prior Years which Vested During the Year ($) (b) | Total Equity Award Adjustments ($) (b) (c) | Average Compensation Actually Paid to Non-CEO NEOs ($) | ||||||||||||||||||||||||||||||||||||||||||
| 2025 | 20,343,288 | (18,701,150) | 35,665,330 | 52,758,097 | 2,189,796 | 33,328,552 | 123,941,775 | 125,583,913 | ||||||||||||||||||||||||||||||||||||||||||
(a) The amount in this column corresponds with the average of the full grant date fair value, calculated in accordance with ASC 718, of “Stock Awards” for our non-CEO NEOs as reported in our Summary Compensation Table above for Fiscal 2025.
(b) The equity award adjustments were calculated in accordance with the SEC methodology for determining CAP for each year shown. The amounts in these columns were determined by reference to (i) for MY PSU awards where the performance period was complete as of or prior to the applicable year end date, for RSU awards and for SY PSU awards, the closing price of our common stock on the applicable year end date, as reduced by the present value of dividends expected to be paid on the underlying shares during the requisite service period, or the closing price of our common stock on the applicable vesting dates, and (ii) for MY PSU awards where the performance period was not yet complete as of the applicable year end date, the fair value as calculated by a Monte Carlo simulation model as of the respective year end date, for the listed fiscal years.
(c) The valuation assumptions used to calculate fair values did not materially differ from those disclosed at the time of grant.
(7) TSR for each of the years during Fiscal 2021-2025 is cumulative, reflecting the value of a fixed $100 investment beginning with the market close on January 24, 2020, the last trading day before our Fiscal 2021, through and including the end of the respective listed fiscal years.
(8) The Nasdaq 100 Index is the industry peer group we use for purposes of Item 201(e) of Regulation S-K. The separate peer group referenced by the CC for purposes of determining executive compensation is discussed above in CD&A.
(9) Our Company-Selected Measure, as required by Item 402(v) of Regulation S-K, is Non-GAAP Operating Income, which, in our assessment, represents the most important financial performance measure linking Fiscal 2025 NEO CAP to company performance. See Definitions above for a definition of Non-GAAP Operating Income, and see Reconciliation of Non-GAAP Financial Measures above in CD&A for a reconciliation between GAAP operating income and non-GAAP Operating Income.
(4) For Fiscal 2021-2025, our non-CEO NEOs were Colette M. Kress, Ajay K. Puri, Debora Shoquist, and Timothy S. Teter.
(3) The amounts in this column represent CAP calculated in accordance with Item 402(v) of Regulation S-K during the listed fiscal years. Adjustments to the Summary Compensation Table total compensation for our CEO to arrive at CAP for Fiscal 2025 were as follows:
Reconciliation of Summary Compensation Table Total Compensation for CEO to CAP
| Equity Award Adjustments | ||||||||||||||||||||||||||||||||||||||||||||
| (Deduct): | Add: | Add/(Deduct): | Add/(Deduct): | |||||||||||||||||||||||||||||||||||||||||
| Fiscal Year | Summary Compensation Table Total for CEO ($) | Value of Equity Awards Reported in Summary Compensation Table ($) (a) | Year End Fair Value of Awards Granted During the Year which were Unvested at Year End ($) (b) | Year Over Year Change in Fair Value of Outstanding and Unvested Awards ($) (b) | Change in Fair Value of Awards Granted in Prior Years which Vested During the Year ($) (b) | Total Equity Award Adjustments ($) (b) (c) | Compensation Actually Paid to CEO ($) | |||||||||||||||||||||||||||||||||||||
| 2025 | 49,866,251 | (38,811,306) | 80,241,370 | 182,049,999 | 70,841,712 | 333,133,082 | 344,188,027 | |||||||||||||||||||||||||||||||||||||
(a) The amount in this column corresponds with the full grant date fair value, calculated in accordance with ASC 718, of “Stock Awards” for our CEO as reported in our Summary Compensation Table above for Fiscal 2025.
(b) The equity award adjustments were calculated in accordance with the SEC methodology for determining CAP for each year shown. The amounts in these columns were determined by reference to (i) for MY PSU awards where the performance period was complete as of or prior to the applicable year end date and for SY PSU awards, the closing price of our common stock on the applicable year end date, as reduced by the present value of dividends expected to be paid on the underlying shares during the requisite service period, or the closing price of our common stock on the applicable vesting dates, and (ii) for MY PSU awards where the performance period was not yet complete as of the applicable year end date, the fair value as calculated by a Monte Carlo simulation model as of the respective year end date, for the listed fiscal years.
(c) The valuation assumptions used to calculate fair values did not materially differ from those disclosed at the time of grant.
(6) The amounts in this column represent average CAP calculated in accordance with Item 402(v) of Regulation S-K during the listed fiscal years. Adjustments to the Summary Compensation Table average total compensation for our non-CEO NEOs to arrive at average CAP for Fiscal 2025 were as follows:
Reconciliation of Summary Compensation Table Average Total Compensation for Non-CEO NEOs to CAP
| Equity Award Adjustments | ||||||||||||||||||||||||||||||||||||||||||||||||||
| (Deduct): | Add: | Add/(Deduct): | Add: | Add/(Deduct): | ||||||||||||||||||||||||||||||||||||||||||||||
| Fiscal Year | Average Summary Compensation Table Total for Non-CEO NEOs ($) | Value of Equity Awards Reported in Summary Compensation Table ($) (a) | Year End Fair Value of Awards Granted During the Year which were Unvested at Year End ($) (b) | Year Over Year Change in Fair Value of Outstanding and Unvested Awards ($) (b) | Vesting Date Fair Value of Awards Granted and Vested During the Year ($) (b) | Change in Fair Value of Awards Granted in Prior Years which Vested During the Year ($) (b) | Total Equity Award Adjustments ($) (b) (c) | Average Compensation Actually Paid to Non-CEO NEOs ($) | ||||||||||||||||||||||||||||||||||||||||||
| 2025 | 20,343,288 | (18,701,150) | 35,665,330 | 52,758,097 | 2,189,796 | 33,328,552 | 123,941,775 | 125,583,913 | ||||||||||||||||||||||||||||||||||||||||||
(a) The amount in this column corresponds with the average of the full grant date fair value, calculated in accordance with ASC 718, of “Stock Awards” for our non-CEO NEOs as reported in our Summary Compensation Table above for Fiscal 2025.
(b) The equity award adjustments were calculated in accordance with the SEC methodology for determining CAP for each year shown. The amounts in these columns were determined by reference to (i) for MY PSU awards where the performance period was complete as of or prior to the applicable year end date, for RSU awards and for SY PSU awards, the closing price of our common stock on the applicable year end date, as reduced by the present value of dividends expected to be paid on the underlying shares during the requisite service period, or the closing price of our common stock on the applicable vesting dates, and (ii) for MY PSU awards where the performance period was not yet complete as of the applicable year end date, the fair value as calculated by a Monte Carlo simulation model as of the respective year end date, for the listed fiscal years.
(c) The valuation assumptions used to calculate fair values did not materially differ from those disclosed at the time of grant.
Relationships Between CAP and Financial Performance
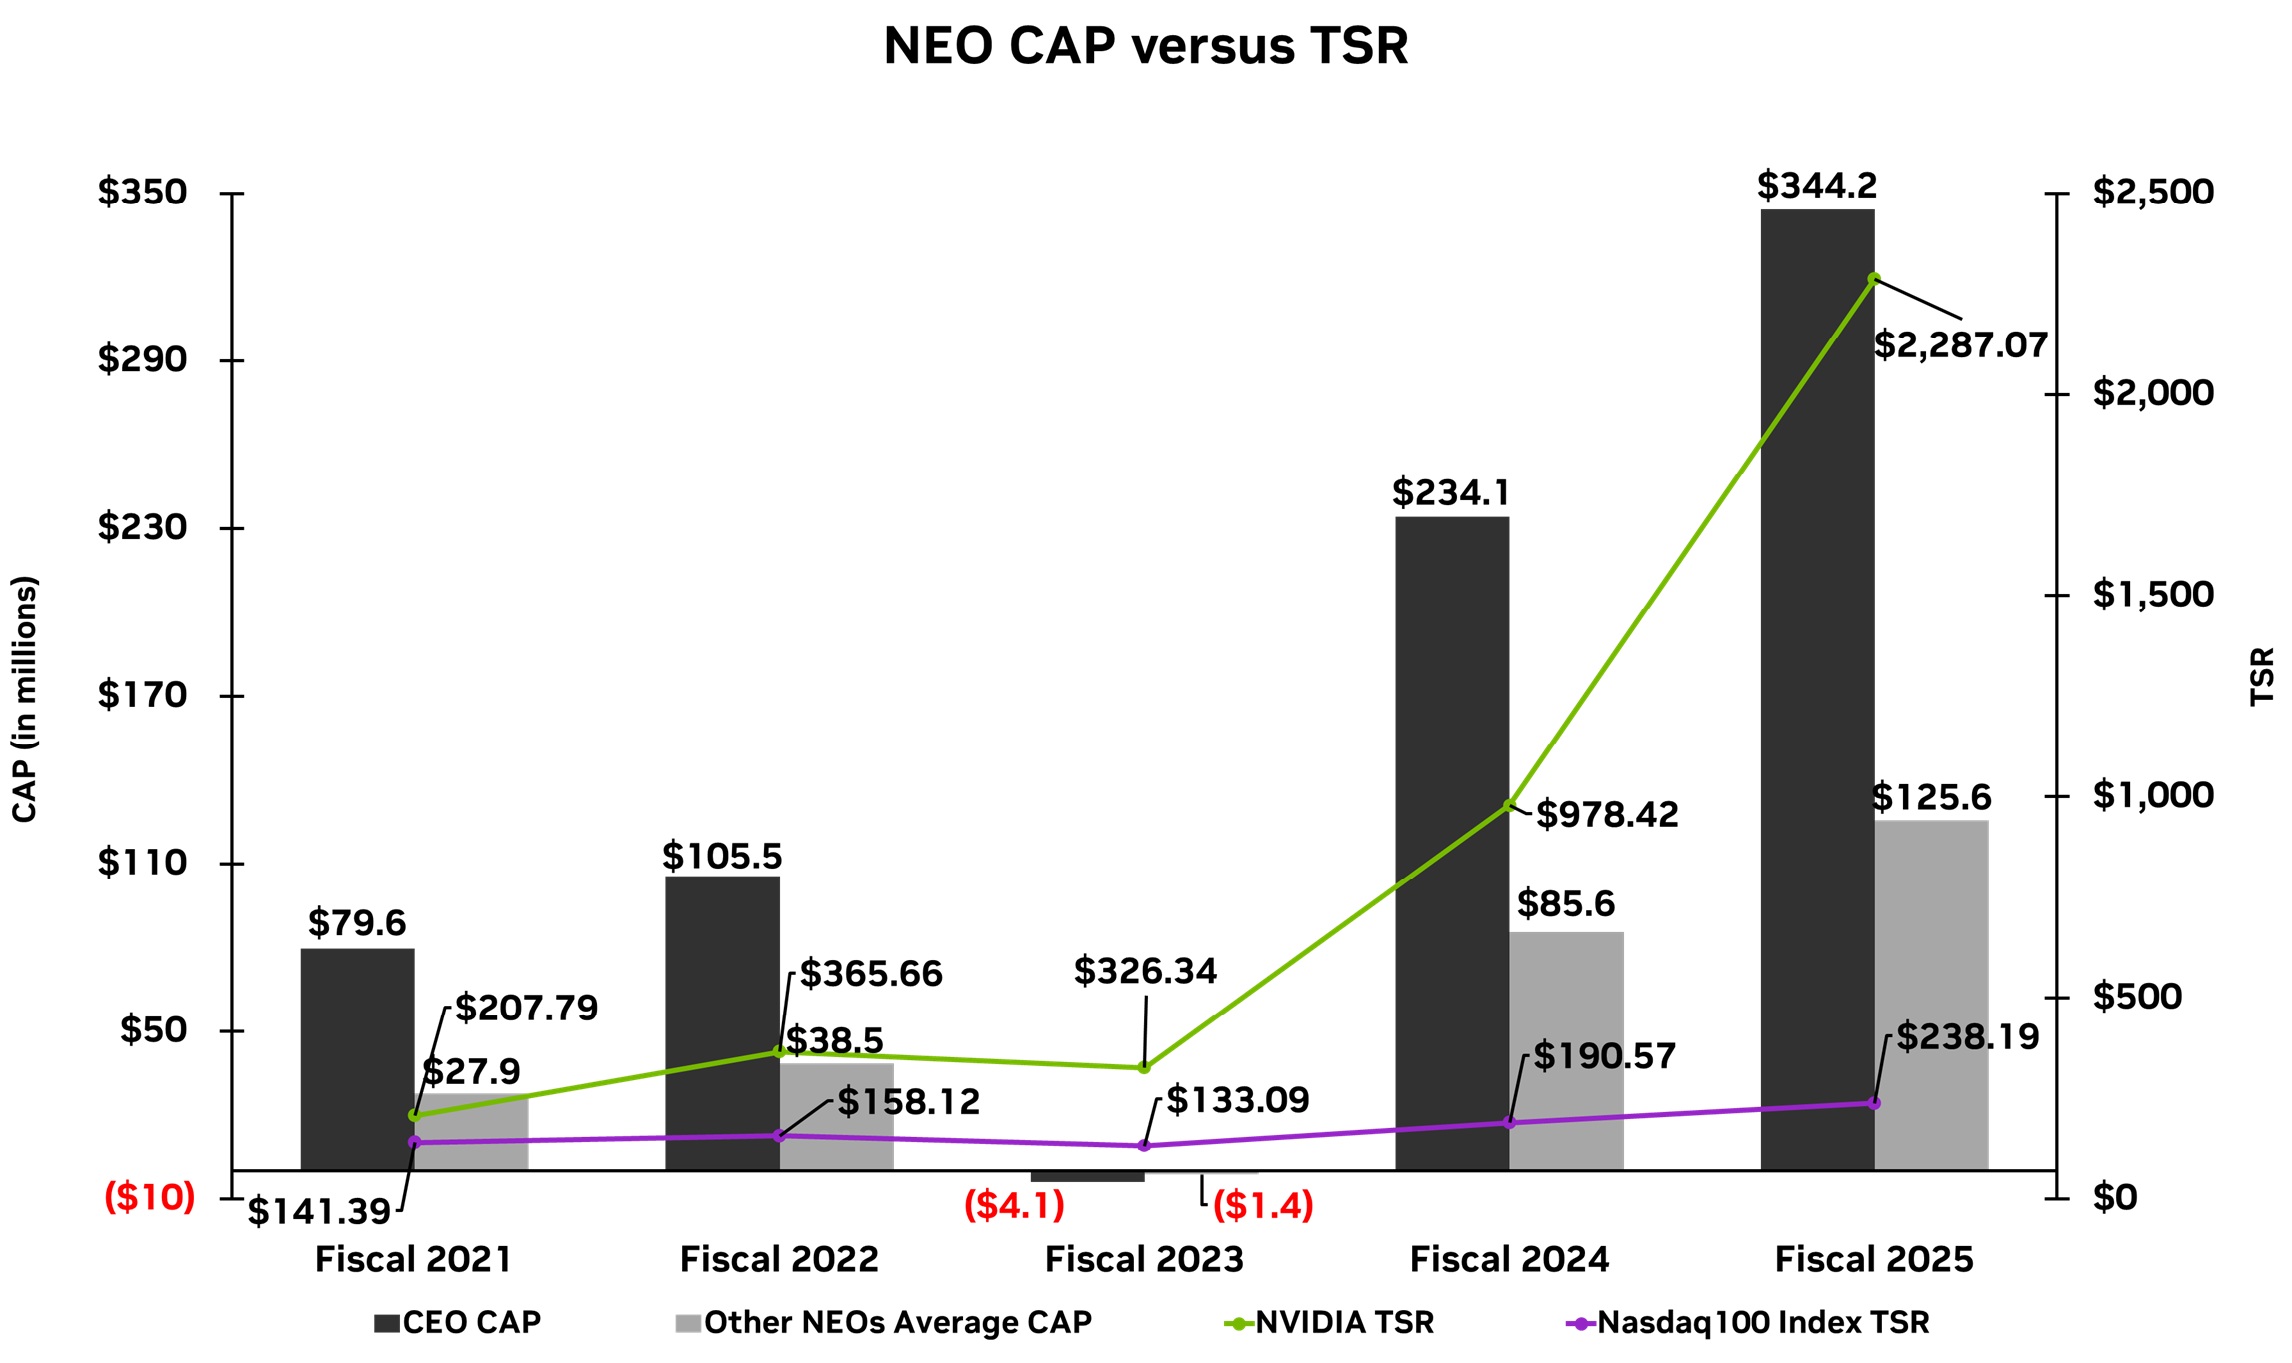
The following graphs illustrate how CAP for our NEOs aligns with the Company’s financial performance measures as detailed in the Pay Versus Performance table above for each of Fiscal 2021, 2022, 2023, 2024, and 2025, as well as between the TSRs of NVIDIA and the Nasdaq100 Index, reflecting the value of a fixed $100 investment beginning with the market close on January 24, 2020, the last trading day before our Fiscal 2021, through and including the end of the respective listed fiscal years.
Relationships Between CAP and Financial Performance
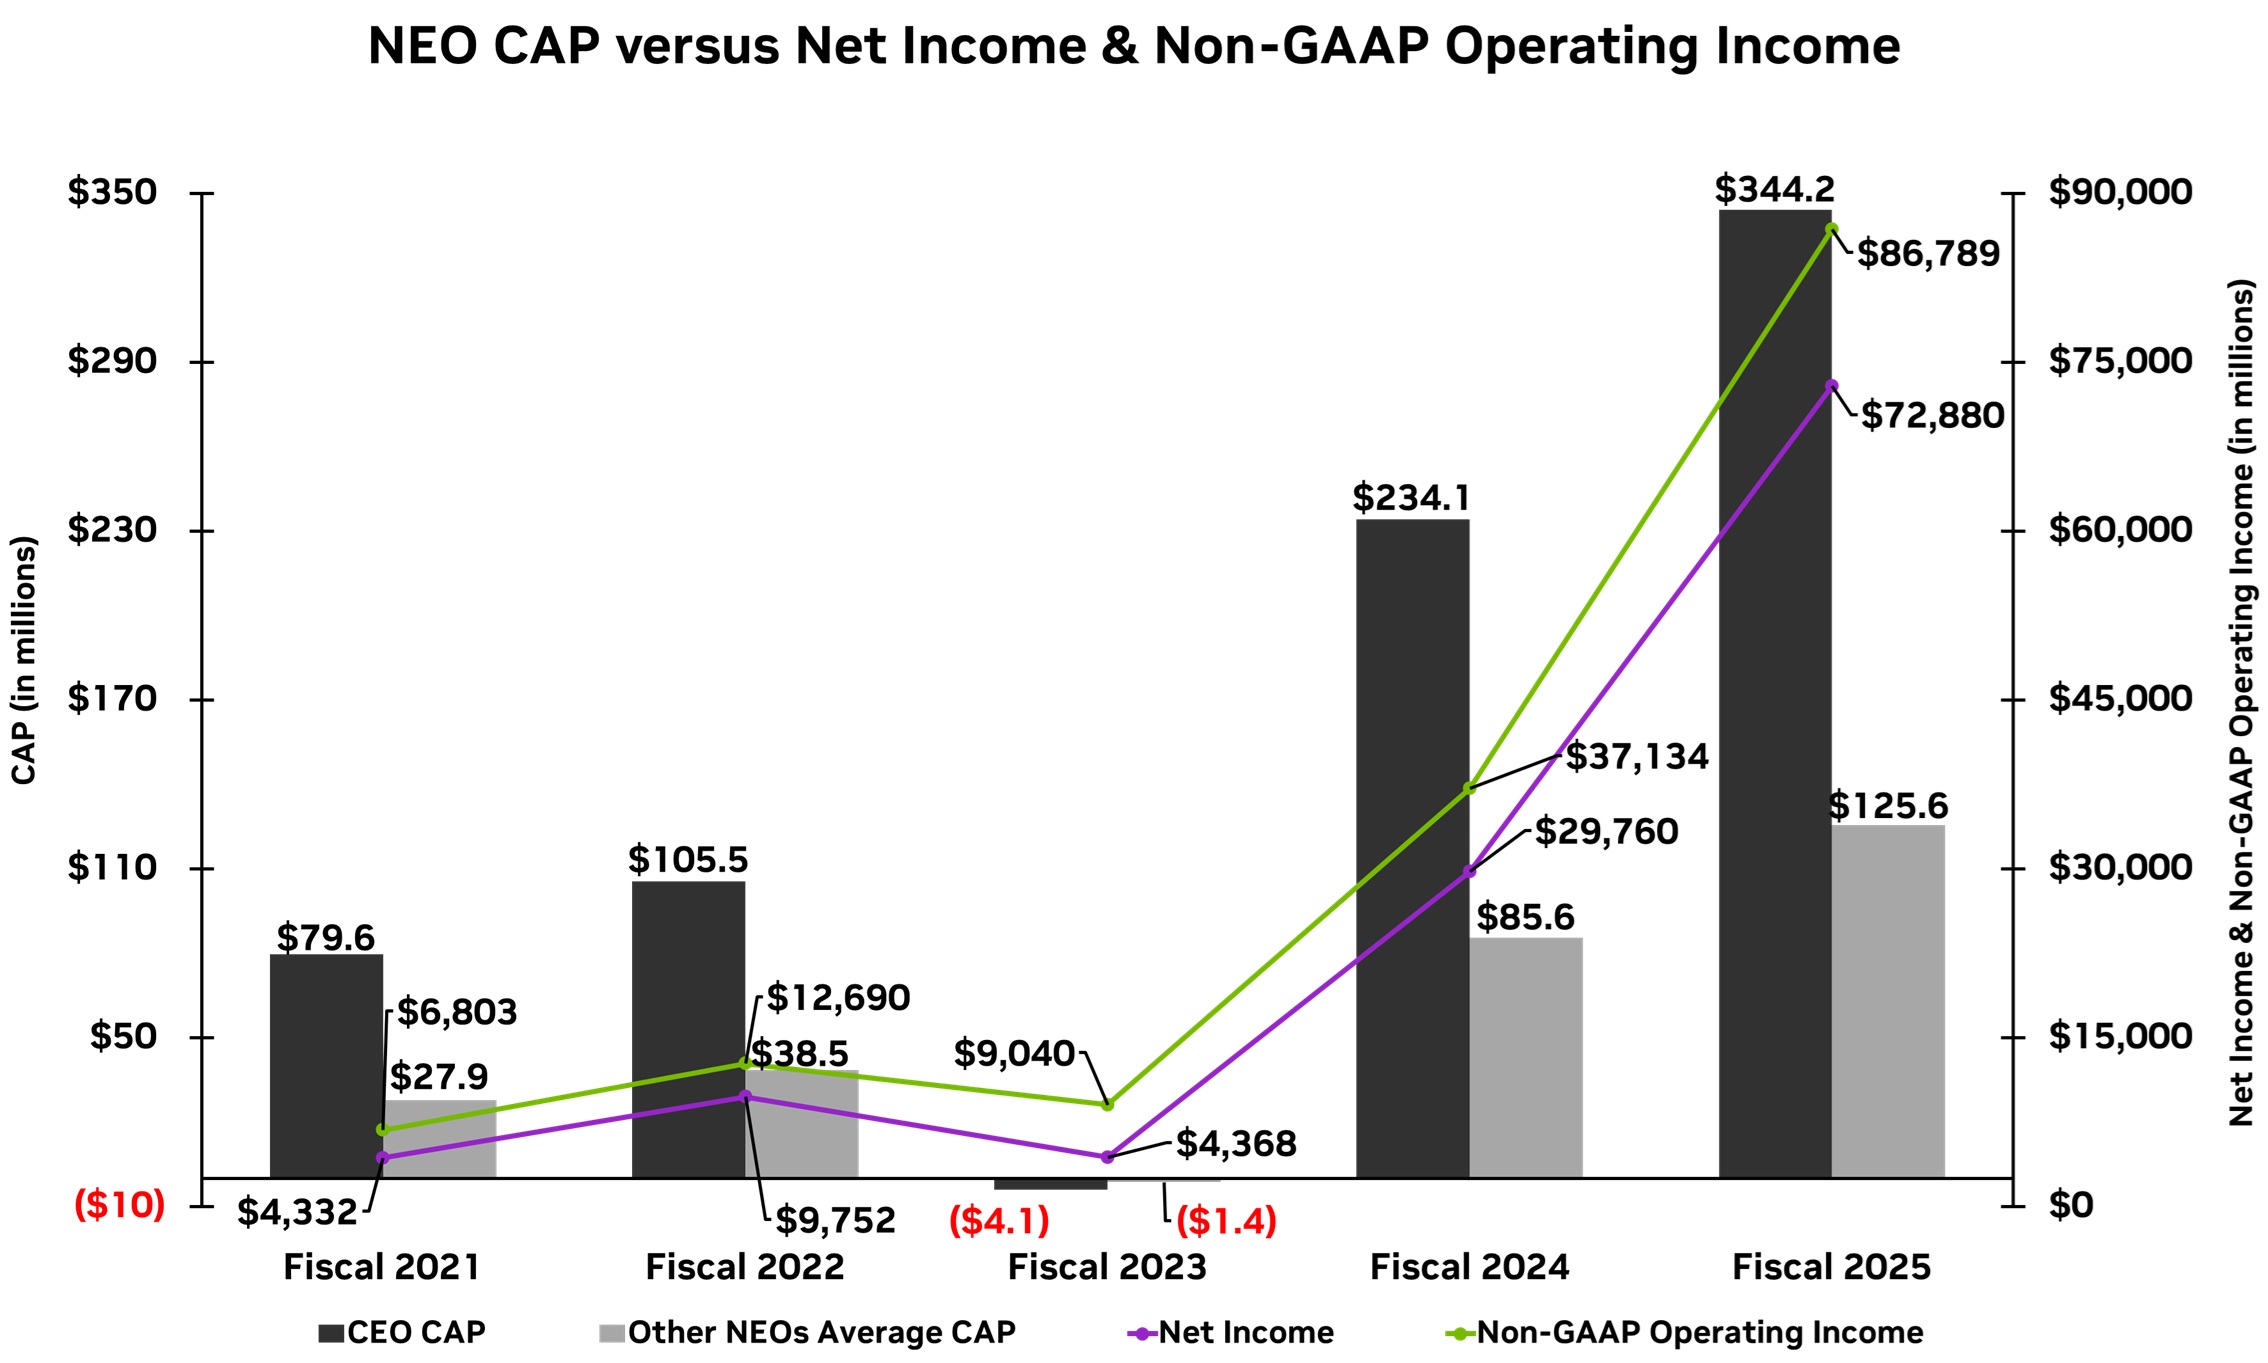
The following graphs illustrate how CAP for our NEOs aligns with the Company’s financial performance measures as detailed in the Pay Versus Performance table above for each of Fiscal 2021, 2022, 2023, 2024, and 2025, as well as between the TSRs of NVIDIA and the Nasdaq100 Index, reflecting the value of a fixed $100 investment beginning with the market close on January 24, 2020, the last trading day before our Fiscal 2021, through and including the end of the respective listed fiscal years.
Relationships Between CAP and Financial Performance
The following graphs illustrate how CAP for our NEOs aligns with the Company’s financial performance measures as detailed in the Pay Versus Performance table above for each of Fiscal 2021, 2022, 2023, 2024, and 2025, as well as between the TSRs of NVIDIA and the Nasdaq100 Index, reflecting the value of a fixed $100 investment beginning with the market close on January 24, 2020, the last trading day before our Fiscal 2021, through and including the end of the respective listed fiscal years.
Most Important Financial Performance Measures
The following table is an unranked list of the most important financial performance measures linking Fiscal 2025 NEO CAP to company performance:
| Financial Measures | ||
| Revenue | ||
| Non-GAAP Operating Income | ||
| 3-Year TSR relative to the S&P 500 | ||