Pay vs Performance Disclosure - USD ($)
Dec. 31, 2024
Dec. 31, 2023
Dec. 31, 2022
Dec. 31, 2021
Dec. 31, 2020
| Year | Summary Compensation Table Total for PEO Robert Lisy1 ($) | Compensation Actually Paid to PEO Robert Lisy1,2,3 ($) | Average Summary Compensation Table Total for Non-PEO Named Executive Officers1 ($) | Average Compensation Actually Paid to Non-PEO Named Executive Officers1,2,3 ($) | Value of initial fixed $100 investment based on4: | Net income (in millions) | Adjusted EBITDA ($)5 (in millions) | |||||||||||||||||||
| Total Shareholder Return ("TSR") ($) | Peer Group Total Shareholder Return ($) | |||||||||||||||||||||||||
| (a) | (b) | (c) | (d) | (e) | (f) | (g) | (h) | (i) | ||||||||||||||||||
| 2024 | $ | 6,042,098 | $ | 2,571,791 | $ | 1,222,554 | $ | 724,915 | $ | 173 | $ | 68 | $ | 58.8 | $ | 121.3 | ||||||||||
| 2023 | $ | 6,127,308 | $ | 4,372,216 | $ | 1,217,425 | $ | 877,054 | $ | 183 | $ | 66 | $ | 59.5 | $ | 120.0 | ||||||||||
| 2022 | $ | 5,842,214 | $ | 9,064,926 | $ | 1,229,430 | $ | 1,879,209 | $ | 202 | $ | 60 | $ | 57.3 | $ | 105.2 | ||||||||||
| 2021 | $ | 5,004,460 | $ | 5,776,170 | $ | 1,241,362 | $ | 1,382,164 | $ | 133 | $ | 76 | $ | 46.8 | $ | 86.7 | ||||||||||
| 2020 | $ | 1,305,197 | $ | 2,966,300 | $ | 718,034 | $ | 942,237 | $ | 129 | $ | 89 | $ | 33.8 | $ | 68.4 | ||||||||||
| 2020 | 2021 | 2022 | 2023 | 2024 | ||||||||||
| Tony Lauro II | Andras Bende | Andras Bende | Andras Bende | Andras Bende | ||||||||||
| Joseph Aguilar | Joseph Aguilar | Joseph Aguilar | Joseph Aguilar | Joseph Aguilar | ||||||||||
| Randall D. Nilsen | Randall D. Nilsen | Randall D. Nilsen | Christopher Hunt | Christopher Hunt | ||||||||||
| Ernesto Luciano | Randall D. Nilsen | Robert Pargac | ||||||||||||
| Ernesto Luciano | ||||||||||||||
| Year | Summary Compensation Table Total for Robert Lisy ($) | Exclusion of Stock Awards for Robert Lisy ($) | Inclusion of Equity Values for Robert Lisy ($) | Compensation Actually Paid to Robert Lisy ($) | ||||||||||
| 2024 | $ | 6,042,098 | $ | 4,200,000 | $ | 729,693 | $ | 2,571,791 | ||||||
| 2023 | $ | 6,127,308 | $ | 4,000,000 | $ | 2,244,908 | $ | 4,372,216 | ||||||
| 2022 | $ | 5,842,214 | $ | 3,000,000 | $ | 6,222,712 | $ | 9,064,926 | ||||||
| 2021 | $ | 5,004,460 | $ | 2,500,013 | $ | 3,271,723 | $ | 5,776,170 | ||||||
| 2020 | $ | 1,305,197 | $ | — | $ | 1,661,103 | $ | 2,966,300 | ||||||
| Year | Average Summary Compensation Table Total for Non-PEO Named Executive Officers ($) | Average Exclusion of Stock Awards for Non-PEO Named Executive Officers ($) | Average Inclusion of Equity Values for Non-PEO Named Executive Officers ($) | Average Compensation Actually Paid to Non-PEO Named Executive Officers ($) | ||||||||||
| 2024 | $ | 1,222,554 | $ | 650,000 | $ | 152,362 | $ | 724,915 | ||||||
| 2023 | $ | 1,217,425 | $ | 620,000 | $ | 279,629 | $ | 877,054 | ||||||
| 2022 | $ | 1,229,430 | $ | 525,000 | $ | 1,174,779 | $ | 1,879,209 | ||||||
| 2021 | $ | 1,241,362 | $ | 541,445 | $ | 682,247 | $ | 1,382,164 | ||||||
| 2020 | $ | 718,034 | $ | 237,868 | $ | 462,072 | $ | 942,237 | ||||||
The amounts in the Inclusion of Equity Values in the tables above are derived from the amounts set forth in the following tables:
| Year | Year-End Fair Value of Equity Awards Granted During Year That Remained Unvested as of Last Day of Year for Robert Lisy ($) | Change in Fair Value from Last Day of Prior Year to Last Day of Year of Unvested Equity Awards for Robert Lisy ($) | Change in Fair Value from Last Day of Prior Year to Vesting Date of Unvested Equity Awards that Vested During Year for Robert Lisy ($) | Fair Value at Last Day of Prior Year of Equity Awards Forfeited During Year for Robert Lisy ($) | Total - Inclusion of Equity Values for Robert Lisy ($) | ||||||||||||
| 2024 | $ | 2,056,567 | $ | (1,054,087) | $ | (272,787) | $ | — | $ | 729,693 | |||||||
| 2023 | $ | 2,613,002 | $ | (22,719) | $ | (345,376) | $ | — | $ | 2,244,908 | |||||||
| 2022 | $ | 3,980,352 | $ | 2,040,199 | $ | 202,162 | $ | — | $ | 6,222,712 | |||||||
| 2021 | $ | 4,223,734 | $ | (633,177) | $ | (318,834) | $ | — | $ | 3,271,723 | |||||||
| 2020 | $ | — | $ | 1,196,089 | $ | 465,014 | $ | — | $ | 1,661,103 | |||||||
| Year | Average Year-End Fair Value of Equity Awards Granted During Year That Remained Unvested as of Last Day of Year for Non-PEO Named Executive Officers ($) | Average Change in Fair Value from Last Day of Prior Year to Last Day of Year of Unvested Equity Awards for Non-PEO Named Executive Officers ($) | Average Change in Fair Value from Last Day of Prior Year to Vesting Date of Unvested Equity Awards that Vested During Year for Non-PEO Named Executive Officers ($) | Average Fair Value at Last Day of Prior Year of Equity Awards Forfeited During Year for Non-PEO Named Executive Officers ($) | Total - Average Inclusion of Equity Values for Non-PEO Named Executive Officers ($) | ||||||||||||
| 2024 | $ | 319,579 | $ | (133,063) | $ | (34,154) | $ | — | $ | 152,362 | |||||||
| 2023 | $ | 47,325 | $ | (4,751) | $ | (62,945) | $ | — | $ | 279,629 | |||||||
| 2022 | $ | 696,562 | $ | 445,526 | $ | 32,692 | $ | — | $ | 1,174,779 | |||||||
| 2021 | $ | 933,383 | $ | (189,066) | $ | (62,070) | $ | — | $ | 682,247 | |||||||
| 2020 | $ | 280,546 | $ | 216,787 | $ | 110,896 | $ | (146,157) | $ | 462,072 | |||||||
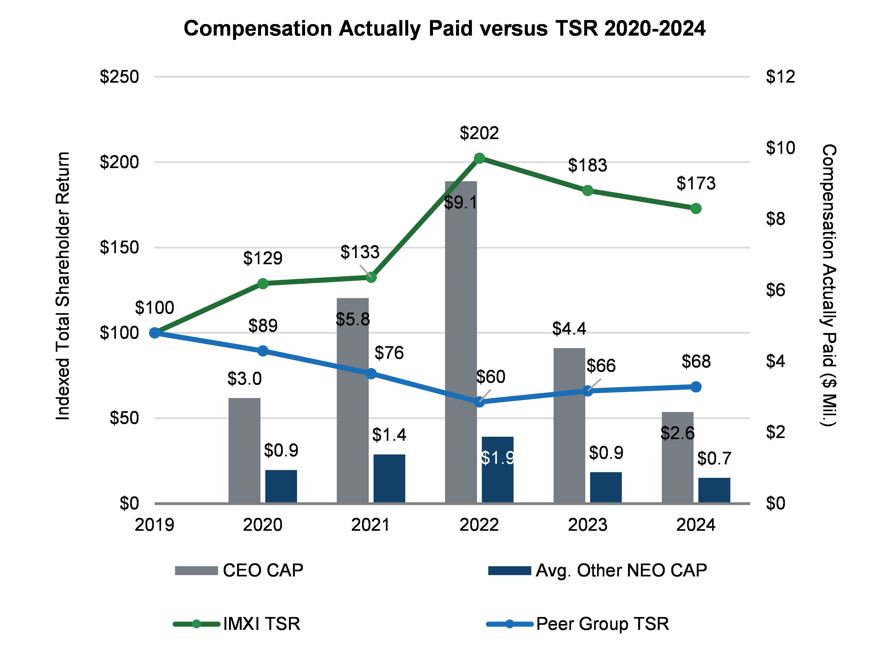
The following chart sets forth the relationship between Compensation Actually Paid to our PEO, the average of Compensation Actually Paid to our other named executive officers, and the Company’s cumulative TSR over the four most recently completed fiscal years. The chart also provides a comparison of the Company’s TSR and Peer Group TSR.
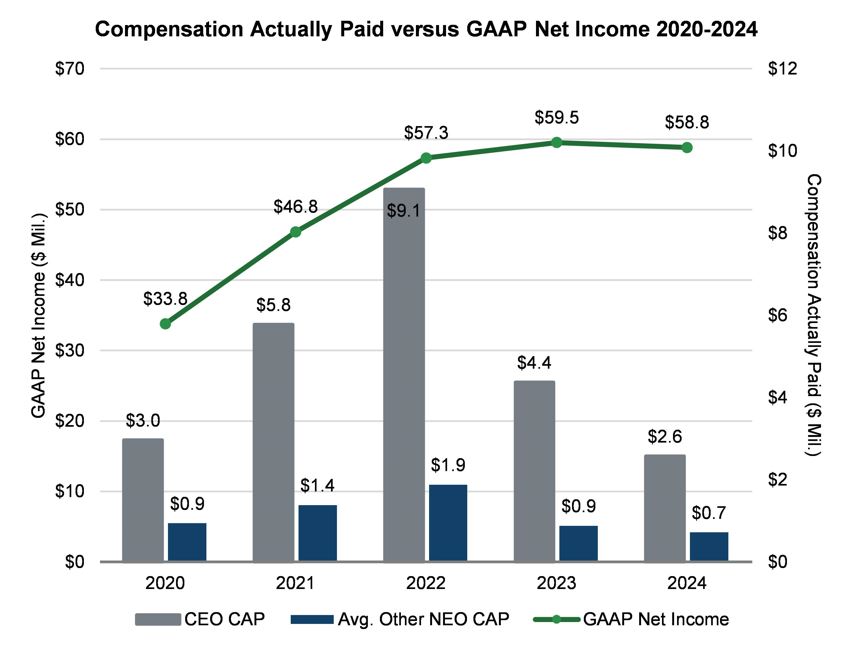
The following chart sets forth the relationship between Compensation Actually Paid to our PEO, the average of Compensation Actually Paid to the Non-PEO, and our Net Income during the four most recently completed fiscal years.
The following chart sets forth the relationship between Compensation Actually Paid to our PEO, the average of Compensation Actually Paid to the Non-PEOs, and Adjusted EBITDA over the four most recently completed fiscal years.