Shareholder Report
Mar. 31, 2025
USD ($)
Holding
What were the fund costs during the last year ?
(Based on a hypothetical $10,000 investment)
| Fund (Class) | Costs of a $10,000 investment | Costs paid as a percentage of a $10,000 investment |
| U.S. Growth Fund (Class A/JSGAX) |
$99 | 0.96% |
Management’s Discussion of Fund Performance
SUMMARY OF RESULTS
U.S. Growth Fund (Class A/JSGAX) returned 5.66% (excluding sales charges) for the year ended March 31, 2025. U.S. equities rose during the 12-month period, driven by high-growth, high-momentum artificial intelligence and technology stocks. Early in 2025, positive investor sentiment about domestic equities after the U.S. election reversed, reflecting concerns about the potential imposition of high tariffs, rising geopolitical tension, the potential for higher inflation, and reduced optimism about the prospects for stocks with business tied to AI.
TOP PERFORMANCE CONTRIBUTORS
Information technology | The information technology sector, a contributor to the fund’s absolute performance, was led by consumer electronics company Apple, Inc. and AI-chip developer NVIDIA Corp.
Communication services | In the communication services sector, which added to the fund’s absolute return, video-streaming service Netflix, Inc. was a standout, as the company added record new subscribers.
Financials | Within the financials sector, the fund’s top contributor on an absolute basis was Tradeweb Markets, Inc., a financial technology company.
TOP PERFORMANCE DETRACTORS
Health care | In the health care sector, ICON PLC, a clinical research organization, and managed-care company Molina Healthcare, Inc. meaningfully detracted in absolute terms.
Industrials | The industrials sector hampered results on an absolute basis, most notably due to the fund’s position in Builders FirstSource, Inc., a manufacturer and supplier of building materials.
Microsoft Corp. | Exposure to Microsoft Corp. weighed on the fund’s absolute performance, as the software maker’s shares fell sharply in late January on disappointing revenue.
The views expressed in this report are exclusively those of the portfolio management team at Wellington Management Company LLP, and are subject to change. They are not meant as investment advice.
Fund Performance
The following graph compares the initial and subsequent account values at the end of each of the most recently completed 10 fiscal years of the fund (or for the life of the fund, if shorter). It assumes a $10,000 initial investment in the fund and in an appropriate, broad-based securities market index for the same period.
GROWTH OF $10,000
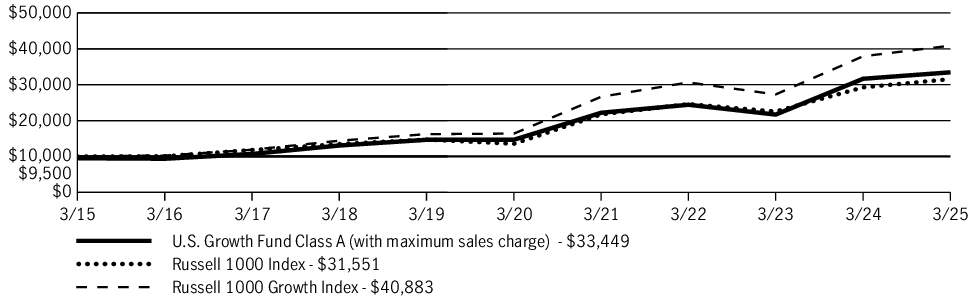
| AVERAGE ANNUAL TOTAL RETURN | 1 Year | 5 Years | 10 Years |
| U.S. Growth Fund (Class A/JSGAX) | 0.37% | 16.75% | 12.83% |
| U.S. Growth Fund (Class A/JSGAX)—excluding sales charge | 5.66% | 17.95% | 13.41% |
| Russell 1000 Index | 7.82% | 18.47% | 12.18% |
| Russell 1000 Growth Index | 7.76% | 20.09% | 15.12% |
Fund Statistics
| Fund net assets | $1,541,865,659 |
| Total number of portfolio holdings | 41 |
| Total advisory fees paid (net) | $8,424,334 |
| Portfolio turnover rate | 80% |
Graphical Representation of Holdings
The tables below show the investment makeup of the fund, representing a percentage of the total net assets of the fund.
Top Ten Holdings
| NVIDIA Corp. | 10.7% |
| Microsoft Corp. | 9.3% |
| Apple, Inc. | 8.3% |
| Amazon.com, Inc. | 8.1% |
| Alphabet, Inc., Class A | 6.2% |
| Mastercard, Inc., Class A | 3.7% |
| Broadcom, Inc. | 3.7% |
| Eli Lilly & Company | 3.6% |
| Meta Platforms, Inc., Class A | 3.6% |
| Netflix, Inc. | 2.5% |
Sector Composition
| Information technology | 38.3% |
| Communication services | 14.6% |
| Consumer discretionary | 14.5% |
| Financials | 11.6% |
| Health care | 8.9% |
| Consumer staples | 4.2% |
| Energy | 2.3% |
| Real estate | 2.0% |
| Industrials | 1.8% |
| Short-term investments and other | 1.8% |
Holdings may not have been held by the fund for the entire period and are subject to change without notice. Portfolio composition is subject to review in accordance with the fund’s investment strategy and may vary in the future. Current and future portfolio holdings are subject to risk and may change at any time.
Top Ten Holdings
| NVIDIA Corp. | 10.7% |
| Microsoft Corp. | 9.3% |
| Apple, Inc. | 8.3% |
| Amazon.com, Inc. | 8.1% |
| Alphabet, Inc., Class A | 6.2% |
| Mastercard, Inc., Class A | 3.7% |
| Broadcom, Inc. | 3.7% |
| Eli Lilly & Company | 3.6% |
| Meta Platforms, Inc., Class A | 3.6% |
| Netflix, Inc. | 2.5% |
What were the fund costs during the last year ?
(Based on a hypothetical $10,000 investment)
| Fund (Class) | Costs of a $10,000 investment | Costs paid as a percentage of a $10,000 investment |
| U.S. Growth Fund (Class C/JSGCX) |
$175 | 1.71% |
Management’s Discussion of Fund Performance
SUMMARY OF RESULTS
U.S. Growth Fund (Class C/JSGCX) returned 4.86% (excluding sales charges) for the year ended March 31, 2025. U.S. equities rose during the 12-month period, driven by high-growth, high-momentum artificial intelligence and technology stocks. Early in 2025, positive investor sentiment about domestic equities after the U.S. election reversed, reflecting concerns about the potential imposition of high tariffs, rising geopolitical tension, the potential for higher inflation, and reduced optimism about the prospects for stocks with business tied to AI.
TOP PERFORMANCE CONTRIBUTORS
Information technology | The information technology sector, a contributor to the fund’s absolute performance, was led by consumer electronics company Apple, Inc. and AI-chip developer NVIDIA Corp.
Communication services | In the communication services sector, which added to the fund’s absolute return, video-streaming service Netflix, Inc. was a standout, as the company added record new subscribers.
Financials | Within the financials sector, the fund’s top contributor on an absolute basis was Tradeweb Markets, Inc., a financial technology company.
TOP PERFORMANCE DETRACTORS
Health care | In the health care sector, ICON PLC, a clinical research organization, and managed-care company Molina Healthcare, Inc. meaningfully detracted in absolute terms.
Industrials | The industrials sector hampered results on an absolute basis, most notably due to the fund’s position in Builders FirstSource, Inc., a manufacturer and supplier of building materials.
Microsoft Corp. | Exposure to Microsoft Corp. weighed on the fund’s absolute performance, as the software maker’s shares fell sharply in late January on disappointing revenue.
The views expressed in this report are exclusively those of the portfolio management team at Wellington Management Company LLP, and are subject to change. They are not meant as investment advice.
Fund Performance
The following graph compares the initial and subsequent account values at the end of each of the most recently completed 10 fiscal years of the fund (or for the life of the fund, if shorter). It assumes a $10,000 initial investment in the fund and in an appropriate, broad-based securities market index for the same period.
GROWTH OF $10,000
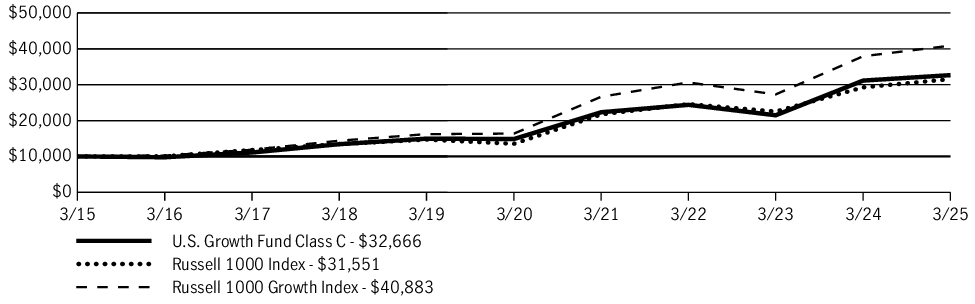
| AVERAGE ANNUAL TOTAL RETURN | 1 Year | 5 Years | 10 Years |
| U.S. Growth Fund (Class C/JSGCX) | 3.91% | 17.07% | 12.57% |
| U.S. Growth Fund (Class C/JSGCX)—excluding sales charge | 4.86% | 17.07% | 12.57% |
| Russell 1000 Index | 7.82% | 18.47% | 12.18% |
| Russell 1000 Growth Index | 7.76% | 20.09% | 15.12% |
Fund Statistics
| Fund net assets | $1,541,865,659 |
| Total number of portfolio holdings | 41 |
| Total advisory fees paid (net) | $8,424,334 |
| Portfolio turnover rate | 80% |
Graphical Representation of Holdings
The tables below show the investment makeup of the fund, representing a percentage of the total net assets of the fund.
Top Ten Holdings
| NVIDIA Corp. | 10.7% |
| Microsoft Corp. | 9.3% |
| Apple, Inc. | 8.3% |
| Amazon.com, Inc. | 8.1% |
| Alphabet, Inc., Class A | 6.2% |
| Mastercard, Inc., Class A | 3.7% |
| Broadcom, Inc. | 3.7% |
| Eli Lilly & Company | 3.6% |
| Meta Platforms, Inc., Class A | 3.6% |
| Netflix, Inc. | 2.5% |
Sector Composition
| Information technology | 38.3% |
| Communication services | 14.6% |
| Consumer discretionary | 14.5% |
| Financials | 11.6% |
| Health care | 8.9% |
| Consumer staples | 4.2% |
| Energy | 2.3% |
| Real estate | 2.0% |
| Industrials | 1.8% |
| Short-term investments and other | 1.8% |
Holdings may not have been held by the fund for the entire period and are subject to change without notice. Portfolio composition is subject to review in accordance with the fund’s investment strategy and may vary in the future. Current and future portfolio holdings are subject to risk and may change at any time.
Top Ten Holdings
| NVIDIA Corp. | 10.7% |
| Microsoft Corp. | 9.3% |
| Apple, Inc. | 8.3% |
| Amazon.com, Inc. | 8.1% |
| Alphabet, Inc., Class A | 6.2% |
| Mastercard, Inc., Class A | 3.7% |
| Broadcom, Inc. | 3.7% |
| Eli Lilly & Company | 3.6% |
| Meta Platforms, Inc., Class A | 3.6% |
| Netflix, Inc. | 2.5% |
What were the fund costs during the last year ?
(Based on a hypothetical $10,000 investment)
| Fund (Class) | Costs of a $10,000 investment | Costs paid as a percentage of a $10,000 investment |
| U.S. Growth Fund (Class I/JSGIX) |
$73 | 0.71% |
Management’s Discussion of Fund Performance
SUMMARY OF RESULTS
U.S. Growth Fund (Class I/JSGIX) returned 5.93% for the year ended March 31, 2025. U.S. equities rose during the 12-month period, driven by high-growth, high-momentum artificial intelligence and technology stocks. Early in 2025, positive investor sentiment about domestic equities after the U.S. election reversed, reflecting concerns about the potential imposition of high tariffs, rising geopolitical tension, the potential for higher inflation, and reduced optimism about the prospects for stocks with business tied to AI.
TOP PERFORMANCE CONTRIBUTORS
Information technology | The information technology sector, a contributor to the fund’s absolute performance, was led by consumer electronics company Apple, Inc. and AI-chip developer NVIDIA Corp.
Communication services | In the communication services sector, which added to the fund’s absolute return, video-streaming service Netflix, Inc. was a standout, as the company added record new subscribers.
Financials | Within the financials sector, the fund’s top contributor on an absolute basis was Tradeweb Markets, Inc., a financial technology company.
TOP PERFORMANCE DETRACTORS
Health care | In the health care sector, ICON PLC, a clinical research organization, and managed-care company Molina Healthcare, Inc. meaningfully detracted in absolute terms.
Industrials | The industrials sector hampered results on an absolute basis, most notably due to the fund’s position in Builders FirstSource, Inc., a manufacturer and supplier of building materials.
Microsoft Corp. | Exposure to Microsoft Corp. weighed on the fund’s absolute performance, as the software maker’s shares fell sharply in late January on disappointing revenue.
The views expressed in this report are exclusively those of the portfolio management team at Wellington Management Company LLP, and are subject to change. They are not meant as investment advice.
Fund Performance
The following graph compares the initial and subsequent account values at the end of each of the most recently completed 10 fiscal years of the fund (or for the life of the fund, if shorter). It assumes a $250,000 initial investment in the fund and in an appropriate, broad-based securities market index for the same period.
GROWTH OF $250,000
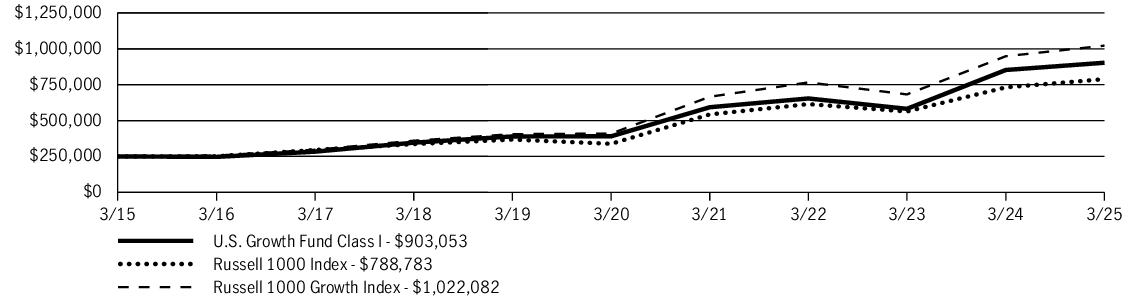
| AVERAGE ANNUAL TOTAL RETURN | 1 Year | 5 Years | 10 Years |
| U.S. Growth Fund (Class I/JSGIX) | 5.93% | 18.25% | 13.70% |
| Russell 1000 Index | 7.82% | 18.47% | 12.18% |
| Russell 1000 Growth Index | 7.76% | 20.09% | 15.12% |
Fund Statistics
| Fund net assets | $1,541,865,659 |
| Total number of portfolio holdings | 41 |
| Total advisory fees paid (net) | $8,424,334 |
| Portfolio turnover rate | 80% |
Graphical Representation of Holdings
The tables below show the investment makeup of the fund, representing a percentage of the total net assets of the fund.
Top Ten Holdings
| NVIDIA Corp. | 10.7% |
| Microsoft Corp. | 9.3% |
| Apple, Inc. | 8.3% |
| Amazon.com, Inc. | 8.1% |
| Alphabet, Inc., Class A | 6.2% |
| Mastercard, Inc., Class A | 3.7% |
| Broadcom, Inc. | 3.7% |
| Eli Lilly & Company | 3.6% |
| Meta Platforms, Inc., Class A | 3.6% |
| Netflix, Inc. | 2.5% |
Sector Composition
| Information technology | 38.3% |
| Communication services | 14.6% |
| Consumer discretionary | 14.5% |
| Financials | 11.6% |
| Health care | 8.9% |
| Consumer staples | 4.2% |
| Energy | 2.3% |
| Real estate | 2.0% |
| Industrials | 1.8% |
| Short-term investments and other | 1.8% |
Holdings may not have been held by the fund for the entire period and are subject to change without notice. Portfolio composition is subject to review in accordance with the fund’s investment strategy and may vary in the future. Current and future portfolio holdings are subject to risk and may change at any time.
Top Ten Holdings
| NVIDIA Corp. | 10.7% |
| Microsoft Corp. | 9.3% |
| Apple, Inc. | 8.3% |
| Amazon.com, Inc. | 8.1% |
| Alphabet, Inc., Class A | 6.2% |
| Mastercard, Inc., Class A | 3.7% |
| Broadcom, Inc. | 3.7% |
| Eli Lilly & Company | 3.6% |
| Meta Platforms, Inc., Class A | 3.6% |
| Netflix, Inc. | 2.5% |
What were the fund costs during the last year ?
(Based on a hypothetical $10,000 investment)
| Fund (Class) | Costs of a $10,000 investment | Costs paid as a percentage of a $10,000 investment |
| U.S. Growth Fund (Class NAV) |
$62 | 0.60% |
Management’s Discussion of Fund Performance
SUMMARY OF RESULTS
U.S. Growth Fund (Class NAV) returned 6.04% for the year ended March 31, 2025. U.S. equities rose during the 12-month period, driven by high-growth, high-momentum artificial intelligence and technology stocks. Early in 2025, positive investor sentiment about domestic equities after the U.S. election reversed, reflecting concerns about the potential imposition of high tariffs, rising geopolitical tension, the potential for higher inflation, and reduced optimism about the prospects for stocks with business tied to AI.
TOP PERFORMANCE CONTRIBUTORS
Information technology | The information technology sector, a contributor to the fund’s absolute performance, was led by consumer electronics company Apple, Inc. and AI-chip developer NVIDIA Corp.
Communication services | In the communication services sector, which added to the fund’s absolute return, video-streaming service Netflix, Inc. was a standout, as the company added record new subscribers.
Financials | Within the financials sector, the fund’s top contributor on an absolute basis was Tradeweb Markets, Inc., a financial technology company.
TOP PERFORMANCE DETRACTORS
Health care | In the health care sector, ICON PLC, a clinical research organization, and managed-care company Molina Healthcare, Inc. meaningfully detracted in absolute terms.
Industrials | The industrials sector hampered results on an absolute basis, most notably due to the fund’s position in Builders FirstSource, Inc., a manufacturer and supplier of building materials.
Microsoft Corp. | Exposure to Microsoft Corp. weighed on the fund’s absolute performance, as the software maker’s shares fell sharply in late January on disappointing revenue.
The views expressed in this report are exclusively those of the portfolio management team at Wellington Management Company LLP, and are subject to change. They are not meant as investment advice.
Fund Performance
The following graph compares the initial and subsequent account values at the end of each of the most recently completed 10 fiscal years of the fund (or for the life of the fund, if shorter). It assumes a $10,000 initial investment in the fund and in an appropriate, broad-based securities market index for the same period.
GROWTH OF $10,000
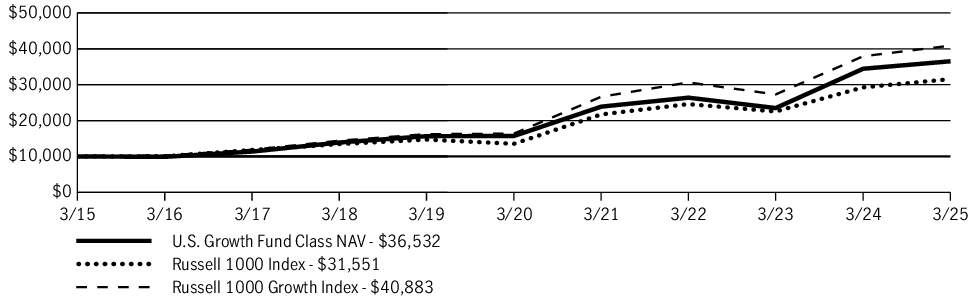
| AVERAGE ANNUAL TOTAL RETURN | 1 Year | 5 Years | 10 Years |
| U.S. Growth Fund (Class NAV) | 6.04% | 18.38% | 13.83% |
| Russell 1000 Index | 7.82% | 18.47% | 12.18% |
| Russell 1000 Growth Index | 7.76% | 20.09% | 15.12% |
Fund Statistics
| Fund net assets | $1,541,865,659 |
| Total number of portfolio holdings | 41 |
| Total advisory fees paid (net) | $8,424,334 |
| Portfolio turnover rate | 80% |
Graphical Representation of Holdings
The tables below show the investment makeup of the fund, representing a percentage of the total net assets of the fund.
Top Ten Holdings
| NVIDIA Corp. | 10.7% |
| Microsoft Corp. | 9.3% |
| Apple, Inc. | 8.3% |
| Amazon.com, Inc. | 8.1% |
| Alphabet, Inc., Class A | 6.2% |
| Mastercard, Inc., Class A | 3.7% |
| Broadcom, Inc. | 3.7% |
| Eli Lilly & Company | 3.6% |
| Meta Platforms, Inc., Class A | 3.6% |
| Netflix, Inc. | 2.5% |
Sector Composition
| Information technology | 38.3% |
| Communication services | 14.6% |
| Consumer discretionary | 14.5% |
| Financials | 11.6% |
| Health care | 8.9% |
| Consumer staples | 4.2% |
| Energy | 2.3% |
| Real estate | 2.0% |
| Industrials | 1.8% |
| Short-term investments and other | 1.8% |
Holdings may not have been held by the fund for the entire period and are subject to change without notice. Portfolio composition is subject to review in accordance with the fund’s investment strategy and may vary in the future. Current and future portfolio holdings are subject to risk and may change at any time.
Top Ten Holdings
| NVIDIA Corp. | 10.7% |
| Microsoft Corp. | 9.3% |
| Apple, Inc. | 8.3% |
| Amazon.com, Inc. | 8.1% |
| Alphabet, Inc., Class A | 6.2% |
| Mastercard, Inc., Class A | 3.7% |
| Broadcom, Inc. | 3.7% |
| Eli Lilly & Company | 3.6% |
| Meta Platforms, Inc., Class A | 3.6% |
| Netflix, Inc. | 2.5% |
What were the fund costs during the last year ?
(Based on a hypothetical $10,000 investment)
| Fund (Class) | Costs of a $10,000 investment | Costs paid as a percentage of a $10,000 investment |
| U.S. Growth Fund (Class R2/JSGRX) |
$113 | 1.10% |
Management’s Discussion of Fund Performance
SUMMARY OF RESULTS
U.S. Growth Fund (Class R2/JSGRX) returned 5.50% for the year ended March 31, 2025. U.S. equities rose during the 12-month period, driven by high-growth, high-momentum artificial intelligence and technology stocks. Early in 2025, positive investor sentiment about domestic equities after the U.S. election reversed, reflecting concerns about the potential imposition of high tariffs, rising geopolitical tension, the potential for higher inflation, and reduced optimism about the prospects for stocks with business tied to AI.
TOP PERFORMANCE CONTRIBUTORS
Information technology | The information technology sector, a contributor to the fund’s absolute performance, was led by consumer electronics company Apple, Inc. and AI-chip developer NVIDIA Corp.
Communication services | In the communication services sector, which added to the fund’s absolute return, video-streaming service Netflix, Inc. was a standout, as the company added record new subscribers.
Financials | Within the financials sector, the fund’s top contributor on an absolute basis was Tradeweb Markets, Inc., a financial technology company.
TOP PERFORMANCE DETRACTORS
Health care | In the health care sector, ICON PLC, a clinical research organization, and managed-care company Molina Healthcare, Inc. meaningfully detracted in absolute terms.
Industrials | The industrials sector hampered results on an absolute basis, most notably due to the fund’s position in Builders FirstSource, Inc., a manufacturer and supplier of building materials.
Microsoft Corp. | Exposure to Microsoft Corp. weighed on the fund’s absolute performance, as the software maker’s shares fell sharply in late January on disappointing revenue.
The views expressed in this report are exclusively those of the portfolio management team at Wellington Management Company LLP, and are subject to change. They are not meant as investment advice.
Fund Performance
The following graph compares the initial and subsequent account values at the end of each of the most recently completed 10 fiscal years of the fund (or for the life of the fund, if shorter). It assumes a $10,000 initial investment in the fund and in an appropriate, broad-based securities market index for the same period.
GROWTH OF $10,000
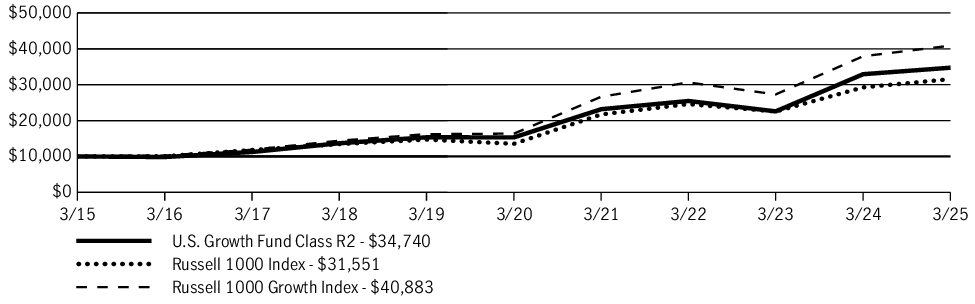
| AVERAGE ANNUAL TOTAL RETURN | 1 Year | 5 Years | 10 Years |
| U.S. Growth Fund (Class R2/JSGRX) | 5.50% | 17.79% | 13.26% |
| Russell 1000 Index | 7.82% | 18.47% | 12.18% |
| Russell 1000 Growth Index | 7.76% | 20.09% | 15.12% |
Fund Statistics
| Fund net assets | $1,541,865,659 |
| Total number of portfolio holdings | 41 |
| Total advisory fees paid (net) | $8,424,334 |
| Portfolio turnover rate | 80% |
Graphical Representation of Holdings
The tables below show the investment makeup of the fund, representing a percentage of the total net assets of the fund.
Top Ten Holdings
| NVIDIA Corp. | 10.7% |
| Microsoft Corp. | 9.3% |
| Apple, Inc. | 8.3% |
| Amazon.com, Inc. | 8.1% |
| Alphabet, Inc., Class A | 6.2% |
| Mastercard, Inc., Class A | 3.7% |
| Broadcom, Inc. | 3.7% |
| Eli Lilly & Company | 3.6% |
| Meta Platforms, Inc., Class A | 3.6% |
| Netflix, Inc. | 2.5% |
Sector Composition
| Information technology | 38.3% |
| Communication services | 14.6% |
| Consumer discretionary | 14.5% |
| Financials | 11.6% |
| Health care | 8.9% |
| Consumer staples | 4.2% |
| Energy | 2.3% |
| Real estate | 2.0% |
| Industrials | 1.8% |
| Short-term investments and other | 1.8% |
Holdings may not have been held by the fund for the entire period and are subject to change without notice. Portfolio composition is subject to review in accordance with the fund’s investment strategy and may vary in the future. Current and future portfolio holdings are subject to risk and may change at any time.
Top Ten Holdings
| NVIDIA Corp. | 10.7% |
| Microsoft Corp. | 9.3% |
| Apple, Inc. | 8.3% |
| Amazon.com, Inc. | 8.1% |
| Alphabet, Inc., Class A | 6.2% |
| Mastercard, Inc., Class A | 3.7% |
| Broadcom, Inc. | 3.7% |
| Eli Lilly & Company | 3.6% |
| Meta Platforms, Inc., Class A | 3.6% |
| Netflix, Inc. | 2.5% |
What were the fund costs during the last year ?
(Based on a hypothetical $10,000 investment)
| Fund (Class) | Costs of a $10,000 investment | Costs paid as a percentage of a $10,000 investment |
| U.S. Growth Fund (Class R4/JHSGX) |
$87 | 0.85% |
Management’s Discussion of Fund Performance
SUMMARY OF RESULTS
U.S. Growth Fund (Class R4/JHSGX) returned 5.77% for the year ended March 31, 2025. U.S. equities rose during the 12-month period, driven by high-growth, high-momentum artificial intelligence and technology stocks. Early in 2025, positive investor sentiment about domestic equities after the U.S. election reversed, reflecting concerns about the potential imposition of high tariffs, rising geopolitical tension, the potential for higher inflation, and reduced optimism about the prospects for stocks with business tied to AI.
TOP PERFORMANCE CONTRIBUTORS
Information technology | The information technology sector, a contributor to the fund’s absolute performance, was led by consumer electronics company Apple, Inc. and AI-chip developer NVIDIA Corp.
Communication services | In the communication services sector, which added to the fund’s absolute return, video-streaming service Netflix, Inc. was a standout, as the company added record new subscribers.
Financials | Within the financials sector, the fund’s top contributor on an absolute basis was Tradeweb Markets, Inc., a financial technology company.
TOP PERFORMANCE DETRACTORS
Health care | In the health care sector, ICON PLC, a clinical research organization, and managed-care company Molina Healthcare, Inc. meaningfully detracted in absolute terms.
Industrials | The industrials sector hampered results on an absolute basis, most notably due to the fund’s position in Builders FirstSource, Inc., a manufacturer and supplier of building materials.
Microsoft Corp. | Exposure to Microsoft Corp. weighed on the fund’s absolute performance, as the software maker’s shares fell sharply in late January on disappointing revenue.
The views expressed in this report are exclusively those of the portfolio management team at Wellington Management Company LLP, and are subject to change. They are not meant as investment advice.
Fund Performance
The following graph compares the initial and subsequent account values at the end of each of the most recently completed 10 fiscal years of the fund (or for the life of the fund, if shorter). It assumes a $10,000 initial investment in the fund and in an appropriate, broad-based securities market index for the same period.
GROWTH OF $10,000

| AVERAGE ANNUAL TOTAL RETURN | 1 Year | 5 Years | 10 Years |
| U.S. Growth Fund (Class R4/JHSGX) | 5.77% | 18.13% | 13.56% |
| Russell 1000 Index | 7.82% | 18.47% | 12.18% |
| Russell 1000 Growth Index | 7.76% | 20.09% | 15.12% |
Fund Statistics
| Fund net assets | $1,541,865,659 |
| Total number of portfolio holdings | 41 |
| Total advisory fees paid (net) | $8,424,334 |
| Portfolio turnover rate | 80% |
Graphical Representation of Holdings
The tables below show the investment makeup of the fund, representing a percentage of the total net assets of the fund.
Top Ten Holdings
| NVIDIA Corp. | 10.7% |
| Microsoft Corp. | 9.3% |
| Apple, Inc. | 8.3% |
| Amazon.com, Inc. | 8.1% |
| Alphabet, Inc., Class A | 6.2% |
| Mastercard, Inc., Class A | 3.7% |
| Broadcom, Inc. | 3.7% |
| Eli Lilly & Company | 3.6% |
| Meta Platforms, Inc., Class A | 3.6% |
| Netflix, Inc. | 2.5% |
Sector Composition
| Information technology | 38.3% |
| Communication services | 14.6% |
| Consumer discretionary | 14.5% |
| Financials | 11.6% |
| Health care | 8.9% |
| Consumer staples | 4.2% |
| Energy | 2.3% |
| Real estate | 2.0% |
| Industrials | 1.8% |
| Short-term investments and other | 1.8% |
Holdings may not have been held by the fund for the entire period and are subject to change without notice. Portfolio composition is subject to review in accordance with the fund’s investment strategy and may vary in the future. Current and future portfolio holdings are subject to risk and may change at any time.
Top Ten Holdings
| NVIDIA Corp. | 10.7% |
| Microsoft Corp. | 9.3% |
| Apple, Inc. | 8.3% |
| Amazon.com, Inc. | 8.1% |
| Alphabet, Inc., Class A | 6.2% |
| Mastercard, Inc., Class A | 3.7% |
| Broadcom, Inc. | 3.7% |
| Eli Lilly & Company | 3.6% |
| Meta Platforms, Inc., Class A | 3.6% |
| Netflix, Inc. | 2.5% |
What were the fund costs during the last year ?
(Based on a hypothetical $10,000 investment)
| Fund (Class) | Costs of a $10,000 investment | Costs paid as a percentage of a $10,000 investment |
| U.S. Growth Fund (Class R6/JSGTX) |
$62 | 0.60% |
Management’s Discussion of Fund Performance
SUMMARY OF RESULTS
U.S. Growth Fund (Class R6/JSGTX) returned 6.04% for the year ended March 31, 2025. U.S. equities rose during the 12-month period, driven by high-growth, high-momentum artificial intelligence and technology stocks. Early in 2025, positive investor sentiment about domestic equities after the U.S. election reversed, reflecting concerns about the potential imposition of high tariffs, rising geopolitical tension, the potential for higher inflation, and reduced optimism about the prospects for stocks with business tied to AI.
TOP PERFORMANCE CONTRIBUTORS
Information technology | The information technology sector, a contributor to the fund’s absolute performance, was led by consumer electronics company Apple, Inc. and AI-chip developer NVIDIA Corp.
Communication services | In the communication services sector, which added to the fund’s absolute return, video-streaming service Netflix, Inc. was a standout, as the company added record new subscribers.
Financials | Within the financials sector, the fund’s top contributor on an absolute basis was Tradeweb Markets, Inc., a financial technology company.
TOP PERFORMANCE DETRACTORS
Health care | In the health care sector, ICON PLC, a clinical research organization, and managed-care company Molina Healthcare, Inc. meaningfully detracted in absolute terms.
Industrials | The industrials sector hampered results on an absolute basis, most notably due to the fund’s position in Builders FirstSource, Inc., a manufacturer and supplier of building materials.
Microsoft Corp. | Exposure to Microsoft Corp. weighed on the fund’s absolute performance, as the software maker’s shares fell sharply in late January on disappointing revenue.
The views expressed in this report are exclusively those of the portfolio management team at Wellington Management Company LLP, and are subject to change. They are not meant as investment advice.
Fund Performance
The following graph compares the initial and subsequent account values at the end of each of the most recently completed 10 fiscal years of the fund (or for the life of the fund, if shorter). It assumes a $1,000,000 initial investment in the fund and in an appropriate, broad-based securities market index for the same period.
GROWTH OF $1,000,000
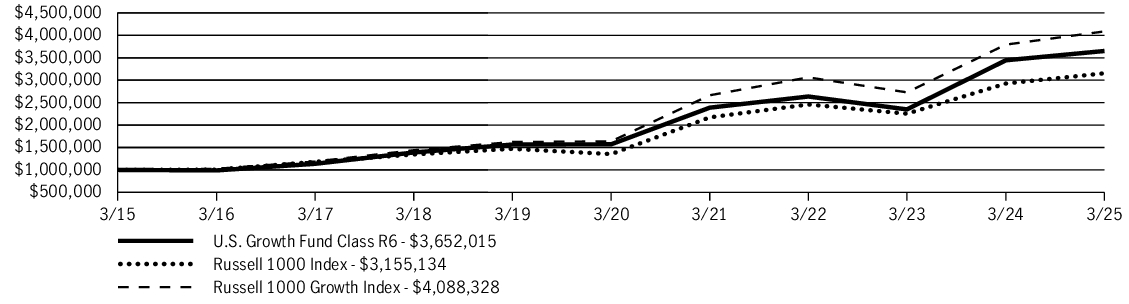
| AVERAGE ANNUAL TOTAL RETURN | 1 Year | 5 Years | 10 Years |
| U.S. Growth Fund (Class R6/JSGTX) | 6.04% | 18.37% | 13.83% |
| Russell 1000 Index | 7.82% | 18.47% | 12.18% |
| Russell 1000 Growth Index | 7.76% | 20.09% | 15.12% |
Fund Statistics
| Fund net assets | $1,541,865,659 |
| Total number of portfolio holdings | 41 |
| Total advisory fees paid (net) | $8,424,334 |
| Portfolio turnover rate | 80% |
Graphical Representation of Holdings
The tables below show the investment makeup of the fund, representing a percentage of the total net assets of the fund.
Top Ten Holdings
| NVIDIA Corp. | 10.7% |
| Microsoft Corp. | 9.3% |
| Apple, Inc. | 8.3% |
| Amazon.com, Inc. | 8.1% |
| Alphabet, Inc., Class A | 6.2% |
| Mastercard, Inc., Class A | 3.7% |
| Broadcom, Inc. | 3.7% |
| Eli Lilly & Company | 3.6% |
| Meta Platforms, Inc., Class A | 3.6% |
| Netflix, Inc. | 2.5% |
Sector Composition
| Information technology | 38.3% |
| Communication services | 14.6% |
| Consumer discretionary | 14.5% |
| Financials | 11.6% |
| Health care | 8.9% |
| Consumer staples | 4.2% |
| Energy | 2.3% |
| Real estate | 2.0% |
| Industrials | 1.8% |
| Short-term investments and other | 1.8% |
Holdings may not have been held by the fund for the entire period and are subject to change without notice. Portfolio composition is subject to review in accordance with the fund’s investment strategy and may vary in the future. Current and future portfolio holdings are subject to risk and may change at any time.
Top Ten Holdings
| NVIDIA Corp. | 10.7% |
| Microsoft Corp. | 9.3% |
| Apple, Inc. | 8.3% |
| Amazon.com, Inc. | 8.1% |
| Alphabet, Inc., Class A | 6.2% |
| Mastercard, Inc., Class A | 3.7% |
| Broadcom, Inc. | 3.7% |
| Eli Lilly & Company | 3.6% |
| Meta Platforms, Inc., Class A | 3.6% |
| Netflix, Inc. | 2.5% |