

Q3 FY2025 Financial Results Conference Call May 9, 2025 Nasdaq: STRT Jennifer Slater President and CEO Matthew Pauli Senior Vice President and CFO www.strattec.com
Safe Harbor Statement Safe Harbor Statement Certain statements contained in this presentation contain “forward-looking statements” within the meaning of the Private Securities Litigation Reform Act of 1995. These statements may be identified by the use of forward-looking words or phrases such as “anticipate,” “believe,” “could,” “expect,” “intend,” “may,” “planned,” “potential,” “should,” “will,” and “would.” Such forward-looking statements are inherently subject to many uncertainties in the Company’s operations and business environment. These uncertainties include general economic conditions, in particular, relating to the automotive industry, consumer demand for the Company’s and its customers’ products, competitive and technological developments, customer purchasing actions, changes in warranty provisions and customer product recall policies, work stoppages at the Company or at the location of its key customers as a result of labor disputes, foreign currency fluctuations, the impact of U.S. trade policies, tariffs and reactions to the same from foreign countries on costs and customer demand, matters adversely impacting the timing and availability of component parts and raw materials needed for the production of our products and the products of our customers and fluctuations in our costs of operation. Shareholders, potential investors and other readers are urged to consider these factors carefully in evaluating the forward-looking statements and are cautioned not to place undue reliance on such forward-looking statements. The forward-looking statements made herein are only made as of the date of this press presentation and the Company undertakes no obligation to publicly update such forward-looking statements to reflect subsequent events or circumstances occurring after the date of this presentation. In addition, such uncertainties and other operational matters are discussed further in the Company’s quarterly and annual filings with the Securities and Exchange Commission. Use of Non-GAAP Financial Metrics and Additional Financial Information In addition to reporting financial results in accordance with generally accepted accounting principles, or GAAP, STRATTEC provides Adjusted Non-GAAP information as additional information for its operating results. References to Adjusted Non-GAAP information are to non-GAAP financial measures. These measures are not required by, in accordance with, or an alternative for, GAAP and may be different from similarly titled non-GAAP financial measures used by other companies. STRATTEC’s management uses these measures to make strategic decisions, establish budget plans and forecasts, identify trends affecting STRATTEC’s business, and evaluate performance. Management believes that providing these non-GAAP financial measures to investors, as a supplement to GAAP financial measures, will help investors evaluate STRATTEC’s core operating and financial performance and business trends consistent with how management evaluates such performance and trends. Investors are encouraged to review the related GAAP financial measures and the reconciliation of these non-GAAP financial measures to their most directly comparable GAAP financial measures. The Company has provided reconciliations of comparable GAAP to non-GAAP measures in the supplemental slides of this presentation.
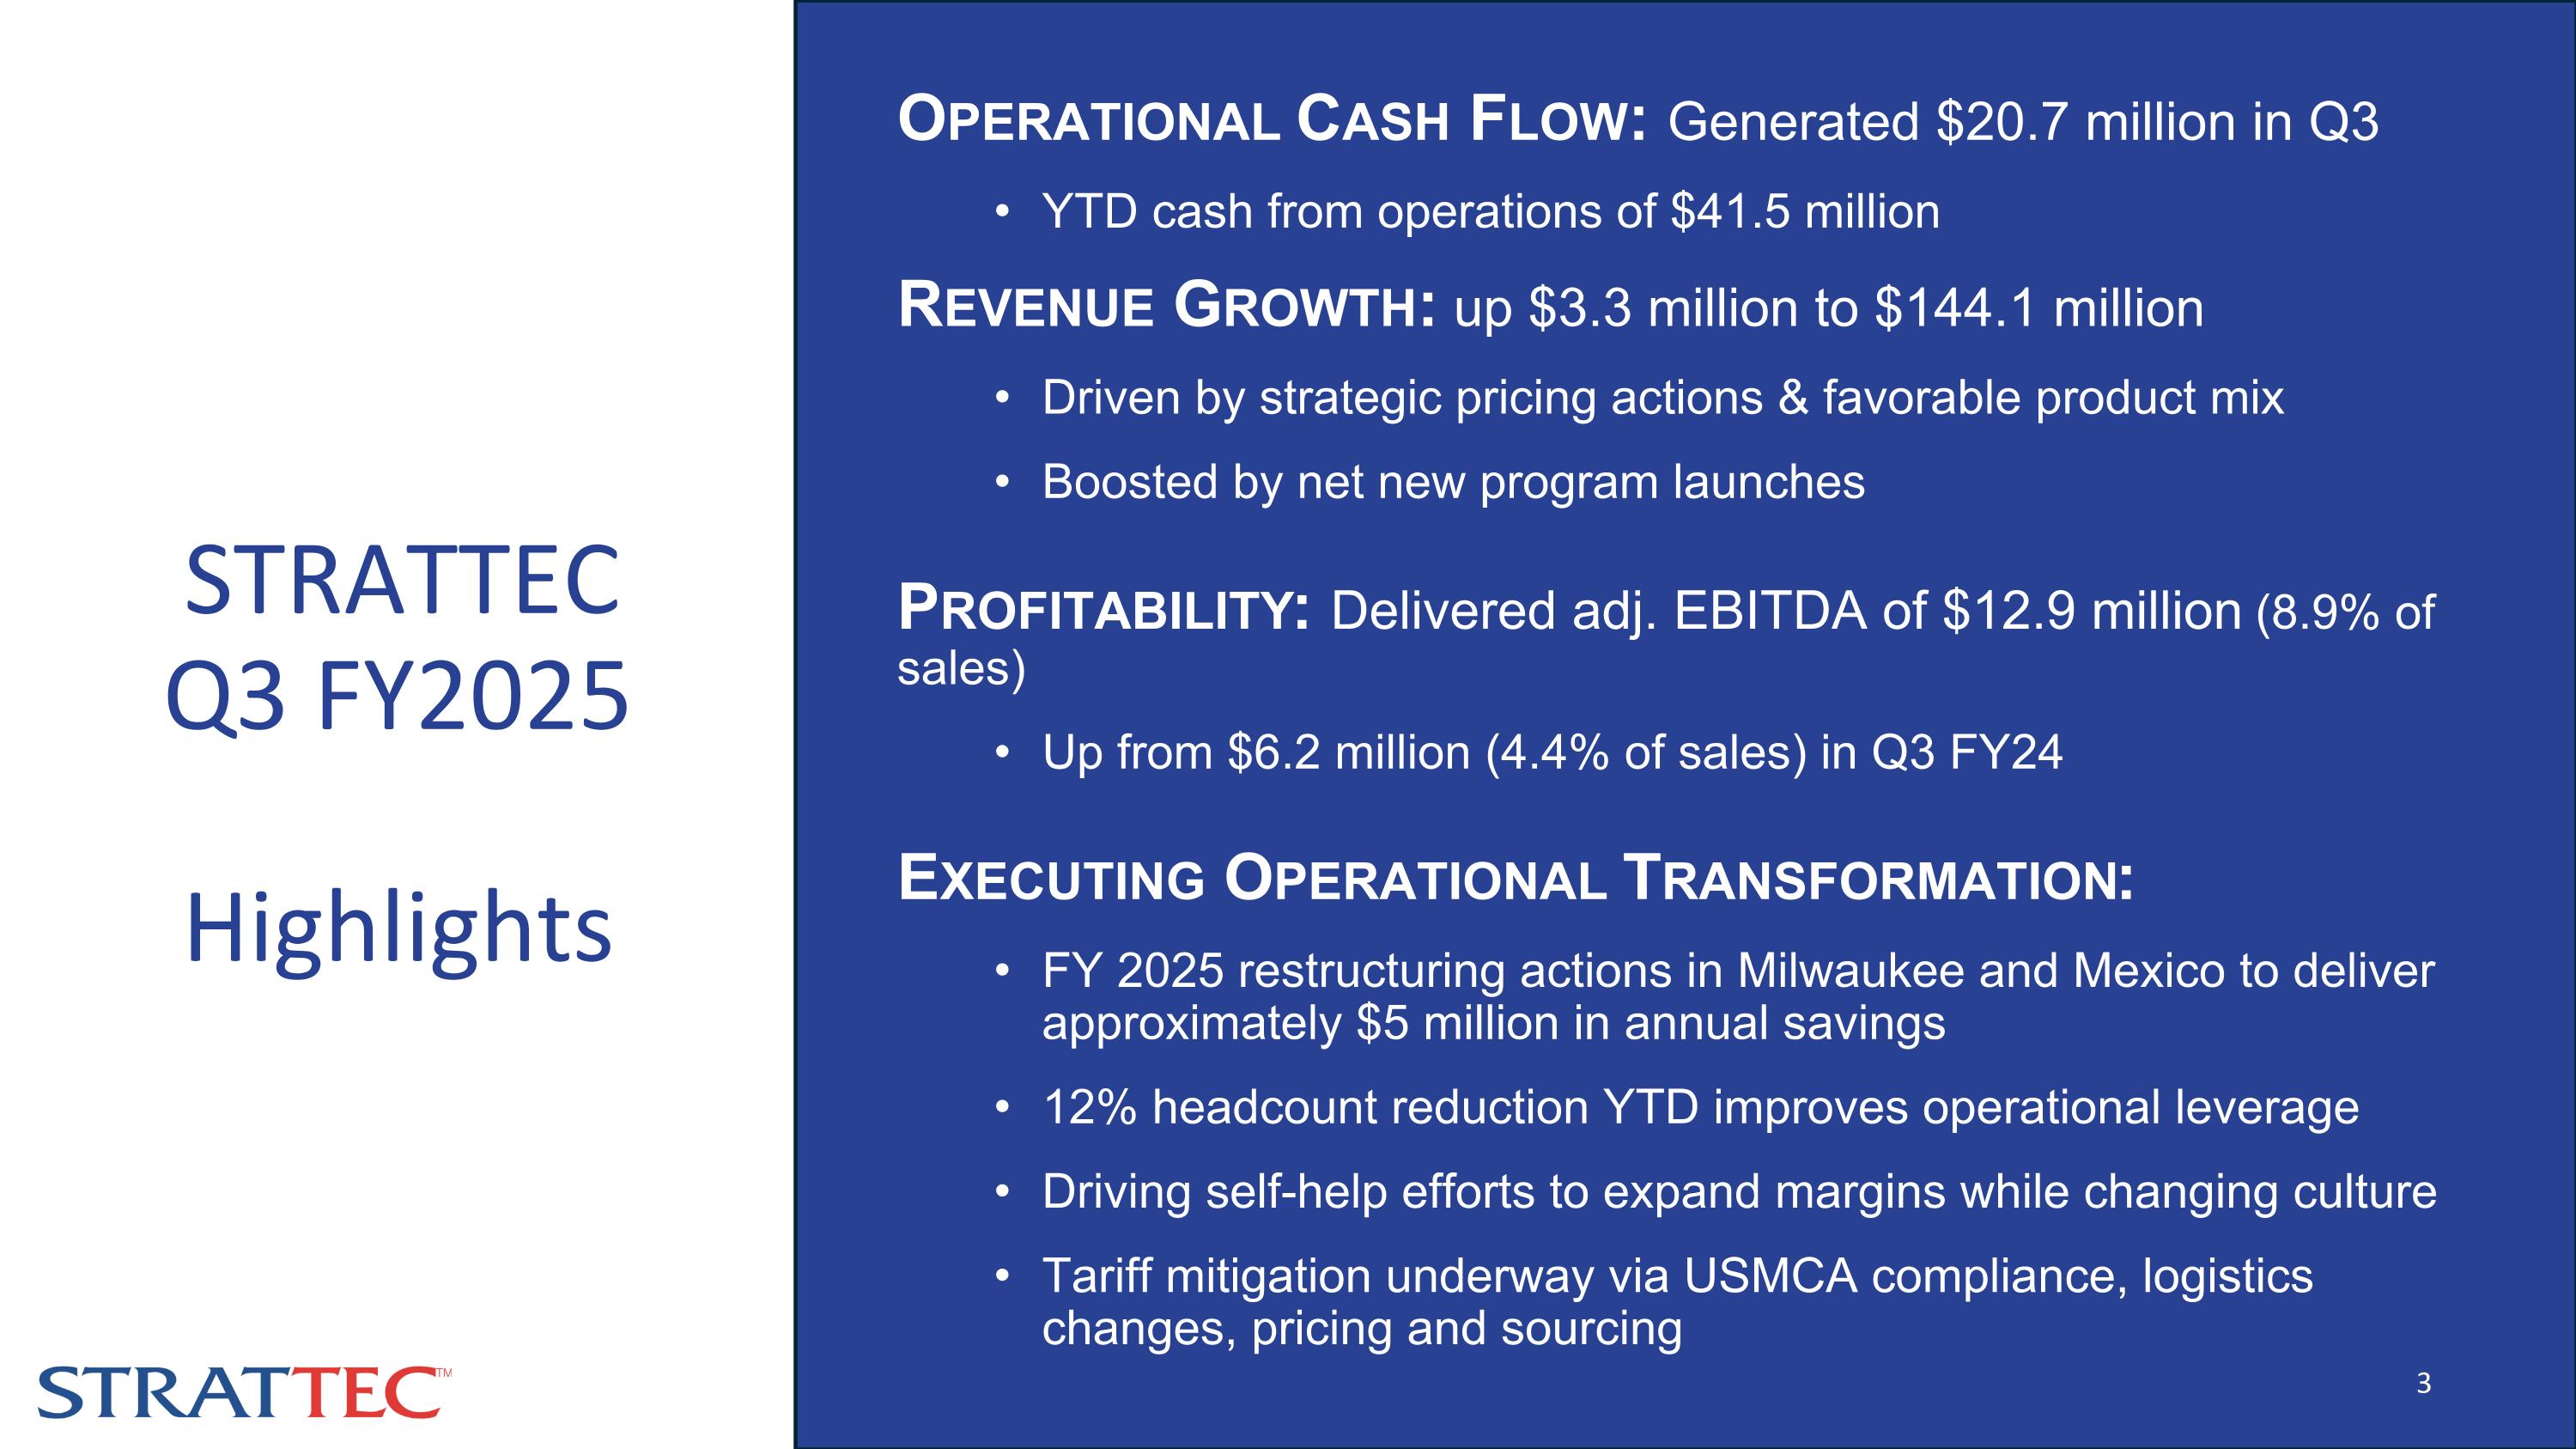
Operational Cash Flow: Generated $20.7 million in Q3 YTD cash from operations of $41.5 million Revenue Growth: up $3.3 million to $144.1 million Driven by strategic pricing actions & favorable product mix Boosted by net new program launches Profitability: Delivered adj. EBITDA of $12.9 million (8.9% of sales) Up from $6.2 million (4.4% of sales) in Q3 FY24 Executing Operational Transformation: FY 2025 restructuring actions in Milwaukee and Mexico to deliver approximately $5 million in annual savings 12% headcount reduction YTD improves operational leverage Driving self-help efforts to expand margins while changing culture Tariff mitigation underway via USMCA compliance, logistics changes, pricing and sourcing STRATTEC Q3 FY2025 Highlights
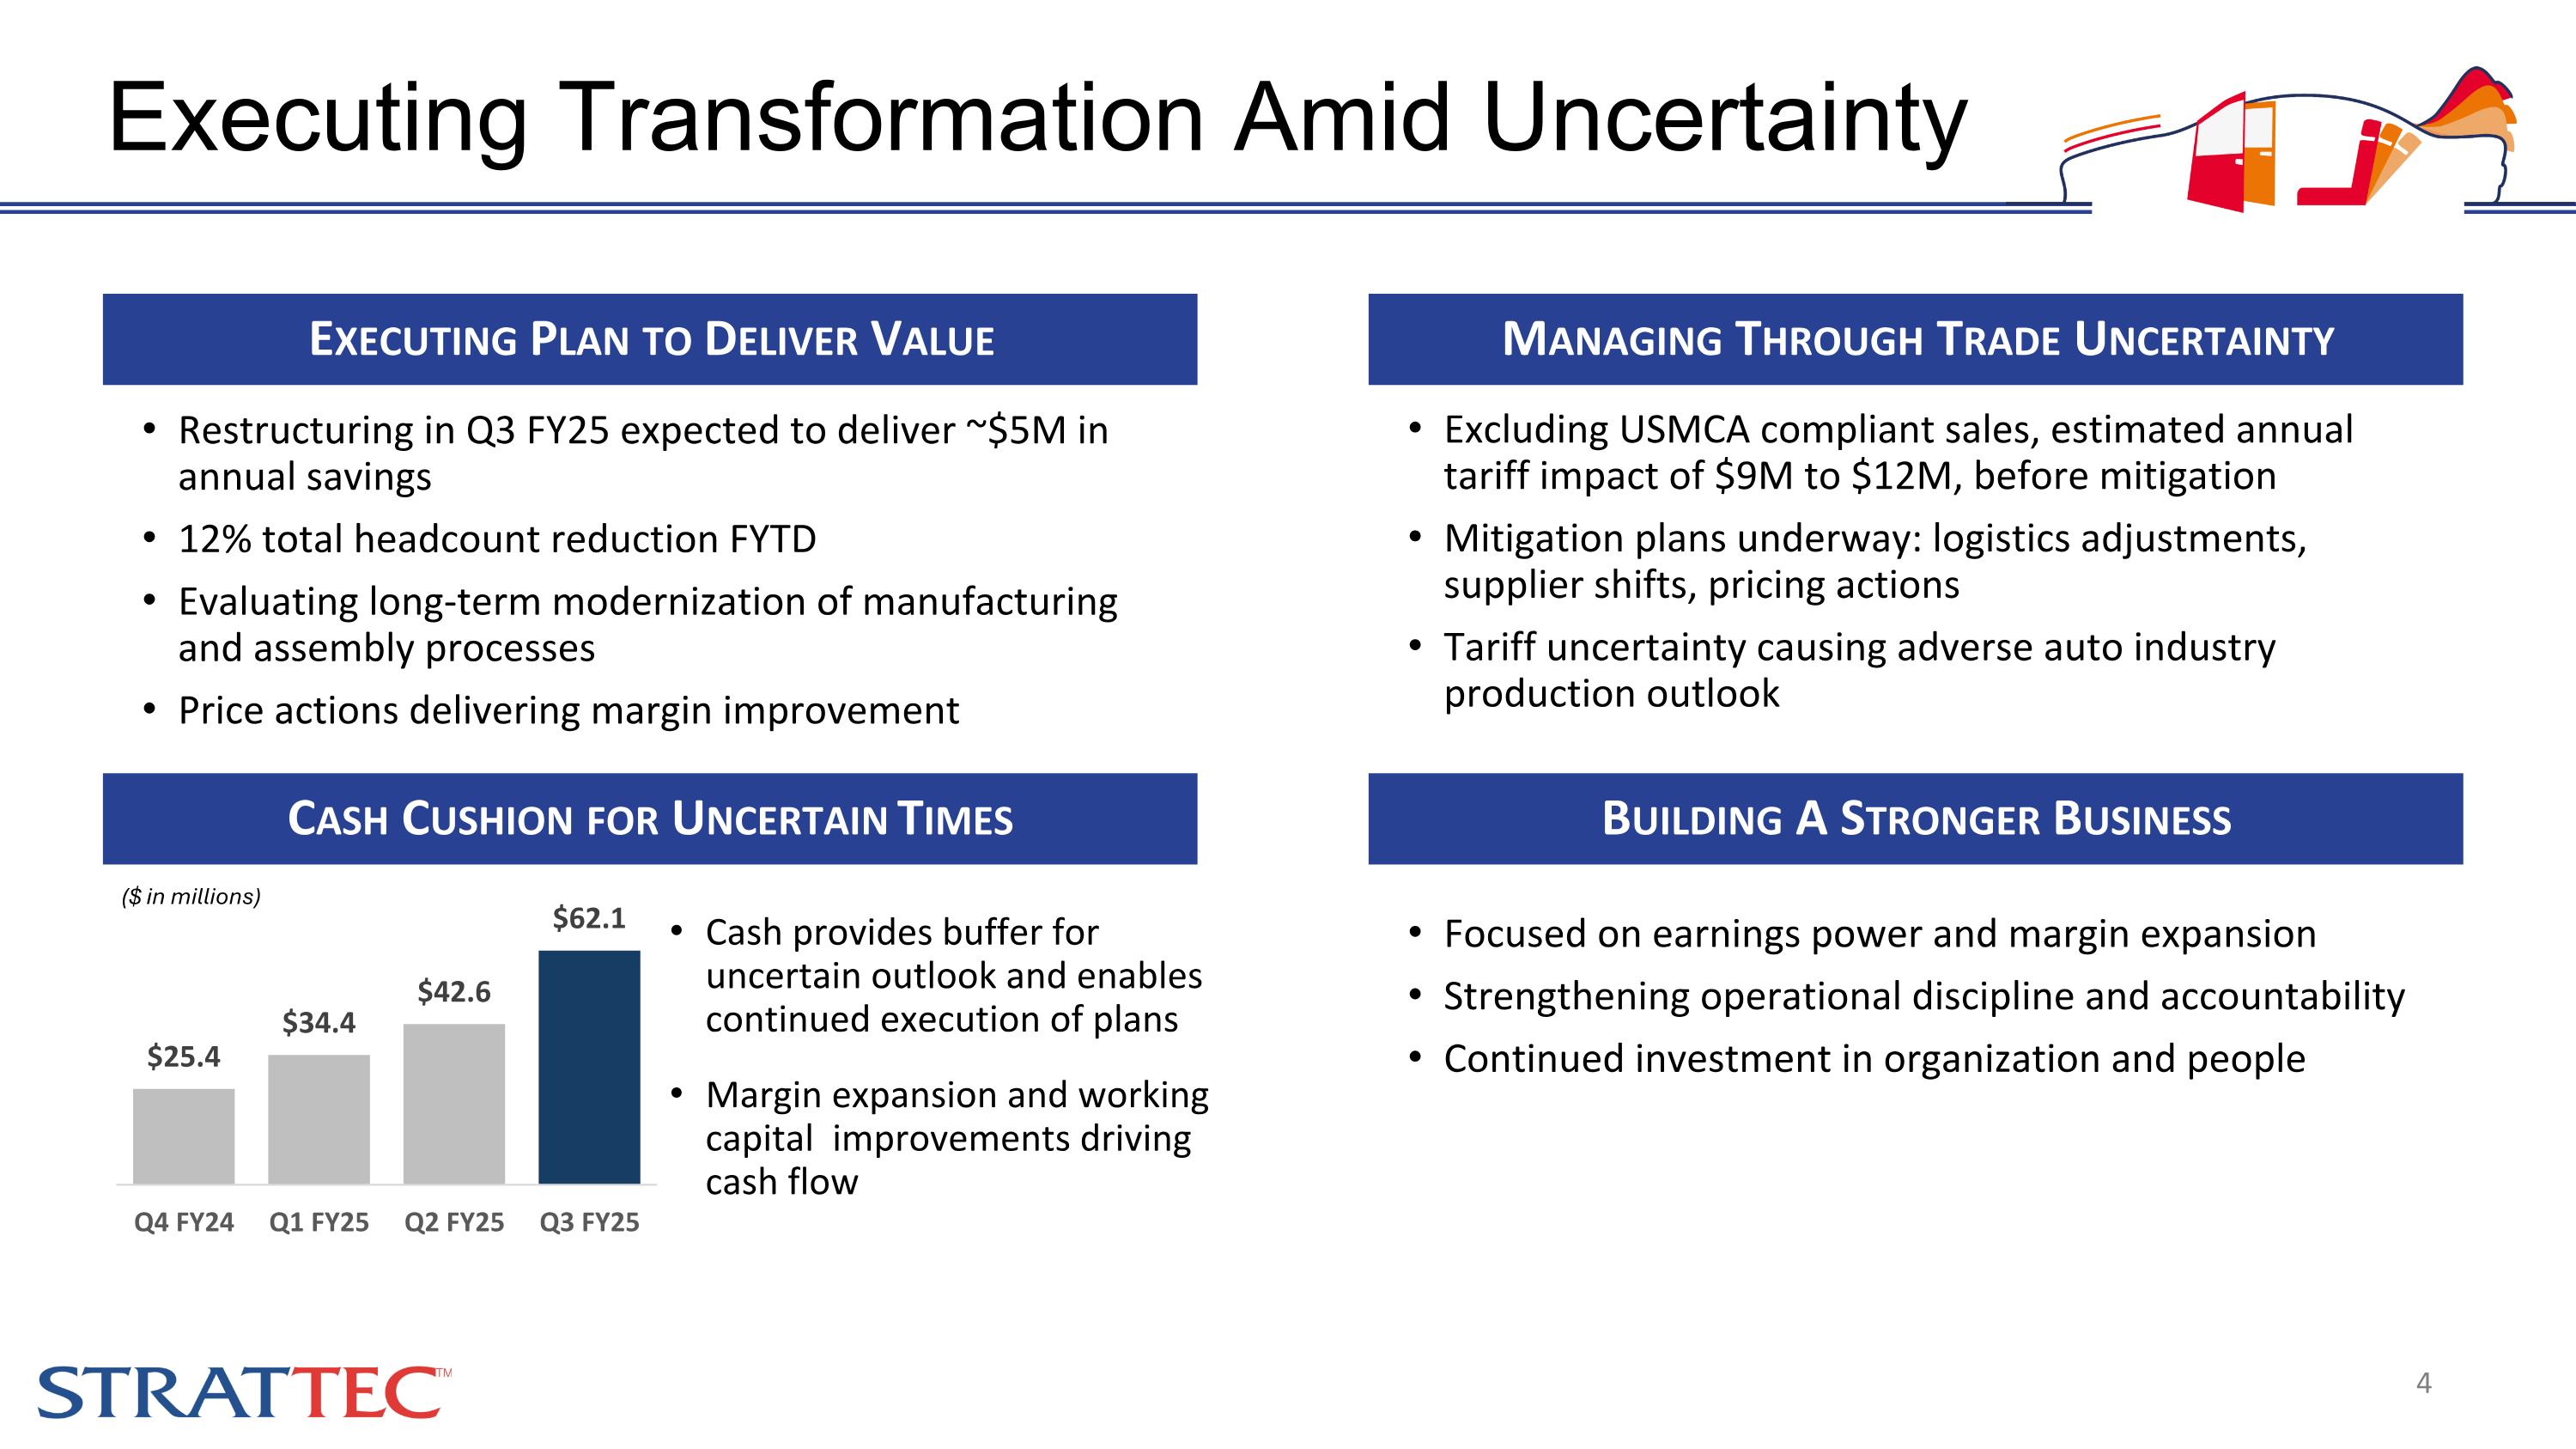
Executing Transformation Amid Uncertainty Managing Through Trade Uncertainty Executing Plan to Deliver Value Restructuring in Q3 FY25 expected to deliver ~$5M in annual savings 12% total headcount reduction FYTD Evaluating long-term modernization of manufacturing and assembly processes Price actions delivering margin improvement Building A Stronger Business Cash provides buffer for uncertain outlook and enables continued execution of plans Margin expansion and working capital improvements driving cash flow Cash Cushion for Uncertain Times Excluding USMCA compliant sales, estimated annual tariff impact of $9M to $12M, before mitigation Mitigation plans underway: logistics adjustments, supplier shifts, pricing actions Tariff uncertainty causing adverse auto industry production outlook Focused on earnings power and margin expansion Strengthening operational discipline and accountability Continued investment in organization and people ($ in millions)
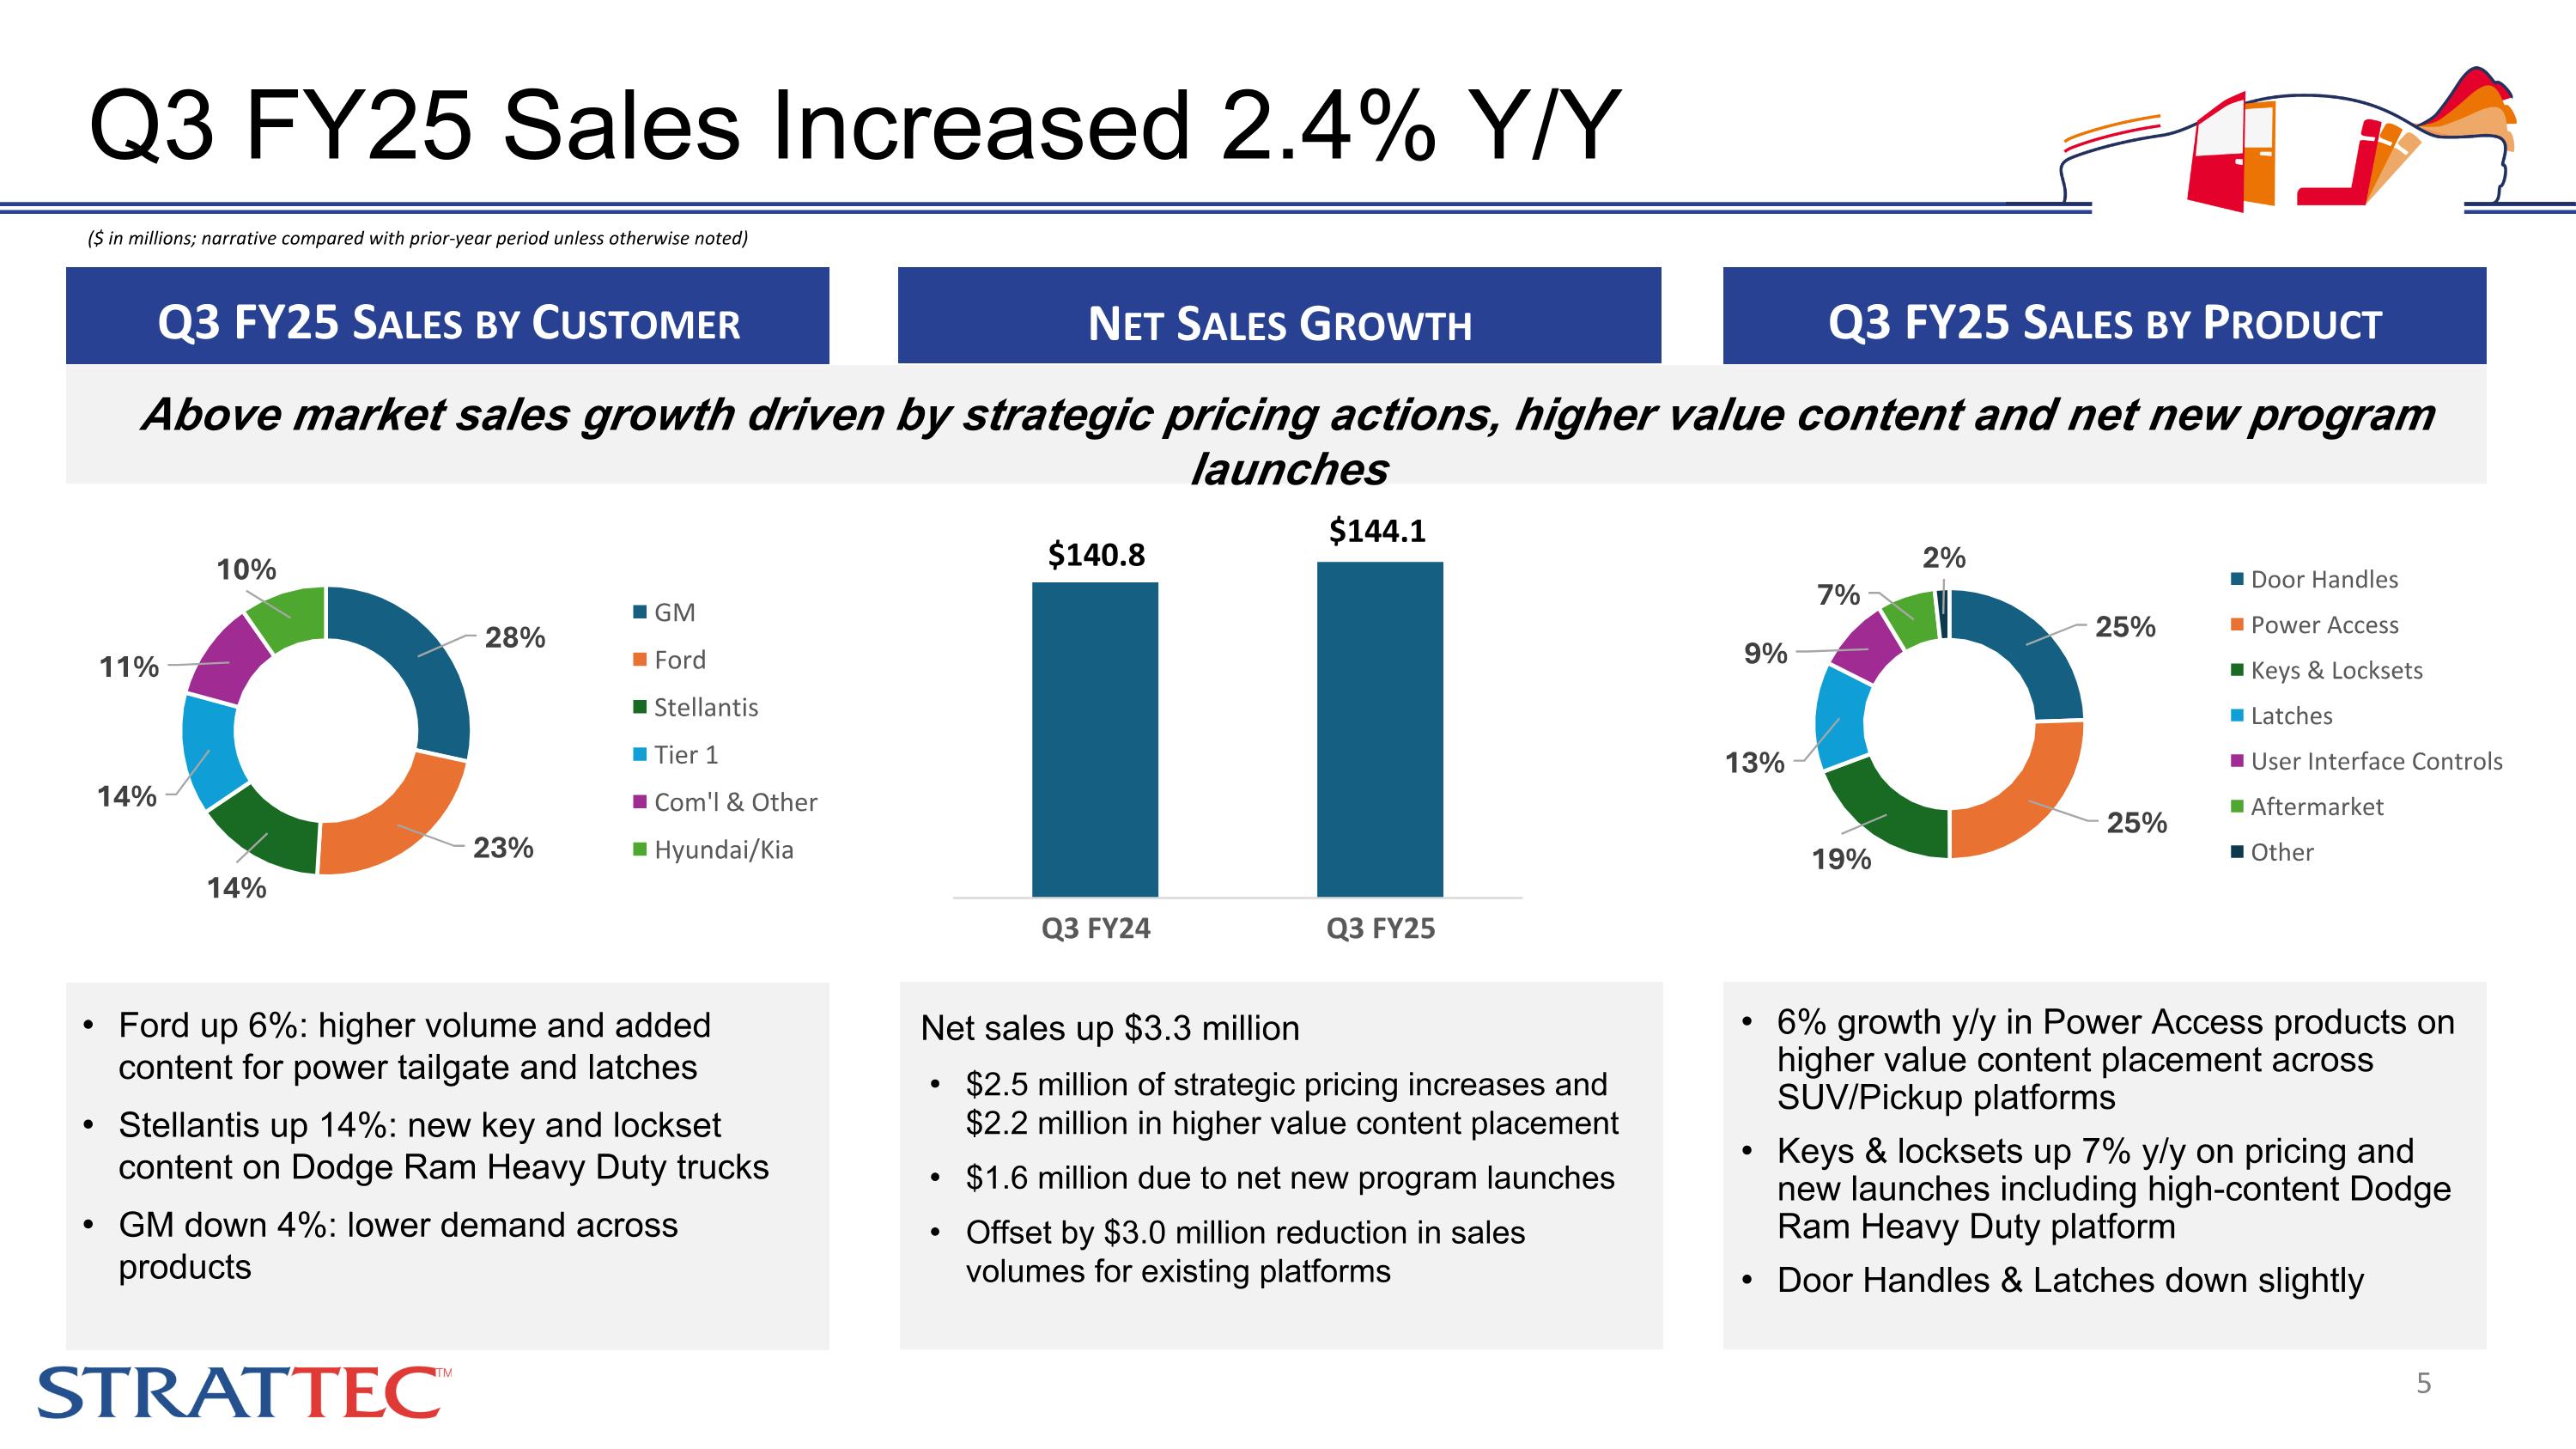
Ford up 6%: higher volume and added content for power tailgate and latches Stellantis up 14%: new key and lockset content on Dodge Ram Heavy Duty trucks GM down 4%: lower demand across products ($ in millions; narrative compared with prior-year period unless otherwise noted) Q3 FY25 Sales Increased 2.4% Y/Y Net Sales Growth Net sales up $3.3 million $2.5 million of strategic pricing increases and $2.2 million in higher value content placement $1.6 million due to net new program launches Offset by $3.0 million reduction in sales volumes for existing platforms 6% growth y/y in Power Access products on higher value content placement across SUV/Pickup platforms Keys & locksets up 7% y/y on pricing and new launches including high-content Dodge Ram Heavy Duty platform Door Handles & Latches down slightly Q3 FY25 Sales by Customer Q3 FY25 Sales by Product $140.8 $144.1 Above market sales growth driven by strategic pricing actions, higher value content and net new program launches
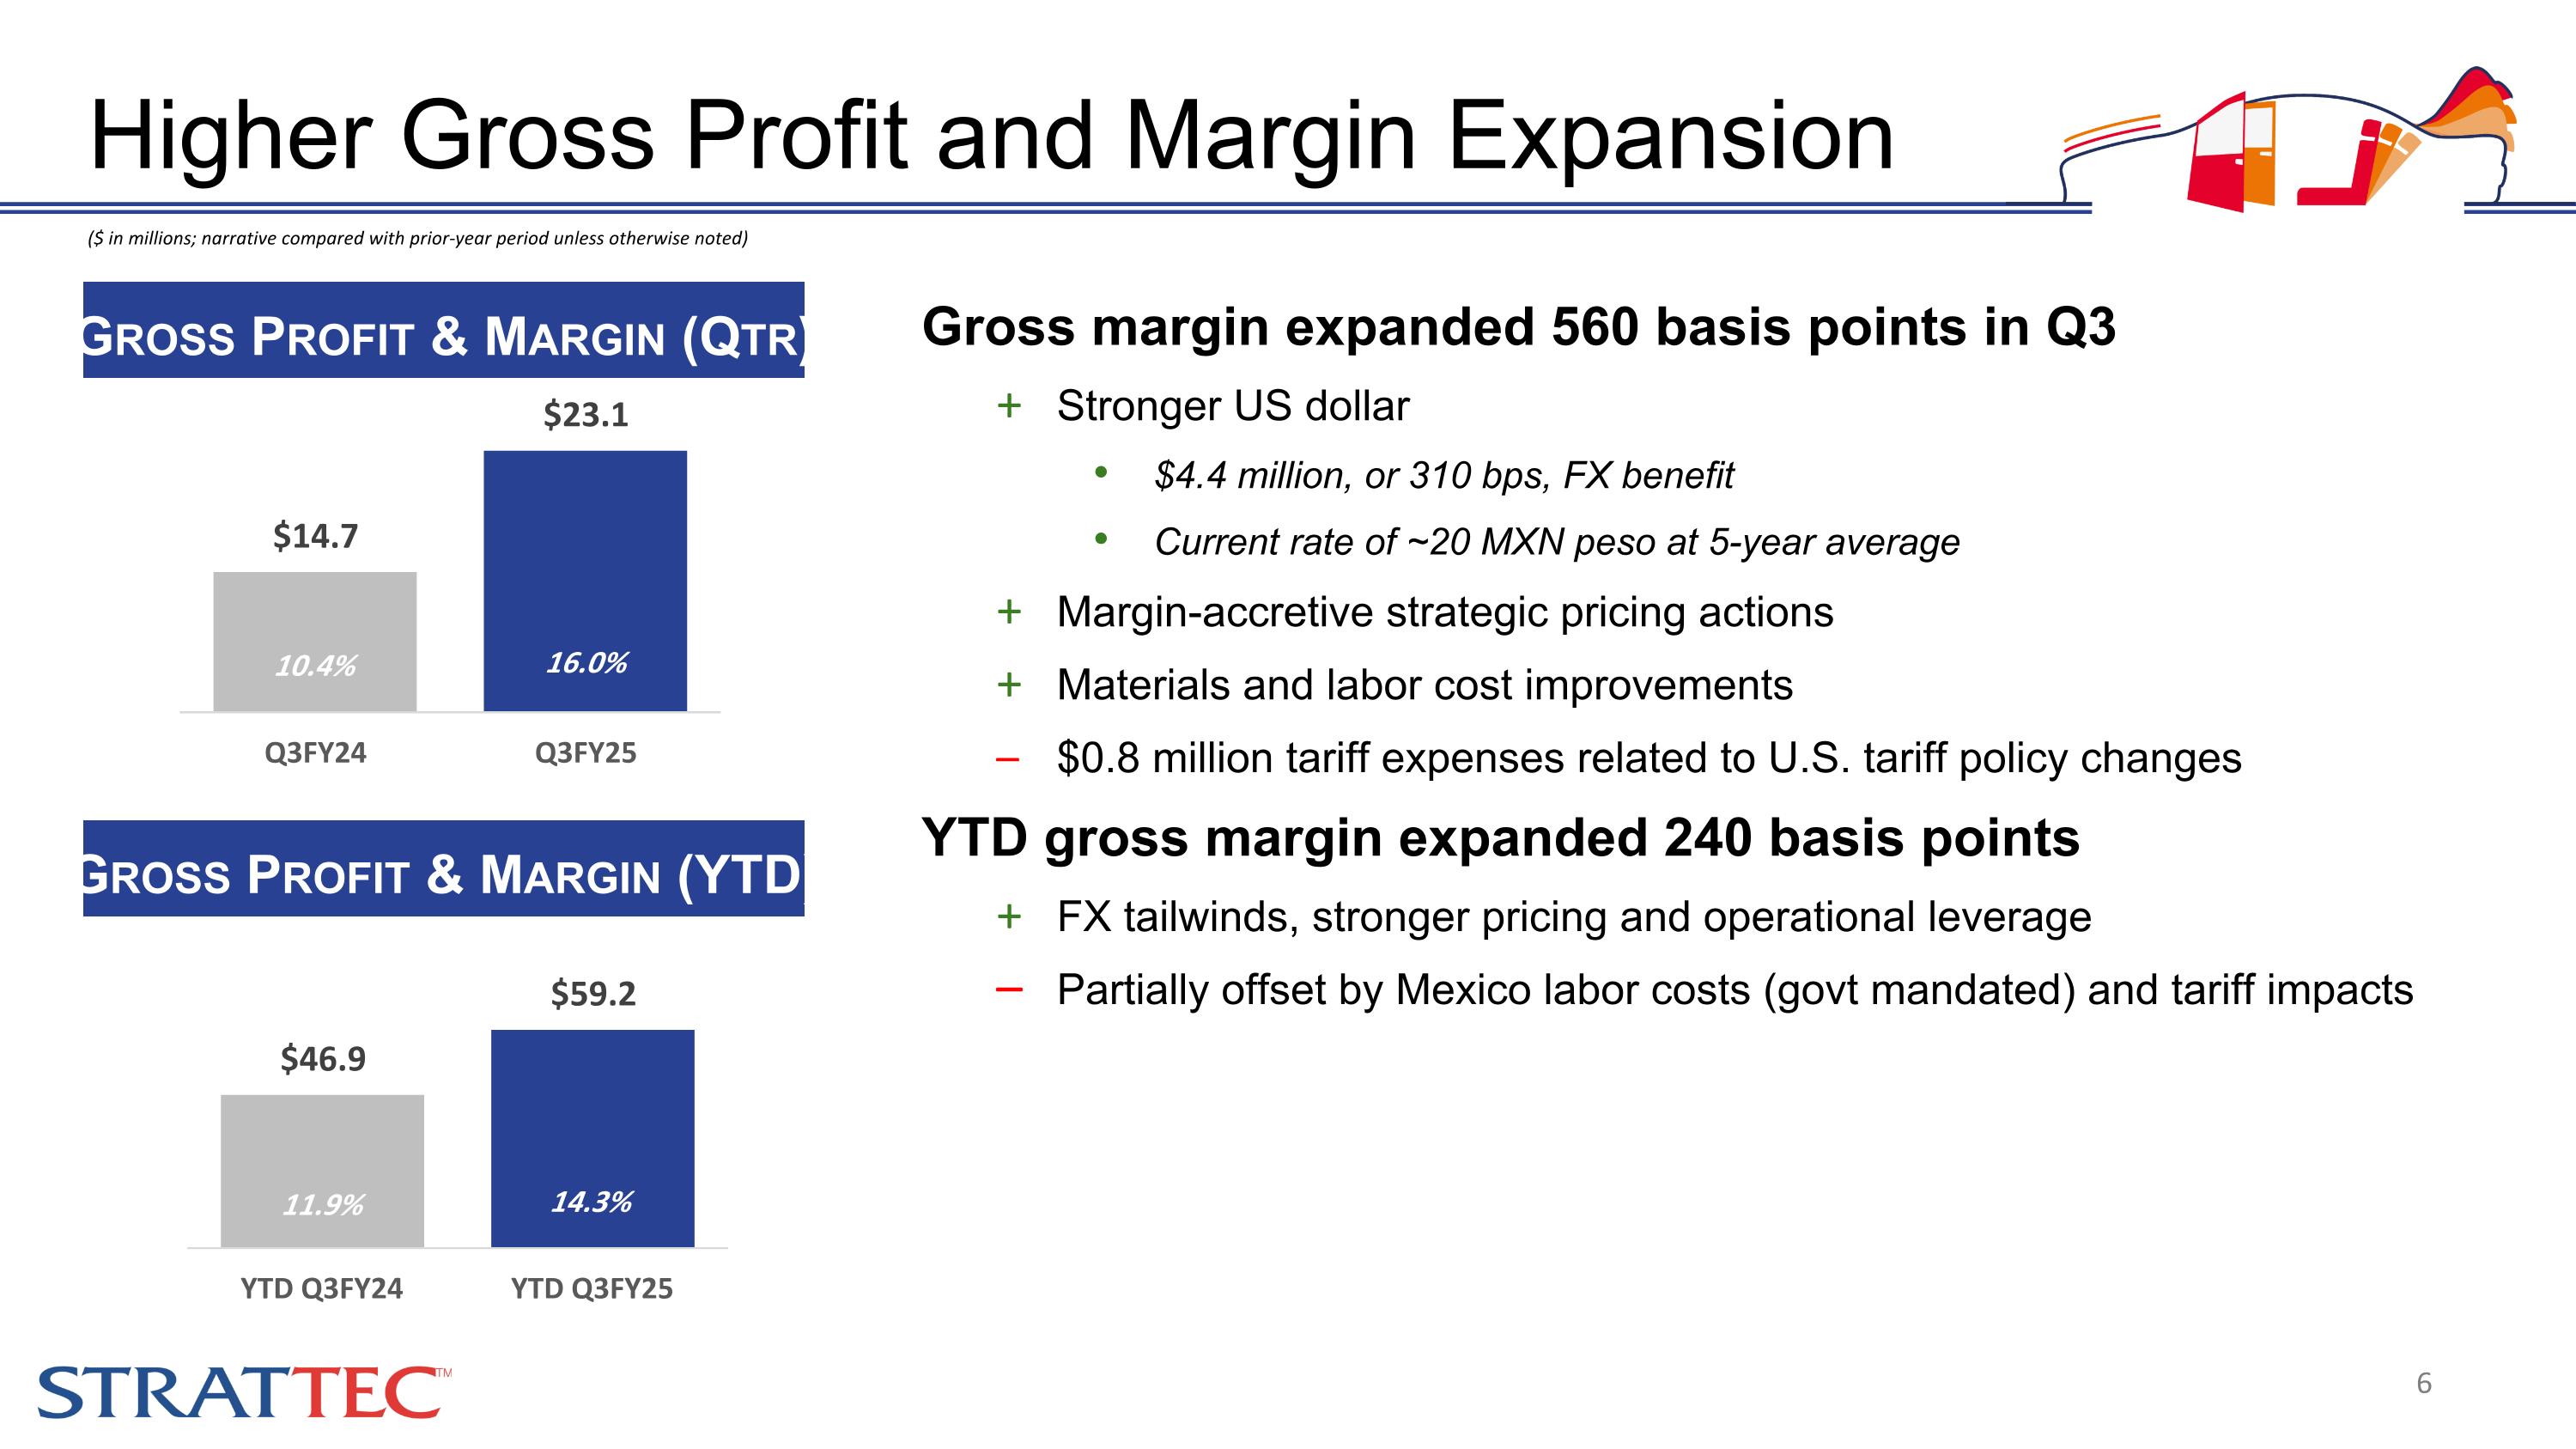
Gross margin expanded 560 basis points in Q3 Stronger US dollar $4.4 million, or 310 bps, FX benefit Current rate of ~20 MXN peso at 5-year average Margin-accretive strategic pricing actions Materials and labor cost improvements $0.8 million tariff expenses related to U.S. tariff policy changes YTD gross margin expanded 240 basis points FX tailwinds, stronger pricing and operational leverage Partially offset by Mexico labor costs (govt mandated) and tariff impacts ($ in millions; narrative compared with prior-year period unless otherwise noted) Higher Gross Profit and Margin Expansion Gross Profit & Margin (Qtr) 11.4% 13.2% Gross Profit & Margin (YTD) 16.0% 10.4% 14.3% 11.9%
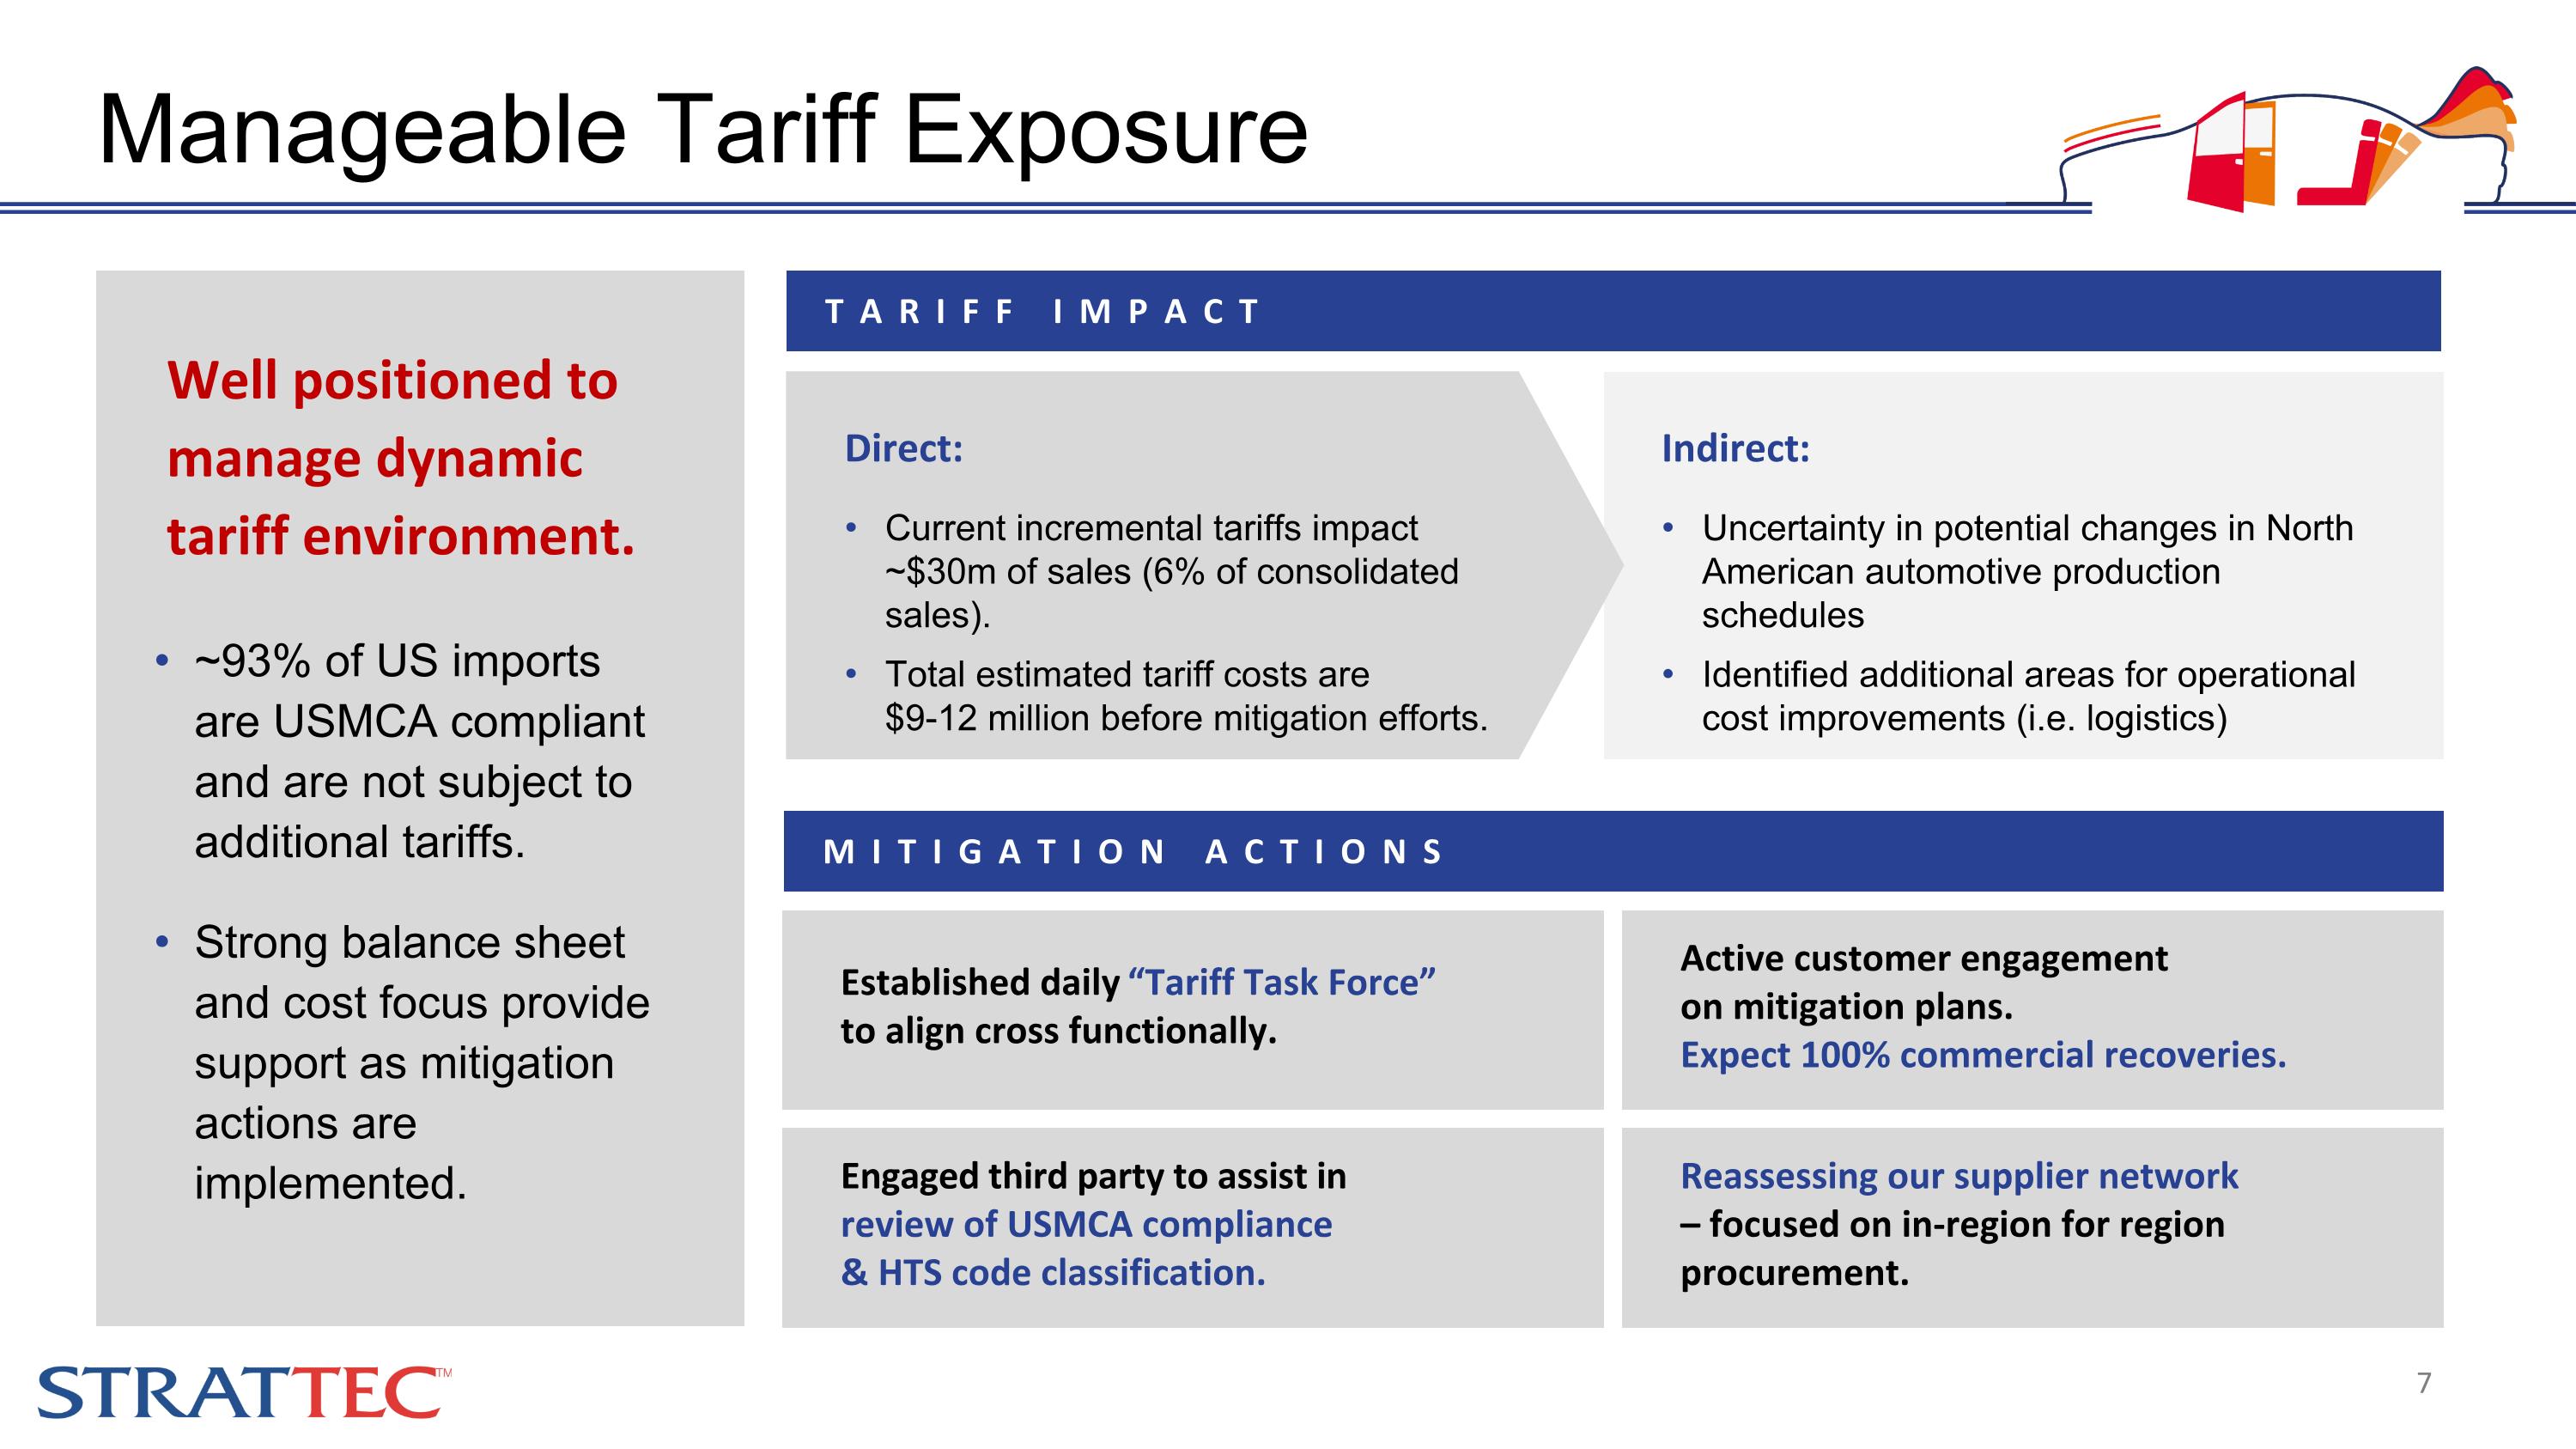
Well positioned to manage dynamic tariff environment. ~93% of US imports are USMCA compliant and are not subject to additional tariffs. Strong balance sheet and cost focus provide support as mitigation actions are implemented. TARIFF IMPACT Reassessing our supplier network – focused on in-region for region procurement. Active customer engagement on mitigation plans. Expect 100% commercial recoveries. Established daily “Tariff Task Force” to align cross functionally. Engaged third party to assist in review of USMCA compliance & HTS code classification. Indirect: Uncertainty in potential changes in North American automotive production schedules Identified additional areas for operational cost improvements (i.e. logistics) MITIGATION ACTIONS Direct: Current incremental tariffs impact ~$30m of sales (6% of consolidated sales). Total estimated tariff costs are $9-12 million before mitigation efforts. Manageable Tariff Exposure
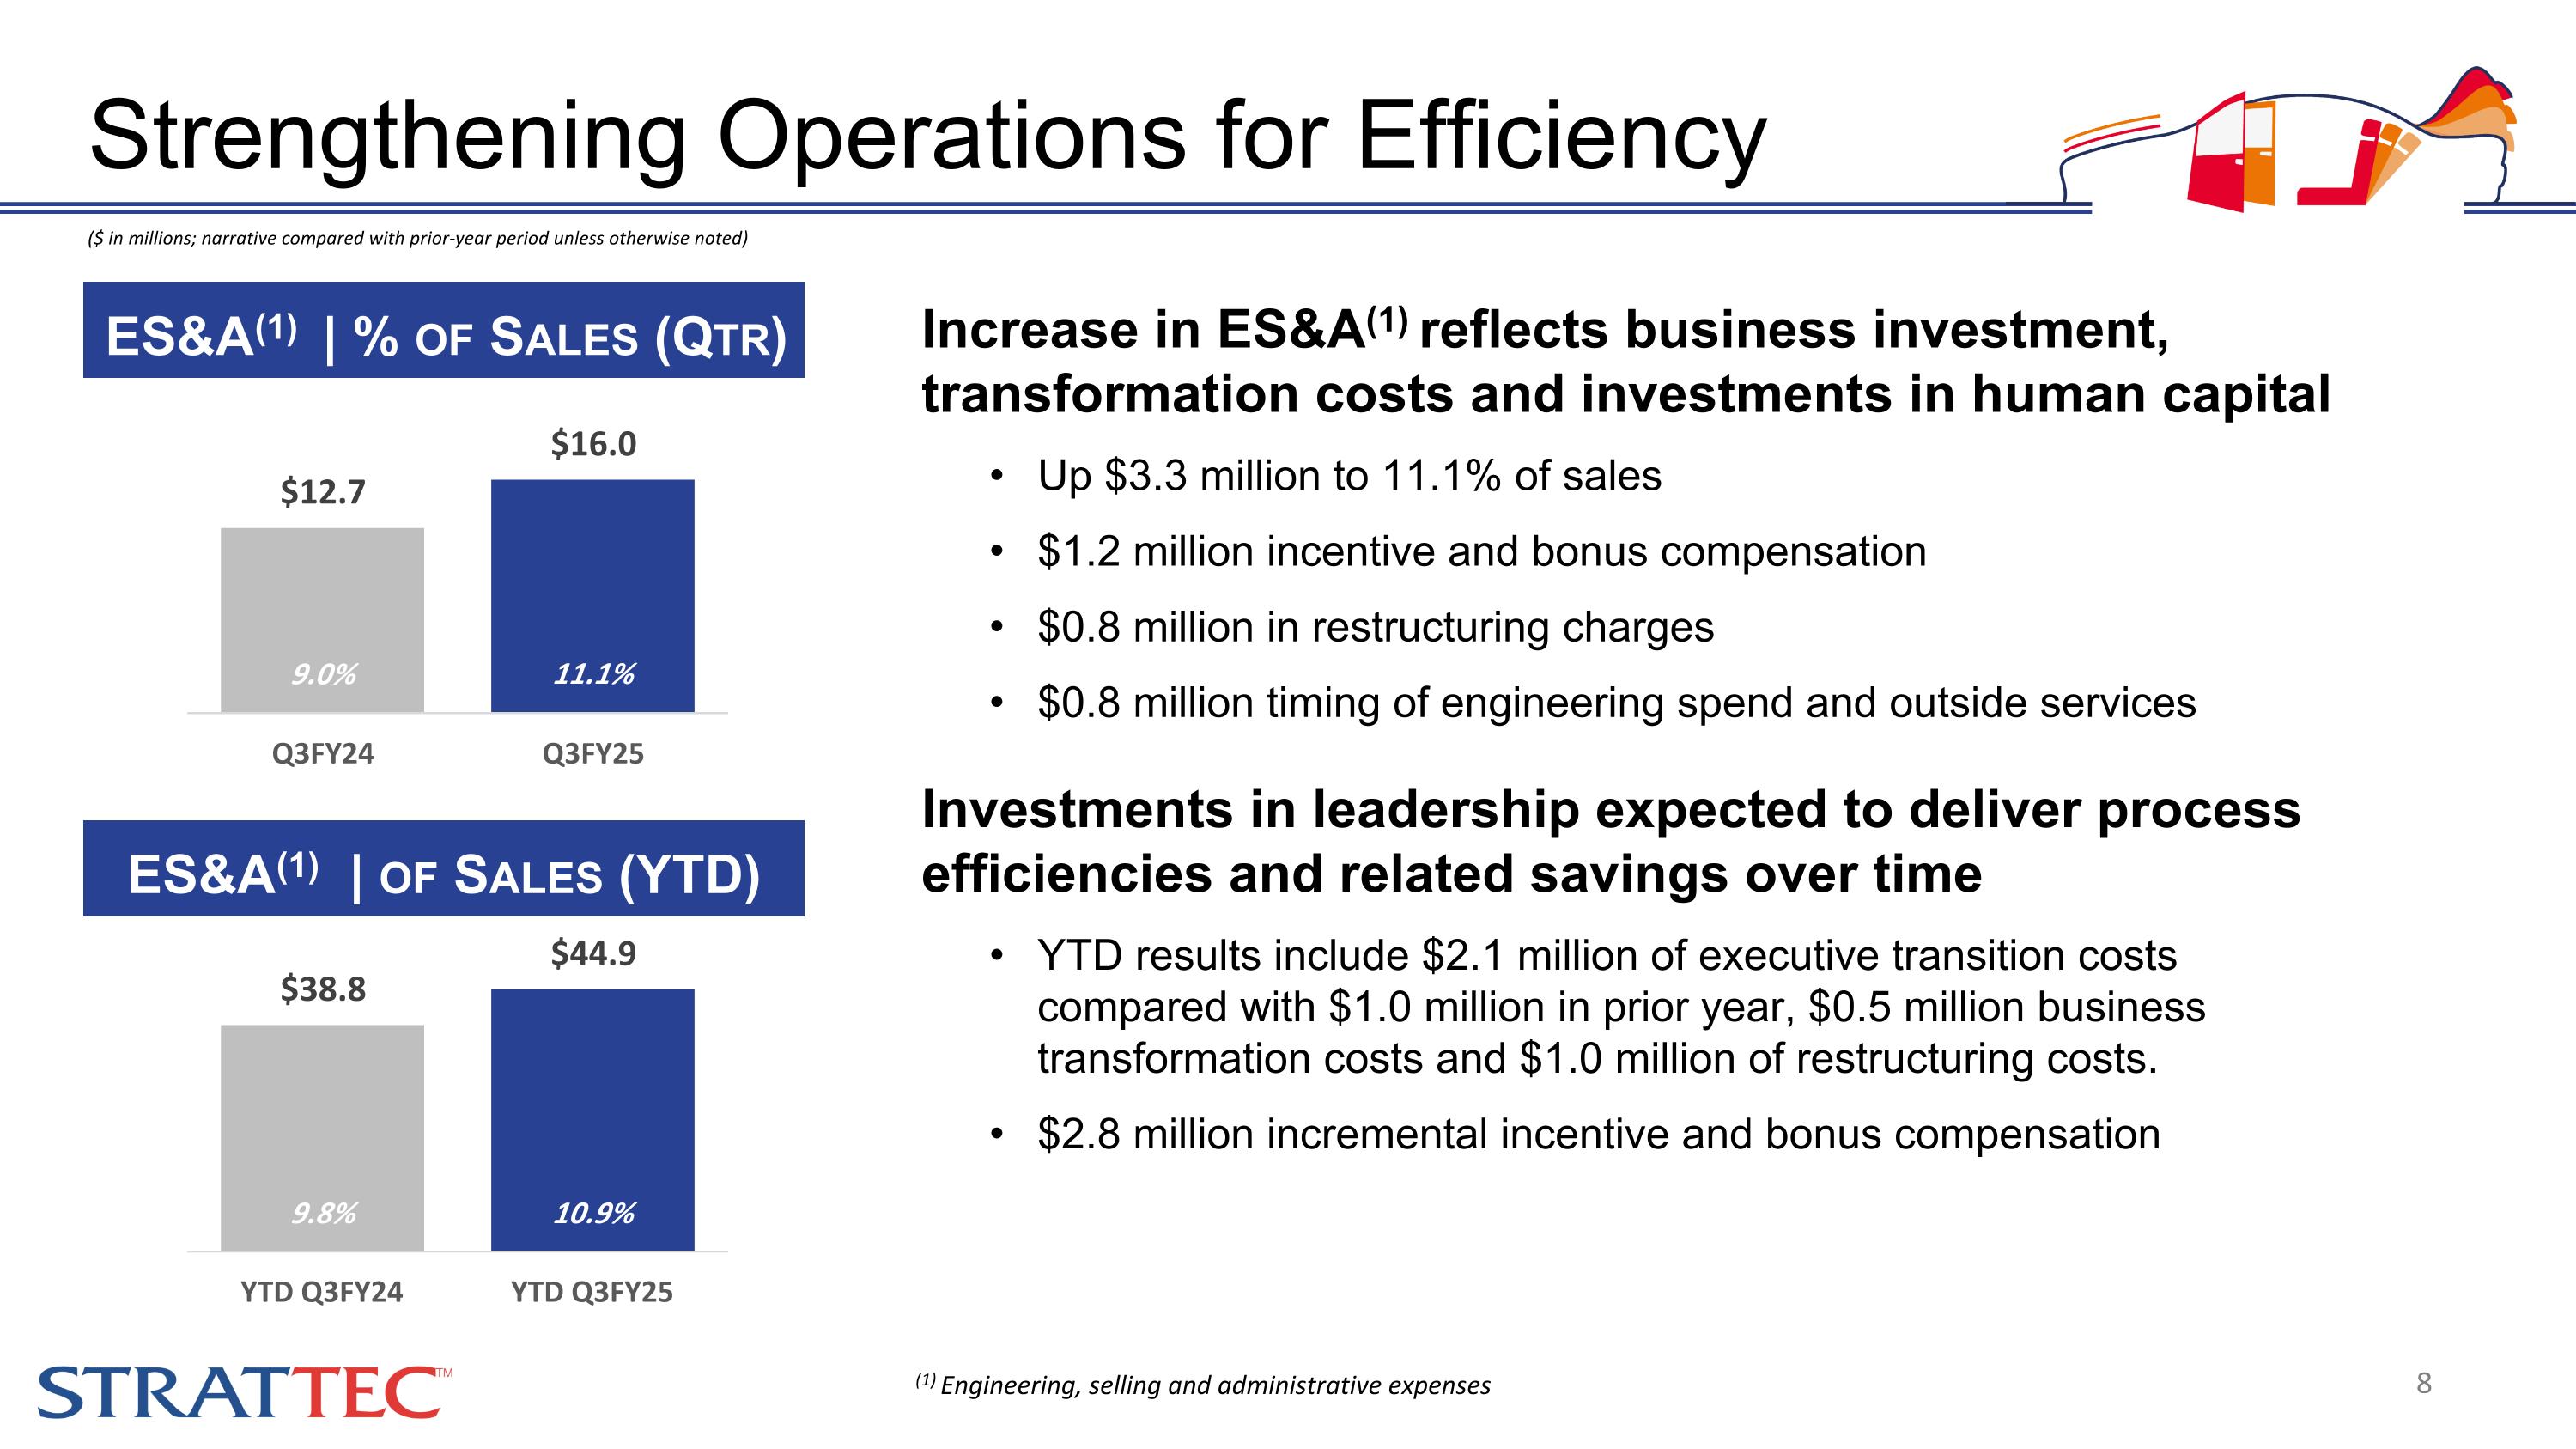
Increase in ES&A(1) reflects business investment, transformation costs and investments in human capital Up $3.3 million to 11.1% of sales $1.2 million incentive and bonus compensation $0.8 million in restructuring charges $0.8 million timing of engineering spend and outside services Investments in leadership expected to deliver process efficiencies and related savings over time YTD results include $2.1 million of executive transition costs compared with $1.0 million in prior year, $0.5 million business transformation costs and $1.0 million of restructuring costs. $2.8 million incremental incentive and bonus compensation ($ in millions; narrative compared with prior-year period unless otherwise noted) Strengthening Operations for Efficiency ES&A(1) | % of Sales (Qtr) 11.4% 13.2% ES&A(1) | of Sales (YTD) (1) Engineering, selling and administrative expenses
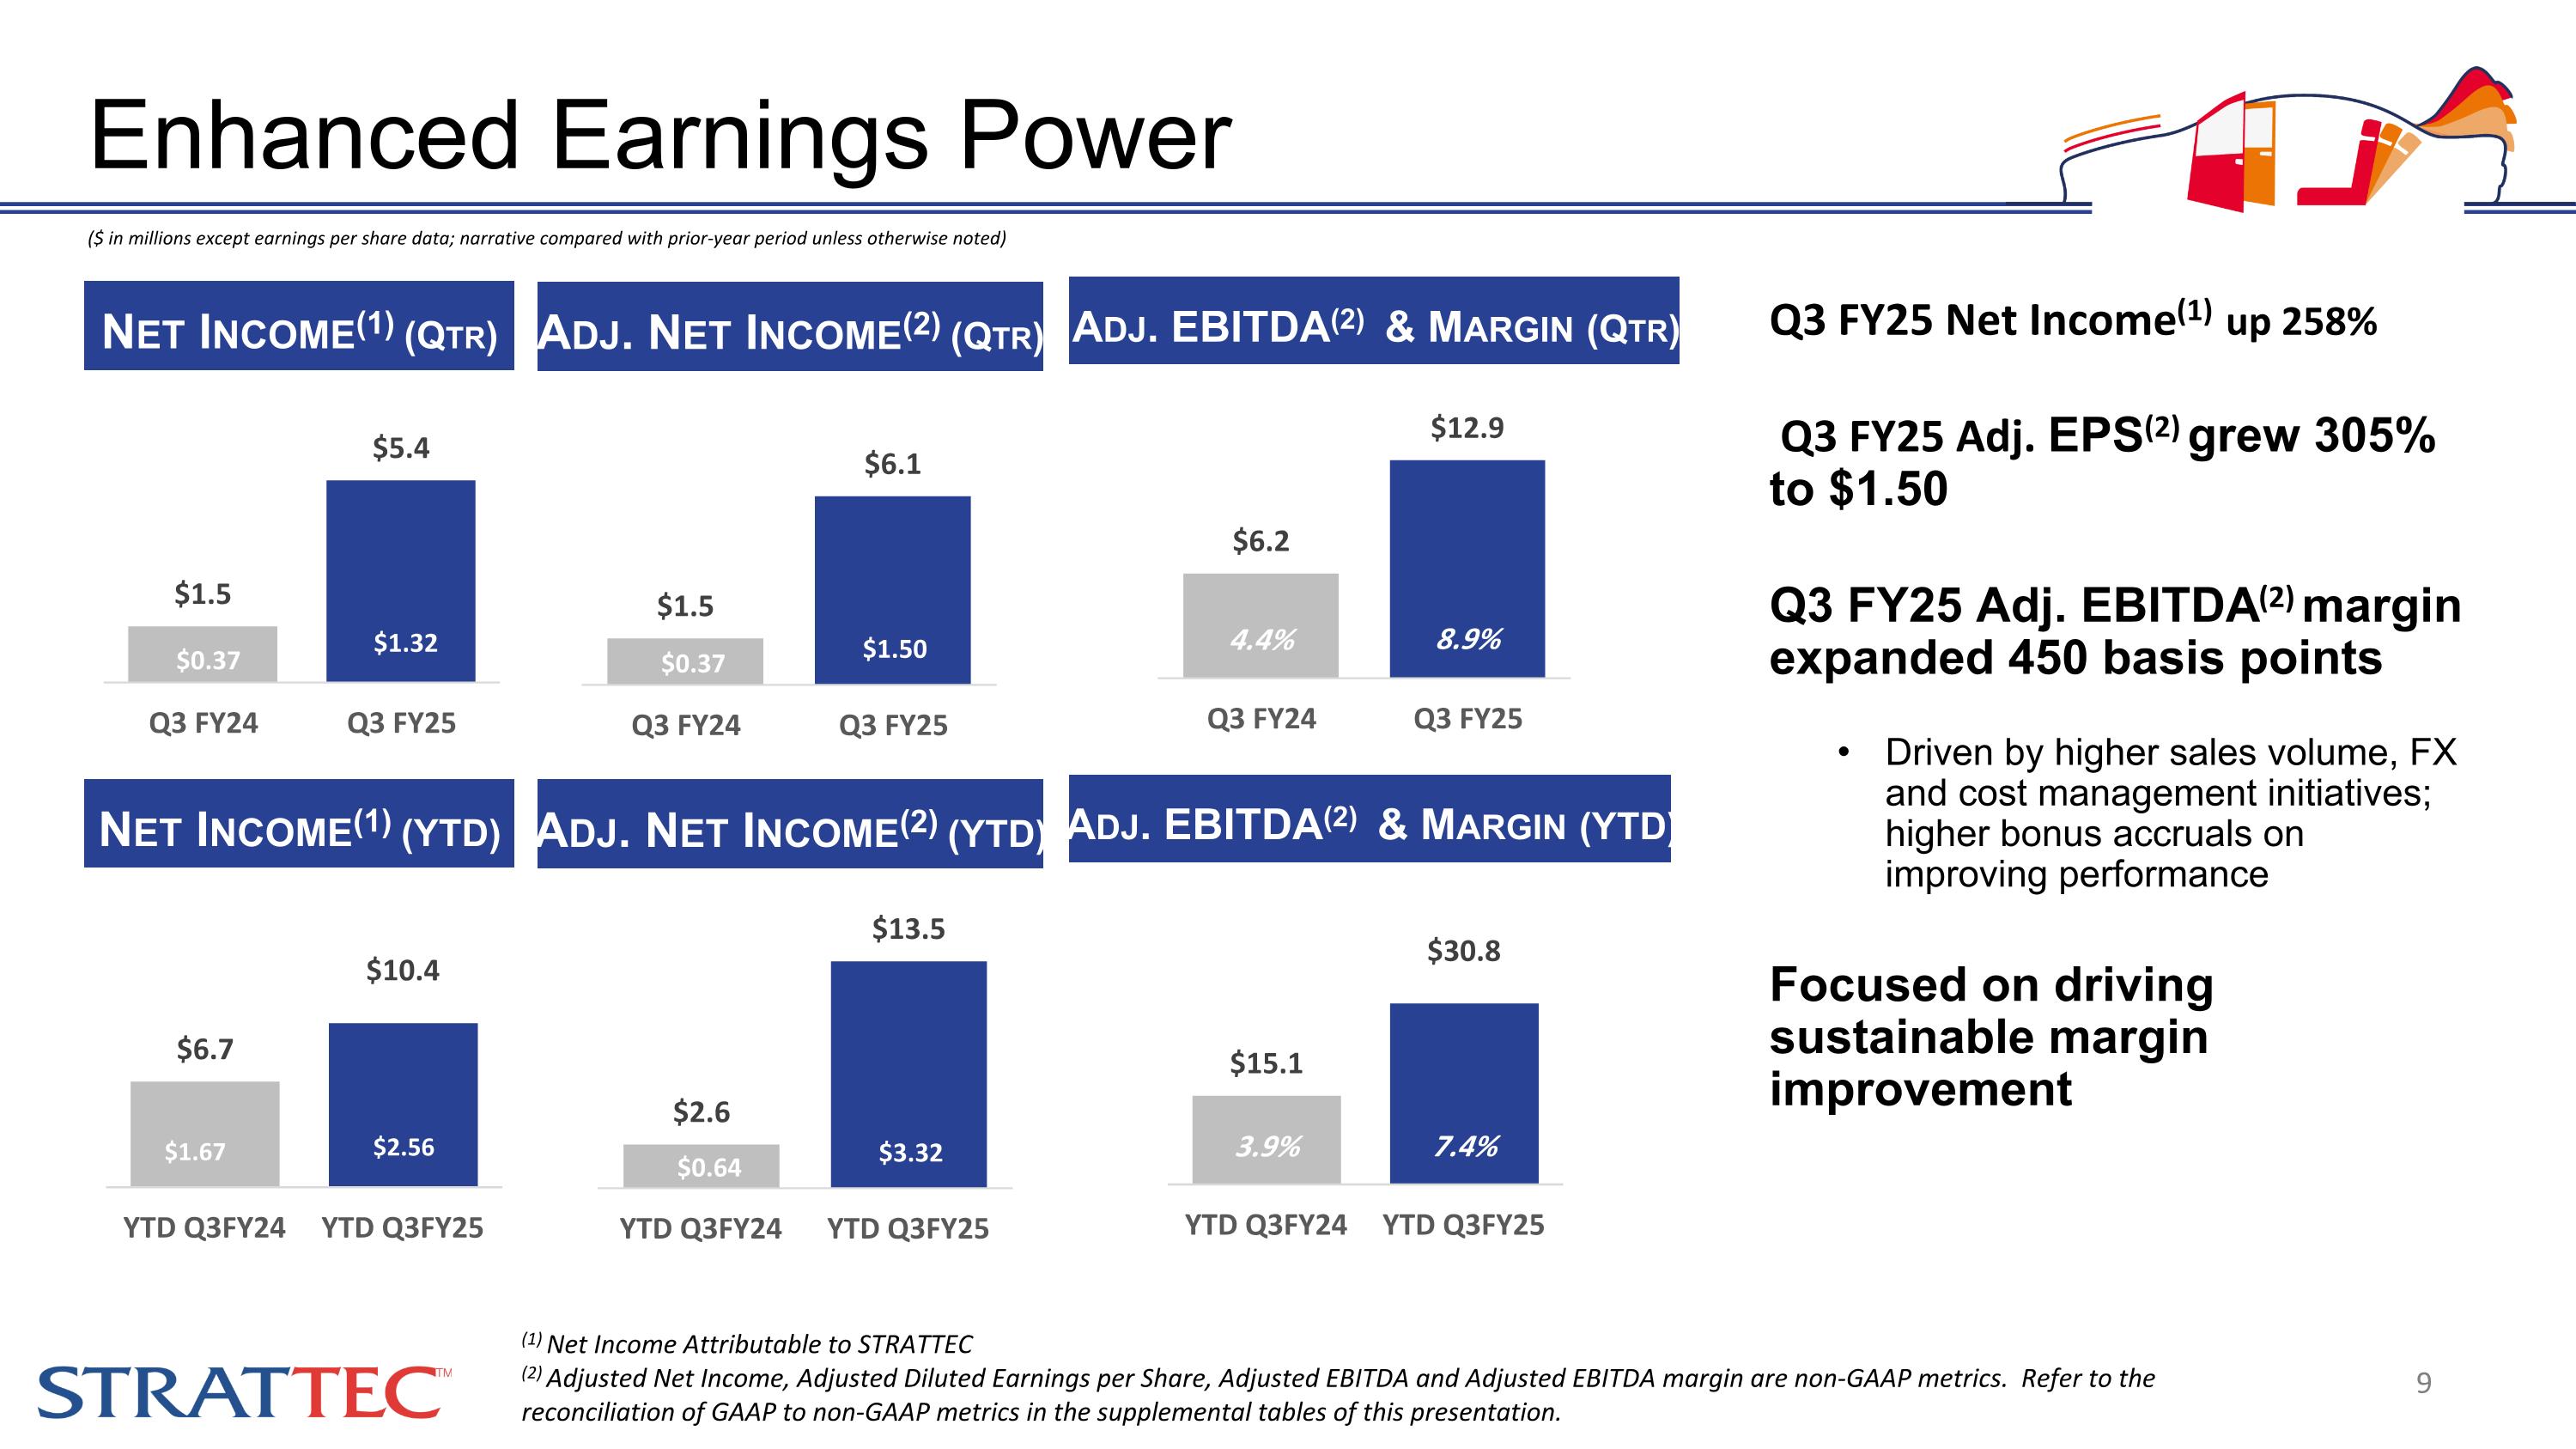
($ in millions except earnings per share data; narrative compared with prior-year period unless otherwise noted) Q3 FY25 Net Income(1) up 258% Q3 FY25 Adj. EPS(2) grew 305% to $1.50 Q3 FY25 Adj. EBITDA(2) margin expanded 450 basis points Driven by higher sales volume, FX and cost management initiatives; higher bonus accruals on improving performance Focused on driving sustainable margin improvement Enhanced Earnings Power (1) Net Income Attributable to STRATTEC (2) Adjusted Net Income, Adjusted Diluted Earnings per Share, Adjusted EBITDA and Adjusted EBITDA margin are non-GAAP metrics. Refer to the reconciliation of GAAP to non-GAAP metrics in the supplemental tables of this presentation. Adj. Net Income(2) (Qtr) Adj. Net Income(2) (YTD) Net Income(1) (Qtr) Net Income(1) (YTD) Adj. EBITDA(2) & Margin (Qtr) Adj. EBITDA(2) & Margin (YTD)
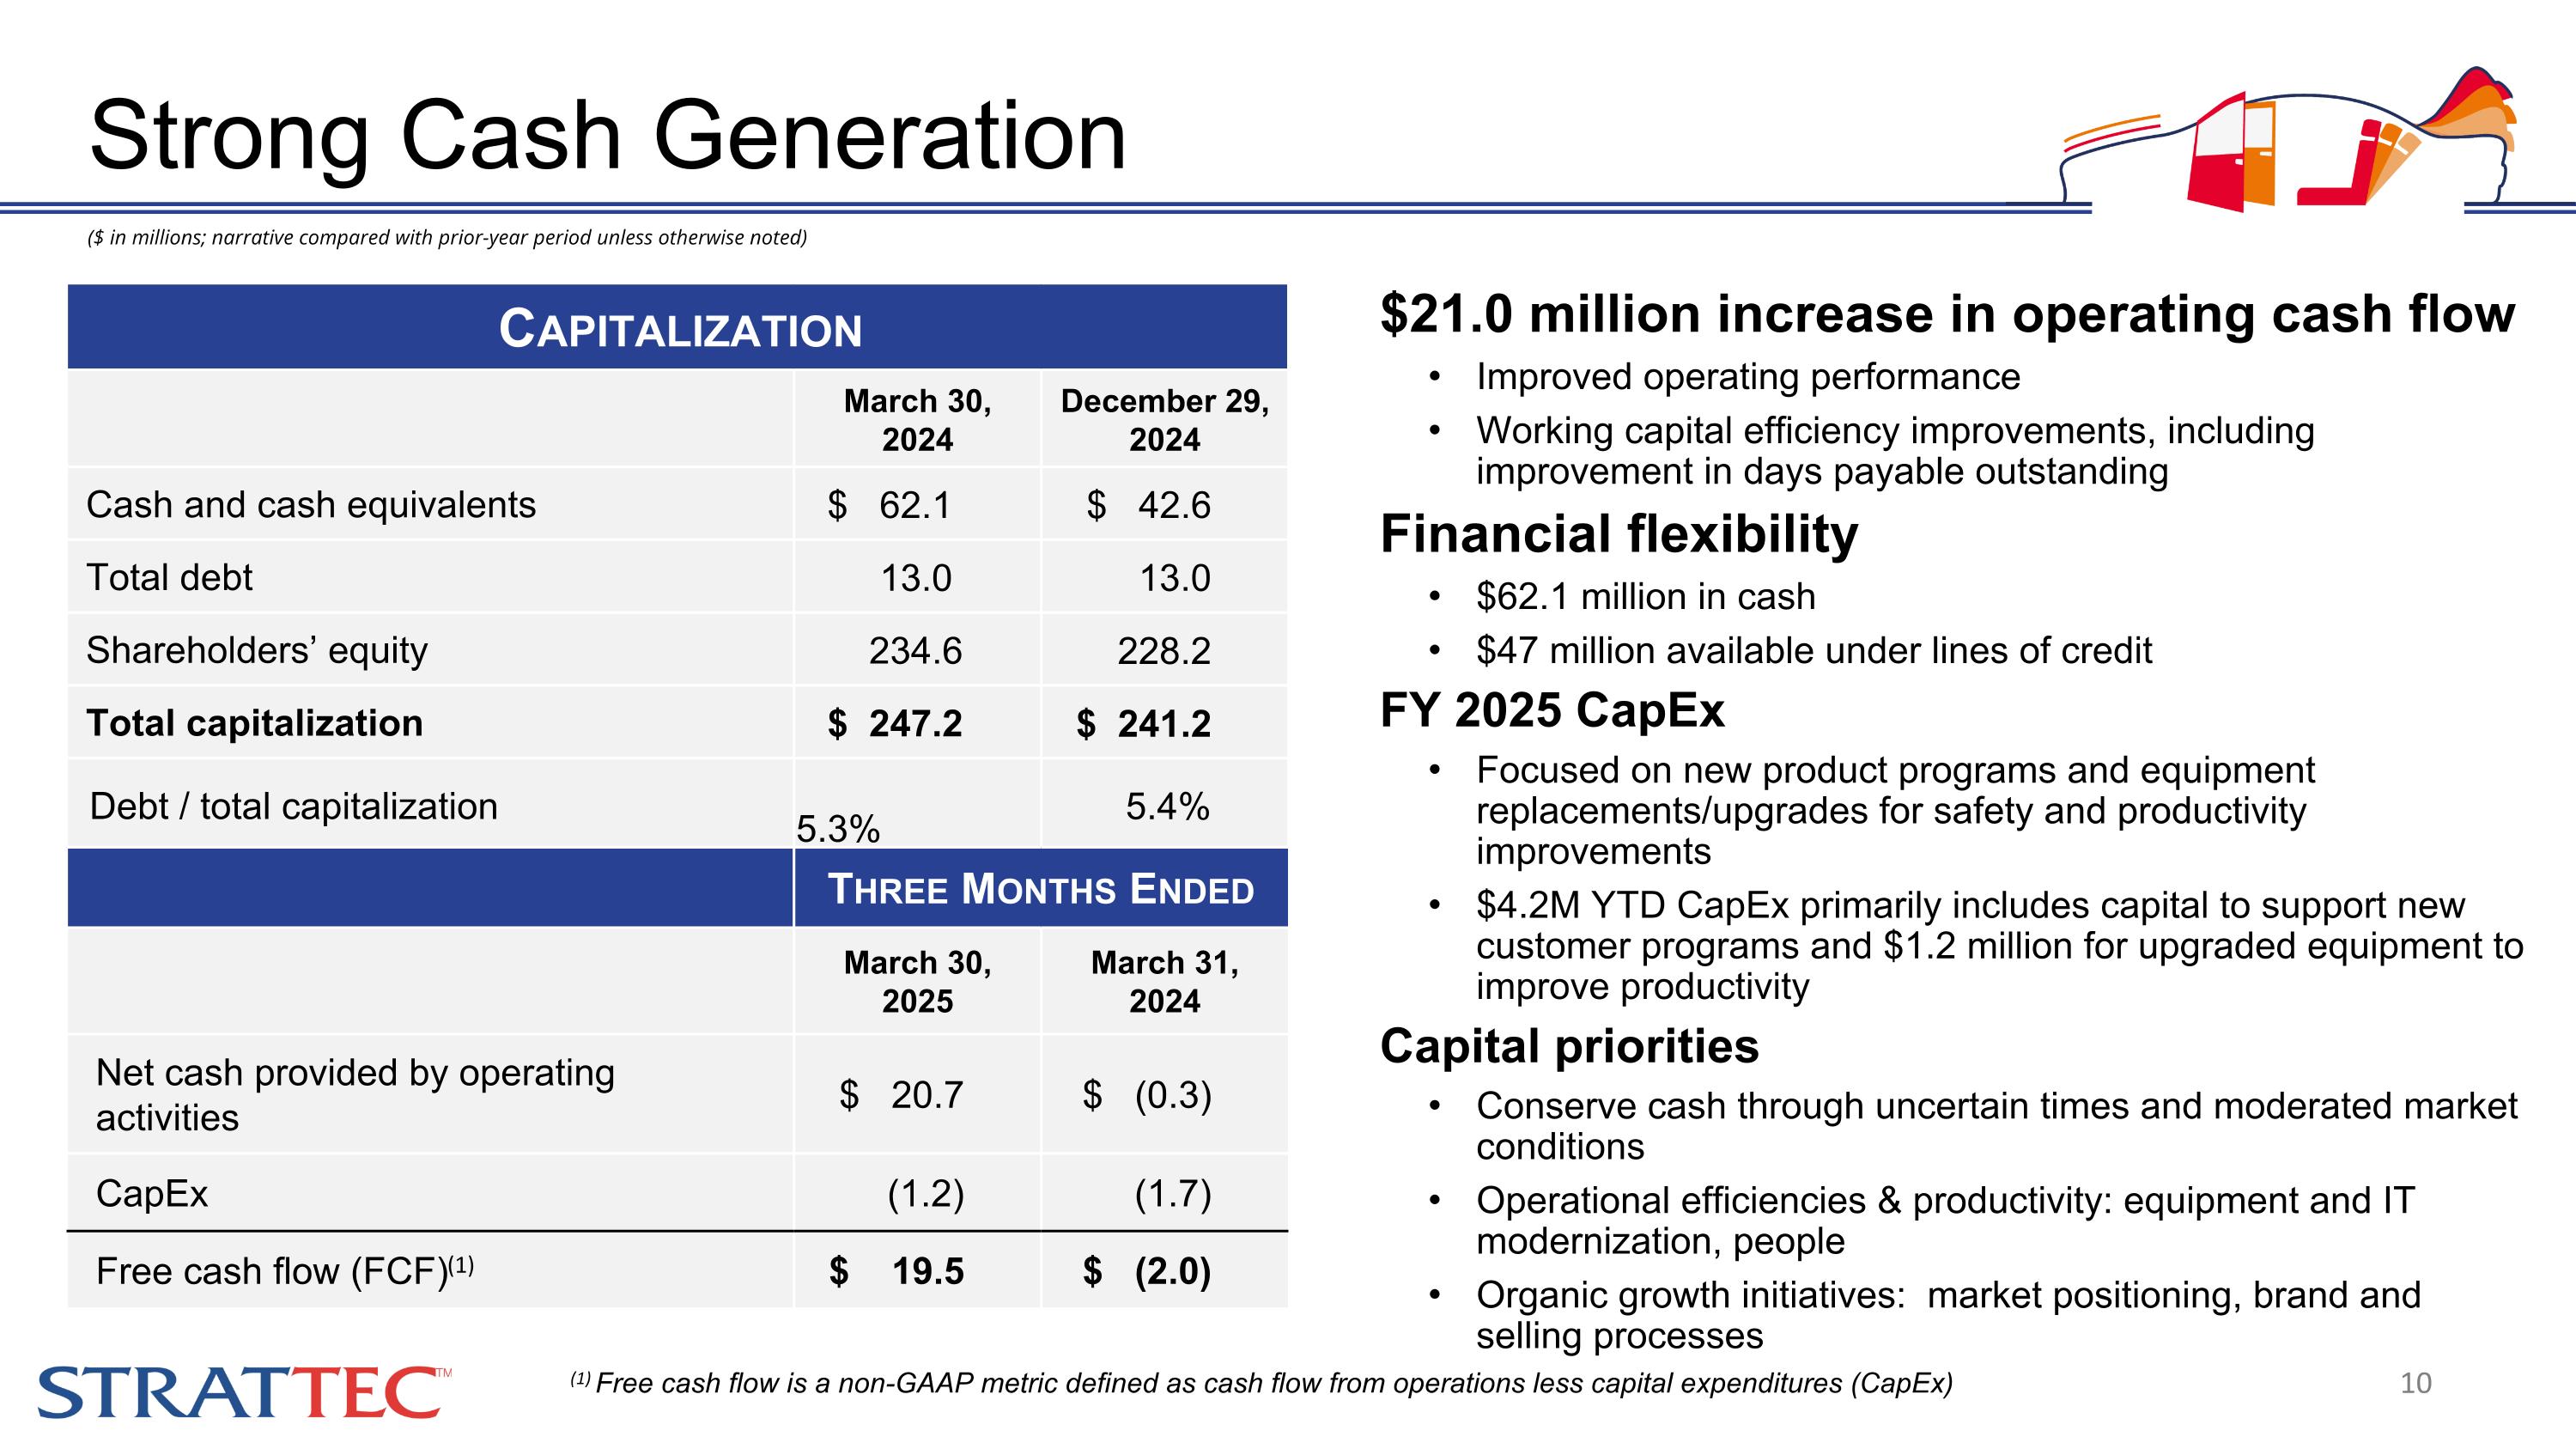
$21.0 million increase in operating cash flow Improved operating performance Working capital efficiency improvements, including improvement in days payable outstanding Financial flexibility $62.1 million in cash $47 million available under lines of credit FY 2025 CapEx Focused on new product programs and equipment replacements/upgrades for safety and productivity improvements $4.2M YTD CapEx primarily includes capital to support new customer programs and $1.2 million for upgraded equipment to improve productivity Capital priorities Conserve cash through uncertain times and moderated market conditions Operational efficiencies & productivity: equipment and IT modernization, people Organic growth initiatives: market positioning, brand and selling processes Capitalization March 30, 2024 December 29, 2024 Cash and cash equivalents $ 62.1 $ 42.6 Total debt 13.0 13.0 Shareholders’ equity 234.6 228.2 Total capitalization $ 247.2 $ 241.2 Debt / total capitalization 5.3% 5.4% Three Months Ended March 30, 2025 March 31, 2024 Net cash provided by operating activities $ 20.7 $ (0.3) CapEx (1.2) (1.7) Free cash flow (FCF)(1) $ 19.5 $ (2.0) ($ in millions; narrative compared with prior-year period unless otherwise noted) (1) Free cash flow is a non-GAAP metric defined as cash flow from operations less capital expenditures (CapEx) Strong Cash Generation
www.strattec.com Q3 FY2025 Financial Results Supplemental Slides
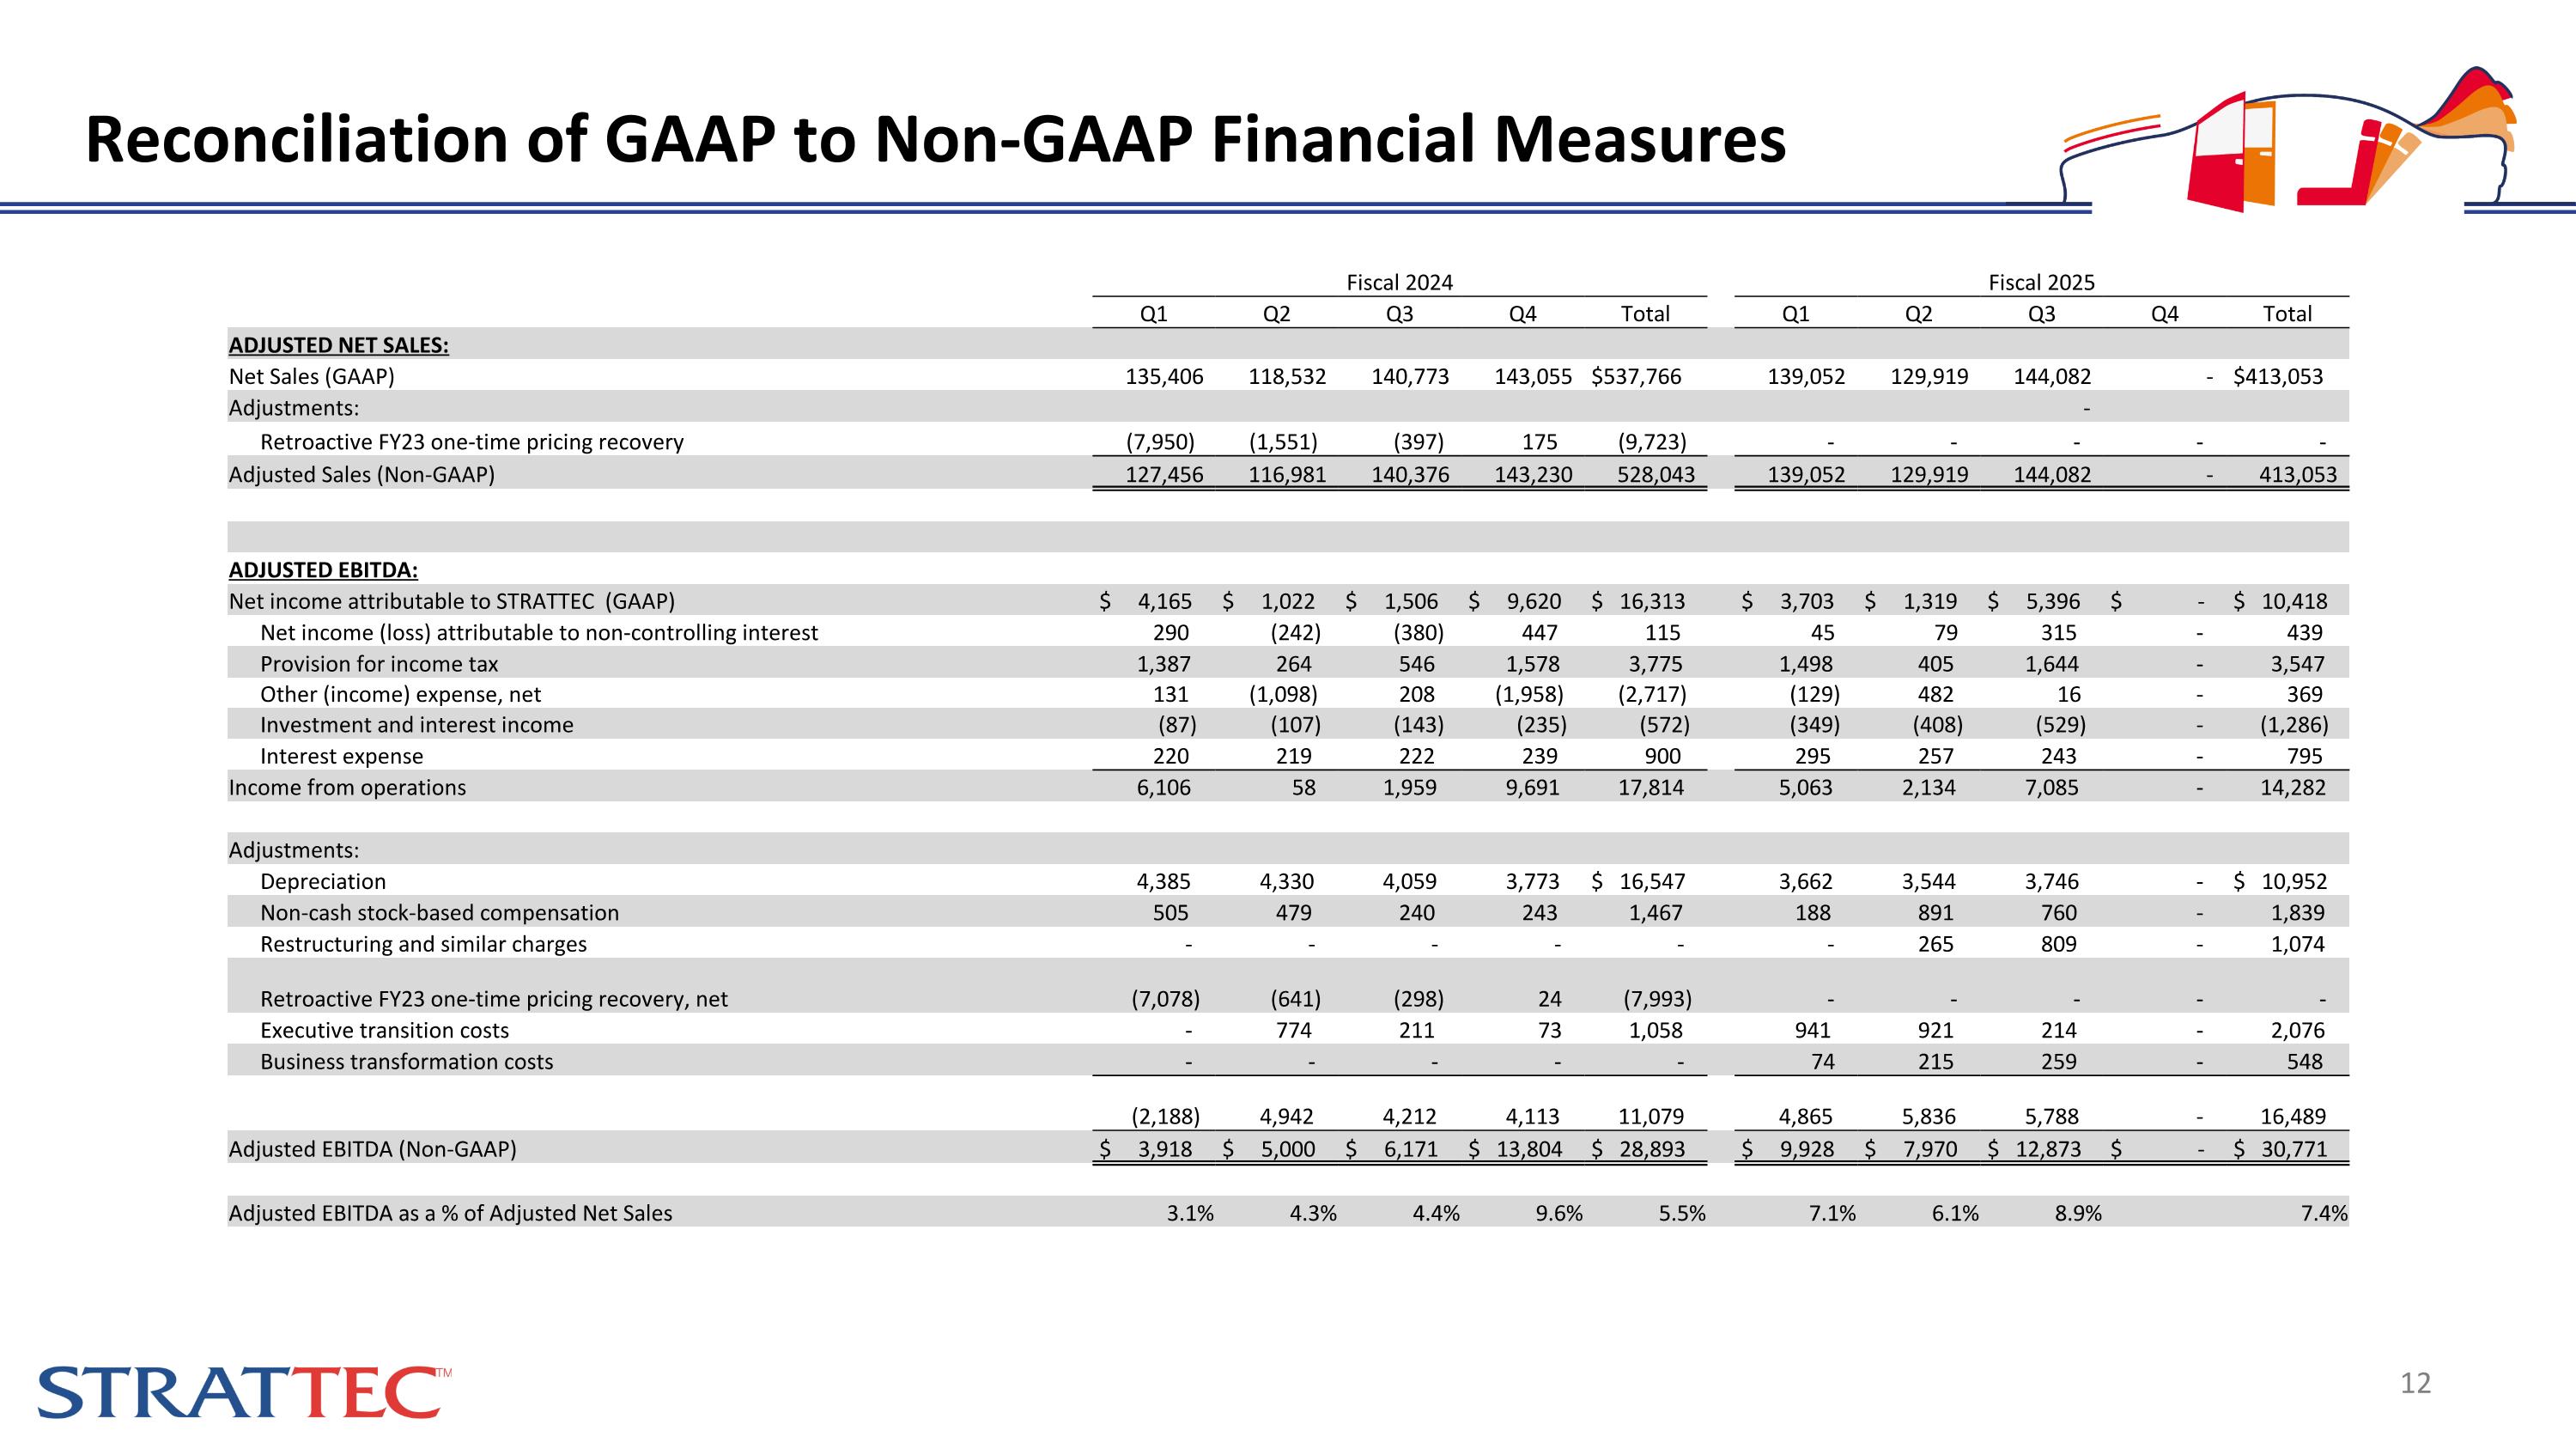
Reconciliation of GAAP to Non-GAAP Financial Measures Fiscal 2024 Fiscal 2025 Q1 Q2 Q3 Q4 Total Q1 Q2 Q3 Q4 Total ADJUSTED NET SALES: Net Sales (GAAP) 135,406 118,532 140,773 143,055 $537,766 139,052 129,919 144,082 - $413,053 Adjustments: - Retroactive FY23 one-time pricing recovery (7,950) (1,551) (397) 175 (9,723) - - - - - Adjusted Sales (Non-GAAP) 127,456 116,981 140,376 143,230 528,043 139,052 129,919 144,082 - 413,053 ADJUSTED EBITDA: Net income attributable to STRATTEC (GAAP) $ 4,165 $ 1,022 $ 1,506 $ 9,620 $ 16,313 $ 3,703 $ 1,319 $ 5,396 $ - $ 10,418 Net income (loss) attributable to non-controlling interest 290 (242) (380) 447 115 45 79 315 - 439 Provision for income tax 1,387 264 546 1,578 3,775 1,498 405 1,644 - 3,547 Other (income) expense, net 131 (1,098) 208 (1,958) (2,717) (129) 482 16 - 369 Investment and interest income (87) (107) (143) (235) (572) (349) (408) (529) - (1,286) Interest expense 220 219 222 239 900 295 257 243 - 795 Income from operations 6,106 58 1,959 9,691 17,814 5,063 2,134 7,085 - 14,282 Adjustments: Depreciation 4,385 4,330 4,059 3,773 $ 16,547 3,662 3,544 3,746 - $ 10,952 Non-cash stock-based compensation 505 479 240 243 1,467 188 891 760 - 1,839 Restructuring and similar charges - - - - - - 265 809 - 1,074 Retroactive FY23 one-time pricing recovery, net (7,078) (641) (298) 24 (7,993) - - - - - Executive transition costs - 774 211 73 1,058 941 921 214 - 2,076 Business transformation costs - - - - - 74 215 259 - 548 (2,188) 4,942 4,212 4,113 11,079 4,865 5,836 5,788 - 16,489 Adjusted EBITDA (Non-GAAP) $ 3,918 $ 5,000 $ 6,171 $ 13,804 $ 28,893 $ 9,928 $ 7,970 $ 12,873 $ - $ 30,771 Adjusted EBITDA as a % of Adjusted Net Sales 3.1% 4.3% 4.4% 9.6% 5.5% 7.1% 6.1% 8.9% 7.4%
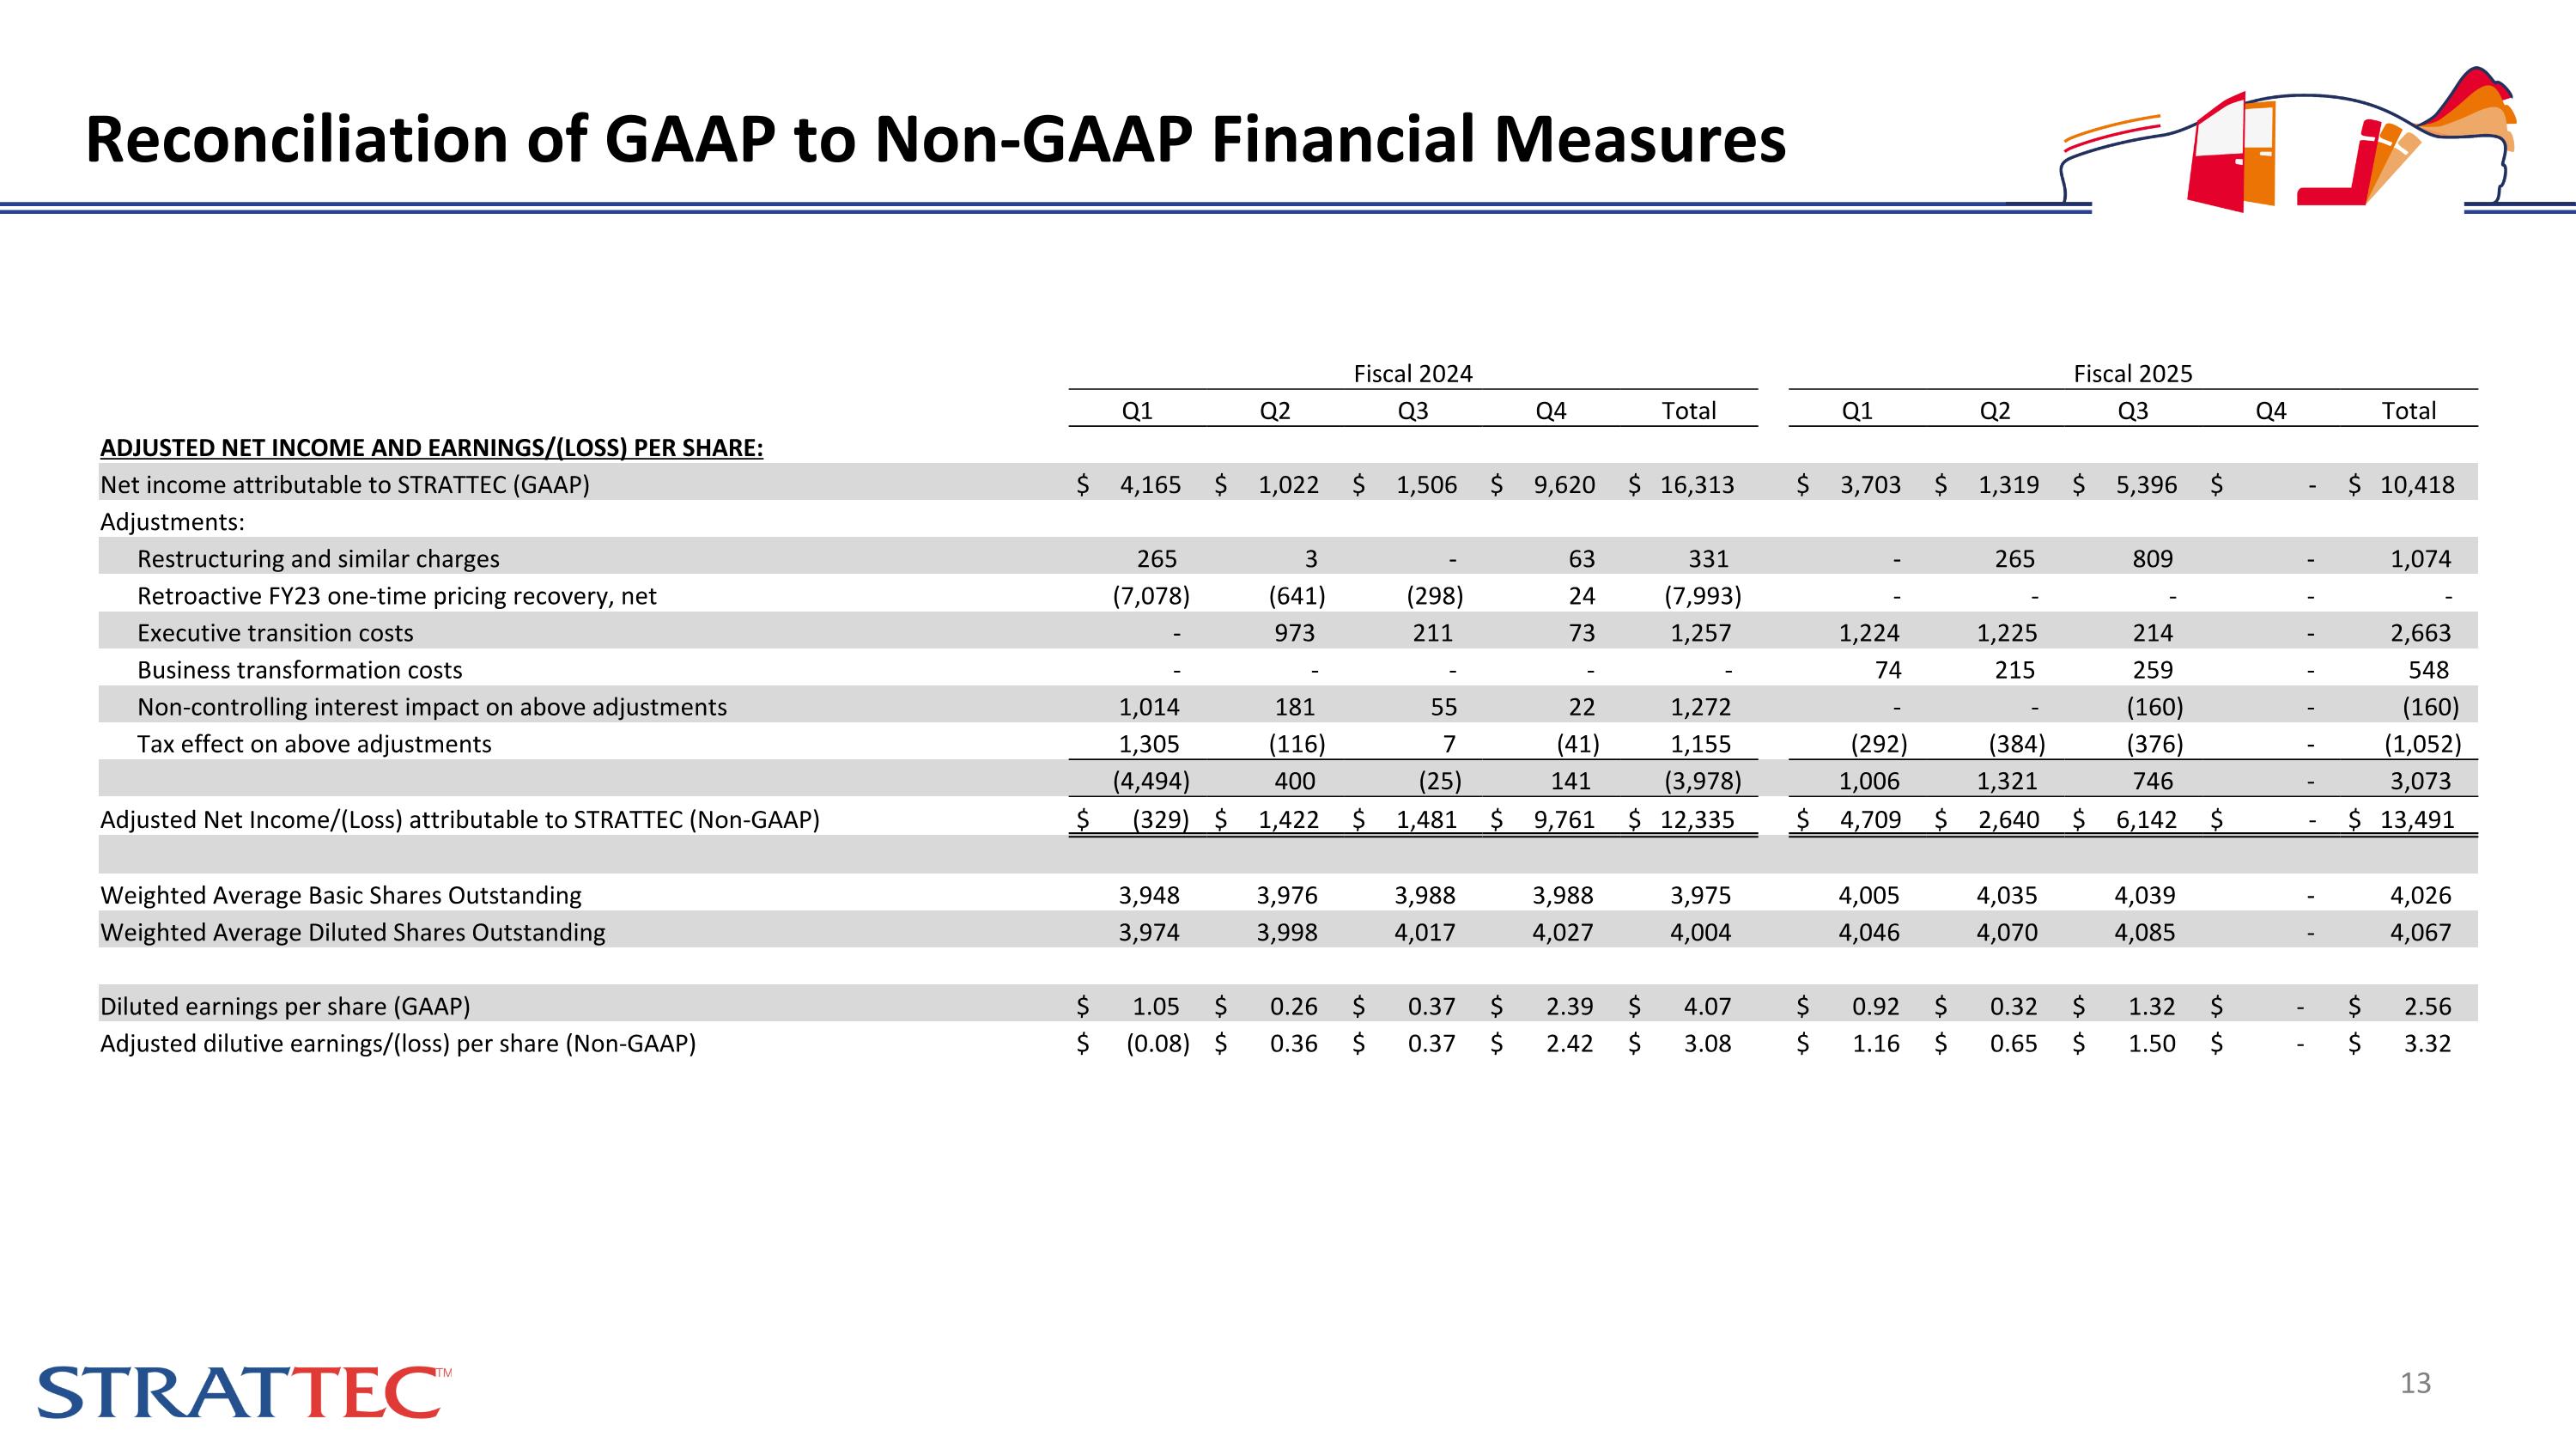
Reconciliation of GAAP to Non-GAAP Financial Measures Fiscal 2024 Fiscal 2025 Q1 Q2 Q3 Q4 Total Q1 Q2 Q3 Q4 Total ADJUSTED NET INCOME AND EARNINGS/(LOSS) PER SHARE: Net income attributable to STRATTEC (GAAP) $ 4,165 $ 1,022 $ 1,506 $ 9,620 $ 16,313 $ 3,703 $ 1,319 $ 5,396 $ - $ 10,418 Adjustments: Restructuring and similar charges 265 3 - 63 331 - 265 809 - 1,074 Retroactive FY23 one-time pricing recovery, net (7,078) (641) (298) 24 (7,993) - - - - - Executive transition costs - 973 211 73 1,257 1,224 1,225 214 - 2,663 Business transformation costs - - - - - 74 215 259 - 548 Non-controlling interest impact on above adjustments 1,014 181 55 22 1,272 - - (160) - (160) Tax effect on above adjustments 1,305 (116) 7 (41) 1,155 (292) (384) (376) - (1,052) (4,494) 400 (25) 141 (3,978) 1,006 1,321 746 - 3,073 Adjusted Net Income/(Loss) attributable to STRATTEC (Non-GAAP) $ (329) $ 1,422 $ 1,481 $ 9,761 $ 12,335 $ 4,709 $ 2,640 $ 6,142 $ - $ 13,491 Weighted Average Basic Shares Outstanding 3,948 3,976 3,988 3,988 3,975 4,005 4,035 4,039 - 4,026 Weighted Average Diluted Shares Outstanding 3,974 3,998 4,017 4,027 4,004 4,046 4,070 4,085 - 4,067 Diluted earnings per share (GAAP) $ 1.05 $ 0.26 $ 0.37 $ 2.39 $ 4.07 $ 0.92 $ 0.32 $ 1.32 $ - $ 2.56 Adjusted dilutive earnings/(loss) per share (Non-GAAP) $ (0.08) $ 0.36 $ 0.37 $ 2.42 $ 3.08 $ 1.16 $ 0.65 $ 1.50 $ - $ 3.32
Q3 FY2025 Financial Results May 8, 2025 Nasdaq: STRT www.strattec.com Investor Relations Contact: Deborah K. Pawlowski, Alliance Advisors IR 716-843-3908 dpawlowski@Allianceadvisors.com