Pay vs Performance Disclosure - USD ($)
Jan. 31, 2025
Jan. 31, 2024
Jan. 31, 2023
Jan. 31, 2022
Jan. 31, 2021
| Pay Versus Performance | ||||||||||||||||||||||||||
| Year (1) | Summary Compensation Table Total for PEO (2) | Compensation Actually Paid for PEO (3) | Average Summary Compensation Table Total for Non-PEO NEOs (4) | Average Compensation Actually Paid for Non-PEO NEOs (5) | Value of Initial Fixed $100 Investment Based On: | Net Income | Company-Selected Measure: Revenue (8) | |||||||||||||||||||
| Total Shareholder Return (6) | Peer Group Total Shareholder Return (7) | |||||||||||||||||||||||||
| 2025 | $23,319,458 | $24,437,894 | $7,400,901 | $7,644,207 | $74 | $280 | $28,000,000 | $2,610,000,000 | ||||||||||||||||||
| 2024 | $30,012,225 | $30,397,098 | $7,739,145 | $7,822,230 | $65 | $219 | -$355,000,000 | $2,263,000,000 | ||||||||||||||||||
| 2023 | $412,190 | -$21,077,609 | $11,677,001 | -$425,392 | $57 | $146 | -$815,000,000 | $1,858,000,000 | ||||||||||||||||||
| 2022 | $31,820,477 | $7,266,404 | $15,547,789 | $6,358,859 | $155 | $173 | -$848,000,000 | $1,300,000,000 | ||||||||||||||||||
| 2021 | $12,131,012 | $188,220,074 | $5,622,552 | $54,801,184 | $202 | $137 | -$266,000,000 | $835,000,000 | ||||||||||||||||||
| Fiscal Year | PEO (CEO) | Non-PEO NEOs | ||||||||||||
| 2025 | Todd McKinnon | Brett Tighe, Jon Addison, Shibu Ninan, Larissa Schwartz | ||||||||||||
| 2024 | Todd McKinnon | Brett Tighe, Jon Addison, Shibu Ninan, Larissa Schwartz | ||||||||||||
| 2023 | Todd McKinnon | Jonathan Runyan, Brett Tighe, Susan St. Ledger, Shibu Ninan | ||||||||||||
| 2022 | Todd McKinnon | William Losch, J. Frederic Kerrest, Jonathan Runyan, Brett Tighe, Susan St. Ledger, Michael Kourey | ||||||||||||
| 2021 | Todd McKinnon | William Losch, J. Frederic Kerrest, Charles Race, Jonathan Runyan | ||||||||||||
| PEO | |||||||||||||||||||||||
Fiscal 2021 | Fiscal 2022 | Fiscal 2023 | Fiscal 2024 | Fiscal 2025 | |||||||||||||||||||
| Summary Compensation Table - Total Compensation | (a) | $12,131,012 | $31,820,477 | $412,190 | $30,012,225 | $23,319,458 | |||||||||||||||||
| — | Grant Date Fair Value of Stock Awards and Option Awards Granted in Fiscal Year | (b) | $11,851,866 | $31,311,842 | $0 | $29,530,934 | -$22,830,706 | ||||||||||||||||
| + | Fair Value at Fiscal Year End of Outstanding and Unvested Stock Awards and Option Awards Granted in Fiscal Year | (c) | $24,600,742 | $18,370,703 | $0 | $25,972,540 | $18,477,188 | ||||||||||||||||
| + | Change in Fair Value of Outstanding and Unvested Stock Awards and Option Awards Granted in Prior Fiscal Years | (d) | $74,645,323 | -$6,877,916 | -$12,500,749 | $528,230 | $2,878,384 | ||||||||||||||||
| + | Fair Value at Vesting of Stock Awards and Option Awards Granted in Fiscal Year That Vested During Fiscal Year | (e) | $378,989 | $0 | $0 | $2,559,648 | $1,237,653 | ||||||||||||||||
| + | Change in Fair Value as of Vesting Date of Stock Awards and Option Awards Granted in Prior Fiscal Years For Which Applicable Vesting Conditions Were Satisfied During Fiscal Year | (f) | $88,315,874 | -$4,735,019 | -$8,989,050 | $855,389 | $1,355,917 | ||||||||||||||||
| — | Fair Value as of Prior Fiscal Year End of Stock Awards and Option Awards Granted in Prior Fiscal Years That Failed to Meet Applicable Vesting Conditions During Fiscal Year | (g) | $0 | $0 | $0 | $0 | $0 | ||||||||||||||||
| = | Compensation Actually Paid | $188,220,074 | $7,266,404 | -$21,077,609 | $30,397,098 | $24,437,894 | |||||||||||||||||
a.Represents total compensation as reported in the Summary Compensation Table for the indicated fiscal year.
b.Represents the aggregate grant date fair value of the stock awards and option awards granted to our PEO during the indicated fiscal year, computed in accordance with ASC Topic 718.
c.Represents the aggregate fair value as of the indicated fiscal year-end of our PEO's outstanding and unvested stock awards and option awards granted during such fiscal year, computed in accordance with ASC Topic 718.
d.Represents the aggregate change in fair value (from the prior fiscal year-end) during the indicated fiscal year of the outstanding and unvested stock awards and option awards held by our PEO as of the last day of the indicated fiscal year, computed in accordance with ASC Topic 718 and, for awards subject to performance-based vesting conditions, based on the probable outcome of such performance-based vesting conditions as of the last day of the indicated fiscal year.
e.Represents the aggregate fair value at vesting of the stock awards and option awards that were granted to our PEO and vested during the indicated fiscal year, computed in accordance with ASC Topic 718.
f.Represents the aggregate change in fair value, measured from the prior fiscal year-end to the vesting date, of each stock award and option award held by our PEO that was granted in a prior fiscal year and which vested during the indicated fiscal year, computed in accordance with ASC Topic 718.
g.Represents the aggregate fair value as of the last day of the prior fiscal year of our PEO's stock awards and option awards that were granted in a prior fiscal year and which failed to meet the applicable vesting conditions in the indicated fiscal year, computed in accordance with ASC Topic 718.
| Non-PEO NEO Average | |||||||||||||||||||||||
Fiscal 2021 | Fiscal 2022 | Fiscal 2023 | Fiscal 2024 | Fiscal 2025 | |||||||||||||||||||
| Summary Compensation Table - Total Compensation | (a) | $5,622,552 | $15,547,789 | $11,677,001 | $7,739,145 | $7,400,901 | |||||||||||||||||
| — | Grant Date Fair Value of Stock Awards and Option Awards Granted in Fiscal Year | (b) | $5,233,926 | $14,950,405 | $11,087,422 | $7,078,132 | -$6,664,621 | ||||||||||||||||
| + | Fair Value at Fiscal Year End of Outstanding and Unvested Stock Awards and Option Awards Granted in Fiscal Year | (c) | $10,801,563 | $6,586,929 | $4,189,535 | $6,013,279 | $5,285,270 | ||||||||||||||||
| + | Change in Fair Value of Outstanding and Unvested Stock Awards and Option Awards Granted in Prior Fiscal Years | (d) | $23,140,229 | -$1,740,914 | -$2,399,986 | $127,198 | $799,605 | ||||||||||||||||
| + | Fair Value at Vesting of Stock Awards and Option Awards Granted in Fiscal Year That Vested During Fiscal Year | (e) | $323,664 | $2,647,596 | $578,225 | $890,316 | $476,028 | ||||||||||||||||
| + | Change in Fair Value as of Vesting Date of Stock Awards and Option Awards Granted in Prior Fiscal Years For Which Applicable Vesting Conditions Were Satisfied During Fiscal Year | (f) | $20,147,101 | -$940,687 | -$3,382,745 | $130,424 | $347,025 | ||||||||||||||||
| — | Fair Value as of Prior Fiscal Year End of Stock Awards and Option Awards Granted in Prior Fiscal Years That Failed to Meet Applicable Vesting Conditions During Fiscal Year | (g) | $0 | $791,448 | $0 | $0 | $0 | ||||||||||||||||
| = | Compensation Actually Paid | $54,801,184 | $6,358,859 | -$425,392 | $7,822,230 | $7,644,207 | |||||||||||||||||
a.Represents the average total compensation as reported in the Summary Compensation Table for the reported Non-PEO NEOs in the indicated fiscal year.
b.Represents the average aggregate grant date fair value of the stock awards and option awards granted to our Non-PEO NEOs during the indicated fiscal year, computed in accordance with ASC Topic 718.
•In fiscal 2021, our NEOs were given the option to elect to receive all or a portion of their base salary in the form of RSUs that would vest quarterly over a 12-month period. On average, our Non-PEO NEOs elected to receive $314,503 in RSUs in lieu of base salary. This value has been added to the sum of the amount reported in the “Stock Awards” and “Option Awards” columns for fiscal 2021 (as has been the premium payable in RSUs for electing to receive equity in lieu of cash). Since this value (plus the premium) represented compensation that fluctuated in value as it vested, the entire amount has been included in calculating compensation actually paid.
c.Represents the average aggregate fair value as of the indicated fiscal year-end of our Non-PEO NEOs’ outstanding and unvested stock awards and option awards granted during such fiscal year, computed in accordance with ASC Topic 718.
d.Represents the average aggregate change in fair value (from the prior fiscal year-end) during the indicated fiscal year of the outstanding and unvested stock awards and option awards held by our Non-PEO NEOs as of the last day of the indicated fiscal year, computed in accordance with ASC Topic 718 and, for awards subject to performance-based vesting conditions, based on the probable outcome of such performance-based vesting conditions as of the last day of the indicated fiscal year.
e.Represents the average aggregate fair value at vesting of the stock awards and option awards that were granted to our Non-PEO NEOs and vested during the indicated fiscal year, computed in accordance with ASC Topic 718.
f.Represents the average aggregate change in fair value, measured from the prior fiscal year-end to the vesting date, of each stock award and option award held by our Non-PEO NEOs that was granted in a prior fiscal year and which vested during the indicated fiscal year, computed in accordance with ASC Topic 718.
g.Represents the average aggregate fair value as of the last day of the prior fiscal year of our Non-PEO NEOs’ stock awards and option awards that were granted in a prior fiscal year and which failed to meet the applicable vesting conditions in the indicated fiscal year, computed in accordance with ASC Topic 718.
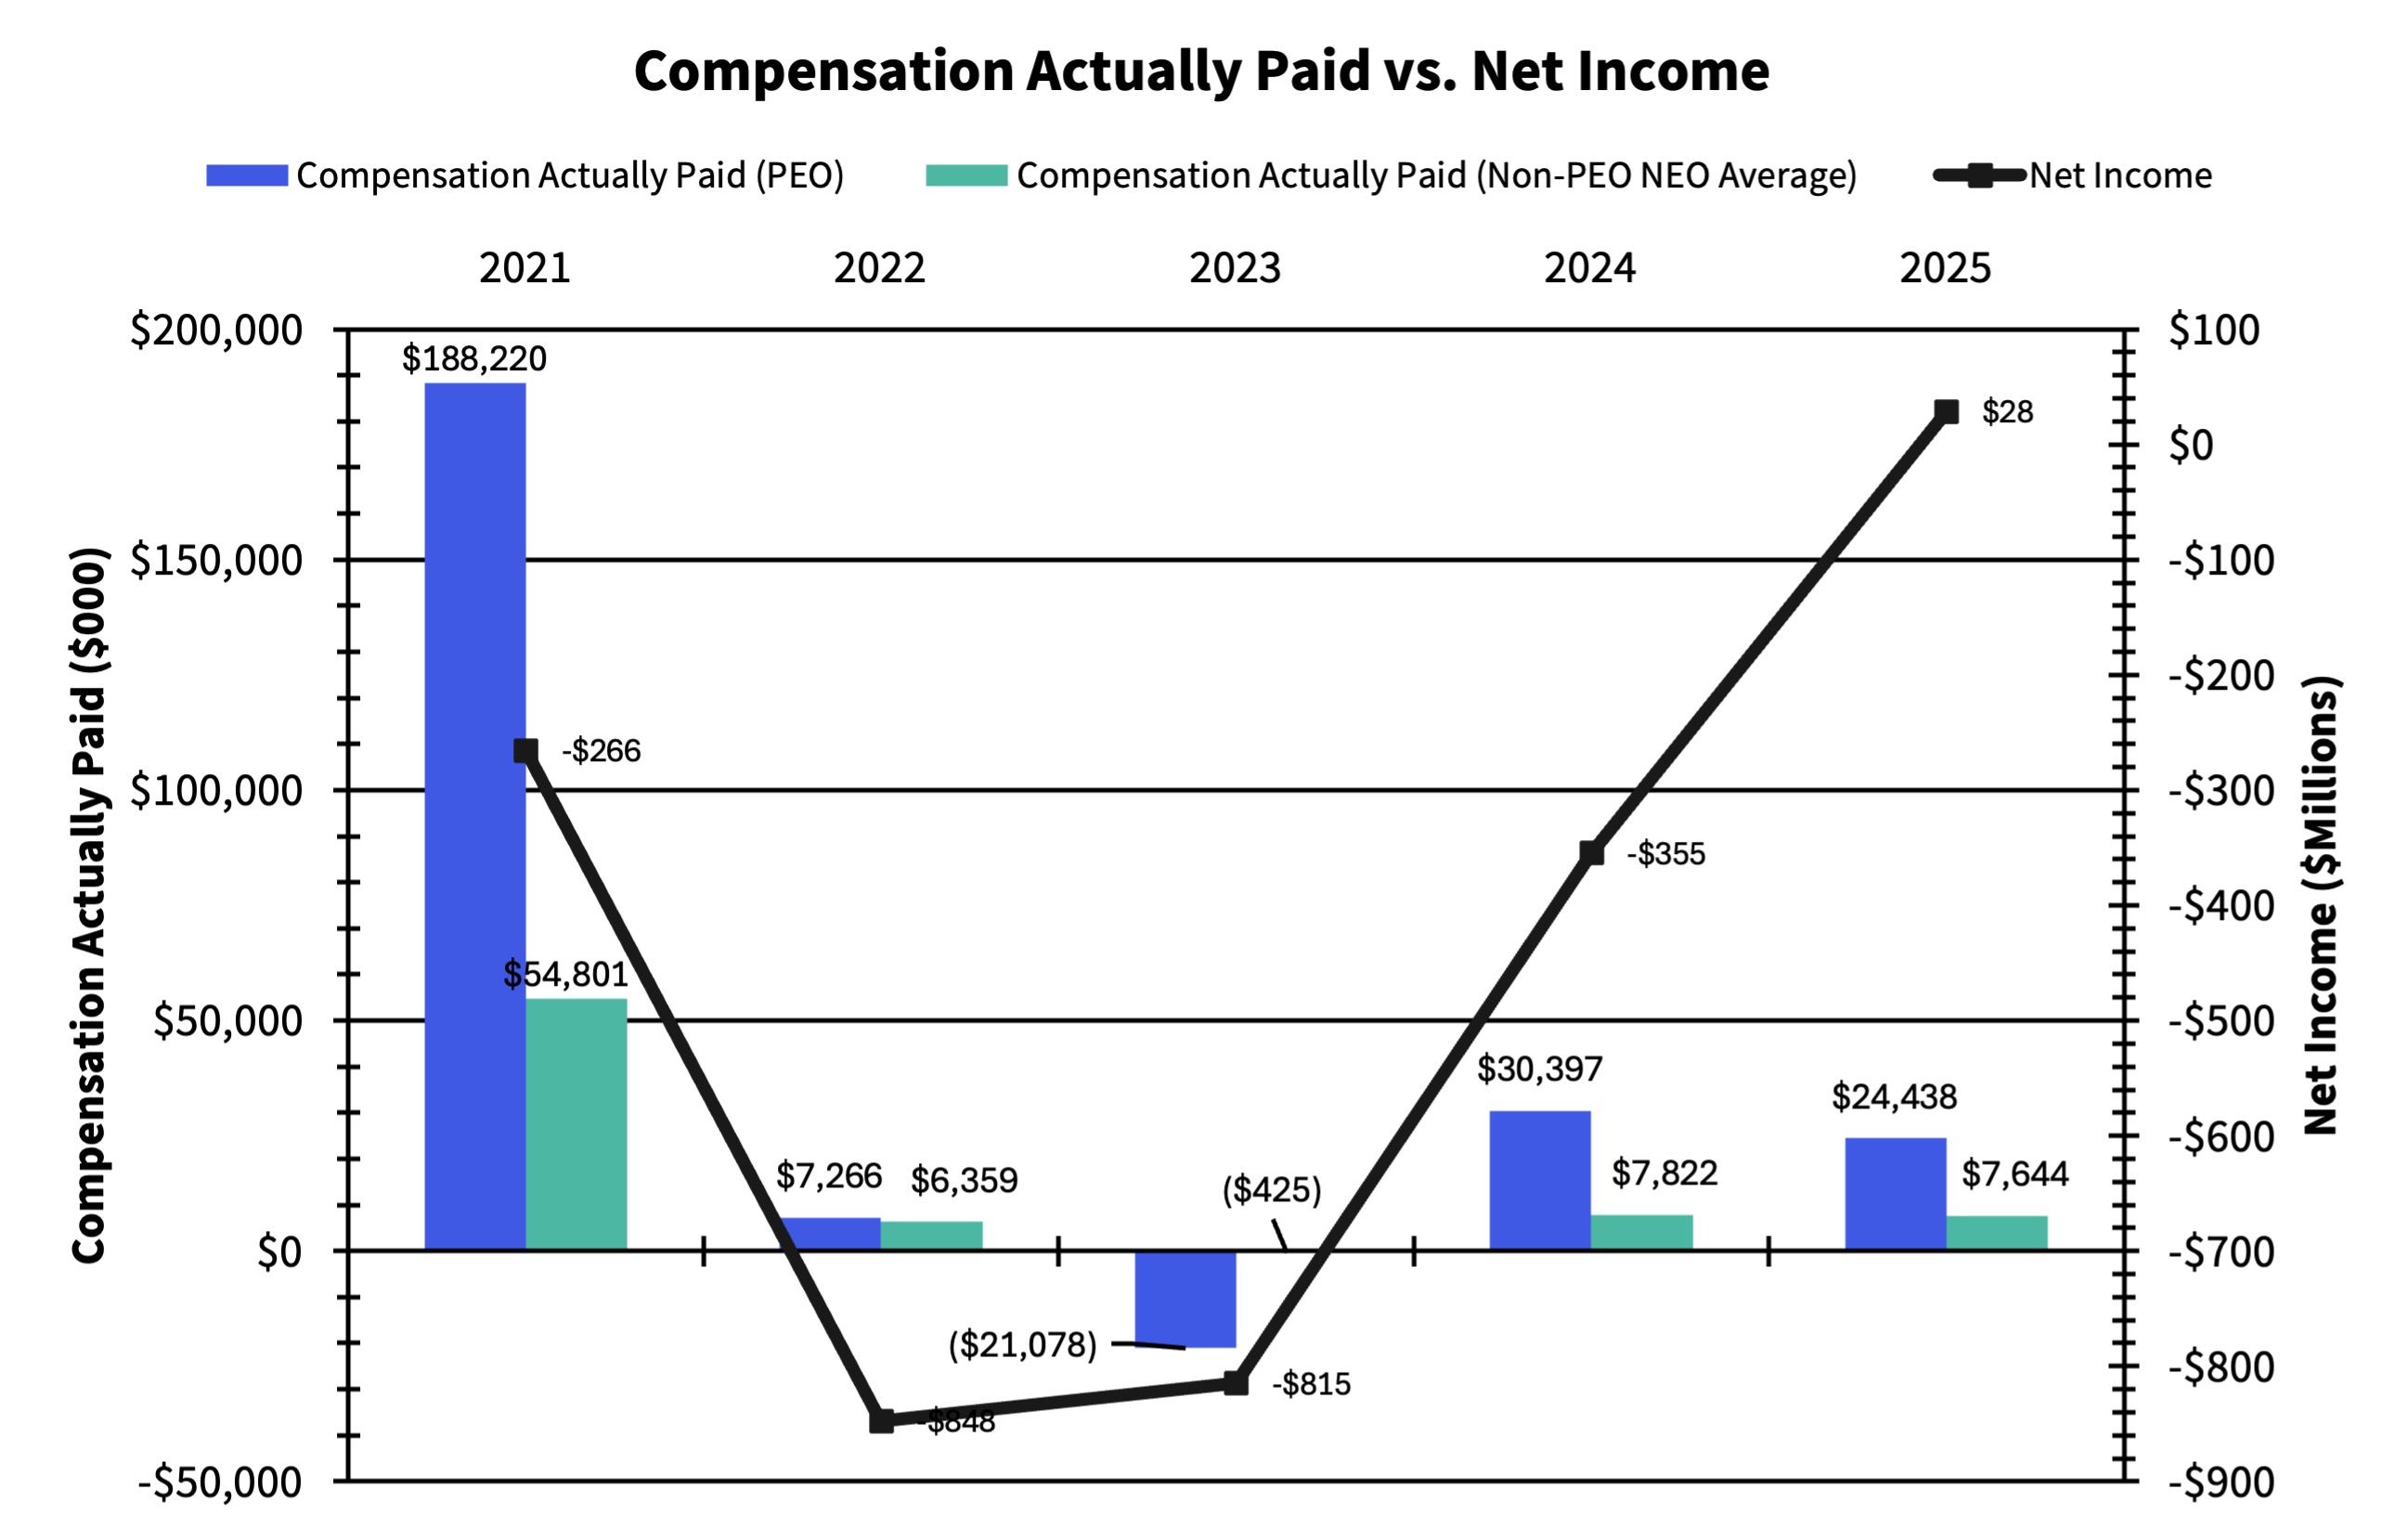
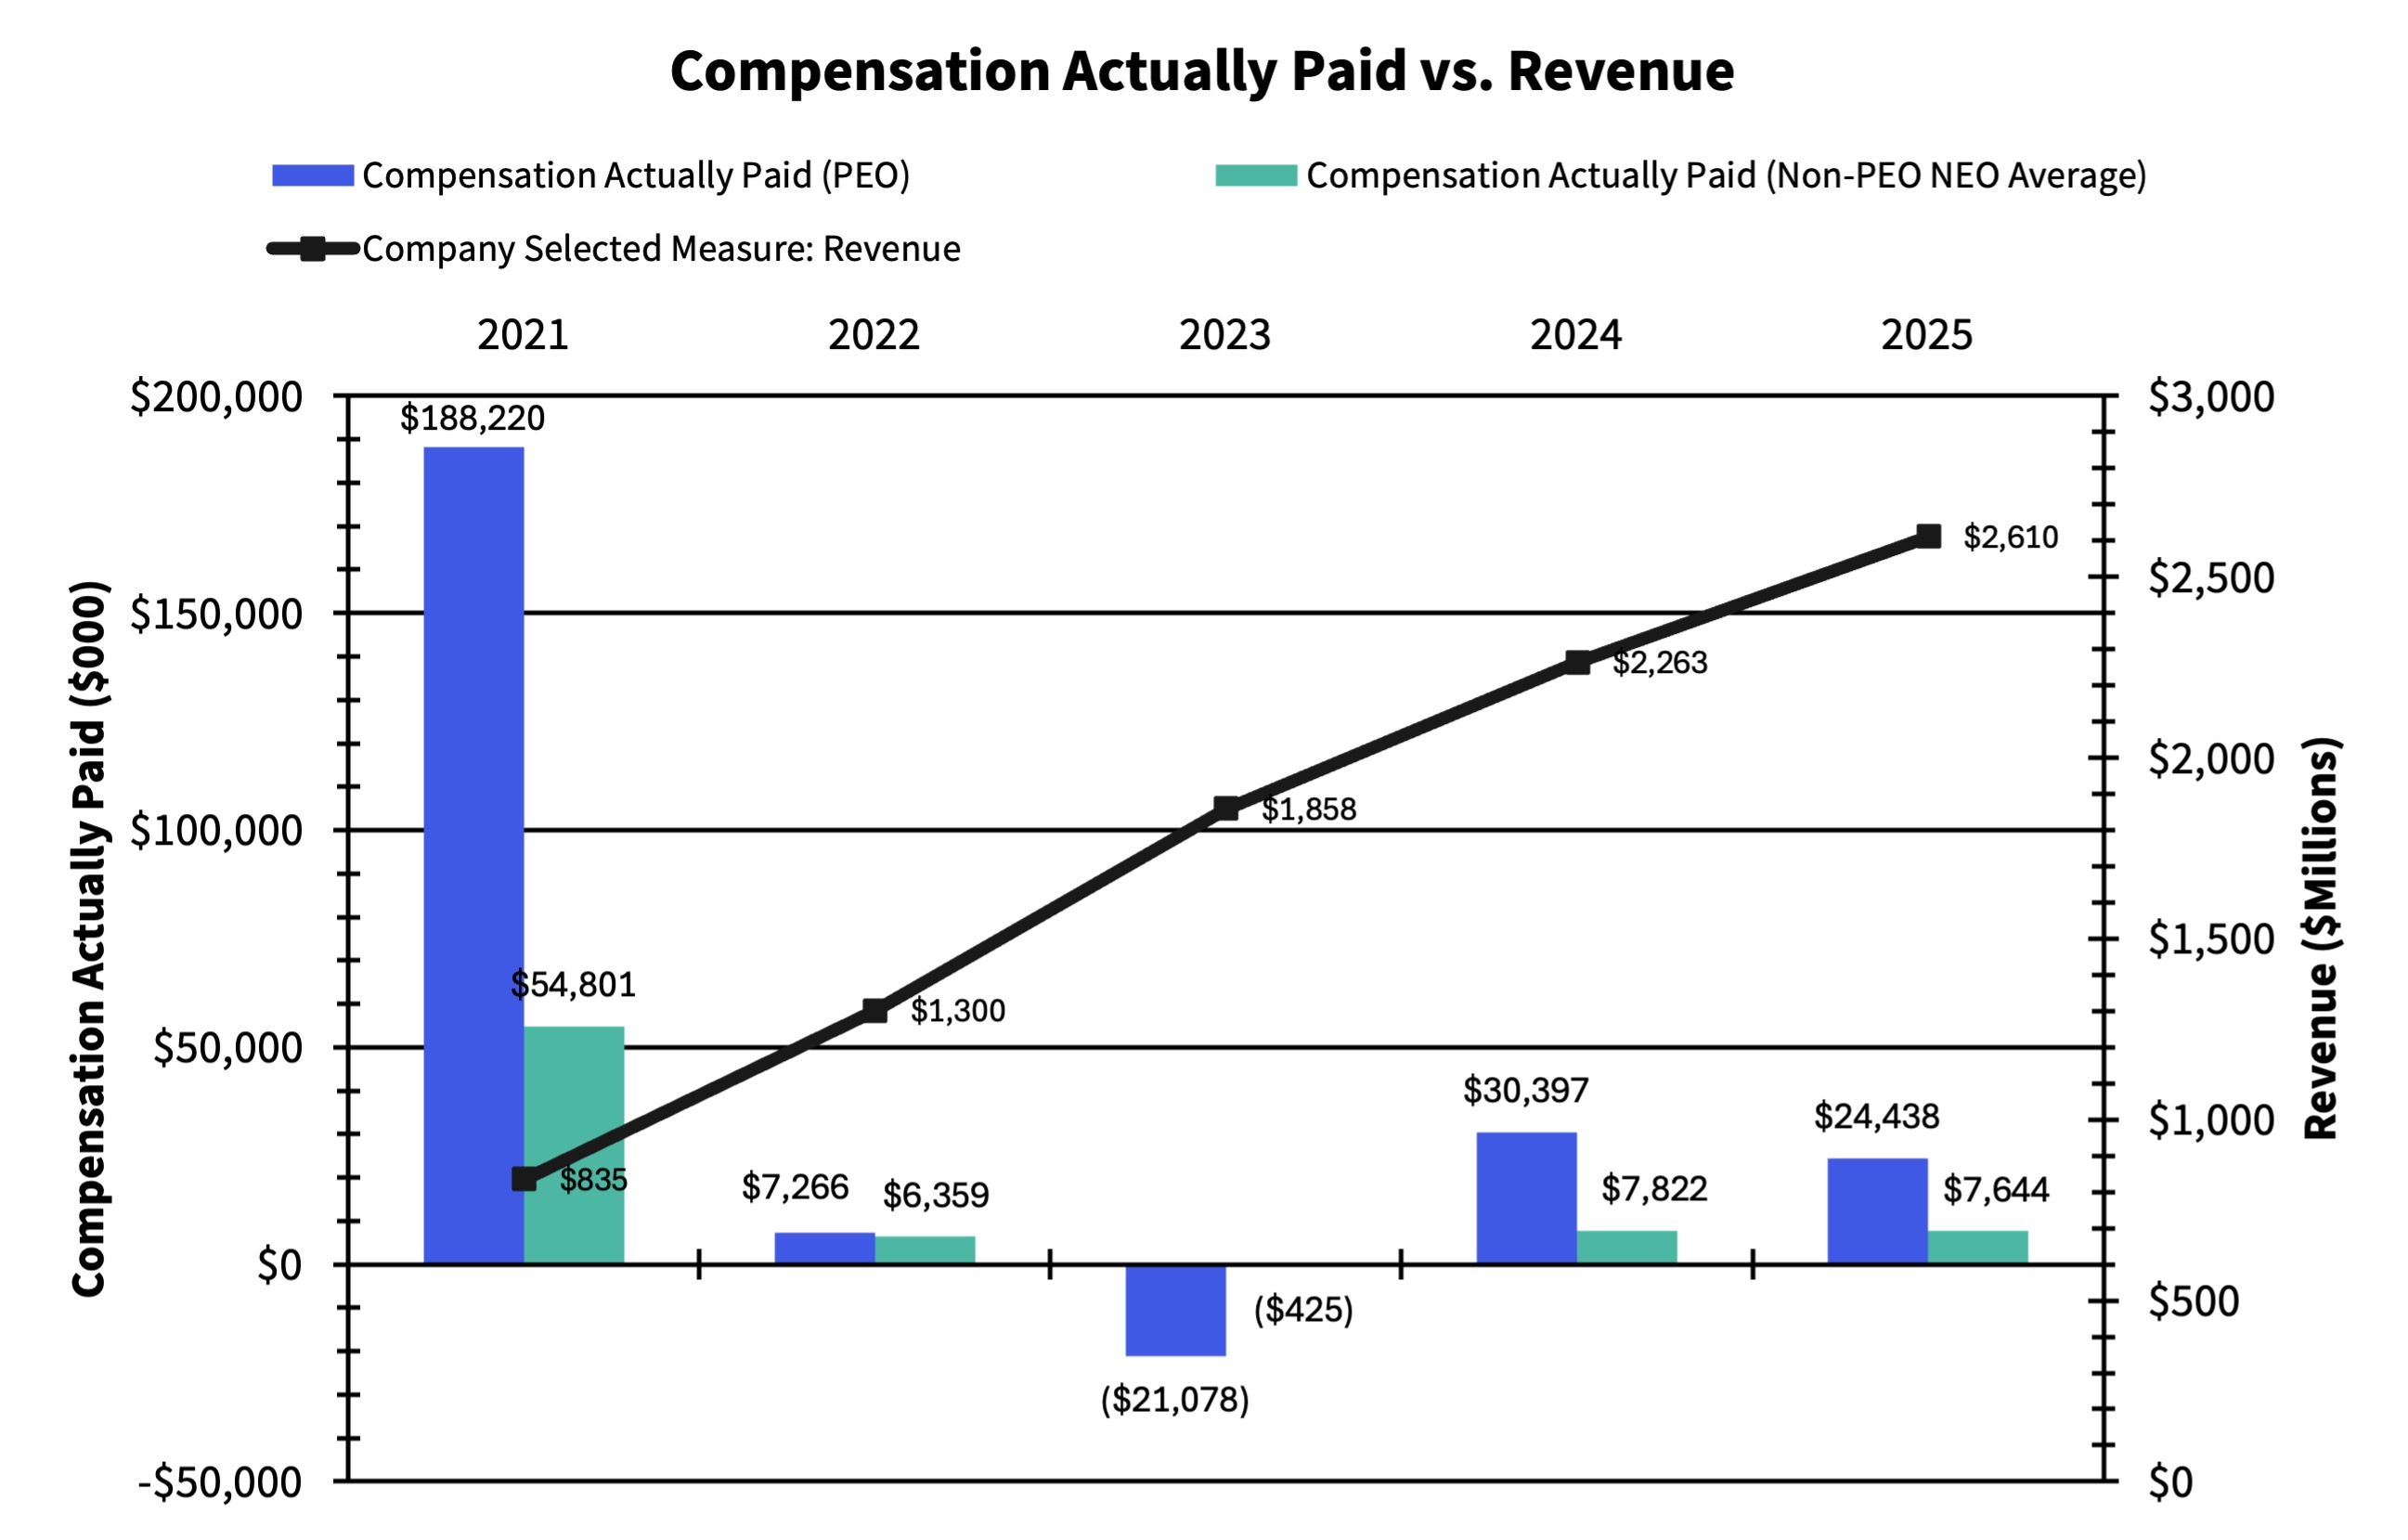
Below are graphs showing the relationship of “Compensation Actually Paid” to our PEO and our non-PEO NEOs in fiscal 2021, 2022, 2023, 2024 and 2025 to (i) the TSR of both our common stock and the S&P 500 Information Technology Index, (ii) our net income and (iii) our revenue.

The following is a list of financial performance measures, which in our assessment represent the most important financial performance measures used by the company to link compensation actually paid to our PEO and our Non-PEO NEOs for fiscal 2025 to company performance:
•Revenue
•Non-GAAP Operating Income
•Relative TSR