| First Quarter 2025 Investor Presentation May 7, 2025 |

| 2 Cautionary Statements Forward Looking Statements Certain statements and information in this presentation (as well as information included in other written or oral statements we make from time to time) may contain or constitute “forward-looking statements” within the meaning of the Private Securities Litigation Reform Act of 1995, Section 27A of the Securities Act of 1933, as amended, and Section 21E of the Securities Exchange Act of 1934, as amended (the “Exchange Act”). The words “believe,” “estimate,” “project,” “expect,” “anticipate,” “affirm,” “plan,” “intend,” “foresee,” “should,” “would,” “could,” “continue,” “committed,” “attempt,” “aim,” “target,” “objective,” “guides,” “seek,” “focus,” “provides guidance,” “provides outlook” or other similar expressions are intended to identify forward-looking statements, which are not historical in nature. These forward-looking statements, including statements about our strategic initiatives and market opportunities, are based on our current expectations and beliefs concerning future developments and their potential effect on us and other information currently available. Such forward-looking statements, because they relate to future events, are by their very nature subject to many important risks and uncertainties that could cause actual results or other events to differ materially from those contemplated. These risks and uncertainties include, but are not limited to: (i) risks relating to our business and industry, such as a deterioration in general economic conditions, including due to inflationary conditions, resulting in reduced consumer confidence and business spending, and a decline in consumer credit worthiness impacting demand for our products; the unpredictability of our operating results, including an inability to anticipate changes in customer inventory management practices and its impact on our business; our failure to retain our existing key customers or identify and attract new customers; the highly competitive, saturated and consolidated nature of our marketplace; our inability to develop, introduce and commercialize new products and services, including due to our inability to undertake research and development activities; new and developing technologies that make our existing technology solutions and products obsolete or less relevant or our failure to introduce new products and services in a timely manner or at all; system security risks, data protection breaches and cyber-attacks; the usage, or lack thereof, of artificial intelligence technologies; disruptions, delays or other failures in our supply chain, including as a result of inflationary pressures, single-source suppliers, failure or inability of suppliers to comply with our code of conduct or contractual requirements, trade restrictions, tariffs, foreign conflicts or political unrest in countries in which our suppliers operate, and our inability to pass related costs on to our customers or difficulty meeting customers’ delivery expectations due to extended lead times; changes in U.S. trade policy and the impact of tariffs on our business and results of operations; interruptions in our operations, including our information technology systems, or in the operations of the third parties that operate computing infrastructure on which we rely; defects in our software and computing systems; disruptions in production at one or more of our facilities due to weather conditions, climate change, political instability, or social unrest; problems in production quality, materials and process and costs relating to product defects and any related product liability and/or warranty claims and damage to our reputation; our inability to recruit, retain and develop qualified personnel, including key personnel, and implement effective succession processes; our substantial indebtedness, including the restrictive terms of our indebtedness and covenants of future agreements governing indebtedness and the resulting restraints on our ability to pursue our business strategies; our inability to make debt service payments or refinance such indebtedness; our inability to successfully execute on acquisitions, including the acquisition of Arroweye, or divestitures or strategic relationships; our status as an accelerated filer and complying with the Sarbanes-Oxley Act of 2002 and the costs associated with such compliance and implementation of procedures thereunder; our failure to maintain effective internal control over financial reporting and risks relating to investor confidence in our financial reporting; environmental, social and governance (“ESG”) preferences and demands of various stakeholders and the related impact on our ability to access capital, produce our products in conformity with stakeholder preferences, comply with stakeholder demands and comply with any related legal or regulatory requirements or restrictions; negative perceptions of our products due to the impact of our products and production processes on the environment and other ESG-related risks; damage to our reputation or brand image; the effects of climate change on our business; our inability to adequately protect our trade secrets and intellectual property rights from misappropriation, infringement claims brought against us and risks related to open source software; our inability to renew licenses with key technology licensors; our limited ability to raise capital, which may lead to delays in innovation or the abandonment of our strategic initiatives; costs and impacts related to additional tax collection efforts by states, unclaimed property laws, or future increases in U.S. federal or state income taxes, resulting in additional expenses which we may be unable to pass along to our customers; our inability to realize the full value of our long-lived assets; costs and potential liabilities associated with compliance or failure to comply with laws and regulations, customer contractual requirements and evolving industry standards regarding consumer privacy and data use and security; our failure to operate our business in accordance with the Payment Card Industry Security Standards Council security standards or other industry standards; the effects of trade restrictions, delays or interruptions in our ability to source raw materials and components used in our products from foreign countries; the effects ongoing foreign conflicts on the global economy; adverse conditions in the banking system and financial markets, including the failure of banks and financial institutions; our failure to comply with environmental, health and safety laws and regulations that apply to our products and the raw materials we use in our production processes; (ii) risks relating to ownership of our common stock, such as those associated with concentrated ownership of our stock by our significant stockholders and potential conflicts of interests with other stockholders; the impact of concentrated ownership of our common stock and the sale or perceived sale of a substantial amount of common stock on the trading volume and market price of our common stock; potential conflicts of interest that may arise due to our board of directors being comprised in part of directors who are principals of or were nominated by our significant stockholders; the influence of securities analysts over the trading market for and price of our common stock, particularly due to the lack of substantial research coverage of our common stock; the impact of stockholder activism or securities litigation on the trading price and volatility of our common stock; certain provisions of our organizational documents and other contractual provisions that may delay or prevent a change in control and make it difficult for stockholders other than our significant stockholders to change the composition of our board of directors; and (iii) general risks, such as relating to our ability to comply with a wide variety of complex evolving laws and regulations and the exposure to liability for any failure to comply; the effect of legal and regulatory proceedings and the adequacy of our insurance policies; and other risks that are described in Part I, Item 1A, Risk Factors in our Annual Report on Form 10-K for the year ended December 31, 2024 filed with the SEC on March 4, 2025, in Part II, Item 1A, Risk Factors of our Quarterly Report on Form 10-Q and our other reports filed from time to time with the Securities and Exchange Commission (the “SEC”). We caution and advise readers not to place undue reliance on forward-looking statements, which speak only as of the date hereof. These statements are based on assumptions that may not be realized and involve risks and uncertainties that could cause actual results or other events to differ materially from the expectations and beliefs contained herein. We undertake no obligation to publicly update or revise any forward-looking statements after the date they are made, whether as a result of new information, future events or otherwise. Non-GAAP Financial Measures In addition to financial results reported in accordance with U.S. generally accepted accounting principles (“GAAP”), we have provided the following non-GAAP financial measures in this release, all reported on a continuing operations basis: EBITDA, Adjusted EBITDA, Adjusted EBITDA margin, Free Cash Flow, LTM Adjusted EBITDA and Net Leverage Ratio. These non-GAAP financial measures are utilized by management in comparing our operating performance on a consistent basis between fiscal periods and serve as a basis for certain Company compensation programs. We believe that these financial measures are appropriate to enhance an overall understanding of our underlying operating performance trends compared to historical and prospective periods and our peers. Management also believes that these measures are useful to investors in their analysis of our results of operations and provide improved comparability between fiscal periods. Non-GAAP financial measures should not be considered in isolation from, or as a substitute for, financial information calculated in accordance with GAAP. Our non-GAAP measures may be different from similarly titled measures of other companies. Investors are encouraged to review the reconciliation of these historical non-GAAP measures to their most directly comparable GAAP financial measures included in the appendix to this presentation. |
| CPI Confidential and Proprietary | Not for distribution 3 Agenda Overview and Strategy Q1 Financial Review 2025 Outlook Summary 1 2 3 4 |

| Overview 4 Strong customer demand in Q1; sales mix impacted margins Strong growth from contactless debit and credit cards Continued growth in Prepaid Arroweye acquisition enhances CPI portfolio 2025 full-year sales and Adjusted EBITDA¹ outlook affirmed Demand strong, although some uncertainty in market environment Implemented cost savings activities in response to tariff and mix impacts Long-term growth trends remain intact U.S. card issuance trends remain healthy Continued strategic focus on gaining share and expanding addressable markets 1) Adjusted EBITDA is not a measurement of financial performance prepared in accordance with GAAP. We have provided non-GAAP Adjusted EBITDA expectations for 2025 because certain reconciling items are dependent on future events that either cannot be controlled or cannot be reliably predicted because they are not part of the Company’s routine activities, any of which could be significant. |

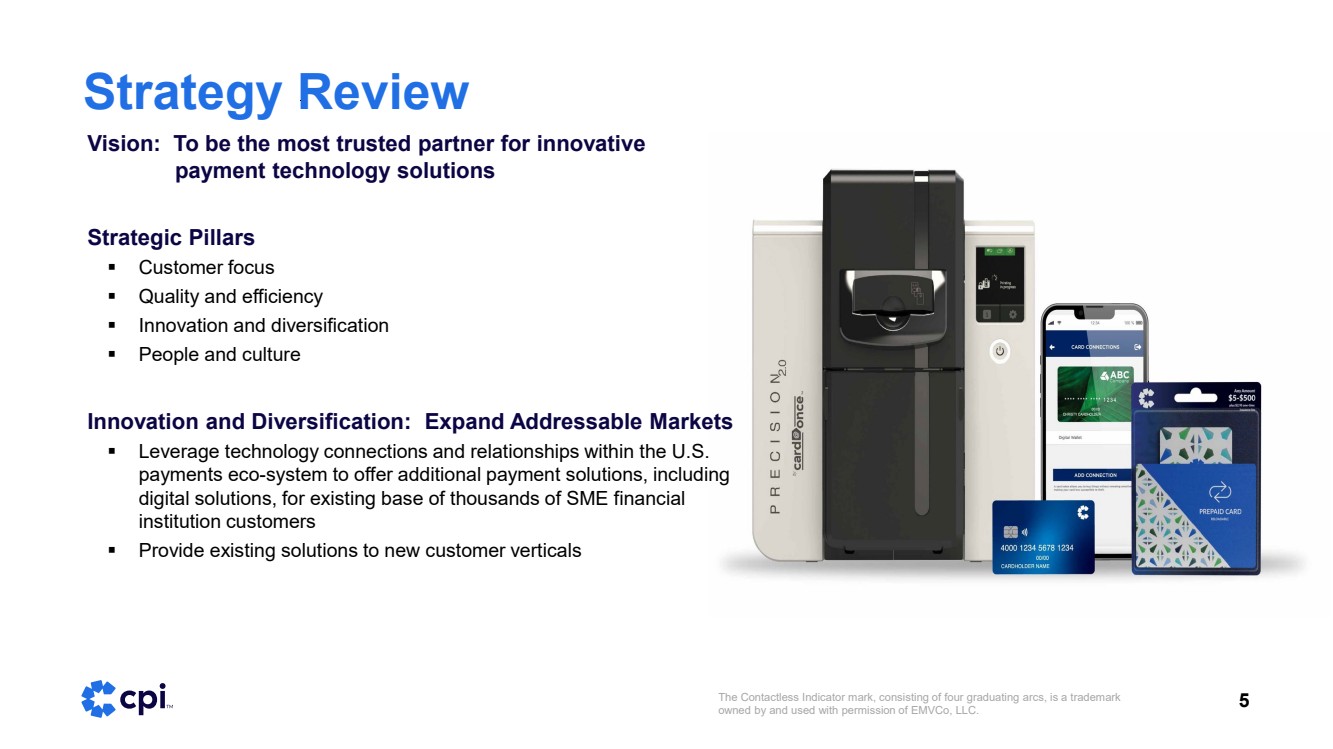
| Strategy Review 5 The Contactless Indicator mark, consisting of four graduating arcs, is a trademark owned by and used with permission of EMVCo, LLC. Strategic Pillars Customer focus Quality and efficiency Innovation and diversification People and culture Innovation and Diversification: Expand Addressable Markets Leverage technology connections and relationships within the U.S. payments eco-system to offer additional payment solutions, including digital solutions, for existing base of thousands of SME financial institution customers Provide existing solutions to new customer verticals Vision: To be the most trusted partner for innovative payment technology solutions |
| Arroweye Acquisition 6 CPI acquired Arroweye Solutions, Inc. on May 6, 2025 A leading provider of digitally-driven on-demand payment card solutions for the U.S. market State-of-the-art production facility in Las Vegas Purchase price of $45.55 million; all-cash transaction Complements CPI’s portfolio of card payment solutions Integrated end-to-end digitally-driven process supports zero-inventory models, hyper-personalization, and rapid turnaround times Complements CPI’s existing production, personalization and fulfillment offerings Opportunity to leverage offerings to customers of both companies Arroweye revenues expected to be in the mid-$50 million range in 2025, on an annualized basis Low double-digit Adjusted EBITDA margins¹ Synergy opportunities in both sales and costs Expect to increase margins closer to CPI levels over time 1) Adjusted EBITDA margin is not a measurement of financial performance prepared in accordance with GAAP. |

| 2025 Q1 Financial Review CPI Confidential and Proprietary | Not for distribution 7 |

| Q1 Highlights 8 Strong sales growth in debit and credit cards and Prepaid; sales mix impacted margins as expected; investment in new production facility Q1 net sales increased 10% to $122.8 million Gross margin decreased from 37.1% to 33.2% Net income decreased 12% to $4.8 million due to lower gross profit and higher interest expense, partially offset by lower operating expenses, and a lower effective tax rate; net income margin decreased from 4.9% to 3.9% Adjusted EBITDA¹ decreased 8% to $21.2 million; Adjusted EBITDA margin¹ decreased from 20.5% to 17.2% Cash provided by operating activities of $5.6 million decreased from $8.9 million in the prior year primarily due to lower net income excluding non-cash items Free Cash Flow¹ generation of $0.3 million decreased from $7.4 million in the prior year, impacted by increased capital spending related to the new production facility 1) Adjusted EBITDA, Adjusted EBITDA margin and Free Cash Flow are not measurements of financial performance prepared in accordance with GAAP. See “Reconciliations of Non-GAAP Financial Measures” at the end of this document for more information and reconciliations to the most directly comparable GAAP financial measures. The Contactless Indicator mark, consisting of four graduating arcs, is a trademark owned by and used with permission of EMVCo, LLC. |

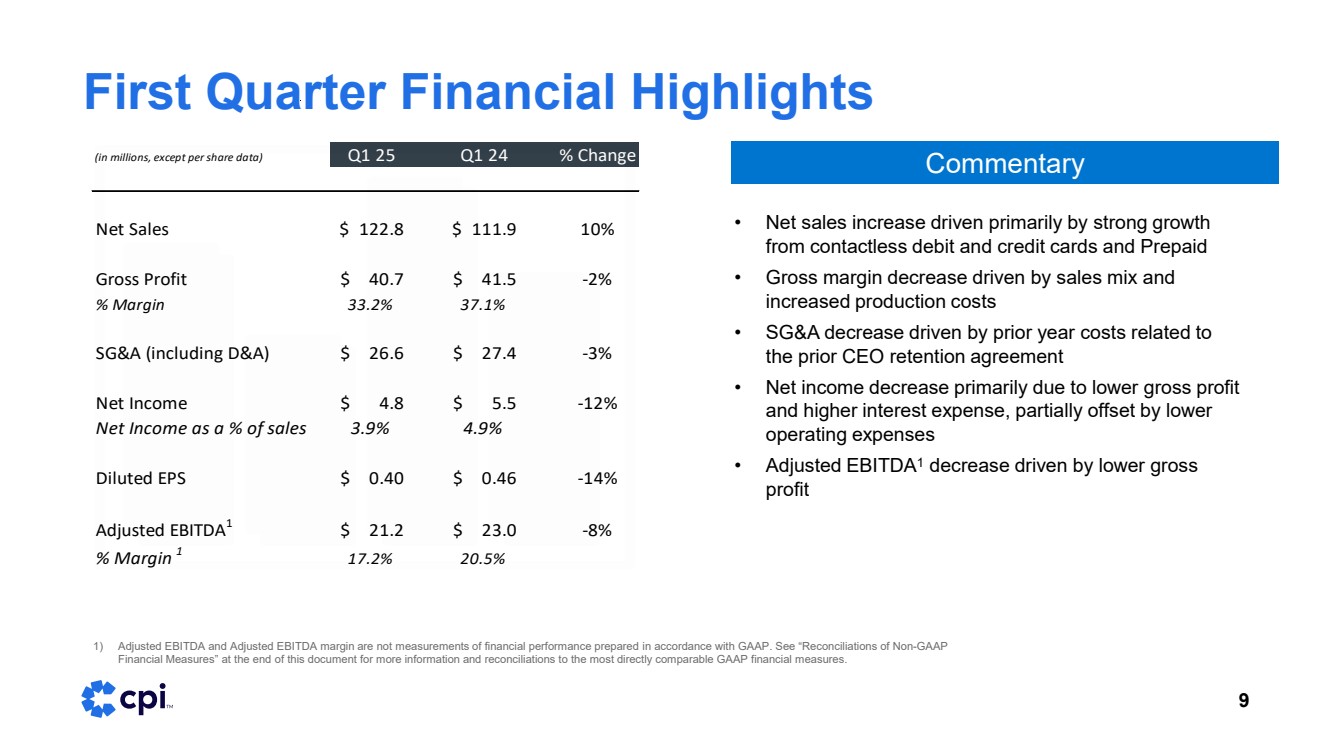
| First Quarter Financial Highlights 9 1) Adjusted EBITDA and Adjusted EBITDA margin are not measurements of financial performance prepared in accordance with GAAP. See “Reconciliations of Non-GAAP Financial Measures” at the end of this document for more information and reconciliations to the most directly comparable GAAP financial measures. • Net sales increase driven primarily by strong growth from contactless debit and credit cards and Prepaid • Gross margin decrease driven by sales mix and increased production costs • SG&A decrease driven by prior year costs related to the prior CEO retention agreement • Net income decrease primarily due to lower gross profit and higher interest expense, partially offset by lower operating expenses • Adjusted EBITDA1 decrease driven by lower gross profit Commentary (in millions, except per share data) Q1 25 Q1 24 % Change Net Sales $ 122.8 $ 111.9 10% Gross Profit $ 40.7 $ 41.5 -2% % Margin 33.2% 37.1% SG&A (including D&A) $ 26.6 $ 27.4 -3% Net Income $ 4.8 $ 5.5 -12% Net Income as a % of sales 3.9% 4.9% Diluted EPS $ 0.40 $ 0.46 -14% Adjusted EBITDA1 $ 21.2 $ 23.0 -8% % Margin 1 17.2% 20.5% |
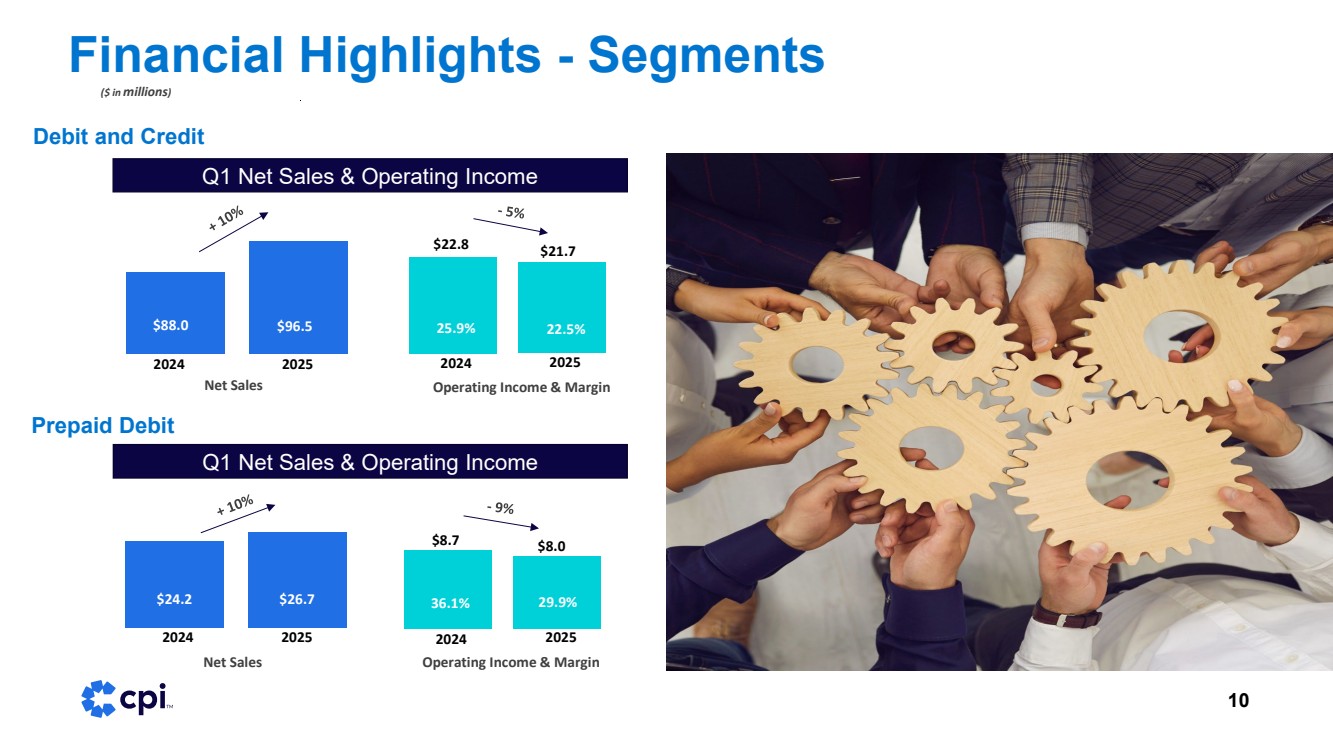
| Financial Highlights - Segments Debit and Credit Q1 Net Sales & Operating Income Q1 Net Sales & Operating Income Prepaid Debit ($ in millions) 24.0% 29.8% Net Sales Operating Income & Margin 37.0% 27.7% Operating Income & Margin $20.4 $19.2 $15.9 $22.1 24.3% 23.4% Net Sales $94.2 $93.2 $93.2 $94.2 26.9% 26.9% 2024 2025 $88.0 $96.5 2024 2025 25.9% 22.5% $22.8 $21.7 2024 2025 $24.2 $26.7 2024 2025 36.1% 29.9% $8.0 $8.7 10 |
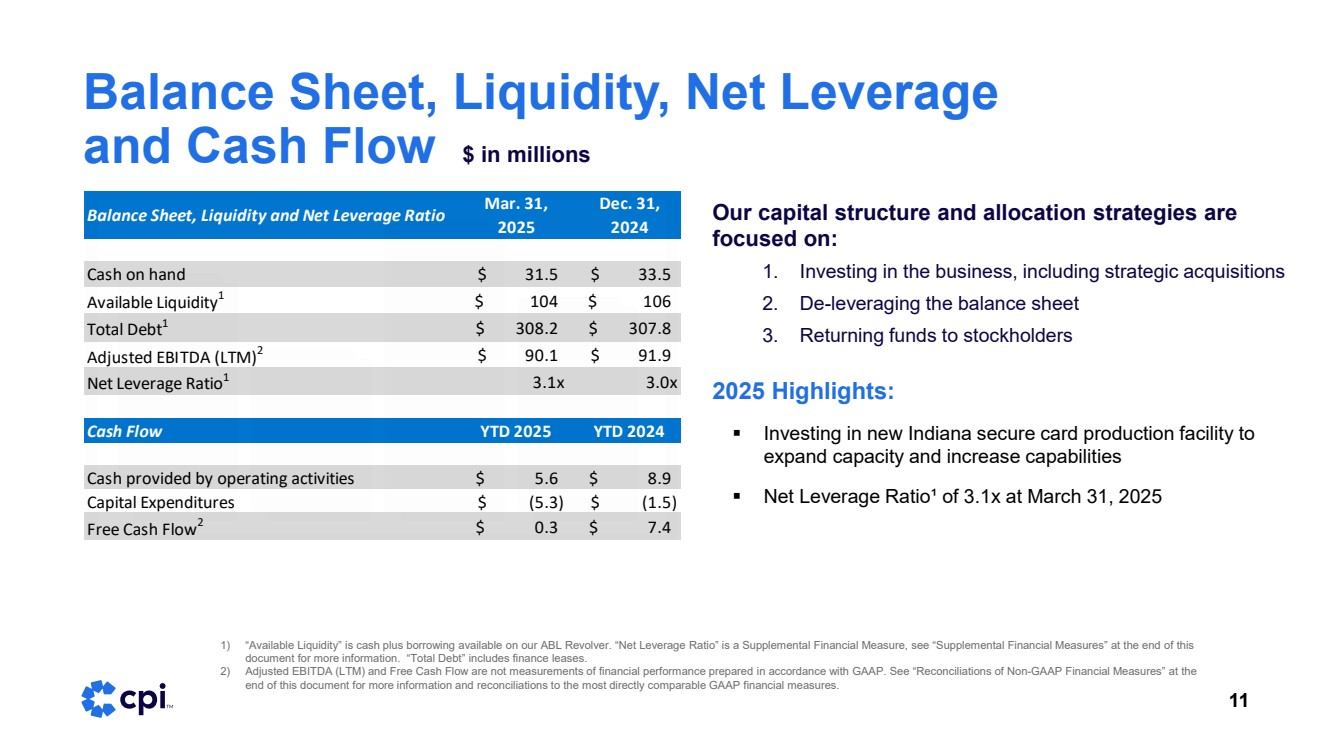
| Balance Sheet, Liquidity, Net Leverage and Cash Flow 11 $ in millions Our capital structure and allocation strategies are focused on: 1. Investing in the business, including strategic acquisitions 2. De-leveraging the balance sheet 3. Returning funds to stockholders 2025 Highlights: Investing in new Indiana secure card production facility to expand capacity and increase capabilities Net Leverage Ratio¹ of 3.1x at March 31, 2025 1) “Available Liquidity” is cash plus borrowing available on our ABL Revolver. “Net Leverage Ratio” is a Supplemental Financial Measure, see “Supplemental Financial Measures” at the end of this document for more information. “Total Debt” includes finance leases. 2) Adjusted EBITDA (LTM) and Free Cash Flow are not measurements of financial performance prepared in accordance with GAAP. See “Reconciliations of Non-GAAP Financial Measures” at the end of this document for more information and reconciliations to the most directly comparable GAAP financial measures. Balance Sheet, Liquidity and Net Leverage Ratio Mar. 31, 2025 Dec. 31, 2024 Cash on hand $ 31.5 $ 33.5 Available Liquidity1 $ 104 $ 106 Total Debt1 $ 308.2 $ 307.8 Adjusted EBITDA (LTM)2 $ 90.1 $ 91.9 Net Leverage Ratio1 3.1x 3.0x Cash Flow YTD 2025 YTD 2024 Cash provided by operating activities $ 5.6 $ 8.9 Capital Expenditures $ (5.3) $ (1.5) Free Cash Flow2 $ 0.3 $ 7.4 |
| 12 Source: Visa and Mastercard Operational Performance Data 1,078 1,113 1,127 1,155 1,206 1,221 1,253 1,269 1,297 1,325 1,347 1,366 1,406 636 645 656 674 679 693 725 739 751 760 762 785 1,714 793 1,758 1,783 1,829 1,885 1,914 1,978 2,008 2,048 2,085 2,109 2,151 Q4'21 Q1'22 Q2'22 Q3'22 Q4'22 Q1'23 Q2'23 Q3'23 Q4'23 Q1'24 Q2'24 Q3'24 Q4'24 Debit Credit 2,199 Visa and Mastercard U.S. Cards in Circulation Cards in circulation have grown at a 9% CAGR over the last three years to 2.2 billion, up from 1.7 billion |

| 2025 Outlook 13 Net Sales and Adjusted EBITDA outlooks affirmed, dependent on stable economic and tariff environment Full-year outlook 2025 (excludes Arroweye acquisition) Mid-to-high single-digit increase in net sales Mid-to-high single-digit increase in Adjusted EBITDA¹ Long-term growth trends remain intact Growth in U.S. cards in circulation Recurring nature of business Trends toward adoption of higher-priced contactless and eco-focused cards and secure packaging solutions 1) Adjusted EBITDA and Free Cash Flow are not measurements of financial performance prepared in accordance with GAAP. We have provided non-GAAP Adjusted EBITDA expectations for 2025 because certain reconciling items are dependent on future events that either cannot be controlled or cannot be reliably predicted because they are not part of the Company’s routine activities, any of which could be significant. |

| Summary 14 Q1 sales strong; margins impacted by mix Strong demand for debit and credit cards Continued growth from Prepaid Net sales and Adjusted EBITDA outlooks for 2025 affirmed Customer demand remains strong Cost savings activities implemented to respond to projected tariff costs and first half sales mix pressures Long-term secular trends remain intact CPI well positioned with innovative and high-quality solutions and strong customer focus Strategic focus to build from current foundation and expand into adjacencies Continuing to invest to drive future growth Arroweye acquisition supports diversification strategy |

| Contact (877) 369-9016 investorrelations@cpicardgroup.com www.cpicardgroup.com 15 |

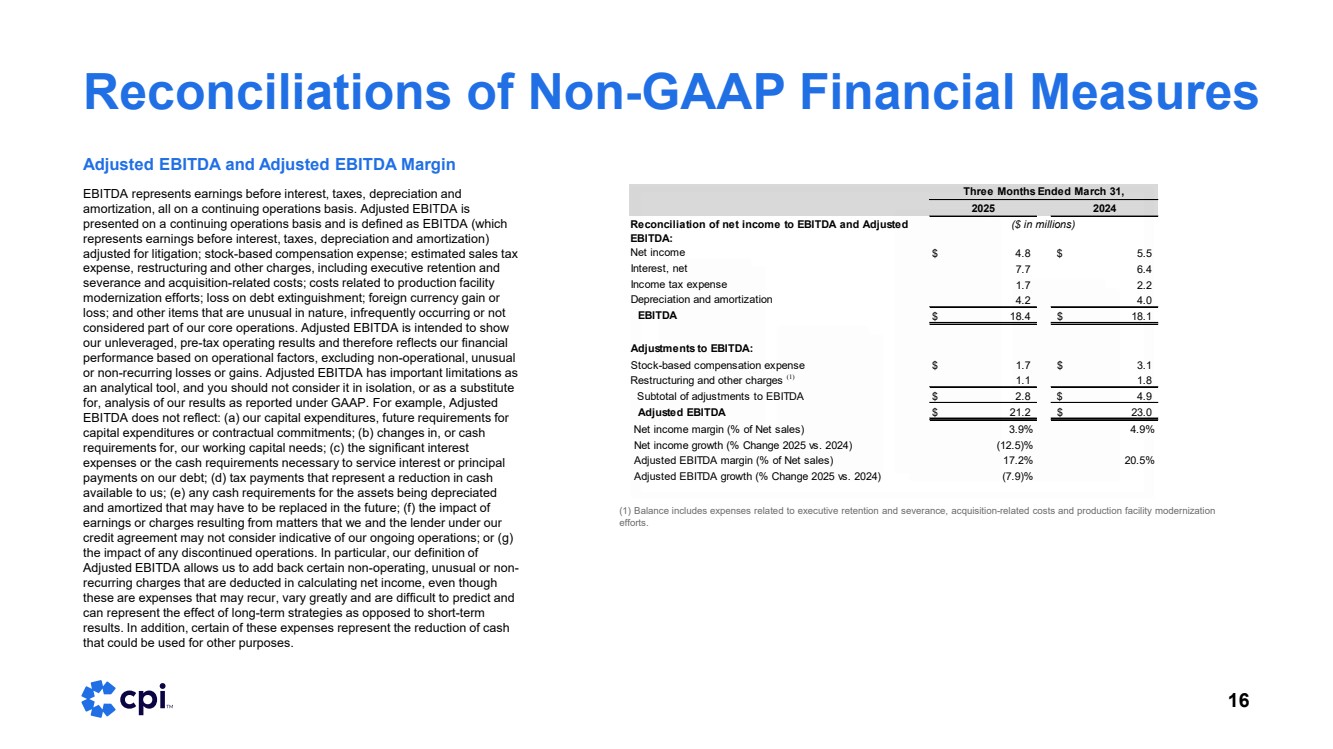
| Reconciliations of Non-GAAP Financial Measures 16 Adjusted EBITDA and Adjusted EBITDA Margin EBITDA represents earnings before interest, taxes, depreciation and amortization, all on a continuing operations basis. Adjusted EBITDA is presented on a continuing operations basis and is defined as EBITDA (which represents earnings before interest, taxes, depreciation and amortization) adjusted for litigation; stock-based compensation expense; estimated sales tax expense, restructuring and other charges, including executive retention and severance and acquisition-related costs; costs related to production facility modernization efforts; loss on debt extinguishment; foreign currency gain or loss; and other items that are unusual in nature, infrequently occurring or not considered part of our core operations. Adjusted EBITDA is intended to show our unleveraged, pre-tax operating results and therefore reflects our financial performance based on operational factors, excluding non-operational, unusual or non-recurring losses or gains. Adjusted EBITDA has important limitations as an analytical tool, and you should not consider it in isolation, or as a substitute for, analysis of our results as reported under GAAP. For example, Adjusted EBITDA does not reflect: (a) our capital expenditures, future requirements for capital expenditures or contractual commitments; (b) changes in, or cash requirements for, our working capital needs; (c) the significant interest expenses or the cash requirements necessary to service interest or principal payments on our debt; (d) tax payments that represent a reduction in cash available to us; (e) any cash requirements for the assets being depreciated and amortized that may have to be replaced in the future; (f) the impact of earnings or charges resulting from matters that we and the lender under our credit agreement may not consider indicative of our ongoing operations; or (g) the impact of any discontinued operations. In particular, our definition of Adjusted EBITDA allows us to add back certain non-operating, unusual or non-recurring charges that are deducted in calculating net income, even though these are expenses that may recur, vary greatly and are difficult to predict and can represent the effect of long-term strategies as opposed to short-term results. In addition, certain of these expenses represent the reduction of cash that could be used for other purposes. (1) Balance includes expenses related to executive retention and severance, acquisition-related costs and production facility modernization efforts. Reconciliation of net income to EBITDA and Adjusted EBITDA: Net income $ 4.8 $ 5.5 Interest, net 7.7 6.4 Income tax expense 1.7 2.2 Depreciation and amortization 4.2 4.0 EBITDA $ 18.4 $ 18.1 Adjustments to EBITDA: Stock-based compensation expense $ 1.7 $ 3.1 Restructuring and other charges (1) 1.1 1.8 Subtotal of adjustments to EBITDA $ 2.8 $ 4.9 Adjusted EBITDA $ 21.2 $ 23.0 Net income margin (% of Net sales) 3.9% 4.9% Net income growth (% Change 2025 vs. 2024) (12.5)% Adjusted EBITDA margin (% of Net sales) 17.2% 20.5% Adjusted EBITDA growth (% Change 2025 vs. 2024) (7.9)% ($ in millions) Three Months Ended March 31, 2025 2024 |
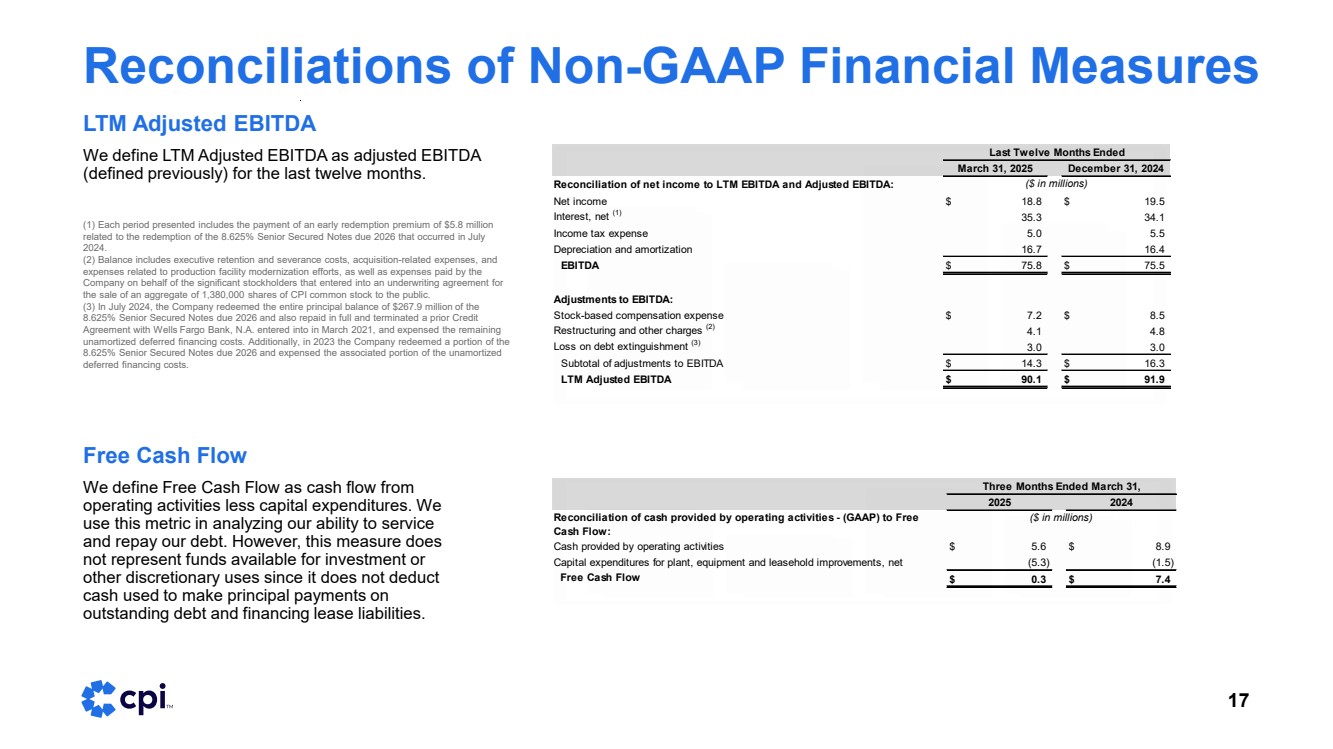
| Reconciliations of Non-GAAP Financial Measures 17 LTM Adjusted EBITDA We define LTM Adjusted EBITDA as adjusted EBITDA (defined previously) for the last twelve months. Free Cash Flow We define Free Cash Flow as cash flow from operating activities less capital expenditures. We use this metric in analyzing our ability to service and repay our debt. However, this measure does not represent funds available for investment or other discretionary uses since it does not deduct cash used to make principal payments on outstanding debt and financing lease liabilities. (1) Each period presented includes the payment of an early redemption premium of $5.8 million related to the redemption of the 8.625% Senior Secured Notes due 2026 that occurred in July 2024. (2) Balance includes executive retention and severance costs, acquisition-related expenses, and expenses related to production facility modernization efforts, as well as expenses paid by the Company on behalf of the significant stockholders that entered into an underwriting agreement for the sale of an aggregate of 1,380,000 shares of CPI common stock to the public. (3) In July 2024, the Company redeemed the entire principal balance of $267.9 million of the 8.625% Senior Secured Notes due 2026 and also repaid in full and terminated a prior Credit Agreement with Wells Fargo Bank, N.A. entered into in March 2021, and expensed the remaining unamortized deferred financing costs. Additionally, in 2023 the Company redeemed a portion of the 8.625% Senior Secured Notes due 2026 and expensed the associated portion of the unamortized deferred financing costs. Reconciliation of net income to LTM EBITDA and Adjusted EBITDA: Net income $ 18.8 $ 19.5 Interest, net (1) 35.3 34.1 Income tax expense 5.0 5.5 Depreciation and amortization 16.7 16.4 EBITDA $ 75.8 $ 75.5 Adjustments to EBITDA: Stock-based compensation expense $ 7.2 $ 8.5 Restructuring and other charges (2) 4.1 4.8 Loss on debt extinguishment (3) 3.0 3.0 Subtotal of adjustments to EBITDA $ 14.3 $ 16.3 LTM Adjusted EBITDA $ 90.1 $ 91.9 March 31, 2025 December 31, 2024 ($ in millions) Last Twelve Months Ended Reconciliation of cash provided by operating activities - (GAAP) to Free Cash Flow: Cash provided by operating activities $ 5.6 $ 8.9 Capital expenditures for plant, equipment and leasehold improvements, net (5.3) (1.5) Free Cash Flow $ 0.3 $ 7.4 ($ in millions) Three Months Ended March 31, 2025 2024 |
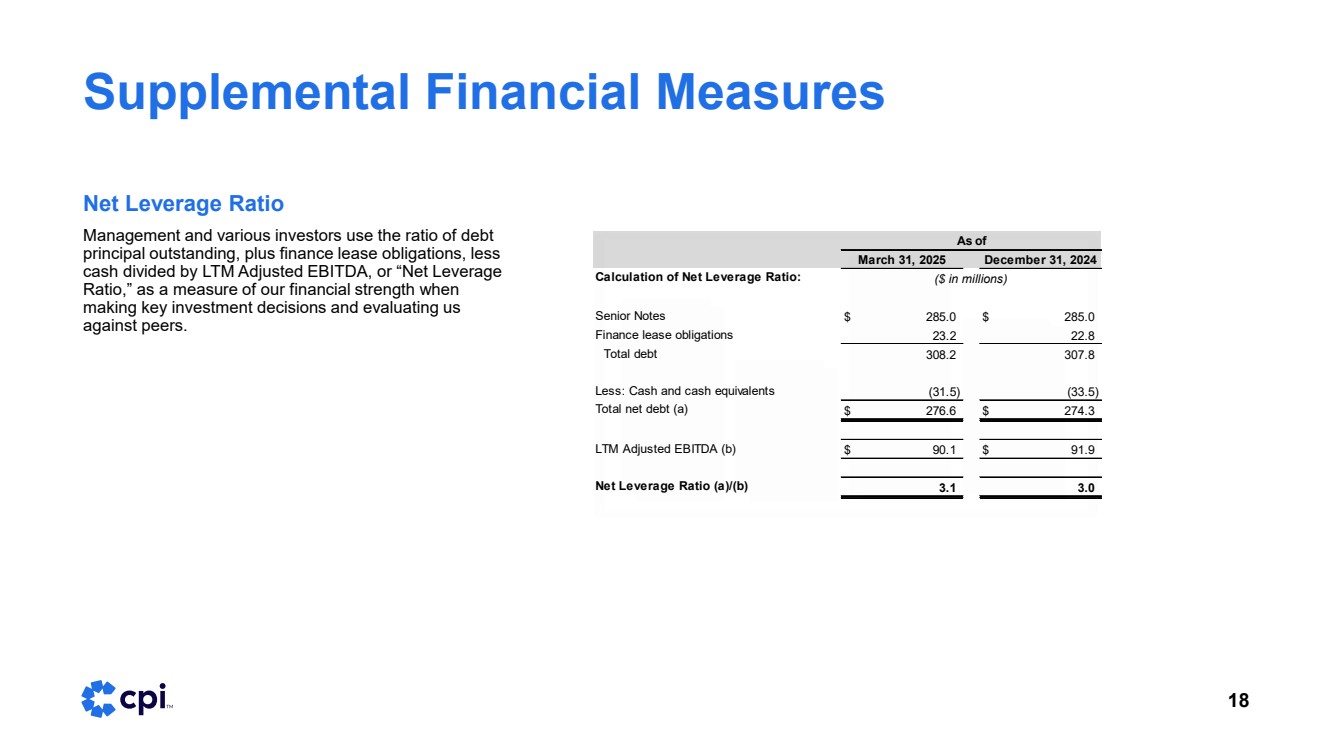
| Supplemental Financial Measures 18 Net Leverage Ratio Management and various investors use the ratio of debt principal outstanding, plus finance lease obligations, less cash divided by LTM Adjusted EBITDA, or “Net Leverage Ratio,” as a measure of our financial strength when making key investment decisions and evaluating us against peers. Calculation of Net Leverage Ratio: Senior Notes $ 285.0 $ 285.0 Finance lease obligations 23.2 22.8 Total debt 308.2 307.8 Less: Cash and cash equivalents (31.5) (33.5) Total net debt (a) $ 276.6 $ 274.3 LTM Adjusted EBITDA (b) $ 90.1 $ 91.9 Net Leverage Ratio (a)/(b) 3.1 3.0 As of March 31, 2025 December 31, 2024 ($ in millions) |