| Global Net Lease First Quarter 2025 Investor Presentation Pictured – McLaren Campus in Woking, U.K. |

| 1 FORWARD LOOKING STATEMENTS This presentation contains statements that are not historical facts and may be forward-looking statements within the meaning of the Private Securities Litigation Reform Act of 1995, including statements regarding the timing, ability to consummate and consideration related to our anticipated acquisitions and dispositions (including the proposed closing of the encumbered properties portion of the Multi-Tenant Portfolio), the intent, belief or current expectations of us, our operating partnership and members of our management team, as well as the assumptions on which such statements are based, and generally are identified by the use of words such as “may,” “will,” “seeks,” “anticipates,” “believes,” “expects,” “estimates,” “projects,” “potential,” “predicts,” “plans,” “intends,” “would,” “could,” “should” or similar expressions are intended to identify forward-looking statements, although not all forward-looking statements contain these identifying words. These forward-looking statements are subject to risks, uncertainties, and other factors, many of which are outside of our control, which could cause actual results to differ materially from the results contemplated by the forward-looking statements. These risks and uncertainties include the risks that any potential future acquisition or disposition (including the proposed closing of the encumbered properties portion of the Multi-Tenant Portfolio) by us is subject to market conditions, capital availability and timing considerations and may not be identified or completed on favorable terms, or at all. Some of the risks and uncertainties, although not all risks and uncertainties, that could cause our actual results to differ materially from those presented in our forward-looking statements are set forth under “Risk Factors” and “Quantitative and Qualitative Disclosures about Market Risk” sections in our Annual Report on Form 10-K, our Quarterly Reports on Form 10-Q and our other filings with the U.S Securities and Exchange Commission (“SEC”) as such risks, uncertainties and other important factors may be updated from time to time in our subsequent reports. Further, forward-looking statements speak only as of the date they are made, and we undertake no obligation to update or revise any forward-looking statement to reflect changed assumptions, the occurrence of unanticipated events or changes to future operating results over time, unless required by law. |
| 2 This presentation also includes estimated projections of future operating results. These projections are not prepared in accordance with published guidelines of the SEC or the guidelines established by the American Institute of Certified Public Accountants for preparation and presentation of financial projections. This information is not fact and should not be relied upon as being necessarily indicative of future results; the projections were prepared in good faith by management and are based on numerous assumptions that may prove to be wrong. All such statements, including but not limited to estimates of value accretion, synergies, run-rate or annualized figures and results of future operations after making adjustments to give effect to assumed future operations reflect assumptions as to certain business decisions and events that are subject to change. As a result, actual results may differ materially from those contained in the estimates. Accordingly, there can be no assurance that the estimates will be realized, or that the projections described in this presentation will be realized at all. This presentation also contains estimates and information concerning our industry and tenants, including market position, market size and growth rates of the markets in which we operate, that are based on industry publications and other third-party reports. This information involves a number of assumptions and limitations, and you are cautioned not to give undue weight to these estimates. We have not independently verified the accuracy or completeness of the data contained in these publications and reports. The industry in which we operate is subject to a high degree of uncertainty and risk due to a variety of factors, including those described in the “Risk Factors”, “Management’s Discussion and Analysis of Financial Condition and Results of Operations” and “Quantitative and Qualitative Disclosures about Market Risk” sections of the Company’s Annual Report on Form 10-K, and all of its other filings with the SEC, as such risks, uncertainties and other important factors may be updated from time to time in the Company’s subsequent reports. Credit Ratings A securities rating is not a recommendation to buy, sell or hold securities and may be subject to revision or withdrawal at any time. Each rating agency has its own methodology of assigning ratings and, accordingly, each rating should be evaluated independently of any other rating. Non-GAAP Financial Measures This presentation includes various performance indicators and non-GAAP financial measures that we use to help us evaluate our ability to incur and service debt, financial condition and results of operations. NOI and Adjusted EBITDA and pro forma presentations of the foregoing are financial measures that are calculated and presented on the basis of methodologies other than in accordance with generally accepted accounting principles in the United States of America (“GAAP”). Reconciliations of such non-GAAP measures to their nearest comparable GAAP measures can be found, with respect to the quarterly information regarding 1Q24, 2Q24, 3Q24 and 4Q24 in the Company’s supplemental information for the quarter ended December 31, 2024, furnished as exhibit 99.2 to the Current Report on Form 8-K filed with the SEC on February 27, 2025, accessible at: https://www.sec.gov/ix?doc=/Archives/edgar/data/1526113/000152611325000005/gnl-20250227.htm which is incorporated by reference herein. Any non-GAAP financial measures used in this presentation are in addition to, and not meant to be considered superior to, or a substitute for, the Company’s financial statements prepared in accordance with GAAP. Additional information with respect to the Company is contained in its filings with the SEC and is available at the SEC's website, www.sec.gov, and on the Company’s website, https://www.globalnetlease.com/. PROJECTIONS |
| Update on the Strategic Sale of the Multi-Tenant Portfolio Section I 3 |

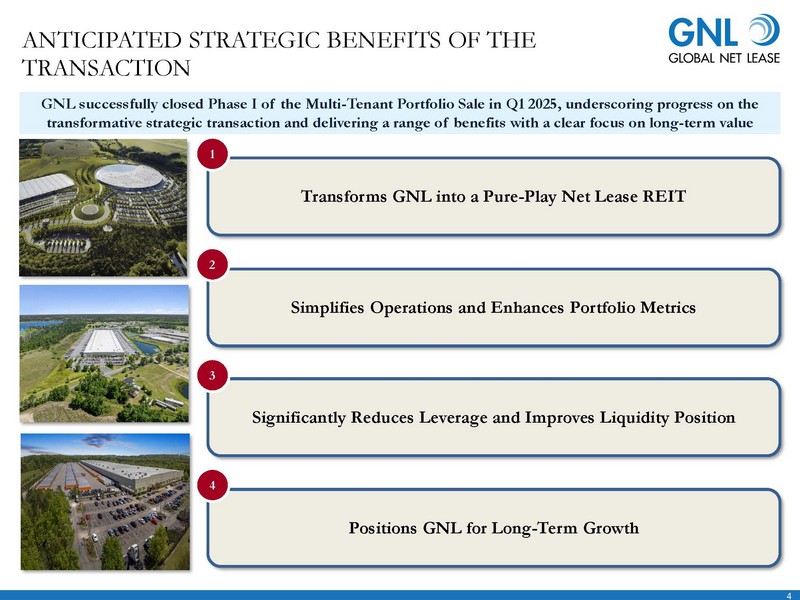
| 4 ANTICIPATED STRATEGIC BENEFITS OF THE TRANSACTION GNL successfully closed Phase I of the Multi-Tenant Portfolio Sale in Q1 2025, underscoring progress on the transformative strategic transaction and delivering a range of benefits with a clear focus on long-term value Transforms GNL into a Pure-Play Net Lease REIT 1 Simplifies Operations and Enhances Portfolio Metrics 2 Significantly Reduces Leverage and Improves Liquidity Position 3 Positions GNL for Long-Term Growth 4 |
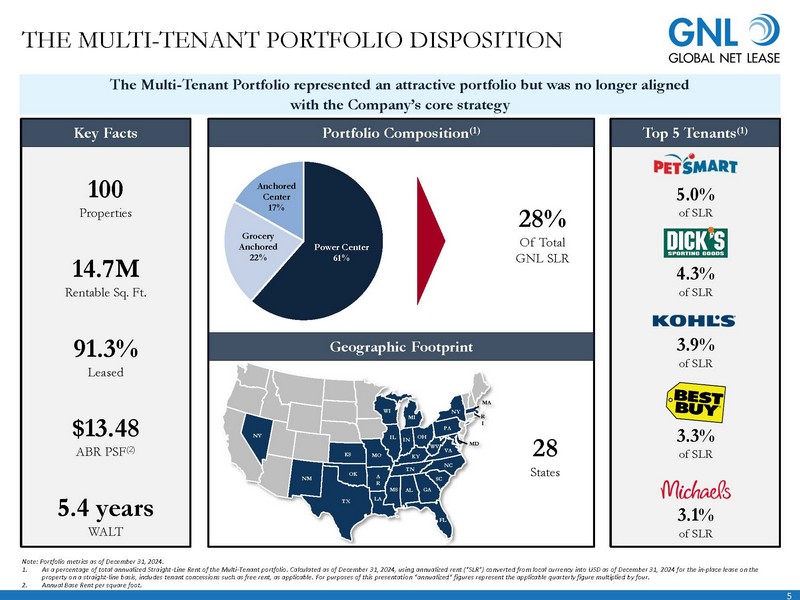
| 5 Top 5 Tenants(1) THE MULTI-TENANT PORTFOLIO DISPOSITION NV TX NM OK KS LA MS AL FL GA SC NC VA WV MO KY MI IL IN OH PA WI NY MD MA R I A R TN Note: Portfolio metrics as of December 31, 2024. 1. As a percentage of total annualized Straight-Line Rent of the Multi-Tenant portfolio. Calculated as of December 31, 2024, using annualized rent (“SLR”) converted from local currency into USD as of December 31, 2024 for the in-place lease on the property on a straight-line basis, includes tenant concessions such as free rent, as applicable. For purposes of this presentation “annualized” figures represent the applicable quarterly figure multiplied by four. 2. Annual Base Rent per square foot. 100 Properties 14.7M Rentable Sq. Ft. 91.3% Leased $13.48 ABR PSF(2) 5.4 years WALT Power Center 61% Grocery Anchored 22% Anchored Center 17% 3.1% of SLR 3.3% of SLR 3.9% of SLR 4.3% of SLR 5.0% of SLR Key Facts 28% Of Total GNL SLR 28 States The Multi-Tenant Portfolio represented an attractive portfolio but was no longer aligned with the Company’s core strategy Portfolio Composition(1) Geographic Footprint |
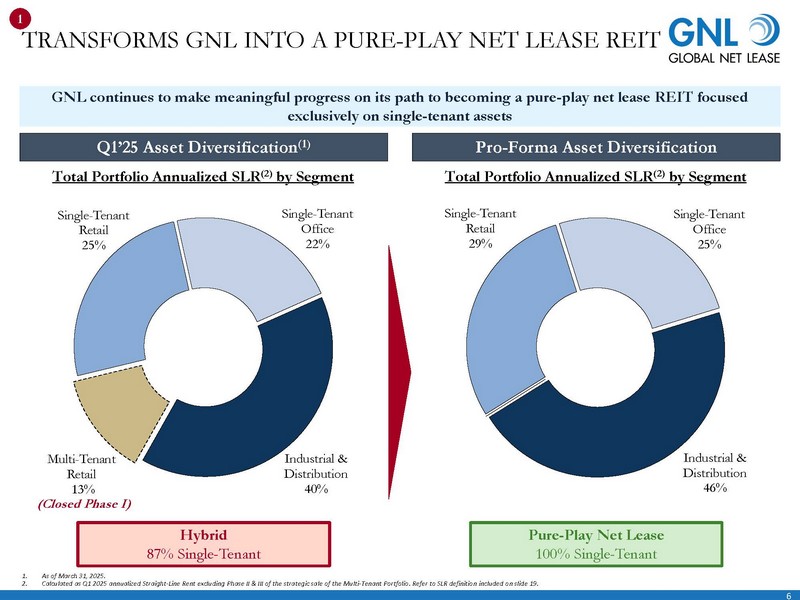
| Industrial & Distribution 46% Single-Tenant Retail 29% Single-Tenant Office 25% Industrial & Distribution 40% Multi-Tenant Retail 13% Single-Tenant Retail 25% Single-Tenant Office 22% Total Portfolio Annualized SLR(2) by Segment Q1’25 Asset Diversification(1) Pro-Forma Asset Diversification Total Portfolio Annualized SLR(2) by Segment Hybrid 87% Single-Tenant Pure-Play Net Lease 100% Single-Tenant TRANSFORMS GNL INTO A PURE-PLAY NET LEASE REIT 1. As of March 31, 2025. 2. Calculated as Q1 2025 annualized Straight-Line Rent excluding Phase II & III of the strategic sale of the Multi-Tenant Portfolio. Refer to SLR definition included on slide 19. (Closed Phase I) 1 GNL continues to make meaningful progress on its path to becoming a pure-play net lease REIT focused exclusively on single-tenant assets 6 |
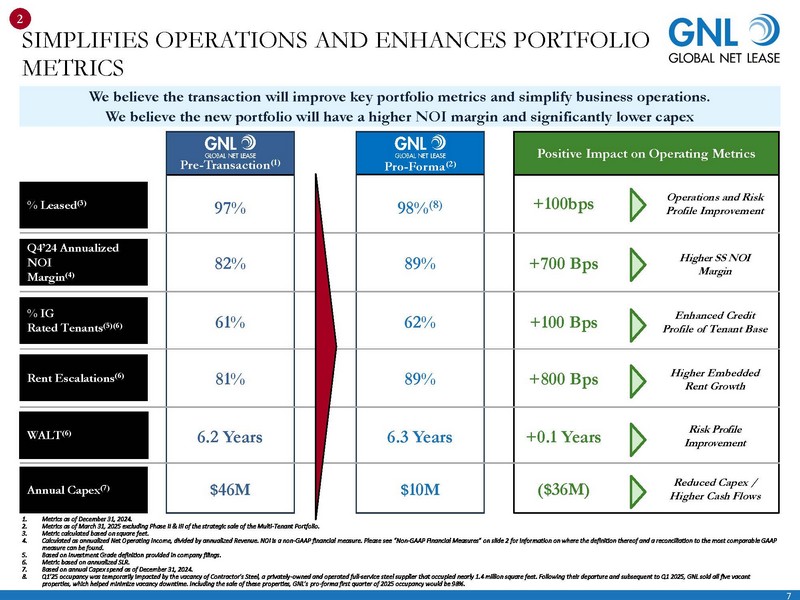
| Risk Profile Improvement Higher Embedded Rent Growth Positive Impact on Operating Metrics % Leased(3) 97% 98%(8) Operations and Risk Profile Improvement Q4’24 Annualized NOI Margin(4) 82% 89% Higher SS NOI Margin % IG Rated Tenants(5)(6) 61% 62% Enhanced Credit Profile of Tenant Base Rent Escalations(6) 81% 89% WALT(6) 6.2 Years 6.3 Years Annual Capex(7) $46M $10M Reduced Capex / Higher Cash Flows Pre-Transaction(1) SIMPLIFIES OPERATIONS AND ENHANCES PORTFOLIO METRICS 1. Metrics as of December 31, 2024. 2. Metrics as of March 31, 2025 excluding Phase II & III of the strategic sale of the Multi-Tenant Portfolio. 3. Metric calculated based on square feet. 4. Calculated as annualized Net Operating Income, divided by annualized Revenue. NOI is a non-GAAP financial measure. Please see “Non-GAAP Financial Measures” on slide 2 for information on where the definition thereof and a reconciliation to the most comparable GAAP measure can be found. 5. Based on Investment Grade definition provided in company filings. 6. Metric based on annualized SLR. 7. Based on annual Capex spend as of December 31, 2024. 8. Q1’25 occupancy was temporarily impacted by the vacancy of Contractor’s Steel, a privately-owned and operated full-service steel supplier that occupied nearly 1.4 million square feet. Following their departure and subsequent to Q1 2025, GNL sold all five vacant properties, which helped minimize vacancy downtime. Including the sale of these properties, GNL’s pro-forma first quarter of 2025 occupancy would be 98%. 2 Pro-Forma(2) +100bps +700 Bps +100 Bps +800 Bps +0.1 Years ($36M) We believe the transaction will improve key portfolio metrics and simplify business operations. We believe the new portfolio will have a higher NOI margin and significantly lower capex 7 |
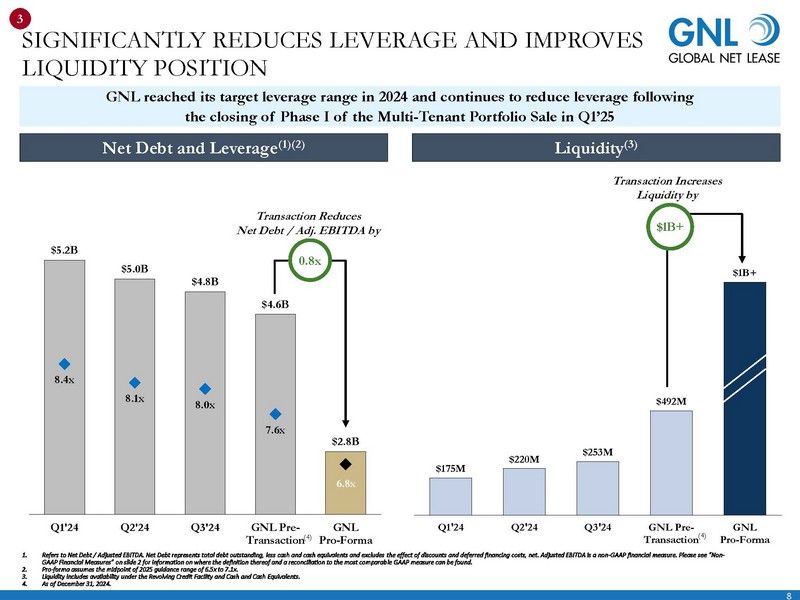
| $175M $220M $253M $492M $1B+ Q1'24 Q2'24 Q3'24 GNL Pre-Transaction GNL Pro-Forma $5.2B $5.0B $4.8B $4.6B $2.8B 8.4x 8.1x 8.0x 7.6x 6.8x Q1'24 Q2'24 Q3'24 GNL Pre-Transaction GNL Pro-Forma SIGNIFICANTLY REDUCES LEVERAGE AND IMPROVES LIQUIDITY POSITION 1. Refers to Net Debt / Adjusted EBITDA. Net Debt represents total debt outstanding, less cash and cash equivalents and excludes the effect of discounts and deferred financing costs, net. Adjusted EBITDA is a non-GAAP financial measure. Please see “Non-GAAP Financial Measures” on slide 2 for information on where the definition thereof and a reconciliation to the most comparable GAAP measure can be found. 2. Pro-forma assumes the midpoint of 2025 guidance range of 6.5x to 7.1x. 3. Liquidity includes availability under the Revolving Credit Facility and Cash and Cash Equivalents. 4. As of December 31, 2024. 3 Net Debt and Leverage(1)(2) Liquidity(3) GNL reached its target leverage range in 2024 and continues to reduce leverage following the closing of Phase I of the Multi-Tenant Portfolio Sale in Q1’25 Transaction Reduces Net Debt / Adj. EBITDA by 0.8x Transaction Increases Liquidity by $1B+ 8 (4) (4) |
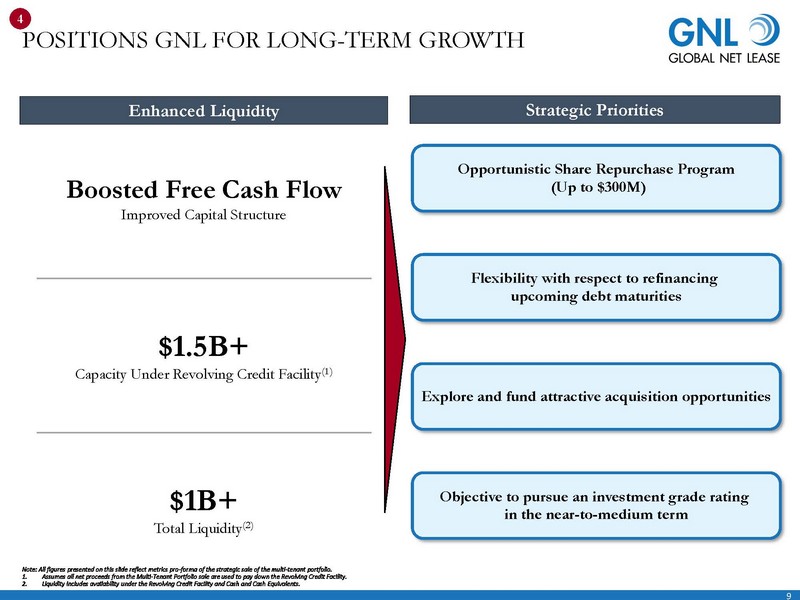
| 9 POSITIONS GNL FOR LONG-TERM GROWTH Note: All figures presented on this slide reflect metrics pro-forma of the strategic sale of the multi-tenant portfolio. 1. Assumes all net proceeds from the Multi-Tenant Portfolio sale are used to pay down the Revolving Credit Facility. 2. Liquidity includes availability under the Revolving Credit Facility and Cash and Cash Equivalents. Enhanced Liquidity Strategic Priorities 4 Boosted Free Cash Flow Improved Capital Structure $1.5B+ Capacity Under Revolving Credit Facility(1) $1B+ Total Liquidity(2) Opportunistic Share Repurchase Program (Up to $300M) Flexibility with respect to refinancing upcoming debt maturities Explore and fund attractive acquisition opportunities Objective to pursue an investment grade rating in the near-to-medium term |
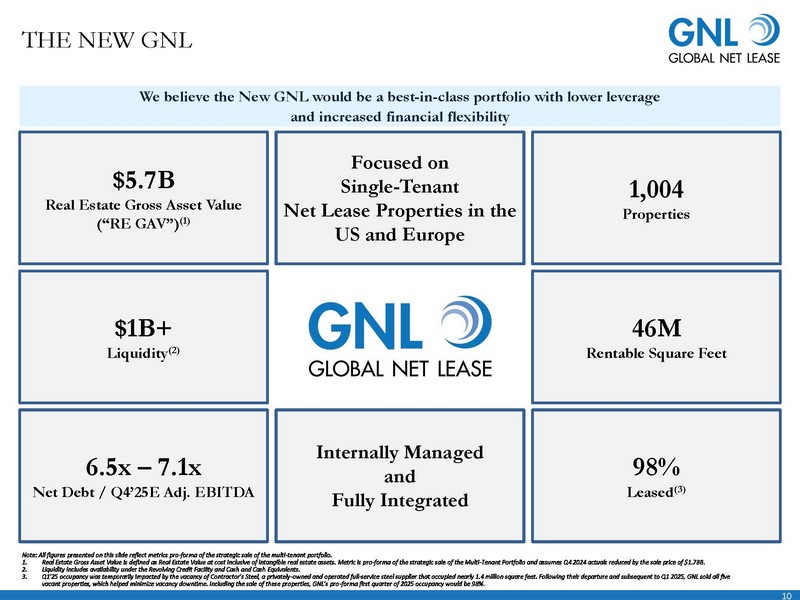
| $5.7B Real Estate Gross Asset Value (“RE GAV”)(1) Focused on Single-Tenant Net Lease Properties in the US and Europe 1,004 Properties 98% Leased(3) 46M Rentable Square Feet $1B+ Liquidity(2) 6.5x – 7.1x Net Debt / Q4’25E Adj. EBITDA Internally Managed and Fully Integrated THE NEW GNL Note: All figures presented on this slide reflect metrics pro-forma of the strategic sale of the multi-tenant portfolio. 1. Real Estate Gross Asset Value is defined as Real Estate Value at cost inclusive of intangible real estate assets. Metric is pro-forma of the strategic sale of the Multi-Tenant Portfolio and assumes Q4 2024 actuals reduced by the sale price of $1.78B. 2. Liquidity includes availability under the Revolving Credit Facility and Cash and Cash Equivalents. 3. Q1’25 occupancy was temporarily impacted by the vacancy of Contractor’s Steel, a privately-owned and operated full-service steel supplier that occupied nearly 1.4 million square feet. Following their departure and subsequent to Q1 2025, GNL sold all five vacant properties, which helped minimize vacancy downtime. Including the sale of these properties, GNL’s pro-forma first quarter of 2025 occupancy would be 98%. We believe the New GNL would be a best-in-class portfolio with lower leverage and increased financial flexibility 10 |
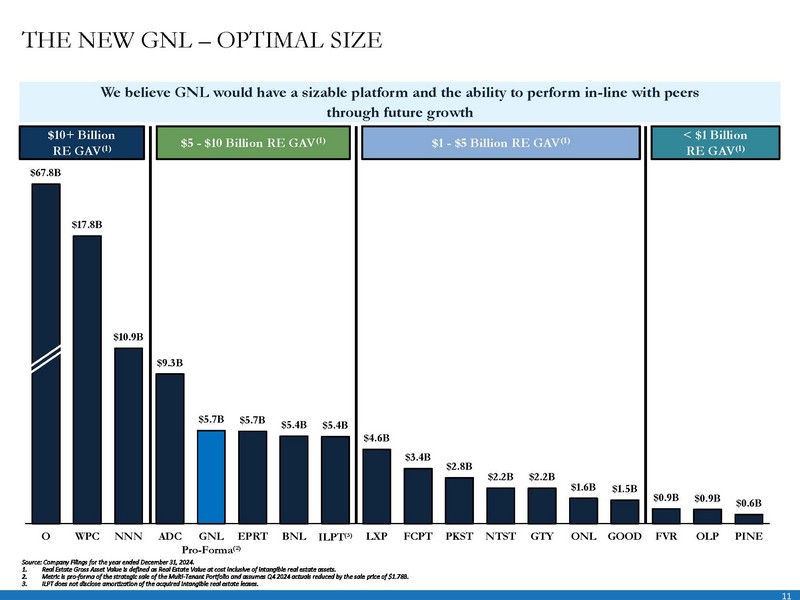
| 11 $67.8B $17.8B $10.9B $9.3B $5.7B $5.7B $5.4B $5.4B $4.6B $3.4B $2.8B $2.2B $2.2B $1.6B $1.5B $0.9B $0.9B $0.6B O WPC NNN ADC GNL Pro-Forma⁽²⁾ EPRT BNL ILPT⁽³⁾ LXP FCPT PKST NTST GTY ONL GOOD FVR OLP PINE THE NEW GNL – OPTIMAL SIZE $5 - $10 Billion RE GAV(1) $10+ Billion RE GAV(1) $1 - $5 Billion RE GAV(1) < $1 Billion RE GAV(1) Source: Company Filings for the year ended December 31, 2024. 1. Real Estate Gross Asset Value is defined as Real Estate Value at cost inclusive of intangible real estate assets. 2. Metric is pro-forma of the strategic sale of the Multi-Tenant Portfolio and assumes Q4 2024 actuals reduced by the sale price of $1.78B. 3. ILPT does not disclose amortization of the acquired intangible real estate leases. We believe GNL would have a sizable platform and the ability to perform in-line with peers through future growth |
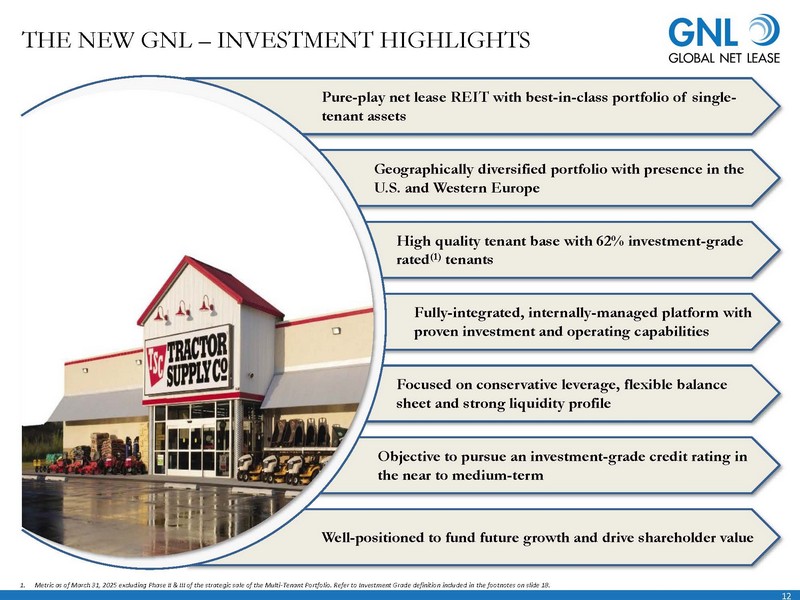
| 12 Well-positioned to fund future growth and drive shareholder value High quality tenant base with 62% investment-grade rated(1) tenants Objective to pursue an investment-grade credit rating in the near to medium-term THE NEW GNL – INVESTMENT HIGHLIGHTS Geographically diversified portfolio with presence in the U.S. and Western Europe Fully-integrated, internally-managed platform with proven investment and operating capabilities Focused on conservative leverage, flexible balance sheet and strong liquidity profile Pure-play net lease REIT with best-in-class portfolio of single-tenant assets 1. Metric as of March 31, 2025 excluding Phase II & III of the strategic sale of the Multi-Tenant Portfolio. Refer to Investment Grade definition included in the footnotes on slide 18. |
| Q1’25 Financial Results & Portfolio Overview Section II 13 |

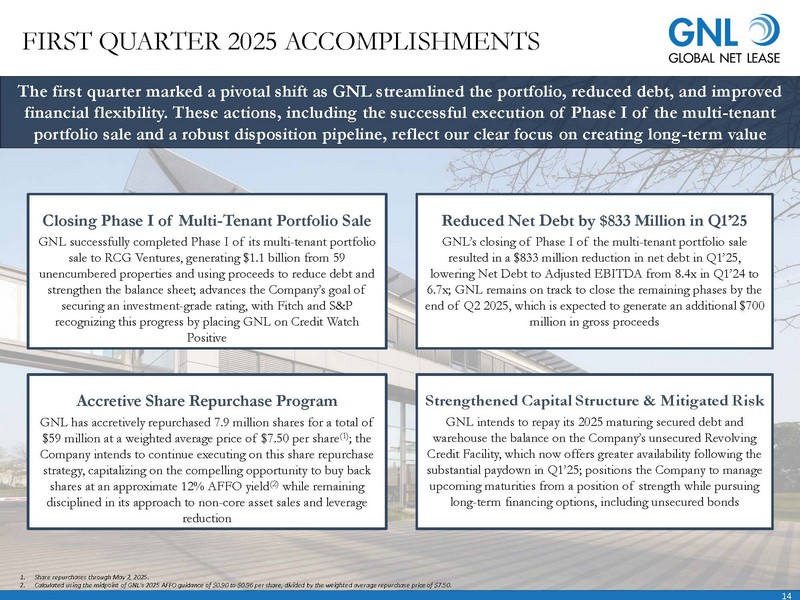
| 14 FIRST QUARTER 2025 ACCOMPLISHMENTS Closing Phase I of Multi-Tenant Portfolio Sale GNL successfully completed Phase I of its multi-tenant portfolio sale to RCG Ventures, generating $1.1 billion from 59 unencumbered properties and using proceeds to reduce debt and strengthen the balance sheet; advances the Company’s goal of securing an investment-grade rating, with Fitch and S&P recognizing this progress by placing GNL on Credit Watch Positive Reduced Net Debt by $833 Million in Q1’25 GNL’s closing of Phase I of the multi-tenant portfolio sale resulted in a $833 million reduction in net debt in Q1’25, lowering Net Debt to Adjusted EBITDA from 8.4x in Q1’24 to 6.7x; GNL remains on track to close the remaining phases by the end of Q2 2025, which is expected to generate an additional $700 million in gross proceeds The first quarter marked a pivotal shift as GNL streamlined the portfolio, reduced debt, and improved financial flexibility. These actions, including the successful execution of Phase I of the multi-tenant portfolio sale and a robust disposition pipeline, reflect our clear focus on creating long-term value 1. Share repurchases through May 2, 2025. 2. Calculated using the midpoint of GNL’s 2025 AFFO guidance of $0.90 to $0.96 per share, divided by the weighted average repurchase price of $7.50. Accretive Share Repurchase Program GNL has accretively repurchased 7.9 million shares for a total of $59 million at a weighted average price of $7.50 per share(1); the Company intends to continue executing on this share repurchase strategy, capitalizing on the compelling opportunity to buy back shares at an approximate 12% AFFO yield(2) while remaining disciplined in its approach to non-core asset sales and leverage reduction Strengthened Capital Structure & Mitigated Risk GNL intends to repay its 2025 maturing secured debt and warehouse the balance on the Company’s unsecured Revolving Credit Facility, which now offers greater availability following the substantial paydown in Q1’25; positions the Company to manage upcoming maturities from a position of strength while pursuing long-term financing options, including unsecured bonds |
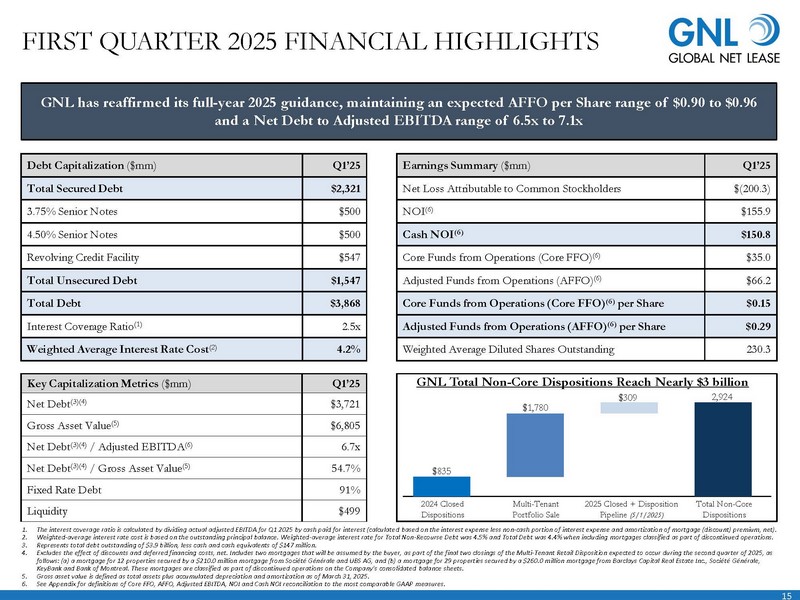
| 15 Earnings Summary ($mm) Q1’25 Net Loss Attributable to Common Stockholders $(200.3) NOI(6) $155.9 Cash NOI(6) $150.8 Core Funds from Operations (Core FFO)(6) $35.0 Adjusted Funds from Operations (AFFO) (6) $66.2 Core Funds from Operations (Core FFO)(6) per Share $0.15 Adjusted Funds from Operations (AFFO)(6) per Share $0.29 Weighted Average Diluted Shares Outstanding 230.3 FIRST QUARTER 2025 FINANCIAL HIGHLIGHTS Key Capitalization Metrics ($mm) Q1’25 Net Debt(3)(4) $3,721 Gross Asset Value(5) $6,805 Net Debt(3)(4) / Adjusted EBITDA(6) 6.7x Net Debt(3)(4) / Gross Asset Value(5) 54.7% Fixed Rate Debt 91% Liquidity $499 Debt Capitalization ($mm) Q1’25 Total Secured Debt $2,321 3.75% Senior Notes $500 4.50% Senior Notes $500 Revolving Credit Facility $547 Total Unsecured Debt $1,547 Total Debt $3,868 Interest Coverage Ratio(1) 2.5x Weighted Average Interest Rate Cost(2) 4.2% GNL has reaffirmed its full-year 2025 guidance, maintaining an expected AFFO per Share range of $0.90 to $0.96 and a Net Debt to Adjusted EBITDA range of 6.5x to 7.1x 1. The interest coverage ratio is calculated by dividing actual adjusted EBITDA for Q1 2025 by cash paid for interest (calculated based on the interest expense less non-cash portion of interest expense and amortization of mortgage (discount) premium, net). 2. Weighted-average interest rate cost is based on the outstanding principal balance. Weighted-average interest rate for Total Non-Recourse Debt was 4.5% and Total Debt was 4.4% when including mortgages classified as part of discontinued operations. 3. Represents total debt outstanding of $3.9 billion, less cash and cash equivalents of $147 million. 4. Excludes the effect of discounts and deferred financing costs, net. Includes two mortgages that will be assumed by the buyer, as part of the final two closings of the Multi-Tenant Retail Disposition expected to occur during the second quarter of 2025, as follows: (a) a mortgage for 12 properties secured by a $210.0 million mortgage from Société Générale and UBS AG, and (b) a mortgage for 29 properties secured by a $260.0 million mortgage from Barclays Capital Real Estate Inc., Société Générale, KeyBank and Bank of Montreal. These mortgages are classified as part of discontinued operations on the Company’s consolidated balance sheets. 5. Gross asset value is defined as total assets plus accumulated depreciation and amortization as of March 31, 2025. 6. See Appendix for definitions of Core FFO, AFFO, Adjusted EBITDA, NOI and Cash NOI reconciliation to the most comparable GAAP measures. 2024 Closed Dispositions Total Non-Core Dispositions $835 $1,780 Multi-Tenant Portfolio Sale $309 2,924 2025 Closed + Disposition Pipeline (5/1/2025) GNL Total Non-Core Dispositions Reach Nearly $3 billion |
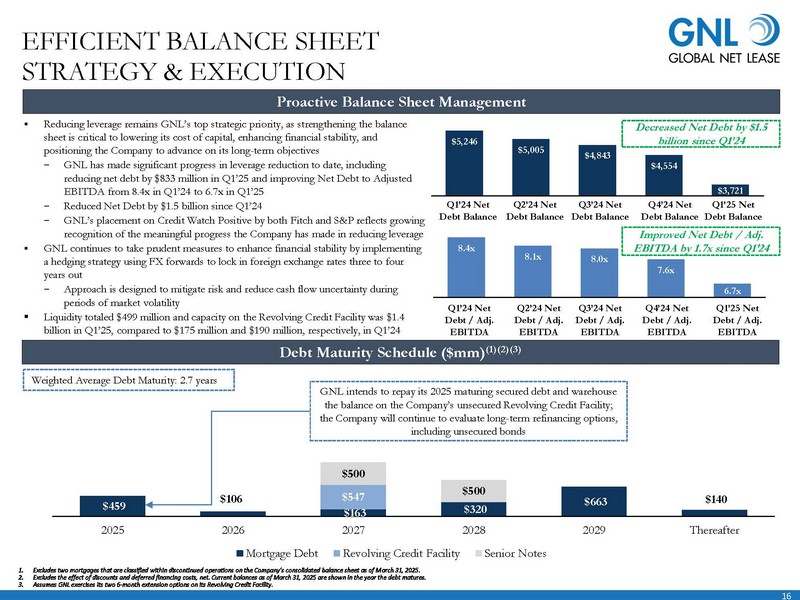
| 16 8.4x 8.1x 8.0x 7.6x 6.7x $5,246 $5,005 $4,843 $4,554 $3,721 $459 $106 $163 $320 $547 $663 $140 $500 $500 2025 2026 2027 2028 2029 Thereafter Mortgage Debt Revolving Credit Facility Senior Notes ▪ Reducing leverage remains GNL’s top strategic priority, as strengthening the balance sheet is critical to lowering its cost of capital, enhancing financial stability, and positioning the Company to advance on its long-term objectives − GNL has made significant progress in leverage reduction to date, including reducing net debt by $833 million in Q1’25 and improving Net Debt to Adjusted EBITDA from 8.4x in Q1’24 to 6.7x in Q1’25 − Reduced Net Debt by $1.5 billion since Q1’24 − GNL’s placement on Credit Watch Positive by both Fitch and S&P reflects growing recognition of the meaningful progress the Company has made in reducing leverage ▪ GNL continues to take prudent measures to enhance financial stability by implementing a hedging strategy using FX forwards to lock in foreign exchange rates three to four years out − Approach is designed to mitigate risk and reduce cash flow uncertainty during periods of market volatility ▪ Liquidity totaled $499 million and capacity on the Revolving Credit Facility was $1.4 billion in Q1’25, compared to $175 million and $190 million, respectively, in Q1’24 EFFICIENT BALANCE SHEET STRATEGY & EXECUTION Debt Maturity Schedule ($mm)(1)(2)(3) 1. Excludes two mortgages that are classified within discontinued operations on the Company’s consolidated balance sheet as of March 31, 2025. 2. Excludes the effect of discounts and deferred financing costs, net. Current balances as of March 31, 2025 are shown in the year the debt matures. 3. Assumes GNL exercises its two 6-month extension options on its Revolving Credit Facility. Weighted Average Debt Maturity: 2.7 years Q2’24 Net Debt Balance Q1’24 Net Debt Balance Q3’24 Net Debt Balance Q4’24 Net Debt Balance Decreased Net Debt by $1.5 billion since Q1’24 Proactive Balance Sheet Management Q1’25 Net Debt Balance Q1’24 Net Debt / Adj. EBITDA Q2’24 Net Debt / Adj. EBITDA Q3’24 Net Debt / Adj. EBITDA Q4’24 Net Debt / Adj. EBITDA Q1’25 Net Debt / Adj. EBITDA GNL intends to repay its 2025 maturing secured debt and warehouse the balance on the Company’s unsecured Revolving Credit Facility; the Company will continue to evaluate long-term refinancing options, including unsecured bonds Improved Net Debt / Adj. EBITDA by 1.7x since Q1'24 |
| 17 Disposition Name Expected Closing # of Properties Disposition Price (in mm) Cash Cap Rate(1) Wtd. Avg. Lease Term Remaining(2) Closed (as of 5/1/25): Pizza Hut (Retail) Closed: Q1’25 11 $14.4 – – Burger King (Retail) Closed: Q1’25 1 $0.9 – – Multi-Tenant Portfolio Sale (Phase I) Closed: Q1’25 59 $1,067.0 – – Total Occupied Assets Closed 71 $1,082.4 8.4% 5.0 Years Total Vacant Assets Closed 50 $105.0 – – Total Closed 121 $1,187.3 8.4% 5.0 Years Signed PSA: Non-Refundable Deposit Q2’25 40 $71.9 7.1% 12.8 Years Multi-Tenant Portfolio Sale (Phase II & III) Q2’25 41 $713.1 8.4%(3) 5.1 Years In Due-Diligence Q2’25 – Q3’25 5 $19.2 9.7% 5.1 Years Total Occupied Assets Q2’25 – Q3’25 86 $802.8 8.3% 5.4 Years Non-Refundable Deposit Q2’25 – Q4’25 26 $86.4 – – In Due-Diligence Q2’25 – Q3’25 4 $5.4 – – Total Vacant Assets Q2’25 – Q4’25 30 $91.7 – – Total Signed PSA 116 $894.5 8.3% 5.4 Years Executed LOI: Occupied Assets Q3’25 2 $3.4 7.1% 2.8 Years Vacant Assets Q3’25 1 $4.0 – – Total Executed LOI 3 $7.4 7.1% 2.8 Years Total 2025 Dispositions To Date 240 $2,089.2 8.3% 5.2 Years Note: Data as of May 1, 2025. There can be no assurances that the transaction under Signed PSA or LOI will be consummated on the above terms, if at all. 1. Calculated as NOI divided by disposition price. 2. Weighted average remaining lease term in years is based on square feet as as of date of sale. 3. Cash cap rate for the multi-tenant portfolio sale is calculated using the trailing twelve months of Cash NOI as of September 30, 2024. SUCCESSFULLY EXECUTING DISPOSITION PLAN & USING NET PROCEEDS TO REDUCE LEVERAGE |

| 18 Portfolio Overview Q1’25 Properties 1,045 Square Feet (millions) 51.3 % Leased(1) 98% Weighted Average Remaining Lease Term (“WALT”)(2) 6.3 years % of SLR Derived from United States & Canada vs. Europe 76% | 24% Industries 84 Tenants 481 % of SLR derived from Investment Grade Tenants (“IG Rated”)(3)(4) 60% Top 10 Tenant Concentration 26% % of Leases with Contractual Rent Increases(5) 86% Average Annual Rental Increase(4) 1.5% Metrics as of March 31, 2025. 1. Q1’25 occupancy was temporarily impacted by the vacancy of Contractor’s Steel, a privately-owned and operated full-service steel supplier that occupied nearly 1.4 million square feet. Following their departure and subsequent to Q1 2025, GNL sold all five vacant properties, which helped minimize vacancy downtime. Including the sale of these properties, GNL’s pro-forma first quarter of 2025 occupancy would be 98% compared to the 95% provided in company filings. 2. Weighted average remaining lease term in years is based on square feet as of March 31, 2025. 3. As used herein, Investment Grade includes both actual investment grade ratings of the tenant or guarantor, if available, or implied investment grade. Implied investment grade may include actual ratings of tenant parent, guarantor parent (regardless of whether or not the parent has guaranteed the tenant's obligation under the lease) or by using a proprietary Moody's analytical tool, which generates an implied rating by measuring a company's probability of default. The term "parent" for these purposes includes any entity, including any governmental entity, owning more than 50% of the voting stock in a tenant or a guarantor. Multi-tenant portfolio includes credit ratings for tenants who occupy 10,000 square feet or more. Based on annualized SLR and as of March 31, 2025, GNL’s portfolio was 33.3% actual investment grade rated and 26.8% implied investment grade rated. 4. Calculated as of March 31, 2025, using annualized straight-line rent converted from local currency into USD as of March 31, 2025 for the in-place lease on the property on a straight-line basis, which includes tenant concessions such as free rent, as applicable. 5. The percentage of leases with rent increases is based on straight line rent as of March 31, 2025. Refer to SLR definition included in the footnotes on slide 19. Contractual cash base rent increases average 1.5% per year and include fixed percent or actual increases, or country CPI-indexed increases, which may include certain floors or caps on rental increases. As of March 31, 2025, and based on straight-line rent, approximately 61.8% are fixed-rate increases, 18.7% are based on the Consumer Price Index, 5.2% are based on other measures and 14.2% do not contain any escalation provisions. PORTFOLIO SNAPSHOT |

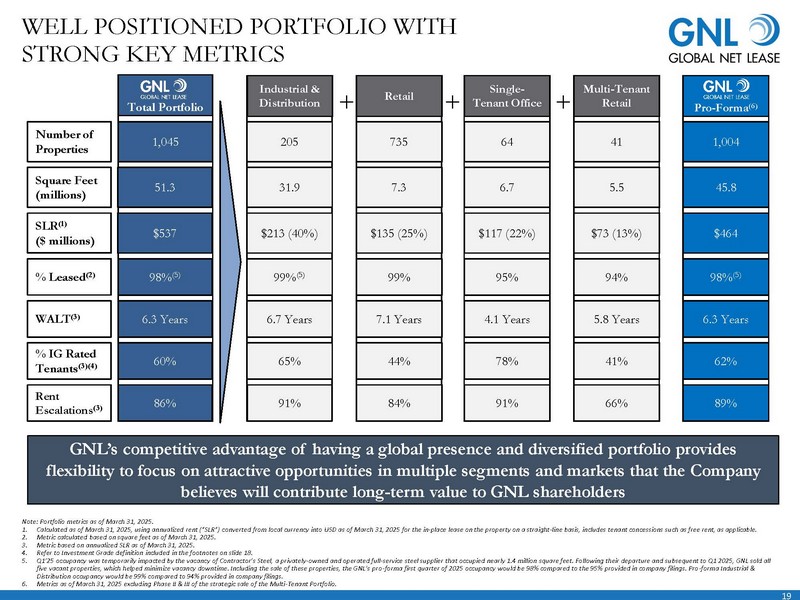
| 19 Industrial WELL POSITIONED PORTFOLIO WITH STRONG KEY METRICS Note: Portfolio metrics as of March 31, 2025. 1. Calculated as of March 31, 2025, using annualized rent (“SLR”) converted from local currency into USD as of March 31, 2025 for the in-place lease on the property on a straight-line basis, includes tenant concessions such as free rent, as applicable. 2. Metric calculated based on square feet as of March 31, 2025. 3. Metric based on annualized SLR as of March 31, 2025. 4. Refer to Investment Grade definition included in the footnotes on slide 18. 5. Q1’25 occupancy was temporarily impacted by the vacancy of Contractor’s Steel, a privately-owned and operated full-service steel supplier that occupied nearly 1.4 million square feet. Following their departure and subsequent to Q1 2025, GNL sold all five vacant properties, which helped minimize vacancy downtime. Including the sale of these properties, the GNL’s pro-forma first quarter of 2025 occupancy would be 98% compared to the 95% provided in company filings. Pro-forma Industrial & Distribution occupancy would be 99% compared to 94% provided in company filings. 6. Metrics as of March 31, 2025 excluding Phase II & III of the strategic sale of the Multi-Tenant Portfolio. + Number of Properties Square Feet (millions) SLR(1) ($ millions) % Leased(2) WALT(3) % IG Rated Tenants(3)(4) + + Industrial & Distribution 205 31.9 $213 (40%) 99%(5) 6.7 Years 65% Retail 735 7.3 $135 (25%) 99% 7.1 Years 44% Single-Tenant Office 64 6.7 $117 (22%) 95% 4.1 Years 78% Multi-Tenant Retail 41 5.5 $73 (13%) 94% 5.8 Years 41% Total Portfolio 1,045 51.3 $537 98%(5) 6.3 Years 60% Rent Escalations(3) 86% 91% 84% 91% 66% GNL’s competitive advantage of having a global presence and diversified portfolio provides flexibility to focus on attractive opportunities in multiple segments and markets that the Company believes will contribute long-term value to GNL shareholders Pro-Forma(6) 1,004 45.8 $464 98%(5) 6.3 Years 62% 89% |
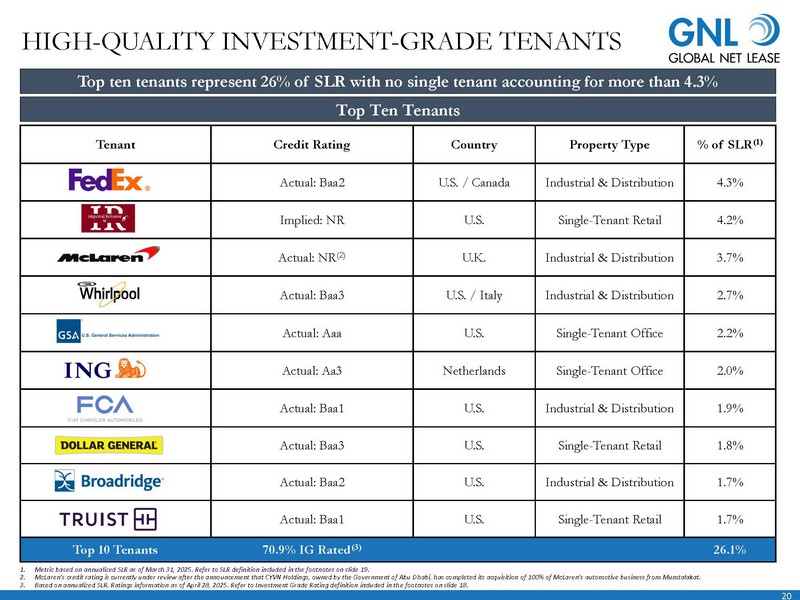
| 20 1. Metric based on annualized SLR as of March 31, 2025. Refer to SLR definition included in the footnotes on slide 19. 2. McLaren’s credit rating is currently under review after the announcement that CYVN Holdings, owned by the Government of Abu Dhabi, has completed its acquisition of 100% of McLaren’s automotive business from Mumtalakat. 3. Based on annualized SLR. Ratings information as of April 28, 2025. Refer to Investment Grade Rating definition included in the footnotes on slide 18. Top ten tenants represent 26% of SLR with no single tenant accounting for more than 4.3% Tenant Credit Rating Country Property Type % of SLR(1) Actual: Baa2 U.S. / Canada Industrial & Distribution 4.3% Implied: NR U.S. Single-Tenant Retail 4.2% Actual: NR(2) U.K. Industrial & Distribution 3.7% Actual: Baa3 U.S. / Italy Industrial & Distribution 2.7% Actual: Aaa U.S. Single-Tenant Office 2.2% Actual: Aa3 Netherlands Single-Tenant Office 2.0% Actual: Baa1 U.S. Industrial & Distribution 1.9% Actual: Baa3 U.S. Single-Tenant Retail 1.8% Actual: Baa2 U.S. Industrial & Distribution 1.7% Actual: Baa1 U.S. Single-Tenant Retail 1.7% Top 10 Tenants 70.9% IG Rated(3) 26.1% Top Ten Tenants HIGH-QUALITY INVESTMENT-GRADE TENANTS |
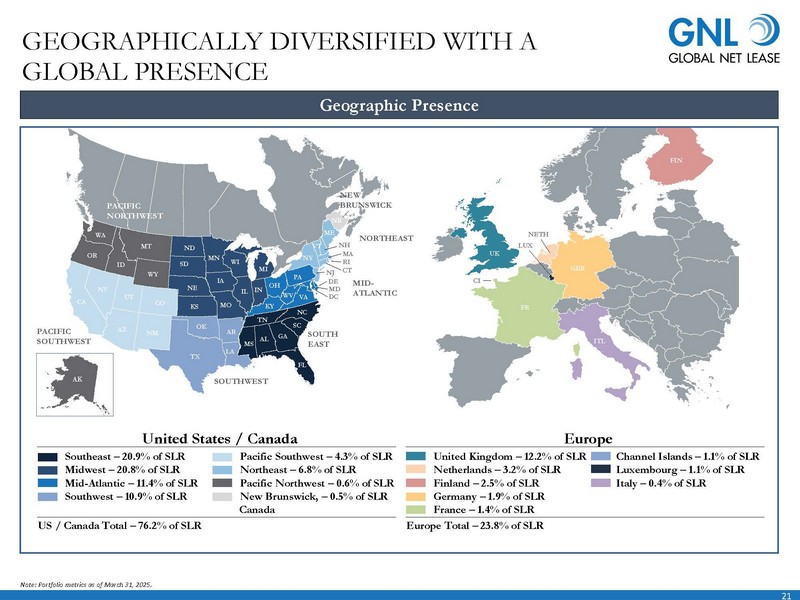
| 21 MIDWEST NC FL GA AL MS LA TX NM AZ CA NV UT OR WA ID MT WY CO ND SD NE KS OK AR MO IA MN WI MI IL IN OH KY TN SC NC WV VA PA NY VT NH ME MA NJ CT MD DE DC RI NB PACIFIC SOUTHWEST SOUTHWEST MID-ATLANTIC NEW PACIFIC BRUNSWICK NORTHWEST SOUTH EAST AK NORTHEAST GEOGRAPHICALLY DIVERSIFIED WITH A GLOBAL PRESENCE Geographic Presence Note: Portfolio metrics as of March 31, 2025. FR UK ITL GER LUX NETH FIN CI United States / Canada US / Canada Total – 76.2% of SLR ⚫ Southeast – 20.9% of SLR ⚫ Midwest – 20.8% of SLR ⚫ Mid-Atlantic – 11.4% of SLR ⚫ Southwest – 10.9% of SLR ⚫ Pacific Southwest – 4.3% of SLR ⚫ Northeast – 6.8% of SLR ⚫ Pacific Northwest – 0.6% of SLR ⚫ New Brunswick, – 0.5% of SLR Canada Europe Europe Total – 23.8% of SLR ⚫ United Kingdom – 12.2% of SLR ⚫ Netherlands – 3.2% of SLR ⚫ Finland – 2.5% of SLR ⚫ Germany – 1.9% of SLR ⚫ France – 1.4% of SLR ⚫ Channel Islands – 1.1% of SLR ⚫ Luxembourg – 1.1% of SLR ⚫ Italy – 0.4% of SLR |
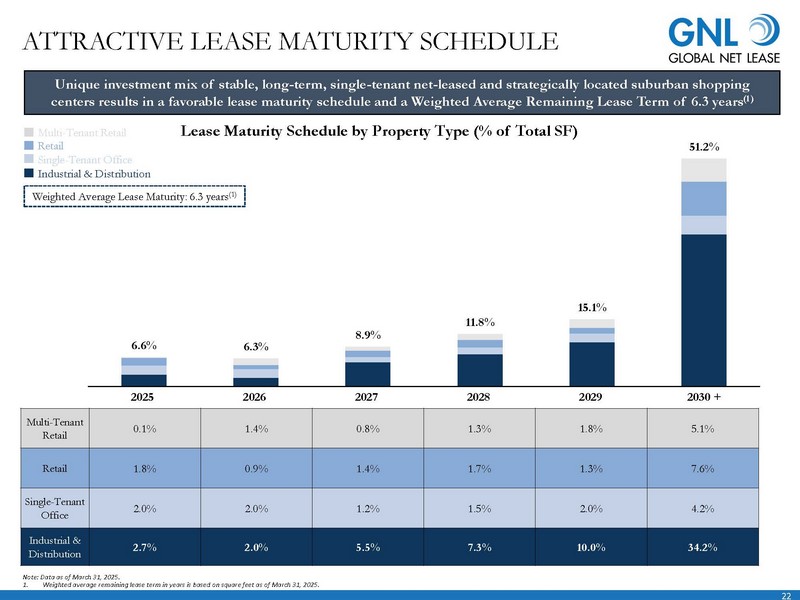
| 22 6.6% 6.3% 8.9% 11.8% 15.1% 51.2% 2025 2026 2027 2028 2029 2030 + Lease Maturity Schedule by Property Type (% of Total SF) ATTRACTIVE LEASE MATURITY SCHEDULE Unique investment mix of stable, long-term, single-tenant net-leased and strategically located suburban shopping centers results in a favorable lease maturity schedule and a Weighted Average Remaining Lease Term of 6.3 years(1) Note: Data as of March 31, 2025. 1. Weighted average remaining lease term in years is based on square feet as of March 31, 2025. Multi-Tenant Retail 0.1% 1.4% 0.8% 1.3% 1.8% 5.1% Retail 1.8% 0.9% 1.4% 1.7% 1.3% 7.6% Single-Tenant Office 2.0% 2.0% 1.2% 1.5% 2.0% 4.2% Industrial & Distribution 2.7% 2.0% 5.5% 7.3% 10.0% 34.2% Multi-Tenant Retail Retail Single-Tenant Office Industrial & Distribution Weighted Average Lease Maturity: 6.3 years(1) |
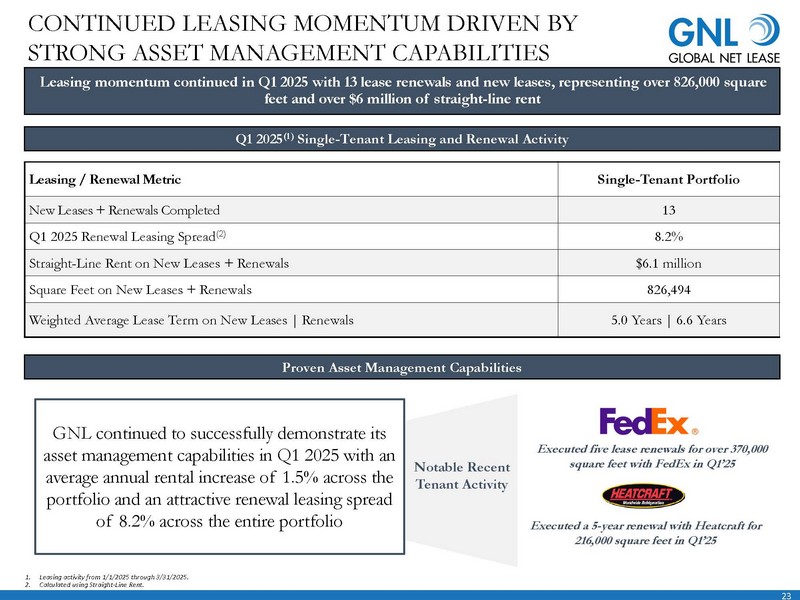
| 23 Leasing momentum continued in Q1 2025 with 13 lease renewals and new leases, representing over 826,000 square feet and over $6 million of straight-line rent Q1 2025(1) Single-Tenant Leasing and Renewal Activity Leasing / Renewal Metric Single-Tenant Portfolio New Leases + Renewals Completed 13 Q1 2025 Renewal Leasing Spread(2) 8.2% Straight-Line Rent on New Leases + Renewals $6.1 million Square Feet on New Leases + Renewals 826,494 Weighted Average Lease Term on New Leases | Renewals 5.0 Years | 6.6 Years 1. Leasing activity from 1/1/2025 through 3/31/2025. 2. Calculated using Straight-Line Rent. CONTINUED LEASING MOMENTUM DRIVEN BY STRONG ASSET MANAGEMENT CAPABILITIES Proven Asset Management Capabilities GNL continued to successfully demonstrate its asset management capabilities in Q1 2025 with an average annual rental increase of 1.5% across the portfolio and an attractive renewal leasing spread of 8.2% across the entire portfolio Notable Recent Tenant Activity Executed a 5-year renewal with Heatcraft for 216,000 square feet in Q1’25 Executed five lease renewals for over 370,000 square feet with FedEx in Q1’25 |
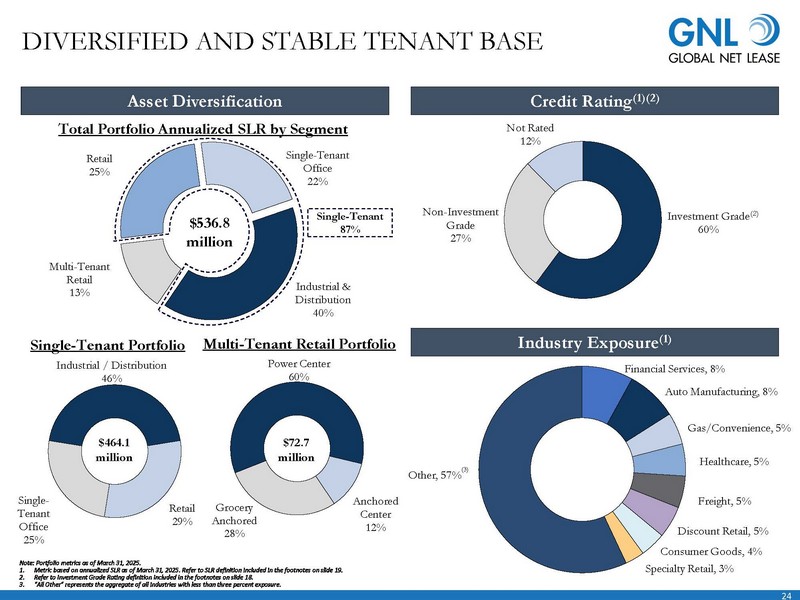
| 24 Investment Grade 60% Non-Investment Grade 27% Not Rated 12% Financial Services, 8% Auto Manufacturing, 8% Healthcare, 5% Gas/Convenience, 5% Freight, 5% Discount Retail, 5% Consumer Goods, 4% Specialty Retail, 3% Other, 57% Industrial & Distribution 40% Multi-Tenant Retail 13% Retail 25% Single-Tenant Office 22% Single-Tenant Office 25% Industrial / Distribution 46% Retail 29% $72.7 million $536.8 million Total Portfolio Annualized SLR by Segment Industry Exposure(1) Credit Rating Asset Diversification (1)(2) Note: Portfolio metrics as of March 31, 2025. 1. Metric based on annualized SLR as of March 31, 2025. Refer to SLR definition included in the footnotes on slide 19. 2. Refer to Investment Grade Rating definition included in the footnotes on slide 18. 3. “All Other” represents the aggregate of all industries with less than three percent exposure. DIVERSIFIED AND STABLE TENANT BASE Single-Tenant Portfolio Multi-Tenant Retail Portfolio $464.1 million Single-Tenant 87% (2) (3) Grocery Anchored 28% Power Center 60% Anchored Center 12% |
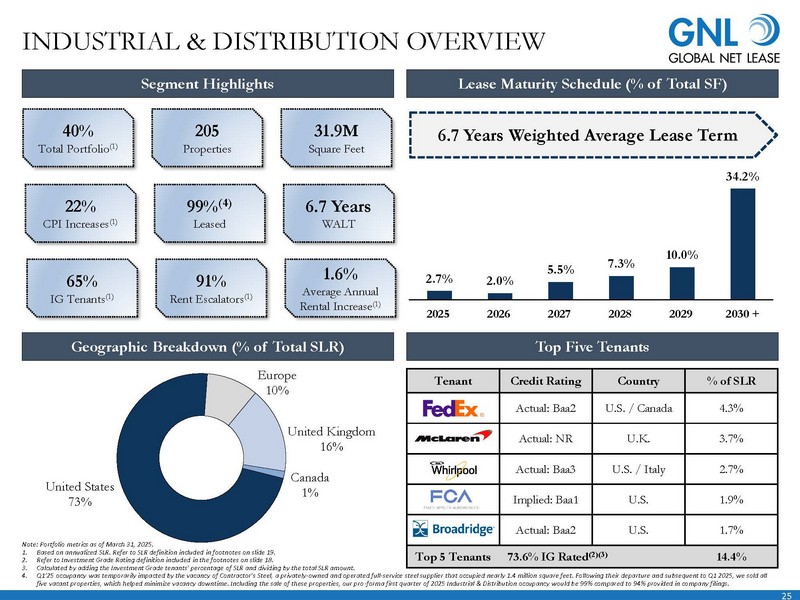
| 25 2.7% 2.0% 5.5% 7.3% 10.0% 34.2% 2025 2026 2027 2028 2029 2030 + United States 73% Europe 10% United Kingdom 16% Canada 1% Tenant Credit Rating Country % of SLR Actual: Baa2 U.S. / Canada 4.3% Actual: NR U.K. 3.7% Actual: Baa3 U.S. / Italy 2.7% Implied: Baa1 U.S. 1.9% Actual: Baa2 U.S. 1.7% Top 5 Tenants 73.6% IG Rated(2)(3) 14.4% Segment Highlights Lease Maturity Schedule (% of Total SF) Geographic Breakdown (% of Total SLR) Top Five Tenants 40% Total Portfolio(1) 205 Properties 31.9M Square Feet 22% CPI Increases(1) 99%(4) Leased 6.7 Years WALT 65% IG Tenants(1) 91% Rent Escalators(1) 1.6% Average Annual Rental Increase(1) Note: Portfolio metrics as of March 31, 2025. 1. Based on annualized SLR. Refer to SLR definition included in footnotes on slide 19. 2. Refer to Investment Grade Rating definition included in the footnotes on slide 18. 3. Calculated by adding the Investment Grade tenants’ percentage of SLR and dividing by the total SLR amount. 4. Q1’25 occupancy was temporarily impacted by the vacancy of Contractor’s Steel, a privately-owned and operated full-service steel supplier that occupied nearly 1.4 million square feet. Following their departure and subsequent to Q1 2025, we sold all five vacant properties, which helped minimize vacancy downtime. Including the sale of these properties, our pro-forma first quarter of 2025 Industrial & Distribution occupancy would be 99% compared to 94% provided in company filings. INDUSTRIAL & DISTRIBUTION OVERVIEW 6.7 Years Weighted Average Lease Term |
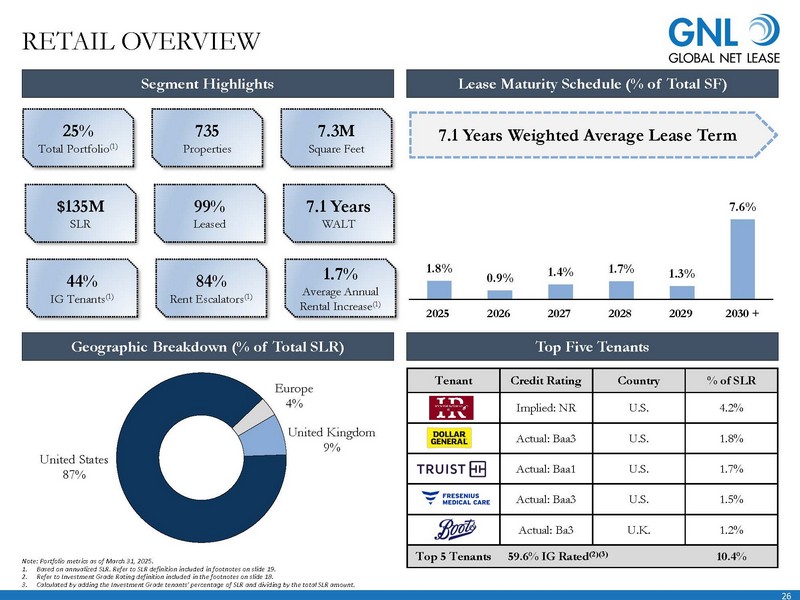
| 26 1.8% 0.9% 1.4% 1.7% 1.3% 7.6% 2025 2026 2027 2028 2029 2030 + United States 87% Europe 4% United Kingdom 9% RETAIL OVERVIEW Tenant Credit Rating Country % of SLR Implied: NR U.S. 4.2% Actual: Baa3 U.S. 1.8% Actual: Baa1 U.S. 1.7% Actual: Baa3 U.S. 1.5% Actual: Ba3 U.K. 1.2% Top 5 Tenants 59.6% IG Rated(2)(3) 10.4% Segment Highlights Lease Maturity Schedule (% of Total SF) Geographic Breakdown (% of Total SLR) Top Five Tenants 25% Total Portfolio(1) 735 Properties 7.3M Square Feet $135M SLR 99% Leased 7.1 Years WALT 44% IG Tenants(1) 84% Rent Escalators(1) 1.7% Average Annual Rental Increase(1) Note: Portfolio metrics as of March 31, 2025. 1. Based on annualized SLR. Refer to SLR definition included in footnotes on slide 19. 2. Refer to Investment Grade Rating definition included in the footnotes on slide 18. 3. Calculated by adding the Investment Grade tenants’ percentage of SLR and dividing by the total SLR amount. 7.1 Years Weighted Average Lease Term |
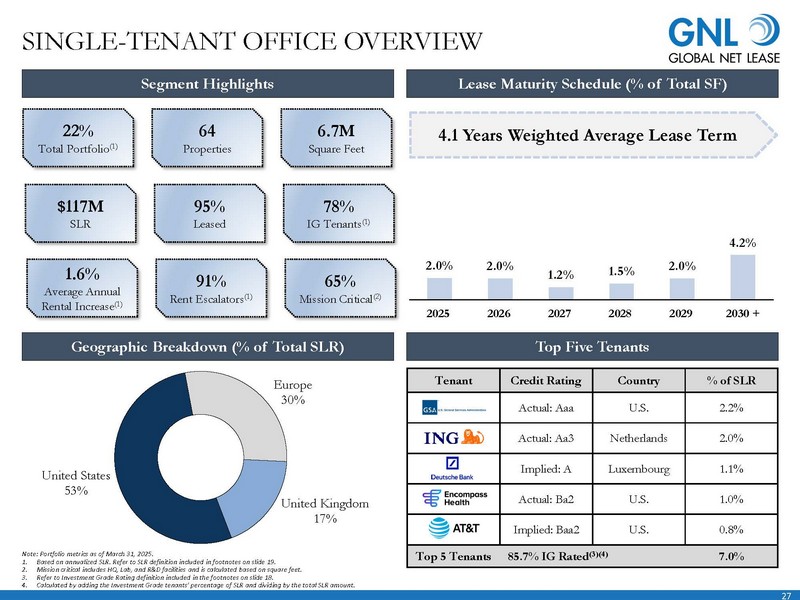
| 27 2.0% 2.0% 1.2% 1.5% 2.0% 4.2% 2025 2026 2027 2028 2029 2030 + SINGLE-TENANT OFFICE OVERVIEW Tenant Credit Rating Country % of SLR Actual: Aaa U.S. 2.2% Actual: Aa3 Netherlands 2.0% Implied: A Luxembourg 1.1% Actual: Ba2 U.S. 1.0% Implied: Baa2 U.S. 0.8% Top 5 Tenants 85.7% IG Rated(3)(4) 7.0% Segment Highlights Lease Maturity Schedule (% of Total SF) 22% Total Portfolio(1) 64 Properties 6.7M Square Feet $117M SLR 95% Leased 78% IG Tenants(1) 1.6% Average Annual Rental Increase(1) 91% Rent Escalators(1) 65% Mission Critical(2) Geographic Breakdown (% of Total SLR) Top Five Tenants Note: Portfolio metrics as of March 31, 2025. 1. Based on annualized SLR. Refer to SLR definition included in footnotes on slide 19. 2. Mission critical includes HQ, Lab, and R&D facilities and is calculated based on square feet. 3. Refer to Investment Grade Rating definition included in the footnotes on slide 18. 4. Calculated by adding the Investment Grade tenants’ percentage of SLR and dividing by the total SLR amount. 4.1 Years Weighted Average Lease Term United States 53% Europe 30% United Kingdom 17% |
| 28 LEADERSHIP OVERVIEW Management Board of Directors Michael Weil, Director Refer to “Management” section for Michael Weil’s biography Michael Weil, Chief Executive Officer & President Previously served as CEO of The Necessity Retail REIT Member of the Board of Directors of Global Net Lease, Inc. since 2012 Served as President of the Board of Directors of the Real Estate Investment Securities Association Chris Masterson, Chief Financial Officer Previously served as Chief Accounting Officer of GNL Past experience includes accounting positions with Goldman Sachs and KPMG Sue Perrotty, Non-Executive Chairperson of the Board of Directors Previously served as President and Chief Executive Officer of AFM Financial Services and Tower Health Edward Rendell, Independent Director Previously served as the 45th Governor of the Commonwealth of Pennsylvania and as the Mayor of Philadelphia, and previously served as a member of the board of directors of The Necessity Retail REIT Lisa Kabnick, Independent Director Retired Partner at Troutman Pepper Hamilton Sanders LLP, and previously served as a member of the board of directors of The Necessity Retail REIT Therese Antone, Independent Director Currently serves as the Chancellor of Salve Regina University since her appointment in 2009 Leslie Michelson, Independent Director Currently serves as lead independent director of Franklin BSP Franklin Lending Corporation, and previously served as a member of the board of directors of The Necessity Retail REIT Stanley Perla, Independent Director Previously served as a member of the board of directors and the chair of the audit committee of Madison Harbor Balanced Strategies, Inc, and previously served as a member of the board of directors of The Necessity Retail REIT Directors Jesse Galloway, Executive Vice President & General Counsel Joined GNL in September 2023 25 years of legal experience representing large real estate companies and financial institutions, including 10 years as General Counsel and 15 years in private practice Jason Slear, Executive Vice President Responsible for sourcing, negotiating, and closing GNL’s real estate acquisitions and dispositions Oversaw the acquisition of over $3.5 billion of real estate assets and the lease-up of over 10 million square feet during professional career Ori Kravel, Chief Operating Officer Responsible for corporate development and business strategy Executed over $12 billion of capital market transactions and over $25 billion of M&A transactions Rob Kauffman, Independent Director Co-founder of Fortress Investment Group and previously worked as a Managing Director at UBS, a Principal at BlackRock Financial and at Lehman Brothers Michael J.U. Monahan, Independent Director Currently serves as a CBRE Vice Chair and previously served as a Senior Director at Jones Lang Wootton and a Vice President at Cushman & Wakefield Leon Richardson, Independent Director Founder, President and Chief Operating Officer of The Chemico Group, one of the largest minority-owned chemical management and distribution companies in the US |

| 29 APPENDIX: FINANCIAL DEFINITIONS Non-GAAP Financial Measures This section discusses non-GAAP financial measures we use to evaluate our performance, including Funds from Operations (“FFO”), Core Funds from Operations (“Core FFO”), Adjusted Funds from Operations (“AFFO”), Adjusted Earnings before Interest, Taxes, Depreciation and Amortization (“Adjusted EBITDA”), Net Operating Income (“NOI”), Cash Net Operating Income (“Cash NOI”) and Cash Paid for Interest. While NOI is a property-level measure, AFFO is based on total Company performance and therefore reflects the impact of other items not specifically associated with NOI such as, interest expense, general and administrative expenses and operating fees to related parties. Additionally, NOI as defined herein, does not reflect an adjustment for straight-line rent but AFFO does include this adjustment. A description of these non-GAAP measures and reconciliations to the most directly comparable GAAP measure, which is net income, is provided below. Caution on Use of Non-GAAP Measures FFO, Core FFO, AFFO, Adjusted EBITDA, NOI, Cash NOI and Cash Paid for Interest should not be construed to be more relevant or accurate than the current GAAP methodology in calculating net income or in its applicability in evaluating our operating performance. The method utilized to evaluate the value and performance of real estate under GAAP should be construed as a more relevant measure of operational performance and considered more prominently than the non-GAAP measures. Other REITs may not define FFO in accordance with the current National Association of Real Estate Investment Trusts (“NAREIT”) definition (as we do), or may interpret the current NAREIT definition differently than we do, or may calculate Core FFO or AFFO differently than we do. Consequently, our presentation of FFO, Core FFO and AFFO may not be comparable to other similarly-titled measures presented by other REITs. We consider FFO, Core FFO and AFFO useful indicators of our performance. Because FFO, Core FFO and AFFO calculations exclude such factors as depreciation and amortization of real estate assets and gain or loss from sales of operating real estate assets (which can vary among owners of identical assets in similar conditions based on historical cost accounting and useful-life estimates), FFO, Core FFO and AFFO presentations facilitate comparisons of operating performance between periods and between other REITs in our peer group. Funds from Operations, Core Funds from Operations and Adjusted Funds from Operations Funds From Operations Due to certain unique operating characteristics of real estate companies, as discussed below, NAREIT, an industry trade group, has promulgated a measure known as FFO, which we believe to be an appropriate supplemental measure to reflect the operating performance of a REIT. FFO is not equivalent to net income or loss as determined under GAAP. We calculate FFO, a non-GAAP measure, consistent with the standards established over time by the Board of Governors of NAREIT, as restated in a White Paper approved by the Board of Governors of NAREIT effective in December 2018 (the “White Paper”). The White Paper defines FFO as net income or loss computed in accordance with GAAP, excluding depreciation and amortization related to real estate, gain and loss from the sale of certain real estate assets, gain and loss from change in control and impairment write-downs of certain real estate assets and investments in entities when the impairment is directly attributable to decreases in the value of depreciable real estate held by the entity. Adjustments for unconsolidated partnerships and joint ventures are calculated to exclude the proportionate share of the non-controlling interest to arrive at FFO, Core FFO, AFFO and NOI attributable to stockholders, as applicable. Our FFO calculation complies with NAREIT’s definition. FFO includes adjustments related to the treatment of the Multi-Tenant Retail Portfolio as a discontinued operation, which includes adjustments for depreciation and amortization and loss (gain) on dispositions of real estate investments. |
| 30 The historical accounting convention used for real estate assets requires straight-line depreciation of buildings and improvements, and straight-line amortization of intangibles, which implies that the value of a real estate asset diminishes predictably over time. We believe that, because real estate values historically rise and fall with market conditions, including inflation, interest rates, unemployment and consumer spending, presentations of operating results for a REIT using historical accounting for depreciation and certain other items may be less informative. Historical accounting for real estate involves the use of GAAP. Any other method of accounting for real estate such as the fair value method cannot be construed to be any more accurate or relevant than the comparable methodologies of real estate valuation found in GAAP. Nevertheless, we believe that the use of FFO, which excludes the impact of real estate related depreciation and amortization, among other things, provides a more complete understanding of our performance to investors and to management, and, when compared year over year, reflects the impact on our operations from trends in occupancy rates, rental rates, operating costs, general and administrative expenses, and interest costs, which may not be immediately apparent from net income. Funds from Operations, Core Funds from Operations and Adjusted Funds from Operations (Cont’d) Core Funds From Operations In calculating Core FFO, we start with FFO, then we exclude certain non-core items such as merger, transaction and other costs, as well as certain other costs that are considered to be non-core, such as debt extinguishment or modification costs. The purchase of properties, and the corresponding expenses associated with that process, is a key operational feature of our core business plan to generate operational income and cash flows in order to make dividend payments to stockholders. In evaluating investments in real estate, we differentiate the costs to acquire the investment from the subsequent operations of the investment. We also add back non-cash write-offs of deferred financing costs, prepayment penalties and certain other costs incurred with the early extinguishment or modification of debt which are included in net income but are considered financing cash flows when paid in the statement of cash flows. We consider these write-offs and prepayment penalties to be capital transactions and not indicative of operations. By excluding expensed acquisition, transaction and other costs as well as non-core costs, we believe Core FFO provides useful supplemental information that is comparable for each type of real estate investment and is consistent with management’s analysis of the investing and operating performance of our properties. Core FFO includes adjustments related to the treatment of the Multi-Tenant Retail Portfolio as a discontinued operation, which includes adjustments for acquisition and transaction costs and loss on extinguishment of debt. Adjusted Funds From Operations In calculating AFFO, we start with Core FFO, then we exclude certain income or expense items from AFFO that we consider more reflective of investing activities, other non-cash income and expense items and the income and expense effects of other activities or items, including items that were paid in cash that are not a fundamental attribute of our business plan or were one time or non-recurring items. These items include early extinguishment or modification of debt and other items excluded in Core FFO as well as unrealized gain and loss, which may not ultimately be realized, such as gain or loss on derivative instruments, gain or loss on foreign currency transactions, and gain or loss on investments. In addition, by excluding non-cash income and expense items such as amortization of above-market and below-market leases intangibles, amortization of deferred financing costs, straight-line rent and equity-based compensation from AFFO, we believe we provide useful information regarding income and expense items which have a direct impact on our ongoing operating performance. We also exclude revenue attributable to the reimbursement by third parties of financing costs that we originally incurred because these revenues are not, in our view, related to operating performance. We also include the realized gain or loss on foreign currency exchange contracts for AFFO as such items are part of our ongoing operations and affect our current operating performance. APPENDIX: FINANCIAL DEFINITIONS |

| 31 Funds from Operations, Core Funds from Operations and Adjusted Funds from Operations (Cont’d) Adjusted Funds From Operations (cont’d) In calculating AFFO, we also exclude certain expenses which under GAAP are characterized as operating expenses in determining operating net income. All paid and accrued acquisition, transaction and other costs (including prepayment penalties for debt extinguishments or modifications and merger related expenses) and certain other expenses, including expenses related to our European tax restructuring and transition costs related to the RTL merger and internalizations, negatively impact our operating performance during the period in which expenses are incurred or properties are acquired and will also have negative effects on returns to investors, but are excluded by us as we believe they are not reflective of our on-going performance. Further, under GAAP, certain contemplated non-cash fair value and other non-cash adjustments are considered operating non-cash adjustments to net income. In addition, as discussed above, we view gain and loss from fair value adjustments as items which are unrealized and may not ultimately be realized and not reflective of ongoing operations and are therefore typically adjusted for when assessing operating performance. Excluding income and expense items detailed above from our calculation of AFFO provides information consistent with management’s analysis of our operating performance. Additionally, fair value adjustments, which are based on the impact of current market fluctuations and underlying assessments of general market conditions, but can also result from operational factors such as rental and occupancy rates, may not be directly related or attributable to our current operating performance. By excluding such changes that may reflect anticipated and unrealized gain or loss, we believe AFFO provides useful supplemental information. By providing AFFO, we believe we are presenting useful information that can be used to, among other things, assess our performance without the impact of transactions or other items that are not related to our portfolio of properties. AFFO presented by us may not be comparable to AFFO reported by other REITs that define AFFO differently. Furthermore, we believe that in order to facilitate a clear understanding of our operating results, AFFO should be examined in conjunction with net income (loss) calculated in accordance with GAAP as presented in our consolidated financial statements. AFFO should not be considered as an alternative to net income (loss) as an indication of our performance or to cash flows as a measure of our liquidity or ability to make distributions. Adjusted Earnings before Interest, Taxes, Depreciation and Amortization, Net Operating Income, Cash Net Operating Income and Cash Paid for Interest. We believe that Adjusted EBITDA, which is defined as earnings before interest, taxes, depreciation and amortization adjusted for acquisition, transaction and other costs, other non-cash items and including our pro-rata share from unconsolidated joint ventures, is an appropriate measure of our ability to incur and service debt. We also exclude revenue attributable to the reimbursement by third parties of financing costs that we originally incurred because these revenues are not, in our view, related to operating performance. All paid and accrued acquisition, transaction and other costs (including prepayment penalties for debt extinguishments or modifications) and certain other expenses, including expenses related to our European tax restructuring and transition costs related to the Merger and Internalization, negatively impact our operating performance during the period in which expenses are incurred or properties are acquired and will also have negative effects on returns to investors, but are not reflective of on-going performance. Adjusted EBITDA should not be considered as an alternative to cash flows from operating activities, as a measure of our liquidity or as an alternative to net income (loss) as calculated in accordance with GAAP as an indicator of our operating activities. Other REITs may calculate Adjusted EBITDA differently and our calculation should not be compared to that of other REITs. EBITDA includes adjustments related to the treatment of the sale of the Multi-Tenant Retail Portfolio as a discontinued operation, which includes adjustments for depreciation and amortization and interest expense. Adjusted EBITDA includes adjustments related to the treatment of the sale of the Multi-Tenant Retail Portfolio as a discontinued operation, which includes adjustments for merger, transaction and other costs, (loss) gain on dispositions of real estate investments, loss (gain) on derivative instruments, loss on extinguishment of debt and other income (expense). APPENDIX: FINANCIAL DEFINITIONS |
| 32 NOI is a non-GAAP financial measure equal to net income (loss), the most directly comparable GAAP financial measure, less discontinued operations, interest, other income and income from preferred equity investments and investment securities, plus corporate general and administrative expense, acquisition, transaction and other costs, depreciation and amortization, other noncash expenses and interest expense. We use NOI internally as a performance measure and believe NOI provides useful information to investors regarding our financial condition and results of operations because it reflects only those income and expense items that are incurred at the property level. Therefore, we believe NOI is a useful measure for evaluating the operating performance of our real estate assets and to make decisions about resource allocations. Further, we believe NOI is useful to investors as a performance measure because, when compared across periods, NOI reflects the impact on operations from trends in occupancy rates, rental rates, operating costs and acquisition activity on an unlevered basis, providing perspective not immediately apparent from net income. NOI excludes certain components from net income in order to provide results that are more closely related to a property’s results of operations. For example, interest expense is not necessarily linked to the operating performance of a real estate asset and is often incurred at the corporate level as opposed to the property level. In addition, depreciation and amortization, because of historical cost accounting and useful life estimates, may distort operating performance at the property level. NOI presented by us may not be comparable to NOI reported by other REITs that define NOI differently. We believe that in order to facilitate a clear understanding of our operating results, NOI should be examined in conjunction with net income (loss) as presented in our consolidated financial statements. NOI should not be considered as an alternative to net income (loss) as calculated in accordance with GAAP as an indication of our performance or to cash flows as a measure of our liquidity. Cash NOI is a non-GAAP financial measure that is intended to reflect the performance of our properties. We define Cash NOI as net operating income (which is separately defined herein) excluding amortization of above/below market lease intangibles and straight-line rent adjustments that are included in GAAP lease revenues. We believe that Cash NOI is a helpful measure that both investors and management can use to evaluate the current financial performance of our properties and it allows for comparison of our operating performance between periods and to other REITs. Cash NOI should not be considered as an alternative to net income (loss) as calculated in accordance with GAAP as an indication of our financial performance, or to cash flows as a measure of liquidity or our ability to fund all needs. The method by which we calculate and present Cash NOI may not be directly comparable to the way other REITs calculate and present Cash NOI. Cash NOI includes all of the adjustments described above for Adjusted EBITDA related to the treatment of the sale of the Multi-Tenant Retail Portfolio as a discontinued operation, as well as adjustments for general and administrative expenses. Cash Paid for Interest is calculated based on the interest expense less non-cash portion of interest expense and amortization of mortgage (discount) premium, net. Management believes that Cash Paid for Interest provides useful information to investors to assess our overall solvency and financial flexibility. Cash Paid for Interest should not be considered as an alternative to interest expense as determined in accordance with GAAP or any other GAAP financial measures and should only be considered together with and as a supplement to our financial information prepared in accordance with GAAP. APPENDIX: FINANCIAL DEFINITIONS |
| 33 NON – GAAP RECONCILIATIONS 1. This is a non-cash item and is added back as it is not considered indicative of operating performance. (Amounts in thousands) Three Months Ended 31-Mar-25 Net loss $(189,379) Depreciation and amortization 56,334 Interest expense 53,437 Income tax expense 3,280 Discontinued operations adjustments 47,219 EBITDA (29,109) Impairment charges 60,315 Equity-based compensation 3,093 Merger, transaction and other costs 1,579 Loss on dispositions of real estate investments 1,678 Loss on derivative instruments 3,856 Unrealized losses on undesignated foreign currency advances and other hedge ineffectiveness 6,351 Loss on extinguishment and modification of debt 418 Other income (48) Goodwill impairment(1) 7,134 Discontinued operations adjustments 83,149 Adjusted EBITDA 138,416 General and administrative 16,203 Discontinued operations adjustments 1,255 NOI 155,874 Amortization of above- and below- market leases and ground lease intangibles and right-of-use assets, net 160 Straight-line rent (5,235) Cash NOI $150,799 Cash Paid for Interest: Interest Expense – continuing operations $53,437 Non-cash portion of interest expense – discontinued operations 17,457 Non-cash portion of interest expense (2,486) Amortization of discounts on mortgages and senior notes (13,960) Total Cash Paid for Interest $54,448 |

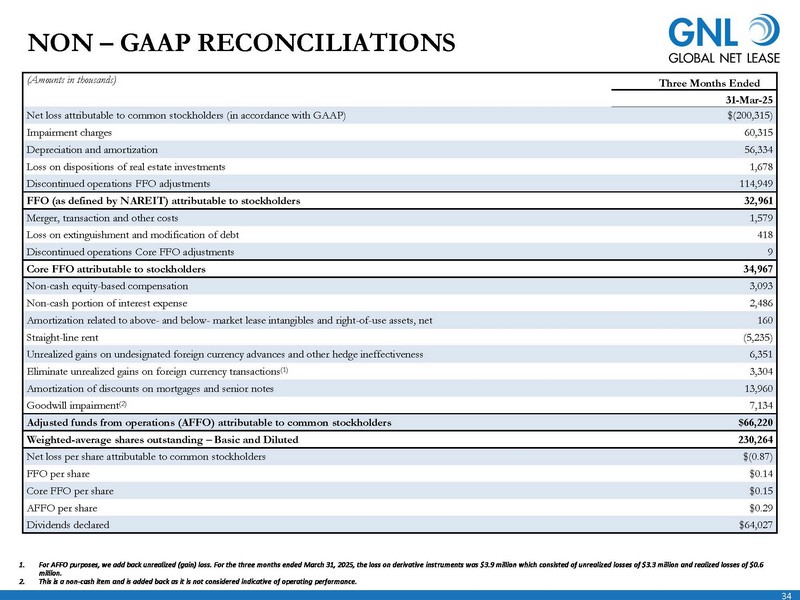
| 34 (Amounts in thousands) Three Months Ended 31-Mar-25 Net loss attributable to common stockholders (in accordance with GAAP) $(200,315) Impairment charges 60,315 Depreciation and amortization 56,334 Loss on dispositions of real estate investments 1,678 Discontinued operations FFO adjustments 114,949 FFO (as defined by NAREIT) attributable to stockholders 32,961 Merger, transaction and other costs 1,579 Loss on extinguishment and modification of debt 418 Discontinued operations Core FFO adjustments 9 Core FFO attributable to stockholders 34,967 Non-cash equity-based compensation 3,093 Non-cash portion of interest expense 2,486 Amortization related to above- and below- market lease intangibles and right-of-use assets, net 160 Straight-line rent (5,235) Unrealized gains on undesignated foreign currency advances and other hedge ineffectiveness 6,351 Eliminate unrealized gains on foreign currency transactions(1) 3,304 Amortization of discounts on mortgages and senior notes 13,960 Goodwill impairment(2) 7,134 Adjusted funds from operations (AFFO) attributable to common stockholders $66,220 Weighted-average shares outstanding – Basic and Diluted 230,264 Net loss per share attributable to common stockholders $(0.87) FFO per share $0.14 Core FFO per share $0.15 AFFO per share $0.29 Dividends declared $64,027 NON – GAAP RECONCILIATIONS 1. For AFFO purposes, we add back unrealized (gain) loss. For the three months ended March 31, 2025, the loss on derivative instruments was $3.9 million which consisted of unrealized losses of $3.3 million and realized losses of $0.6 million. 2. This is a non-cash item and is added back as it is not considered indicative of operating performance. |