Shareholder Report
Feb. 28, 2025
USD ($)
Holding
Shareholder Report |
6 Months Ended |
|---|---|
|
Feb. 28, 2025
USD ($)
Holding
| |
| Shareholder Report [Line Items] | |
| Document Type | N-CSRS |
| Amendment Flag | false |
| Registrant Name | UNIFIED SERIES TRUST |
| Entity Central Index Key | 0001199046 |
| Entity Investment Company Type | N-1A |
| Document Period End Date | Feb. 28, 2025 |
| C000215070 | |
| Shareholder Report [Line Items] | |
| Fund Name | Fisher Investments Institutional Group All Foreign Equity Environmental and Social Values Fund |
| Class Name | All Foreign Equity Environmental and Social Values Fund |
| Trading Symbol | IAFEX |
| Annual or Semi-Annual Statement [Text Block] | This semi-annual shareholder report contains important information about Fisher Investments Institutional Group All Foreign Equity Environmental and Social Values Fund for the period of September 1, 2024 to February 28, 2025. |
| Shareholder Report Annual or Semi-Annual | Semi-Annual Shareholder Report |
| Additional Information [Text Block] | You can find additional information about the Fund at https://Inst40ActTSR.com. You can also request this information by contacting us at (800) 851-8845. |
| Additional Information Phone Number | (800) 851-8845 |
| Additional Information Website | https://Inst40ActTSR.com |
| Expenses [Text Block] | |
| Expenses Paid, Amount | $ 34 |
| Expense Ratio, Percent | 0.68% |
| Material Change Date | Feb. 28, 2025 |
| AssetsNet | $ 210,582 |
| Holdings Count | Holding | 74 |
| Advisory Fees Paid, Amount | $ 0 |
| InvestmentCompanyPortfolioTurnover | 21.00% |
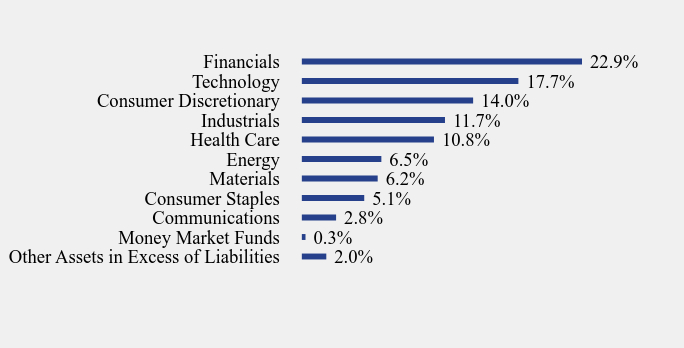
| Additional Fund Statistics [Text Block] | |
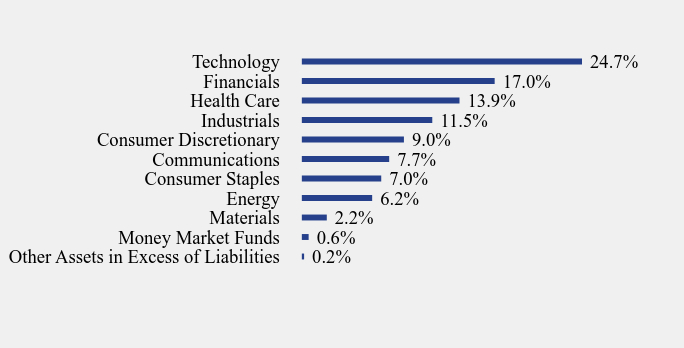
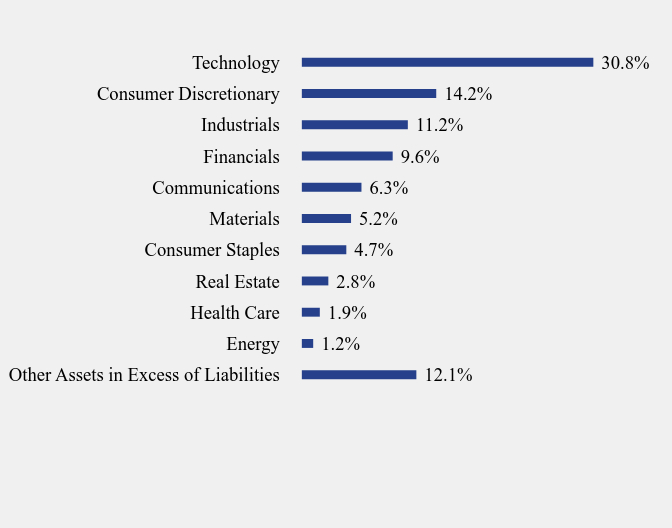
| Holdings [Text Block] | |
| C000215077 | |
| Shareholder Report [Line Items] | |
| Fund Name | Fisher Investments Institutional Group ESG Fixed Income Fund |
| Class Name | ESG Fixed Income Fund for Retirement Plans |
| Trading Symbol | QDVBX |
| Annual or Semi-Annual Statement [Text Block] | This semi-annual shareholder report contains important information about Fisher Investments Institutional Group ESG Fixed Income Fund for the period of September 1, 2024 to February 28, 2025. |
| Shareholder Report Annual or Semi-Annual | Semi-Annual Shareholder Report |
| Additional Information [Text Block] | You can find additional information about the Fund at https://Inst40ActTSR.com. You can also request this information by contacting us at (800) 851-8845. |
| Additional Information Phone Number | (800) 851-8845 |
| Additional Information Website | https://Inst40ActTSR.com |
| Expenses [Text Block] | |
| Expenses Paid, Amount | $ 0 |
| Expense Ratio, Percent | 0.00% |
| Material Change Date | Feb. 28, 2025 |
| AssetsNet | $ 3,031,920 |
| Holdings Count | Holding | 14 |
| Advisory Fees Paid, Amount | $ 0 |
| InvestmentCompanyPortfolioTurnover | 15.00% |
| Additional Fund Statistics [Text Block] | |
| Holdings [Text Block] | |
| C000215078 | |
| Shareholder Report [Line Items] | |
| Fund Name | Fisher Investments Institutional Group ESG Stock Fund |
| Class Name | ESG Stock Fund for Retirement Plans |
| Trading Symbol | QDVSX |
| Annual or Semi-Annual Statement [Text Block] | This semi-annual shareholder report contains important information about Fisher Investments Institutional Group ESG Stock Fund for the period of September 1, 2024 to February 28, 2025. |
| Shareholder Report Annual or Semi-Annual | Semi-Annual Shareholder Report |
| Additional Information [Text Block] | You can find additional information about the Fund at https://Inst40ActTSR.com. You can also request this information by contacting us at (800) 851-8845. |
| Additional Information Phone Number | (800) 851-8845 |
| Additional Information Website | https://Inst40ActTSR.com |
| Expenses [Text Block] | |
| Expenses Paid, Amount | $ 0 |
| Expense Ratio, Percent | 0.00% |
| Material Change Date | Feb. 28, 2025 |
| AssetsNet | $ 302,720 |
| Holdings Count | Holding | 94 |
| Advisory Fees Paid, Amount | $ 0 |
| InvestmentCompanyPortfolioTurnover | 3.00% |
| Additional Fund Statistics [Text Block] | |
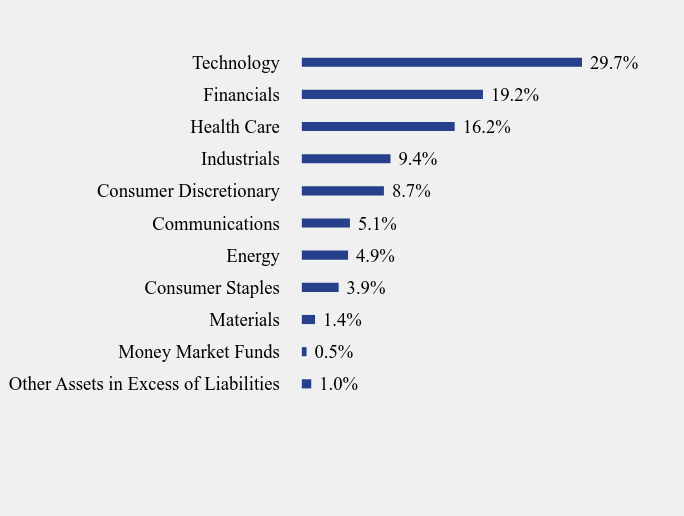
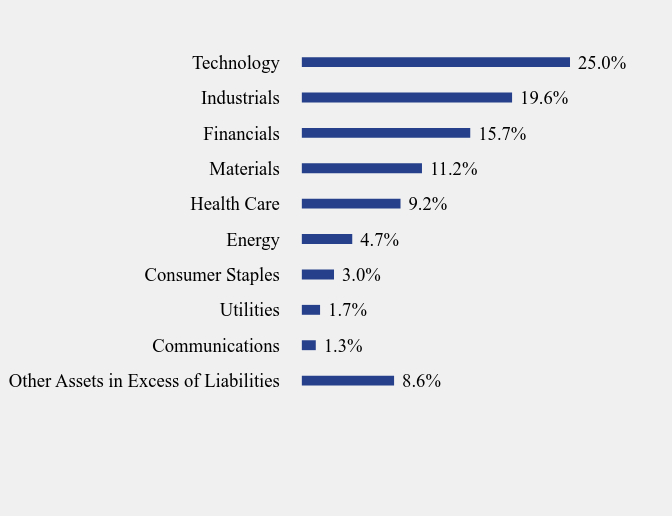
| Holdings [Text Block] | |
| C000215079 | |
| Shareholder Report [Line Items] | |
| Fund Name | Fisher Investments Institutional Group Fixed Income Fund |
| Class Name | Fixed Income Fund for Retirement Plans |
| Trading Symbol | QDIBX |
| Annual or Semi-Annual Statement [Text Block] | This semi-annual shareholder report contains important information about Fisher Investments Institutional Group Fixed Income Fund for the period of September 1, 2024 to February 28, 2025. |
| Shareholder Report Annual or Semi-Annual | Semi-Annual Shareholder Report |
| Additional Information [Text Block] | You can find additional information about the Fund at https://Inst40ActTSR.com. You can also request this information by contacting us at (800) 851-8845. |
| Additional Information Phone Number | (800) 851-8845 |
| Additional Information Website | https://Inst40ActTSR.com |
| Expenses [Text Block] | |
| Expenses Paid, Amount | $ 0 |
| Expense Ratio, Percent | 0.00% |
| Material Change Date | Feb. 28, 2025 |
| AssetsNet | $ 3,059,346 |
| Holdings Count | Holding | 13 |
| Advisory Fees Paid, Amount | $ 0 |
| InvestmentCompanyPortfolioTurnover | 14.00% |
| Additional Fund Statistics [Text Block] | |
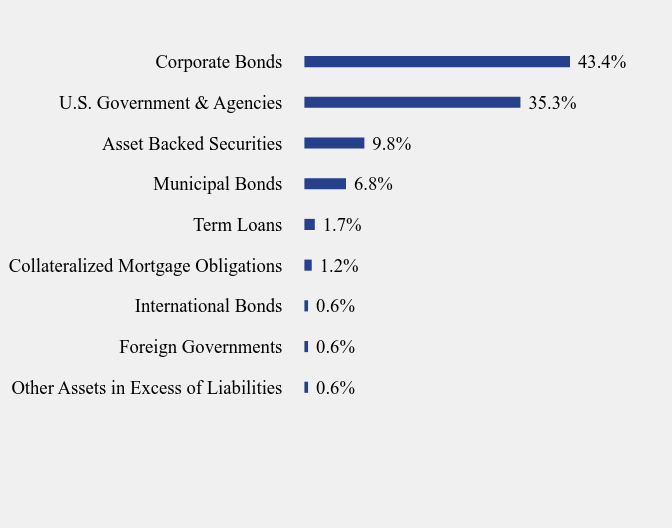
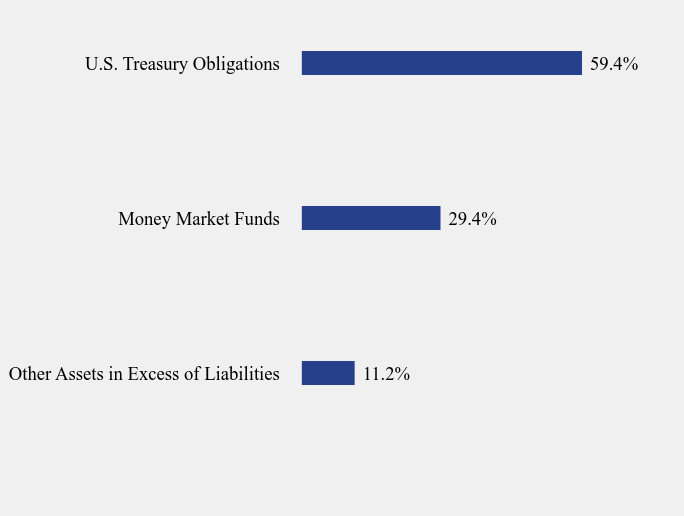
| Holdings [Text Block] | |
| C000215080 | |
| Shareholder Report [Line Items] | |
| Fund Name | Fisher Investments Institutional Group Stock Fund |
| Class Name | Stock Fund for Retirement Plans |
| Trading Symbol | QDISX |
| Annual or Semi-Annual Statement [Text Block] | This semi-annual shareholder report contains important information about Fisher Investments Institutional Group Stock Fund for the period of September 1, 2024 to February 28, 2025. |
| Shareholder Report Annual or Semi-Annual | Semi-Annual Shareholder Report |
| Additional Information [Text Block] | You can find additional information about the Fund at https://Inst40ActTSR.com. You can also request this information by contacting us at (800) 851-8845. |
| Additional Information Phone Number | (800) 851-8845 |
| Additional Information Website | https://Inst40ActTSR.com |
| Expenses [Text Block] | |
| Expenses Paid, Amount | $ 0 |
| Expense Ratio, Percent | 0.00% |
| Material Change Date | Feb. 28, 2025 |
| AssetsNet | $ 302,434 |
| Holdings Count | Holding | 101 |
| Advisory Fees Paid, Amount | $ 0 |
| InvestmentCompanyPortfolioTurnover | 4.00% |
| Additional Fund Statistics [Text Block] | |
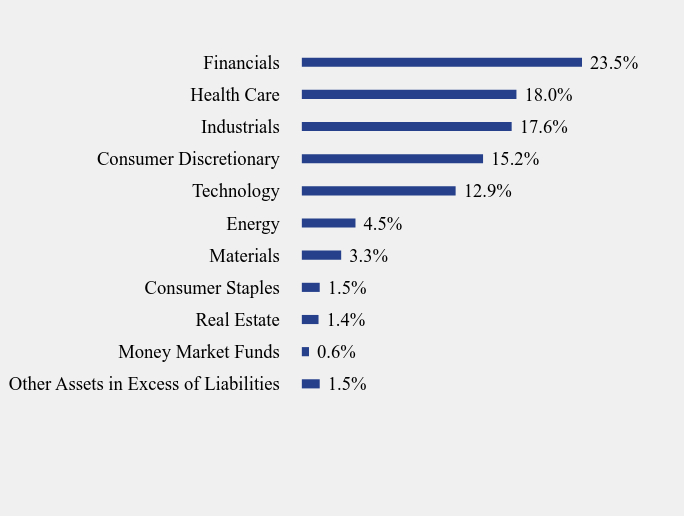
| Holdings [Text Block] | |
| C000215071 | |
| Shareholder Report [Line Items] | |
| Fund Name | Fisher Investments Institutional Group U.S. Large Cap Equity Environmental and Social Values Fund |
| Class Name | U.S. Large Cap Equity Environmental and Social Values Fund |
| Trading Symbol | ILESX |
| Annual or Semi-Annual Statement [Text Block] | This semi-annual shareholder report contains important information about Fisher Investments Institutional Group U.S. Large Cap Equity Environmental and Social Values Fund for the period of September 1, 2024 to February 28, 2025. |
| Shareholder Report Annual or Semi-Annual | Semi-Annual Shareholder Report |
| Additional Information [Text Block] | You can find additional information about the Fund at https://Inst40ActTSR.com. You can also request this information by contacting us at (800) 851-8845. |
| Additional Information Phone Number | (800) 851-8845 |
| Additional Information Website | https://Inst40ActTSR.com |
| Expenses [Text Block] | |
| Expenses Paid, Amount | $ 24 |
| Expense Ratio, Percent | 0.47% |
| Material Change Date | Feb. 28, 2025 |
| AssetsNet | $ 308,393 |
| Holdings Count | Holding | 60 |
| Advisory Fees Paid, Amount | $ 0 |
| InvestmentCompanyPortfolioTurnover | 17.00% |
| Additional Fund Statistics [Text Block] | |
| Holdings [Text Block] | |
| C000215072 | |
| Shareholder Report [Line Items] | |
| Fund Name | Fisher Investments Institutional Group U.S. Small Cap Equity Fund |
| Class Name | U.S. Small Cap Equity Fund |
| Trading Symbol | IUSCX |
| Annual or Semi-Annual Statement [Text Block] | This semi-annual shareholder report contains important information about Fisher Investments Institutional Group U.S. Small Cap Equity Fund for the period of September 1, 2024 to February 28, 2025. |
| Shareholder Report Annual or Semi-Annual | Semi-Annual Shareholder Report |
| Additional Information [Text Block] | You can find additional information about the Fund at https://Inst40ActTSR.com. You can also request this information by contacting us at (800) 851-8845. |
| Additional Information Phone Number | (800) 851-8845 |
| Additional Information Website | https://Inst40ActTSR.com |
| Expenses [Text Block] | |
| Expenses Paid, Amount | $ 36 |
| Expense Ratio, Percent | 0.75% |
| Material Change Date | Feb. 28, 2025 |
| AssetsNet | $ 203,806 |
| Holdings Count | Holding | 96 |
| Advisory Fees Paid, Amount | $ 0 |
| InvestmentCompanyPortfolioTurnover | 20.00% |
| Additional Fund Statistics [Text Block] | |
| Holdings [Text Block] | |
| C000234764 | |
| Shareholder Report [Line Items] | |
| Fund Name | OneAscent Core Plus Bond ETF |
| Trading Symbol | OACP |
| Security Exchange Name | NYSEArca |
| Annual or Semi-Annual Statement [Text Block] | This semi-annual shareholder report contains important information about OneAscent Core Plus Bond ETF for the period of September 1, 2024 to February 28, 2025. |
| Shareholder Report Annual or Semi-Annual | Semi-Annual Shareholder Report |
| Additional Information [Text Block] | You can find additional information about the Fund at https://investments.oneascent.com/d/semi-annual-report-oacp. You can also request this information by contacting us at (800) 222-8274. |
| Additional Information Phone Number | (800) 222-8274 |
| Additional Information Website | https://investments.oneascent.com/d/semi-annual-report-oacp |
| Expenses [Text Block] | |
| Expenses Paid, Amount | $ 36 |
| Expense Ratio, Percent | 0.72% |
| AssetsNet | $ 166,927,526 |
| Holdings Count | Holding | 190 |
| Advisory Fees Paid, Amount | $ 412,474 |
| InvestmentCompanyPortfolioTurnover | 65.00% |
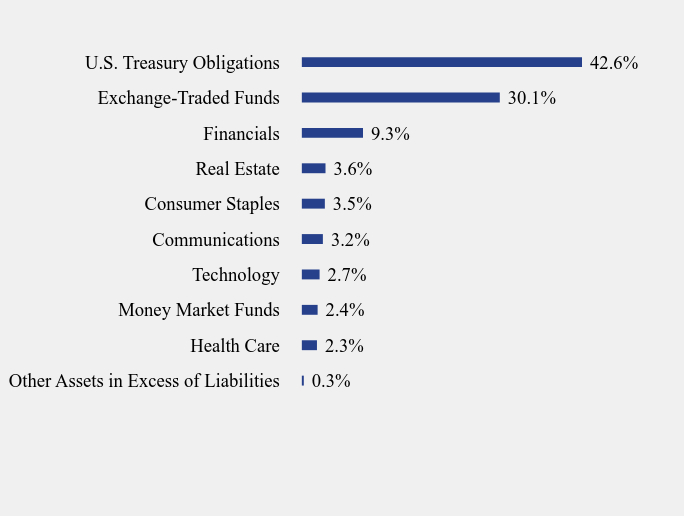
| Additional Fund Statistics [Text Block] | |
| Holdings [Text Block] | |
| C000237524 | |
| Shareholder Report [Line Items] | |
| Fund Name | OneAscent Emerging Markets ETF |
| Trading Symbol | OAEM |
| Security Exchange Name | NYSEArca |
| Annual or Semi-Annual Statement [Text Block] | This semi-annual shareholder report contains important information about OneAscent Emerging Markets ETF for the period of September 1, 2024 to February 28, 2025. |
| Shareholder Report Annual or Semi-Annual | Semi-Annual Shareholder Report |
| Additional Information [Text Block] | You can find additional information about the Fund at https://investments.oneascent.com/etfs/oaem. You can also request this information by contacting us at (800) 222-8274. |
| Additional Information Phone Number | (800) 222-8274 |
| Additional Information Website | https://investments.oneascent.com/etfs/oaem |
| Expenses [Text Block] | |
| Expenses Paid, Amount | $ 61 |
| Expense Ratio, Percent | 1.25% |
| AssetsNet | $ 43,603,778 |
| Holdings Count | Holding | 37 |
| Advisory Fees Paid, Amount | $ 260,602 |
| InvestmentCompanyPortfolioTurnover | 15.00% |
| Additional Fund Statistics [Text Block] | |
| Holdings [Text Block] | |
| C000237525 | |
| Shareholder Report [Line Items] | |
| Fund Name | OneAscent International Equity ETF |
| Trading Symbol | OAIM |
| Security Exchange Name | NYSEArca |
| Annual or Semi-Annual Statement [Text Block] | This semi-annual shareholder report contains important information about OneAscent International Equity ETF for the period of September 1, 2024 to February 28, 2025. |
| Shareholder Report Annual or Semi-Annual | Semi-Annual Shareholder Report |
| Additional Information [Text Block] | You can find additional information about the Fund at https://investments.oneascent.com/etfs/oaim. You can also request this information by contacting us at (800) 222-8274. |
| Additional Information Phone Number | (800) 222-8274 |
| Additional Information Website | https://investments.oneascent.com/etfs/oaim |
| Expenses [Text Block] | |
| Expenses Paid, Amount | $ 47 |
| Expense Ratio, Percent | 0.95% |
| AssetsNet | $ 159,821,183 |
| Holdings Count | Holding | 47 |
| Advisory Fees Paid, Amount | $ 499,458 |
| InvestmentCompanyPortfolioTurnover | 26.00% |
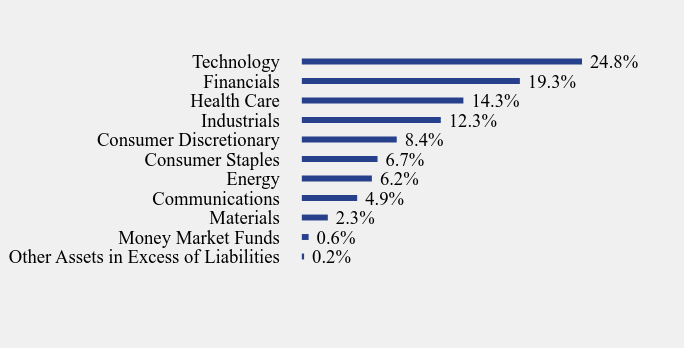
| Additional Fund Statistics [Text Block] | |
| Holdings [Text Block] | |
| C000231861 | |
| Shareholder Report [Line Items] | |
| Fund Name | OneAscent Large Cap Core ETF |
| Trading Symbol | OALC |
| Security Exchange Name | NYSEArca |
| Annual or Semi-Annual Statement [Text Block] | This semi-annual shareholder report contains important information about OneAscent Large Cap Core ETF for the period of September 1, 2024 to February 28, 2025. |
| Shareholder Report Annual or Semi-Annual | Semi-Annual Shareholder Report |
| Additional Information [Text Block] | You can find additional information about the Fund at https://investments.oneascent.com/etfs/oalc. You can also request this information by contacting us at (800) 222-8274. |
| Additional Information Phone Number | (800) 222-8274 |
| Additional Information Website | https://investments.oneascent.com/etfs/oalc |
| Expenses [Text Block] | |
| Expenses Paid, Amount | $ 25 |
| Expense Ratio, Percent | 0.49% |
| Material Change Date | Feb. 28, 2025 |
| AssetsNet | $ 125,114,115 |
| Holdings Count | Holding | 202 |
| Advisory Fees Paid, Amount | $ 168,546 |
| InvestmentCompanyPortfolioTurnover | 12.00% |
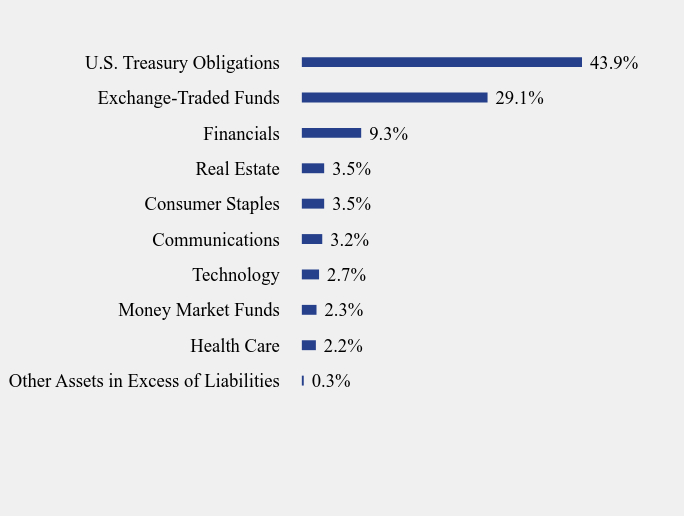
| Additional Fund Statistics [Text Block] | |
| Holdings [Text Block] | |
| C000249799 | |
| Shareholder Report [Line Items] | |
| Fund Name | OneAscent Small Cap Core ETF |
| Trading Symbol | OASC |
| Security Exchange Name | NYSEArca |
| Annual or Semi-Annual Statement [Text Block] | This semi-annual shareholder report contains important information about OneAscent Small Cap Core ETF for the period of September 1, 2024 to February 28, 2025. |
| Shareholder Report Annual or Semi-Annual | Semi-Annual Shareholder Report |
| Additional Information [Text Block] | You can find additional information about the Fund at https://investments.oneascent.com/etfs/oasc. You can also request this information by contacting us at (800) 222-8274. |
| Additional Information Phone Number | (800) 222-8274 |
| Additional Information Website | https://investments.oneascent.com/etfs/oasc |
| Expenses [Text Block] | |
| Expenses Paid, Amount | $ 31 |
| Expense Ratio, Percent | 0.64% |
| Material Change Date | Feb. 28, 2025 |
| AssetsNet | $ 18,595,215 |
| Holdings Count | Holding | 214 |
| Advisory Fees Paid, Amount | $ 0 |
| InvestmentCompanyPortfolioTurnover | 15.00% |
| Additional Fund Statistics [Text Block] | |
| Holdings [Text Block] | |
| C000176086 | |
| Shareholder Report [Line Items] | |
| Fund Name | Tactical Multi-Purpose Fund |
| Class Name | Tactical Multi-Purpose Fund |
| Trading Symbol | TMPFX |
| Annual or Semi-Annual Statement [Text Block] | This semi-annual shareholder report contains important information about Tactical Multi-Purpose Fund for the period of September 1, 2024 to February 28, 2025. |
| Shareholder Report Annual or Semi-Annual | Semi-Annual Shareholder Report |
| Additional Information [Text Block] | You can find additional information about the Fund at https://Inst40ActTSR.com. You can also request this information by contacting us at (800) 550-1071. |
| Additional Information Phone Number | (800) 550-1071 |
| Additional Information Website | https://Inst40ActTSR.com |
| Expenses [Text Block] | |
| Expenses Paid, Amount | $ 50 |
| Expense Ratio, Percent | 1.00% |
| Material Change Date | Feb. 28, 2025 |
| AssetsNet | $ 26,848 |
| Holdings Count | Holding | 2 |
| Advisory Fees Paid, Amount | $ 0 |
| InvestmentCompanyPortfolioTurnover | 0.00% |
| Additional Fund Statistics [Text Block] | |
| Holdings [Text Block] |