The fund’s investment objective is to seek capital appreciation.
This table describes the fees and expenses that you may pay when you hold shares of the fund. If the fees and expenses imposed by the insurance company that issued your variable contracts or other eligible investor through which the fund is offered were included, your expenses would be higher.
Annual Fund Operating Expenses - MFS Growth Series |
Initial Class Shares |
Service Class Shares |
|
|---|---|---|---|
| Management Fee | 0.70% | 0.70% | |
| Distribution and/or Service (12b-1) Fees | none | 0.25% | |
| Other Expenses | 0.03% | 0.03% | |
| Total Annual Fund Operating Expenses | 0.73% | 0.98% | |
| Fee Reductions and/or Expense Reimbursements | [1] | (0.01%) | (0.01%) |
| Total Annual Fund Operating Expenses After Fee Reductions and/or Expense Reimbursements | 0.72% | 0.97% | |
| [1] | Massachusetts Financial Services Company (MFS) has agreed in writing to waive at least 0.01% of the fund's management fee as part of an agreement pursuant to which MFS has agreed to reduce its management fee by a specified amount if certain MFS mutual fund assets exceed thresholds agreed to by MFS and the fund's Board of Trustees. The agreement to waive at least 0.01% of the management fee will continue until modified by the fund's Board of Trustees, but such agreement will continue until at least April 30, 2026. |
This example is intended to help you compare the cost of investing in the fund with the cost of investing in other mutual funds. If the fees and expenses imposed by the insurance company that issued your variable contracts or other eligible investor through which an investment in the fund is made were included, your expenses would be higher.
The example assumes that: you invest $10,000 in the fund for the time periods indicated and you redeem your shares at the end of the time periods; your investment has a 5% return each year; and the fund’s operating expenses remain the same.
Expense Example - MFS Growth Series - USD ($) |
Initial Class Shares |
Service Class Shares |
|---|---|---|
| 1 Year | $ 74 | $ 99 |
| 3 Years | 232 | 311 |
| 5 Years | 405 | 541 |
| 10 Years | $ 906 | $ 1,200 |
The fund pays transaction costs, such as commissions, when it buys and sells securities (or “turns over” its portfolio). A higher portfolio turnover rate may indicate higher transaction costs. These transaction costs, which are not reflected in “Annual Fund Operating Expenses” or in the “Example,” affect the fund’s performance. During the most recent fiscal year, the fund’s portfolio turnover rate was 33% of the average value of its portfolio.
MFS (Massachusetts Financial Services Company, the fund's investment adviser) normally invests the fund’s assets primarily in equity securities. Equity securities include common stocks, depositary receipts, and other securities that represent an ownership interest (or right to acquire an ownership interest) in a company or other issuer.
MFS focuses on investing the fund’s assets in the stocks of companies it believes have above average potential with respect to the rate and duration of earnings growth compared to other companies (growth companies).
While MFS may invest the fund’s assets in securities of companies of any size, MFS primarily invests in securities of companies with large capitalizations.
MFS may invest the fund’s assets in foreign securities.
MFS normally invests the fund's assets across different industries and sectors, but MFS may invest a significant percentage of the fund's assets in issuers in a single industry or sector.
MFS may invest a significant percentage of the fund’s assets in a single issuer or a small number of issuers.
MFS uses an active bottom-up investment approach to buying and selling investments for the fund. Investments are selected primarily based on fundamental analysis of individual issuers. Quantitative screening tools that systematically evaluate issuers may also be considered.
Risk Table - MFS Growth Series |
Risk [Text Block] |
|---|---|
| Principal Risks | Principal Risks As with any mutual fund, the fund may not achieve its objective and/or you could lose money on your investment in the fund. An investment in the fund is not a bank deposit and is not insured or guaranteed by the Federal Deposit Insurance Corporation or any other governmental agency. The principal risks of investing in the fund are: |
| Risk Lose Money [Member] | As with any mutual fund, the fund may not achieve its objective and/or you could lose money on your investment in the fund. |
| Risk Not Insured [Member] | An investment in the fund is not a bank deposit and is not insured or guaranteed by the Federal Deposit Insurance Corporation or any other governmental agency. |
| Investment Selection Risk | Investment Selection Risk: MFS' investment analysis and its selection of investments may not produce the intended results and/or can lead to an investment focus that results in the fund underperforming other funds with similar investment strategies and/or underperforming the markets in which the fund invests. In addition, to the extent MFS considers quantitative tools in managing the fund, such tools may not produce the intended results. |
| Equity Market Risk/Company Risk | Equity Market Risk/Company Risk: Equity markets are volatile and can decline significantly in response to changes in, or investor perceptions of, issuer, market, economic, industry, political, regulatory, geopolitical, environmental, public health, and other conditions. These conditions can affect a single issuer or type of security, issuers within a broad market sector, industry or geographic region, or the equity markets in general. Certain events can have a dramatic adverse effect on equity markets and may lead to periods of high volatility in an equity market or a segment of an equity market. The value of an investment held by the fund may decline due to factors directly related to the issuer. |
| Growth Company Risk | Growth Company Risk: The stocks of growth companies can be more sensitive to the company’s earnings and more volatile than the market in general. |
| Foreign Risk | Foreign Risk: Exposure to foreign markets through issuers or currencies can involve additional risks relating to market, economic, industry, political, regulatory, geopolitical, environmental, public health, and other conditions. These factors can make foreign investments, especially those tied economically to countries with developing economies or countries subject to sanctions or the threat of new or modified sanctions, more volatile and less liquid than U.S. investments. In addition, foreign markets can react differently to these conditions than the U.S. market. |
| Focus Risk | Focus Risk: Issuers in a single industry, sector, country, or region can react similarly to market, currency, political, economic, regulatory, geopolitical, environmental, public health, and other conditions, and the fund's performance will be affected by the conditions in the industries, sectors, countries, and regions to which the fund is exposed. If MFS invests a significant percentage of the fund's assets in a single issuer or small number of issuers, the fund’s performance could be more volatile than the performance of more diversified funds. |
| Liquidity Risk | Liquidity Risk: It may be difficult to value, and it may not be possible to sell, certain investments, types of investments, and/or investments in certain segments of the market, and the fund may have to sell certain of these investments at prices or times that are not advantageous in order to meet redemptions or other cash needs. |
| Large Shareholder Risk | Large Shareholder Risk: From time to time, shareholders of the fund (which may include institutional investors, financial intermediaries, or other MFS funds) may make relatively large redemptions or purchases of fund shares. These transactions may cause the fund to sell securities or invest additional cash, as the case may be, at disadvantageous prices. Redemptions of a large number of shares also may increase transaction and other costs or have adverse tax consequences for shareholders of the fund by requiring a sale of portfolio securities. Purchases of a large number of shares may adversely affect the fund's performance to the extent that it takes time to invest new cash and the fund maintains a larger cash position than it ordinarily would. |
The bar chart and performance table below are intended to provide some indication of the risks of investing in the fund by showing changes in the fund’s performance over time and how the fund's
performance over time compares with that of (i) a broad measure of market performance and (ii) the performance of an additional index that the adviser believes more closely reflects the market segments in which the fund invests.
The fund’s past performance does not necessarily indicate how the fund will perform in the future. Updated performance is available at mfs.com or by calling 1-877-411-3325. If the fees and expenses imposed by the insurance company that issued your variable contracts or other eligible investor through which an investment in the fund is made were included, they would reduce the returns shown.
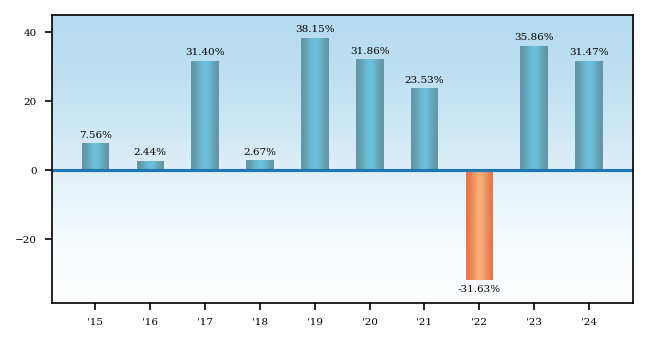
The total return for the three-month period ended March 31, 2025, was (8.95)%. During the period(s) shown in the bar chart, the highest quarterly return was 25.19% (for the calendar quarter ended June 30, 2020) and the lowest quarterly return was (19.44)% (for the calendar quarter ended June 30, 2022).
Average Annual Total Returns - MFS Growth Series |
Label |
1 Year |
5 Years |
10 Years |
|---|---|---|---|---|
| Initial Class Shares | 31.47% | 14.74% | 15.11% | |
| Service Class Shares | 31.15% | 14.46% | 14.82% | |
| Russell 3000® Index | Russell 3000® Index | 23.81% | 13.86% | 12.55% |
| Russell 1000® Growth Index | Russell 1000® Growth Index | 33.36% | 18.96% | 16.78% |