| PTC Therapeutics PIVOT-HD Phase 2 Readout 1 Matthew B. Klein, MD CEO May 2025 PIVOT-HD Topline Results |
| PTC Therapeutics PIVOT-HD Phase 2 Readout Forward Looking Statements 2 This presentation contains forward-looking statements within the meaning of The Private Securities Litigation Reform Act of 1995. All statements contained in this presentation, other than statements of historic fact, are forward-looking statements, including statements with respect to the future expectations, plans and prospects for PTC, PTC's strategy, including with respect to the expected timing of clinical trials and studies, availability of data, regulatory submissions and responses and other matters, future operations, future financial position, future revenues, projected costs; and the objectives of management. Other forward-looking statements may be identified by the words, "guidance", "plan," "anticipate," "believe," "estimate," "expect," "intend," "may," "target," "potential," "will," "would," "could," "should," "continue," and similar expressions. PTC's actual results, performance or achievements could differ materially from those expressed or implied by forward-looking statements it makes as a result of a variety of risks and uncertainties, including those related to: the outcome of pricing, coverage and reimbursement negotiations with third party payors for PTC's products or product candidates that PTC commercializes or may commercialize in the future; expectations with respect to PTC's license and collaboration agreement with Novartis Pharmaceuticals Corporation including its right to receive development, regulatory and sales milestones, profit sharing and royalty payments from Novartis; significant business effects, including the effects of industry, market, economic, political or regulatory conditions; changes in tax and other laws, regulations, rates and policies; the eligible patient base and commercial potential of PTC's products and product candidates; PTC's scientific approach and general development progress; the sufficiency of PTC's cash resources and its ability to obtain adequate financing in the future for its foreseeable and unforeseeable operating expenses and capital expenditures; and the factors discussed in the "Risk Factors" section of PTC's most recent Annual Report on Form 10-K, as well as any updates to these risk factors filed from time to time in PTC's other filings with the SEC. You are urged to carefully consider all such factors. As with any pharmaceutical under development, there are significant risks in the development, regulatory approval and commercialization of new products. There are no guarantees that any product will receive or maintain regulatory approval in any territory, or prove to be commercially successful. The forward-looking statements contained herein represent PTC's views only as of the date of this presentation and PTC does not undertake or plan to update or revise any such forward-looking statements to reflect actual results or changes in plans, prospects, assumptions, estimates or projections, or other circumstances occurring after the date of this presentation except as required by law. |
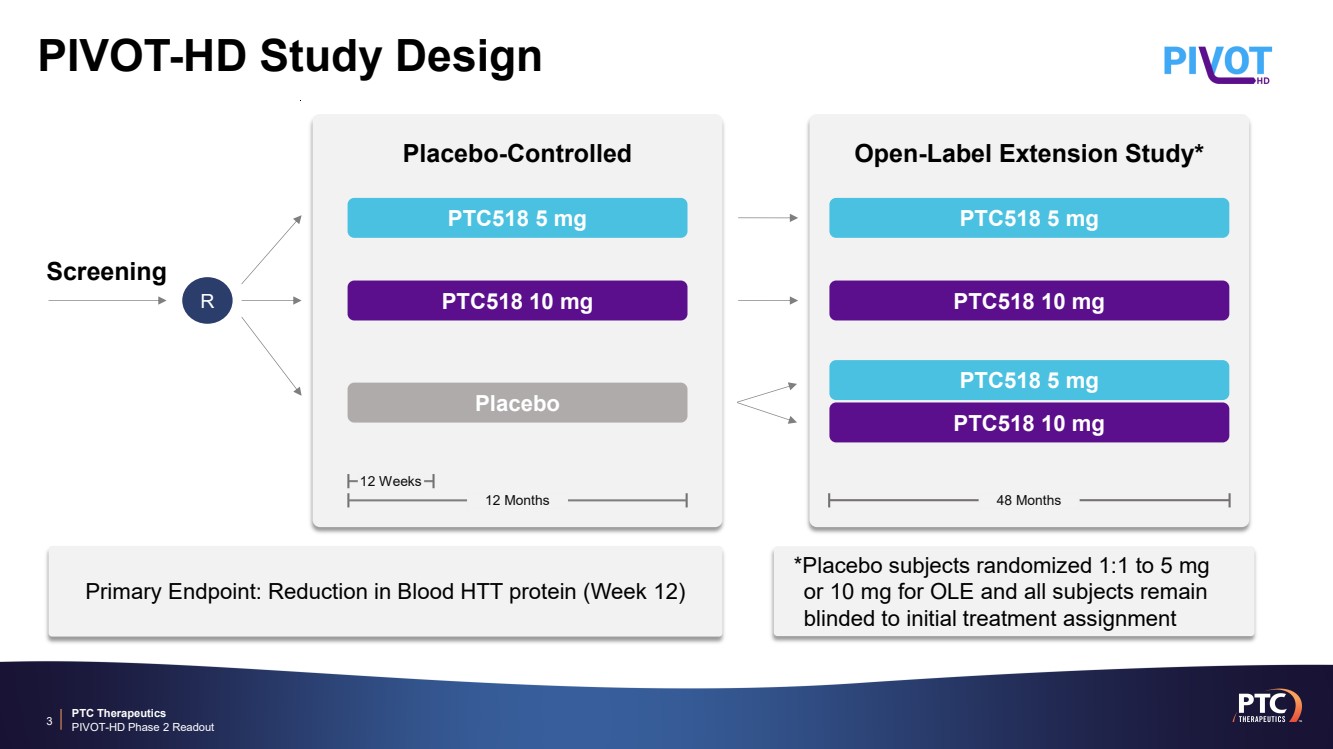
| PTC Therapeutics PIVOT-HD Phase 2 Readout PIVOT-HD Study Design 3 *Placebo subjects randomized 1:1 to 5 mg or 10 mg for OLE and all subjects remain blinded to initial treatment assignment Primary Endpoint: Reduction in Blood HTT protein (Week 12) 12 Weeks Placebo-Controlled PTC518 5 mg PTC518 10 mg 12 Months Placebo 48 Months Open-Label Extension Study* PTC518 5 mg PTC518 10 mg PTC518 5 mg PTC518 10 mg Screening R |
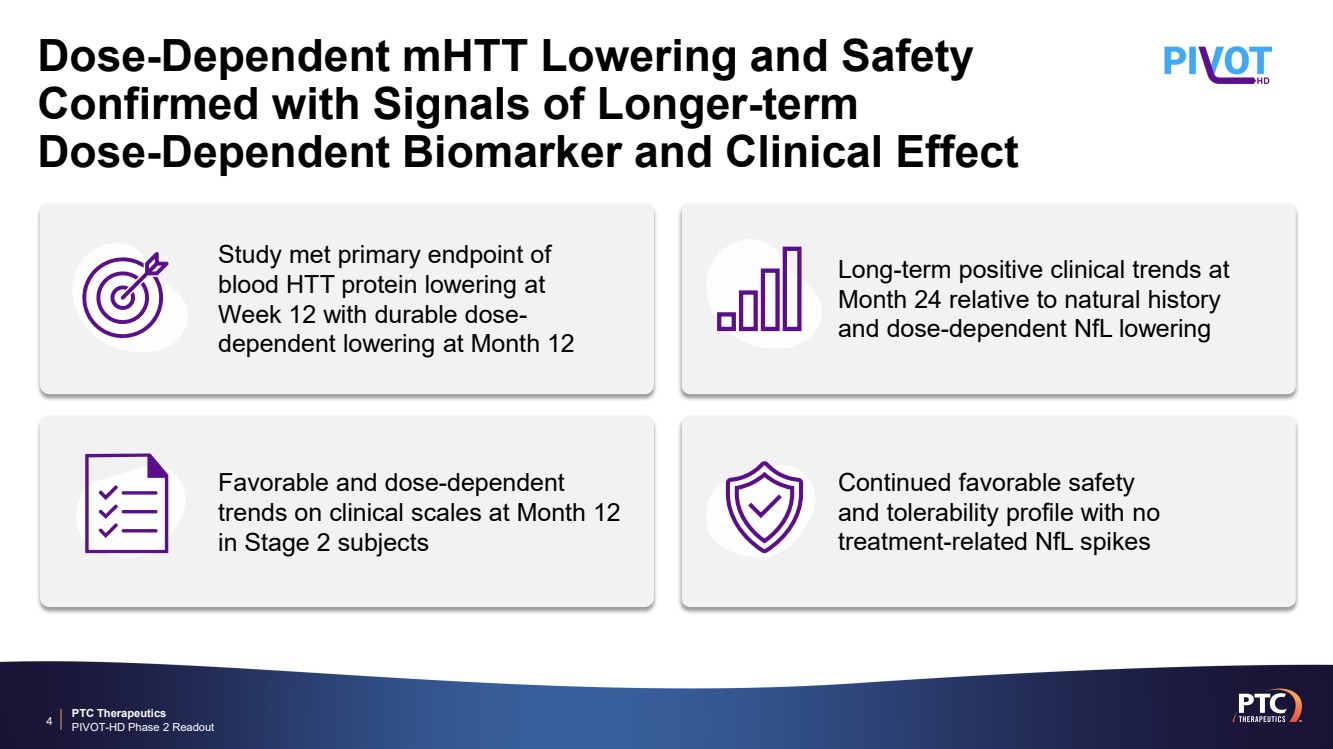
| PTC Therapeutics PIVOT-HD Phase 2 Readout Dose-Dependent mHTT Lowering and Safety Confirmed with Signals of Longer-term Dose-Dependent Biomarker and Clinical Effect 4 Continued favorable safety and tolerability profile with no treatment-related NfL spikes Favorable and dose-dependent trends on clinical scales at Month 12 in Stage 2 subjects Long-term positive clinical trends at Month 24 relative to natural history and dose-dependent NfL lowering Study met primary endpoint of blood HTT protein lowering at Week 12 with durable dose-dependent lowering at Month 12 |
| PTC Therapeutics PIVOT-HD Phase 2 Readout 5 12-Month Topline Results |

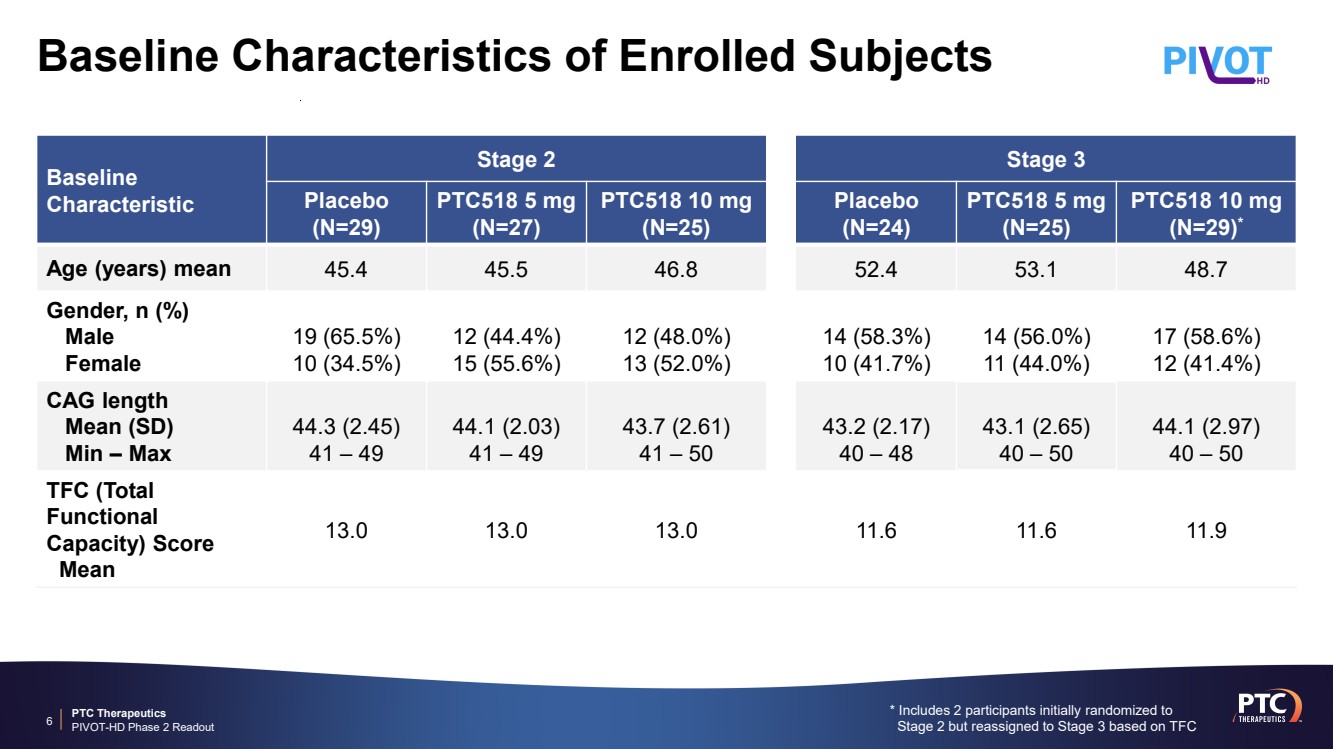
| PTC Therapeutics PIVOT-HD Phase 2 Readout Baseline Characteristics of Enrolled Subjects * Includes 2 participants initially randomized to Stage 2 but reassigned to Stage 3 based on TFC 6 Baseline Characteristic Stage 2 Stage 3 Placebo (N=29) PTC518 5 mg (N=27) PTC518 10 mg (N=25) Placebo (N=24) PTC518 5 mg (N=25) PTC518 10 mg (N=29)* Age (years) mean 45.4 45.5 46.8 52.4 53.1 48.7 Gender, n (%) Male Female 19 (65.5%) 10 (34.5%) 12 (44.4%) 15 (55.6%) 12 (48.0%) 13 (52.0%) 14 (58.3%) 10 (41.7%) 14 (56.0%) 11 (44.0%) 17 (58.6%) 12 (41.4%) CAG length Mean (SD) Min – Max 44.3 (2.45) 41 – 49 44.1 (2.03) 41 – 49 43.7 (2.61) 41 – 50 43.2 (2.17) 40 – 48 43.1 (2.65) 40 – 50 44.1 (2.97) 40 – 50 TFC (Total Functional Capacity) Score Mean 13.0 13.0 13.0 11.6 11.6 11.9 |
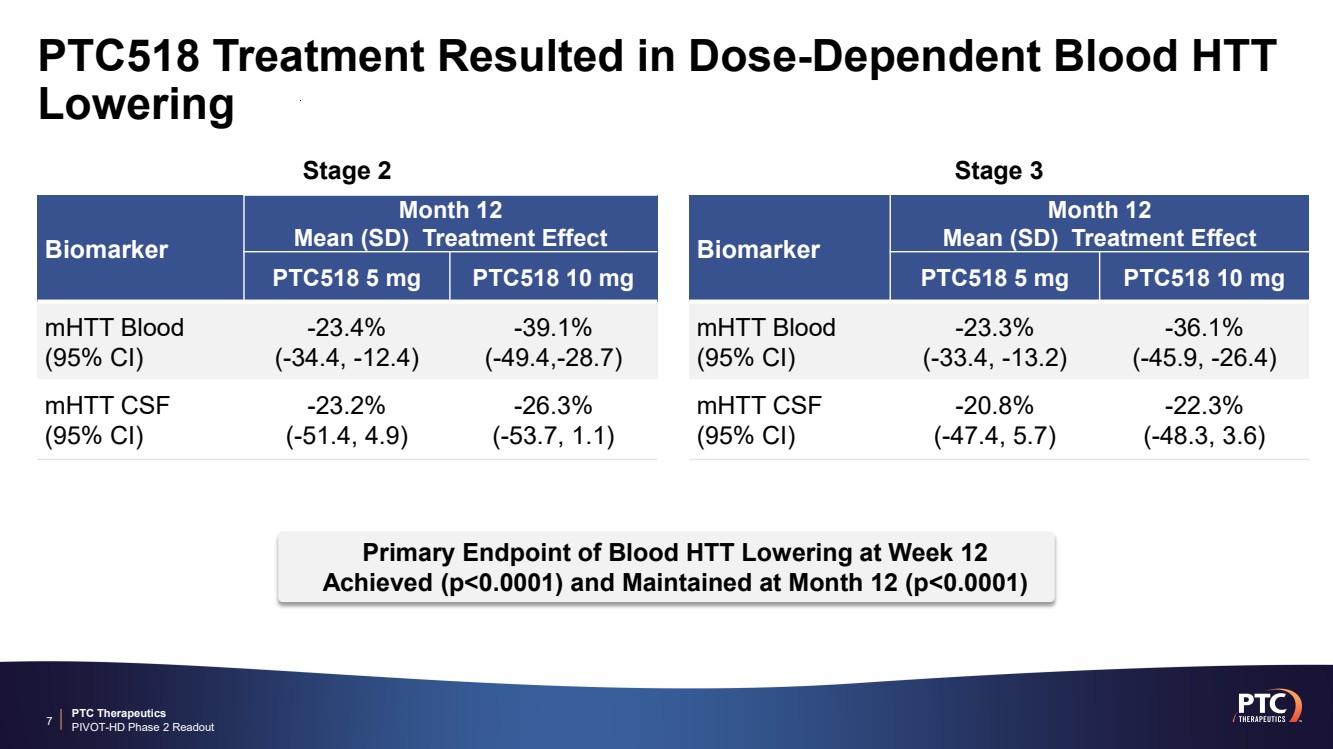
| PTC Therapeutics PIVOT-HD Phase 2 Readout PTC518 Treatment Resulted in Dose-Dependent Blood HTT Lowering 7 Biomarker Month 12 Mean (SD) Treatment Effect PTC518 5 mg PTC518 10 mg mHTT Blood (95% CI) -23.3% (-33.4, -13.2) -36.1% (-45.9, -26.4) Biomarker Month 12 Mean (SD) Treatment Effect PTC518 5 mg PTC518 10 mg mHTT Blood (95% CI) -23.4% (-34.4, -12.4) -39.1% (-49.4,-28.7) Primary Endpoint of Blood HTT Lowering at Week 12 Achieved (p<0.0001) and Maintained at Month 12 (p<0.0001) mHTT CSF (95% CI) -20.8% (-47.4, 5.7) -22.3% (-48.3, 3.6) mHTT CSF (95% CI) -23.2% (-51.4, 4.9) -26.3% (-53.7, 1.1) Stage 2 Stage 3 |
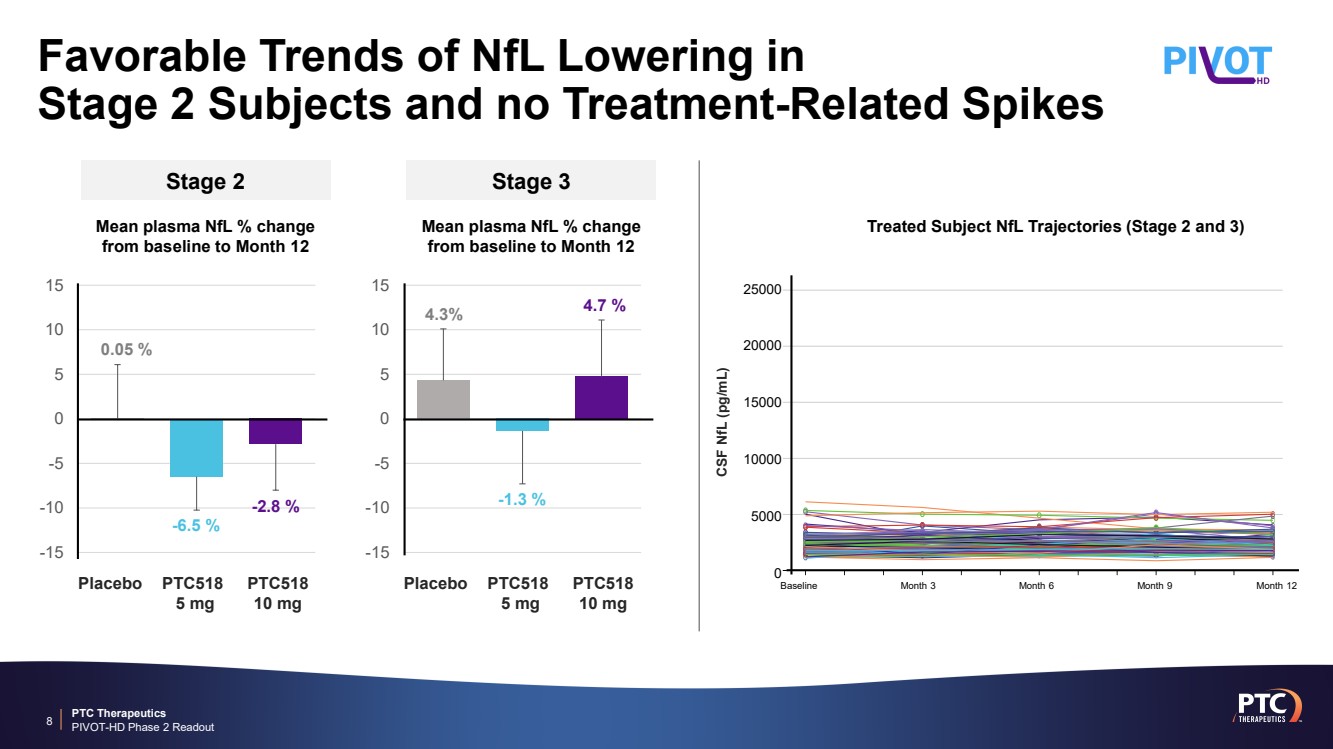
| PTC Therapeutics PIVOT-HD Phase 2 Readout Favorable Trends of NfL Lowering in Stage 2 Subjects and no Treatment-Related Spikes 8 Stage 3 Mean plasma NfL % change from baseline to Month 12 Stage 2 Mean plasma NfL % change from baseline to Month 12 -15 -10 -5 0 5 10 15 Placebo PTC518 5 mg PTC518 10 mg 4.3% -1.3 % 4.7 % -15 -10 -5 0 5 10 15 Placebo PTC518 5 mg PTC518 10 mg 0.05 % -6.5 % -2.8 % CSF NfL (pg/mL) Treated Subject NfL Trajectories (Stage 2 and 3) 25000 20000 15000 10000 5000 0 Baseline Month 3 Month 6 Month 9 Month 12 |
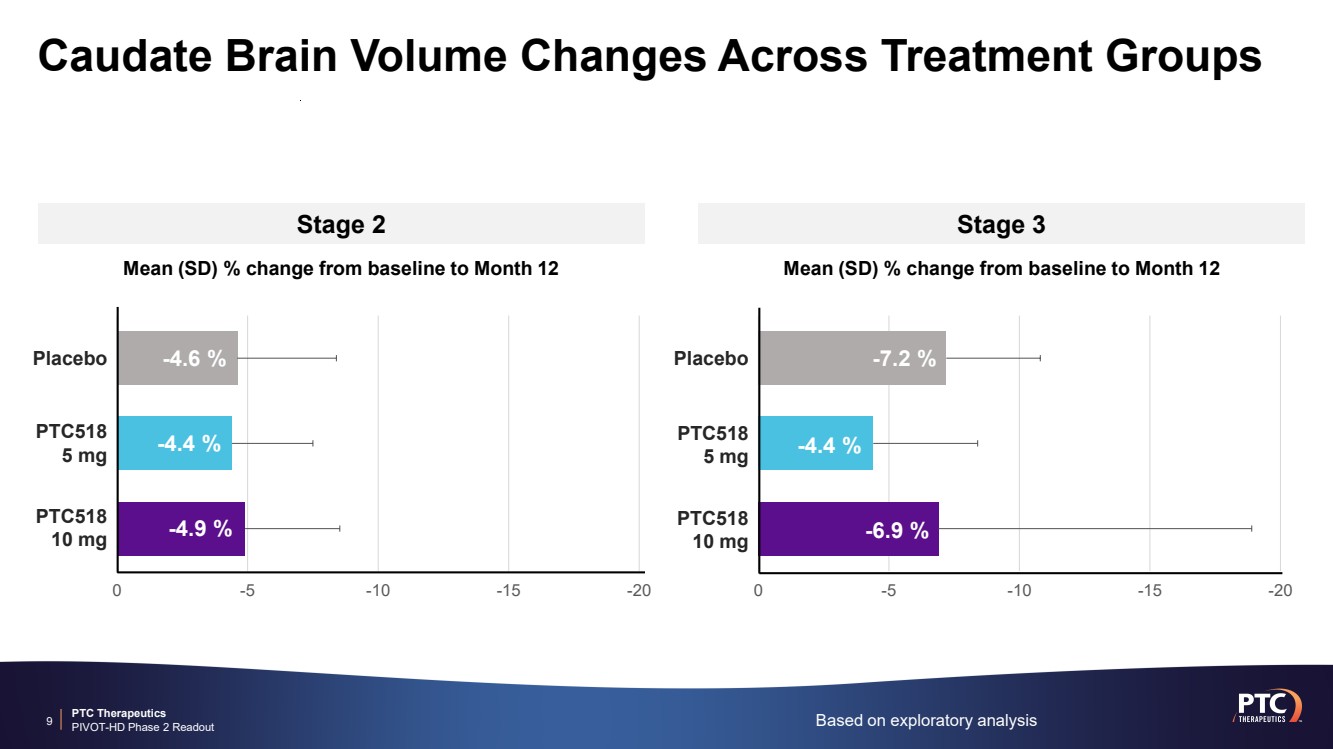
| PTC Therapeutics PIVOT-HD Phase 2 Readout Caudate Brain Volume Changes Across Treatment Groups 9 Based on exploratory analysis Stage 2 Stage 3 0 -5 -10 -15 -20 Placebo PTC518 5 mg PTC518 10 mg Mean (SD) % change from baseline to Month 12 -4.6 % -4.4 % -4.9 % Placebo PTC518 5 mg PTC518 10 mg 0 -5 -10 -15 -20 Mean (SD) % change from baseline to Month 12 -7.2 % -4.4 % -6.9 % |
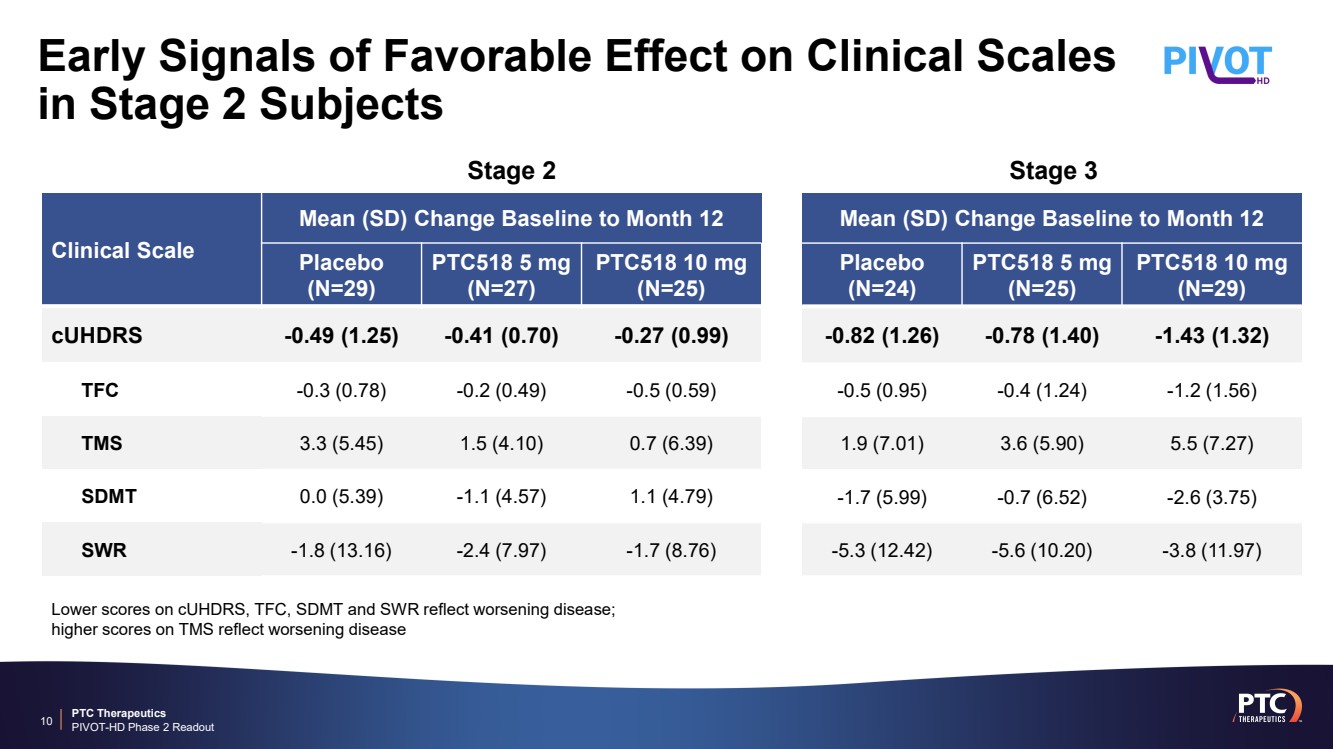
| PTC Therapeutics PIVOT-HD Phase 2 Readout Early Signals of Favorable Effect on Clinical Scales in Stage 2 Subjects 10 Clinical Scale Mean (SD) Change Baseline to Month 12 Placebo (N=29) PTC518 5 mg (N=27) PTC518 10 mg (N=25) cUHDRS -0.49 (1.25) -0.41 (0.70) -0.27 (0.99) TFC -0.3 (0.78) -0.2 (0.49) -0.5 (0.59) TMS 3.3 (5.45) 1.5 (4.10) 0.7 (6.39) SDMT 0.0 (5.39) -1.1 (4.57) 1.1 (4.79) SWR -1.8 (13.16) -2.4 (7.97) -1.7 (8.76) Mean (SD) Change Baseline to Month 12 Placebo (N=24) PTC518 5 mg (N=25) PTC518 10 mg (N=29) -0.82 (1.26) -0.78 (1.40) -1.43 (1.32) -0.5 (0.95) -0.4 (1.24) -1.2 (1.56) 1.9 (7.01) 3.6 (5.90) 5.5 (7.27) -1.7 (5.99) -0.7 (6.52) -2.6 (3.75) -5.3 (12.42) -5.6 (10.20) -3.8 (11.97) Lower scores on cUHDRS, TFC, SDMT and SWR reflect worsening disease; higher scores on TMS reflect worsening disease Stage 2 Stage 3 |
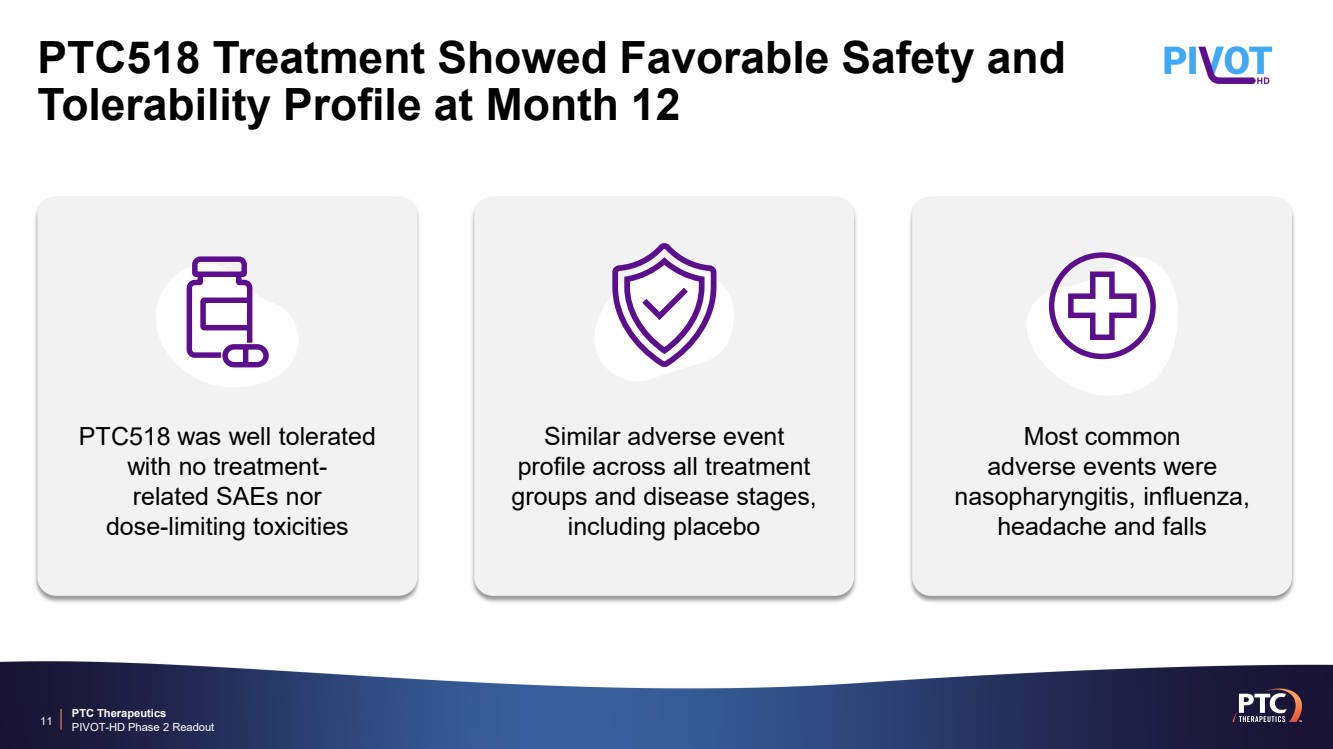
| PTC Therapeutics PIVOT-HD Phase 2 Readout PTC518 Treatment Showed Favorable Safety and Tolerability Profile at Month 12 11 Most common adverse events were nasopharyngitis, influenza, headache and falls Similar adverse event profile across all treatment groups and disease stages, including placebo PTC518 was well tolerated with no treatment-related SAEs nor dose-limiting toxicities |
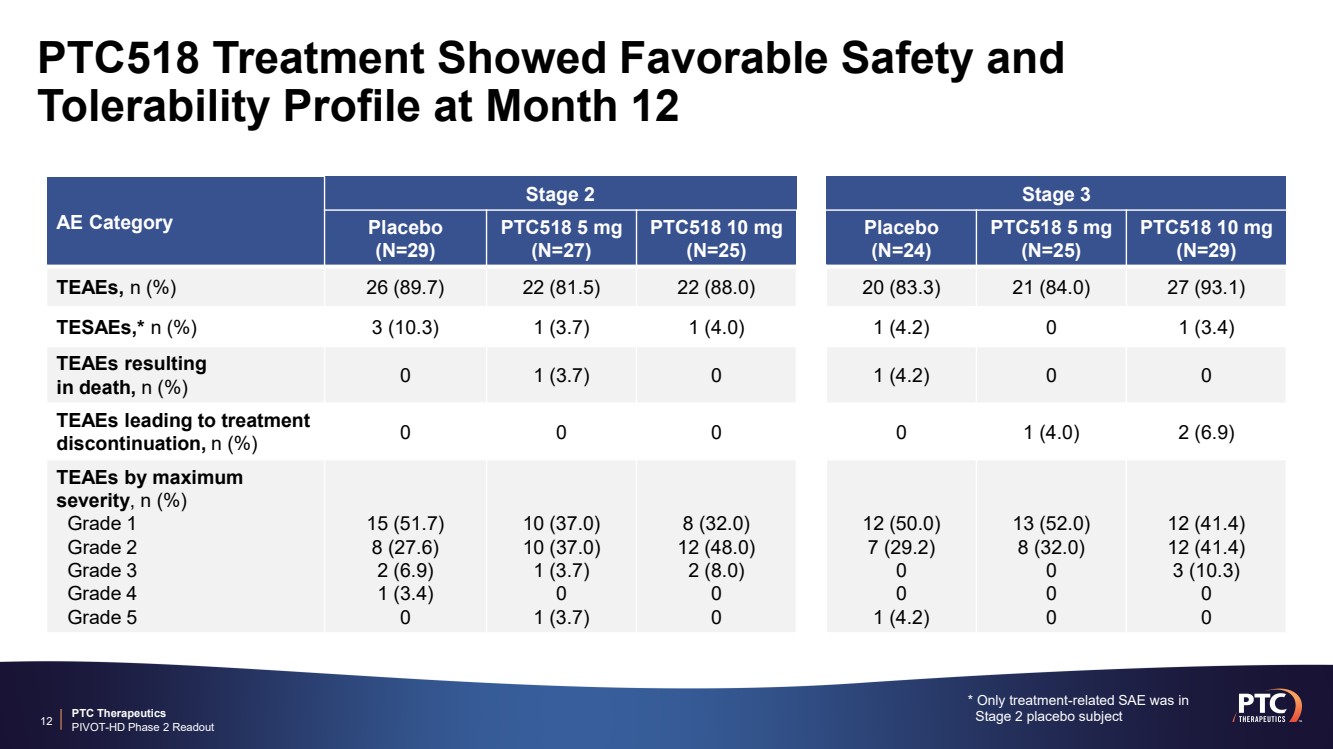
| PTC Therapeutics PIVOT-HD Phase 2 Readout 12 AE Category Stage 2 Stage 3 Placebo (N=29) PTC518 5 mg (N=27) PTC518 10 mg (N=25) Placebo (N=24) PTC518 5 mg (N=25) PTC518 10 mg (N=29) TEAEs, n (%) 26 (89.7) 22 (81.5) 22 (88.0) 20 (83.3) 21 (84.0) 27 (93.1) TESAEs,* n (%) 3 (10.3) 1 (3.7) 1 (4.0) 1 (4.2) 0 1 (3.4) TEAEs resulting in death, n (%) 0 1 (3.7) 0 1 (4.2) 0 0 TEAEs leading to treatment discontinuation, n (%) 0 0 0 0 1 (4.0) 2 (6.9) TEAEs by maximum severity, n (%) Grade 1 Grade 2 Grade 3 Grade 4 Grade 5 15 (51.7) 8 (27.6) 2 (6.9) 1 (3.4) 0 10 (37.0) 10 (37.0) 1 (3.7) 0 1 (3.7) 8 (32.0) 12 (48.0) 2 (8.0) 0 0 12 (50.0) 7 (29.2) 0 0 1 (4.2) 13 (52.0) 8 (32.0) 0 0 0 12 (41.4) 12 (41.4) 3 (10.3) 0 0 * Only treatment-related SAE was in Stage 2 placebo subject PTC518 Treatment Showed Favorable Safety and Tolerability Profile at Month 12 |
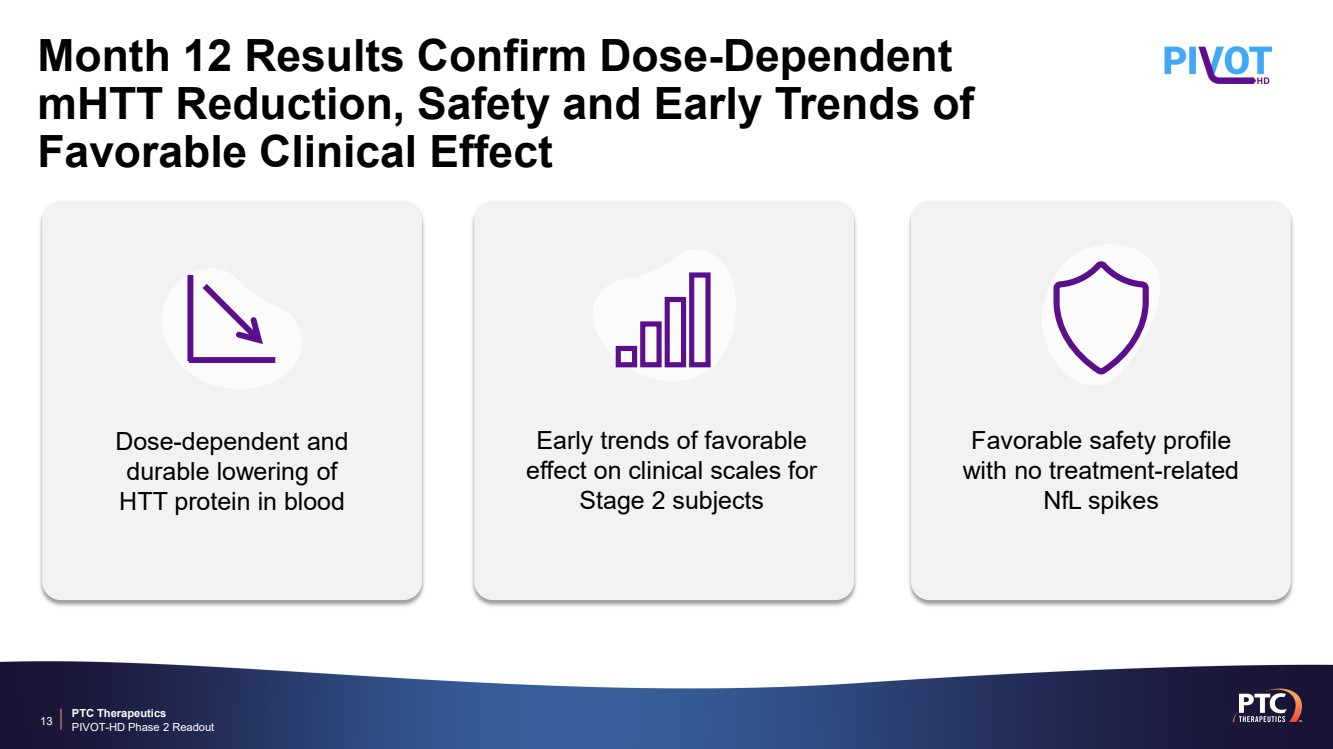
| PTC Therapeutics PIVOT-HD Phase 2 Readout Month 12 Results Confirm Dose-Dependent mHTT Reduction, Safety and Early Trends of Favorable Clinical Effect Dose-dependent and durable lowering of HTT protein in blood Favorable safety profile with no treatment-related NfL spikes Early trends of favorable effect on clinical scales for Stage 2 subjects 13 |
| PTC Therapeutics PIVOT-HD Phase 2 Readout 14 24-Month Interim Results |

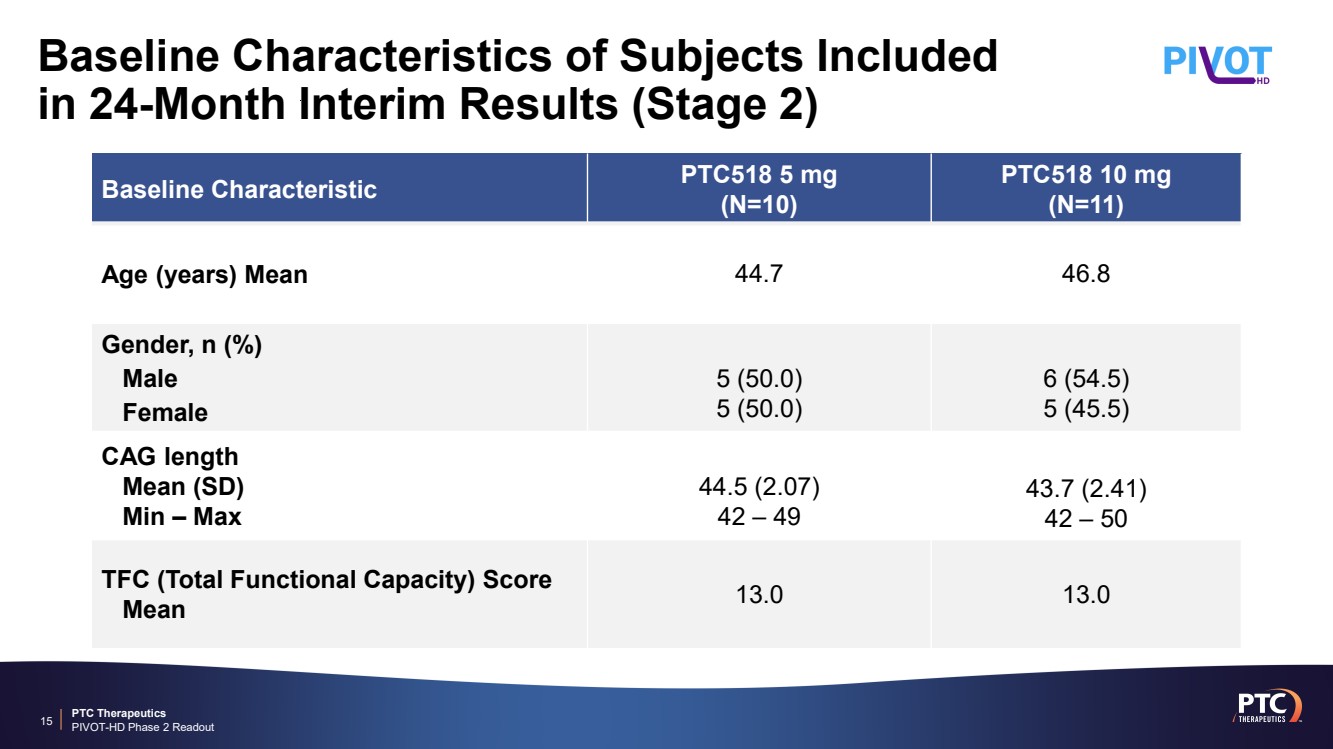
| PTC Therapeutics PIVOT-HD Phase 2 Readout Baseline Characteristics of Subjects Included in 24-Month Interim Results (Stage 2) 15 Baseline Characteristic PTC518 5 mg (N=10) PTC518 10 mg (N=11) Age (years) Mean 44.7 46.8 Gender, n (%) Male Female 5 (50.0) 5 (50.0) 6 (54.5) 5 (45.5) CAG length Mean (SD) Min – Max 44.5 (2.07) 42 – 49 43.7 (2.41) 42 – 50 TFC (Total Functional Capacity) Score Mean 13.0 13.0 |
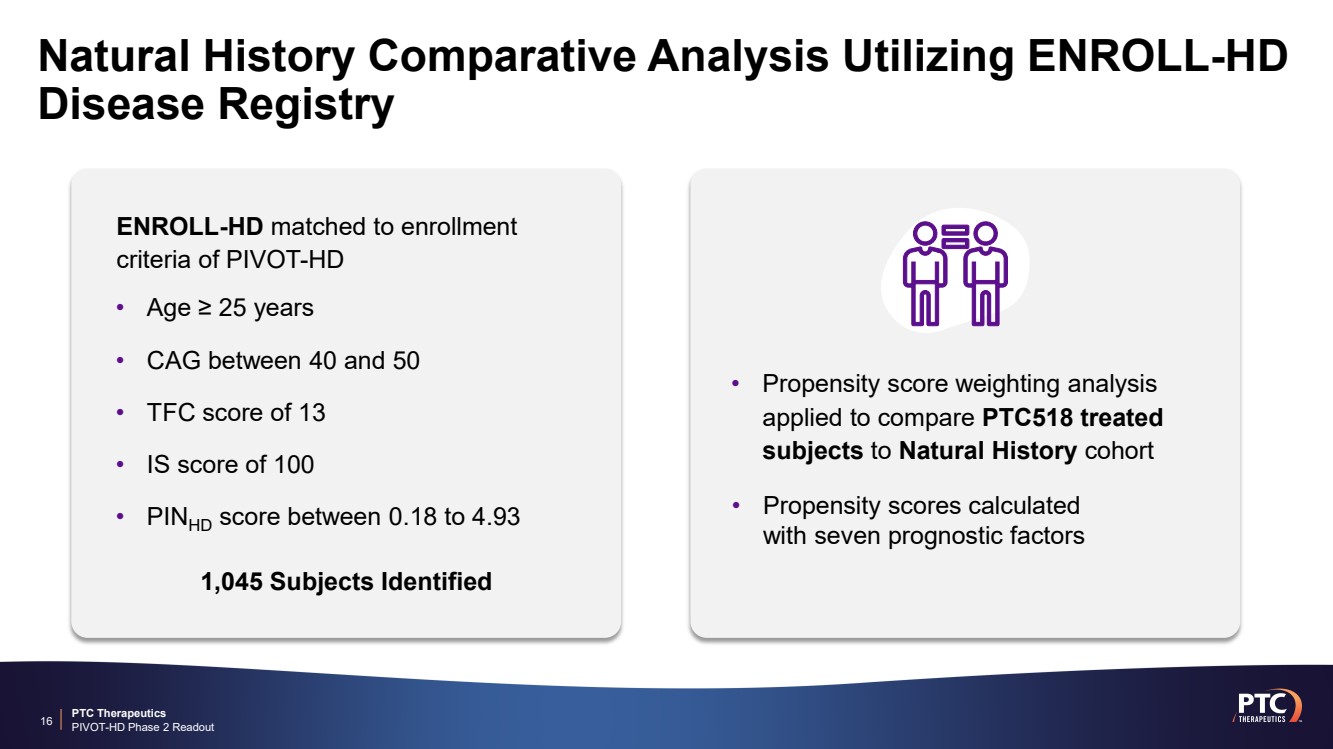
| PTC Therapeutics PIVOT-HD Phase 2 Readout Natural History Comparative Analysis Utilizing ENROLL-HD Disease Registry 16 • Age ≥ 25 years • CAG between 40 and 50 • TFC score of 13 • IS score of 100 • PINHD score between 0.18 to 4.93 • Propensity score weighting analysis applied to compare PTC518 treated subjects to Natural History cohort ENROLL-HD matched to enrollment criteria of PIVOT-HD • Propensity scores calculated with seven prognostic factors 1,045 Subjects Identified |
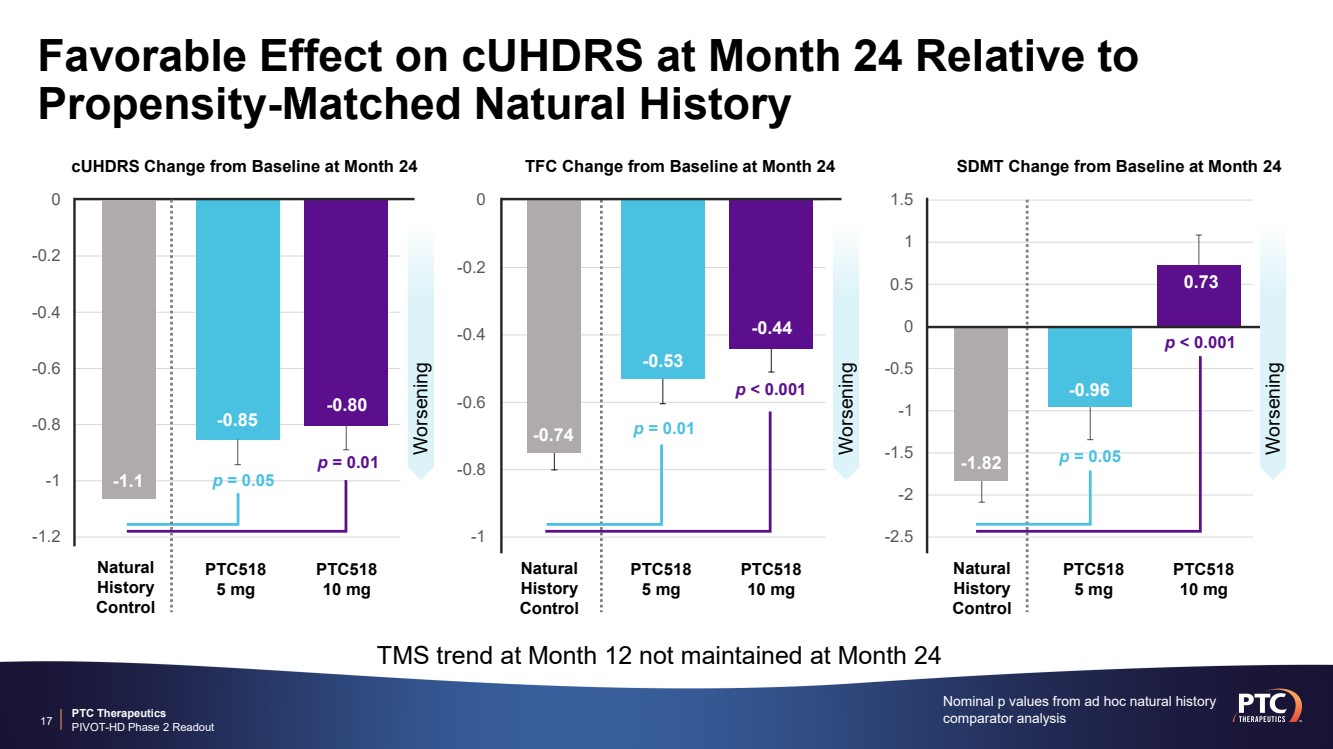
| PTC Therapeutics PIVOT-HD Phase 2 Readout -1.2 -1 -0.8 -0.6 -0.4 -0.2 0 Favorable Effect on cUHDRS at Month 24 Relative to Propensity-Matched Natural History Nominal p values from ad hoc natural history 17 comparator analysis -0.85 -0.80 PTC518 5 mg PTC518 10 mg cUHDRS Change from Baseline at Month 24 Worsening TMS trend at Month 12 not maintained at Month 24 PTC518 5 mg PTC518 10 mg -1 -0.8 -0.6 -0.4 -0.2 0 -0.53 -0.44 Natural History Control -0.74 TFC Change from Baseline at Month 24 Worsening p = 0.01 p < 0.001 PTC518 5 mg PTC518 10 mg -2.5 -2 -1.5 -1 -0.5 0 0.5 1 1.5 -0.96 0.73 Natural History Control -1.82 SDMT Change from Baseline at Month 24Worsening p = 0.05 p < 0.001 p = 0.05 p = 0.01 Natural History Control -1.1 |
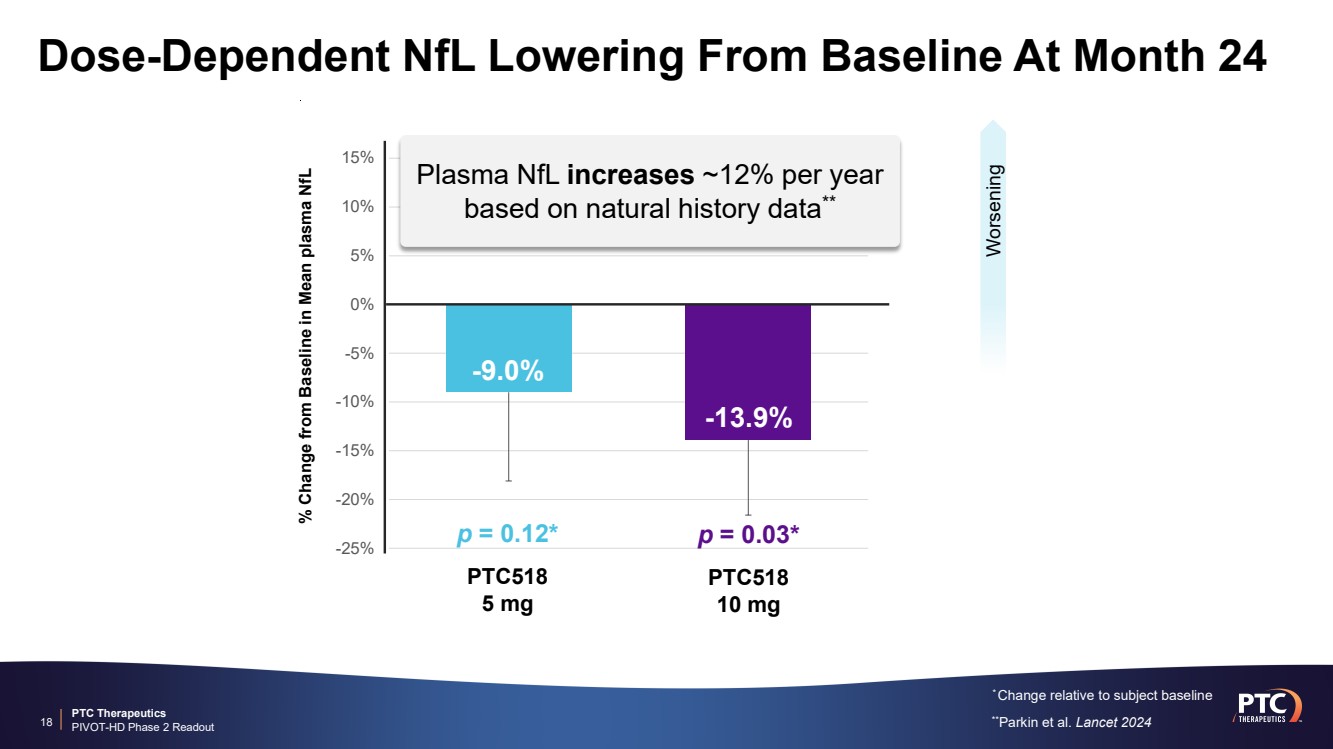
| PTC Therapeutics PIVOT-HD Phase 2 Readout -25% -20% -15% -10% -5% 0% 5% 10% 15% Dose-Dependent NfL Lowering From Baseline At Month 24 * Change relative to subject baseline 18 % Change from Baseline in Mean plasma NfL -13.9% -9.0% PTC518 5 mg PTC518 10 mg p = 0.12* p = 0.03* Worsening Plasma NfL increases ~12% per year based on natural history data** **Parkin et al. Lancet 2024 |
| PTC Therapeutics PIVOT-HD Phase 2 Readout PTC518 Treatment Continues to Show Favorable Safety and Tolerability Profile at Month 24 19 Adverse event profile remains consistent through Month 24 No reported treatment-related SAEs nor NfL spikes at Month 24 PTC518 was well tolerated, with no dose-limiting toxicities |
| PTC Therapeutics PIVOT-HD Phase 2 Readout Favorable Trends of Slowing of Progression and NfL Lowering at Month 24 20 Dose-dependent clinical trends of disease slowing relative to matched natural history at Month 24 Continued favorable safety and tolerability profile Dose-dependent NfL lowering at Month 24 |
| PTC Therapeutics PIVOT-HD Phase 2 Readout 21 Primary endpoint reached with durable mHTT lowering, safety and signals of clinical effect in Stage 2 patients Summary and Next Steps Complete data analyses and plan for development and regulatory discussions Dose-dependent trends on clinical scales and NfL lowering at Month 24 |

| PTC Therapeutics PIVOT-HD Phase 2 Readout |