Pay vs Performance Disclosure - USD ($)
Feb. 01, 2025
Feb. 03, 2024
Jan. 28, 2023
Jan. 29, 2022
Jan. 30, 2021
| Value of Initial Fixed $100 Investment Based On: | ||||||||||||||||||||||||||||||||
| Year | SCT Total for PEO(1) | CAP to PEO(2) | SCT Total for Former PEO(1) | CAP to Former PEO(2) | Average SCT Total for Non-PEO NEOs(1) | Average CAP to Non-PEO NEOs(2) | Company TSR | Peer Group TSR(3) | Net Income (Loss)(4) | Adjusted Operating Income (Loss)(5) | ||||||||||||||||||||||
| Fiscal 2024 | $4,882,753 | $(988,658) | — | — | $3,005,241 | $857,413 | $38.14 | $235.55 | $(10,549,000) | $67,616,000 | ||||||||||||||||||||||
| Fiscal 2023 | $5,719,612 | $4,974,958 | $1,044,875 | $(6,606,073) | $2,647,301 | $1,531,139 | $68.02 | $178.76 | $29,062,000 | $89,936,000 | ||||||||||||||||||||||
| Fiscal 2022 | $8,530,705 | $4,674,582 | — | — | $5,786,341 | $3,966,731 | $76.07 | $163.57 | $162,676,000 | $205,300,000 | ||||||||||||||||||||||
| Fiscal 2021 | $9,735,430 | $11,931,817 | — | — | $4,373,388 | $5,214,144 | $91.28 | $176.79 | $154,481,000 | $214,156,000 | ||||||||||||||||||||||
| Fiscal 2020 | $12,081,703 | $19,358,683 | — | — | $4,723,649 | $6,863,250 | $87.43 | $174.54 | $(488,719,000) | $(424,200,000) | ||||||||||||||||||||||
(3)We used the S&P MidCap 400 Retail Index as our peer group for purposes of Item 201(e) of Regulation S-K to calculate peer group total shareholder return. Total shareholder return (“TSR”) for both the Company and the peer group is based on an initial $100 investment, measured on a cumulative basis from the market close on January 28, 2020, through and including the end of the fiscal year for which TSR is being presented in the table. TSR calculations reflect reinvestment of dividends.
(4)Amounts shown are net income (loss) attributable to Designer Brands Inc., as reflected in our Annual Report on Form 10-K for each of fiscal 2024, 2023, 2022, 2021, and 2020.
(5)Adjusted Operating Income (Loss) is a non-GAAP financial measure used as the only metric for the Designer Brands Inc. ICP and performance-based LTIP approved by the Human Capital and Compensation Committee for the reported years. Items adjusted from reported Operating Income (Loss) may vary from year to year and may differ from the items identified in the Company’s quarterly earnings releases. For fiscal 2024, Adjusted Operating Income means GAAP Operating Income as reported, adjusted to exclude any integration and restructuring expenses, impairment charges, acquisition costs, and any other adjustments as separately identified in the Company’s quarterly earnings releases. Adjusted Operating Income also excludes the effect of changes in foreign currency exchange rates from the budgeted exchange rate.
SCT Total for PEO to CAP to PEO Reconciliation and Average SCT Total for Non-PEO NEOs to CAP to Average CAP to Non-PEO NEOs Reconciliation:
| Year | Executive | Reported SCT Total | Exclusion of Stock Awards and Option Awards(a) | Inclusion of Equity Values(b) | CAP | ||||||||||||
| Fiscal 2024 | PEO | $4,882,753 | $(3,666,654) | $(2,204,757) | $(988,658) | ||||||||||||
| Non-PEO NEO Average | $3,005,241 | $(1,483,329) | $(664,499) | $857,413 | |||||||||||||
| Fiscal 2023 | PEO | $5,719,612 | $(4,500,008) | $3,755,354 | $4,974,958 | ||||||||||||
| Non-PEO NEO Average | $2,647,301 | $(1,780,007) | $663,845 | $1,531,139 | |||||||||||||
| Fiscal 2023 | Former PEO | $1,044,875 | – | $(7,650,947) | $(6,606,073) | ||||||||||||
| Non-PEO NEO Average | $2,647,301 | $(1,780,007) | $663,845 | $1,531,139 | |||||||||||||
| Fiscal 2022 | PEO | $8,530,705 | $(6,000,021) | $2,143,898 | $4,674,582 | ||||||||||||
| Non-PEO NEO Average | $5,786,341 | $(3,802,481) | $1,982,871 | $3,966,731 | |||||||||||||
| Fiscal 2021 | PEO | $9,735,430 | $(5,000,038) | $7,196,425 | $11,931,817 | ||||||||||||
| Non-PEO NEO Average | $4,373,388 | $(1,612,501) | $2,453,257 | $5,214,144 | |||||||||||||
| Fiscal 2020 | PEO | $12,081,703 | $(9,695,004) | $16,971,984 | $19,358,683 | ||||||||||||
| Non-PEO NEO Average | $4,723,649 | $(3,061,750) | $5,201,351 | $6,863,250 | |||||||||||||
(a) Amounts in the “Exclusion of Stock Awards and Option Awards” column are based on the amounts set forth in the “Stock Awards” and “Option Awards” columns set forth in the SCT for the applicable fiscal year, if any.
(b) The amounts in the “Inclusion of Equity Values” column of the table above are derived from the amounts set forth in the following table. The equity award adjustments set forth below for each applicable year include the addition (or subtraction, as applicable) of the following: (i) the year-end fair value of any equity awards granted in the applicable year that are outstanding and unvested as of the end of the year; (ii) the amount of change as of the end of the applicable year (from the end of the prior fiscal year) in fair value of any awards granted in prior years that are outstanding and unvested as of the end of the applicable year; (iii) for awards that are granted and vest in the same applicable year, the fair value as of the vesting date; (iv) for awards granted in prior years that vest in the applicable year, the amount equal to the change as of the vesting date (from the end of the prior fiscal year) in fair value; (v) for awards granted in prior years that are determined to fail to meet the applicable vesting conditions during the applicable year, a deduction for the amount equal to the fair value at the end of the prior fiscal year; and (vi) the dollar value of any dividends or other earnings paid on stock or option awards in the applicable year prior to the vesting date that are not otherwise reflected in the fair value of such award or included in any other component of total compensation for the applicable year.
| Year | Executive | Year-End Fair Value of Equity Awards Granted During Year That Remained Unvested as of Last Day of Year | Plus, Change in Fair Value of Prior Year to Last Day of Year of Unvested Equity Awards | Plus, Vesting Date Fair Value of Equity Awards Granted During Year that Vested During Year | Plus, Change in Fair Value from Last Day of Prior Year to Vesting Date of Unvested Equity Awards that Vested During Year | Minus, Fair Value at Last Day of Prior Year of Equity Awards that Failed to Meet the Vesting Conditions in the Year | Plus, Value of Dividends or Other Earnings Paid on Outstanding Stock or Option Awards Not Otherwise Reflected in Fair Value or Other Compensation | Total Equity Award Adjustments | ||||||||||||||||||
| Fiscal 2024 | PEO | $2,609,192 | $(2,349,737) | – | $16,861 | $2,481,073 | – | $(2,204,757) | ||||||||||||||||||
| Non-PEO NEO Average | $1,055,543 | $(971,994) | – | $189,249 | $937,297 | – | $(664,499) | |||||||||||||||||||
| Fiscal 2023 | PEO | $4,962,145 | $(536,107) | – | $(532,829) | $137,855 | – | $3,755,354 | ||||||||||||||||||
| Non-PEO NEO Average | $1,689,248 | $(226,288) | – | $(260,708) | $538,406 | – | $663,845 | |||||||||||||||||||
| Fiscal 2023 | Former PEO | – | – | – | $(2,901,797) | $4,749,150 | – | $(7,650,947) | ||||||||||||||||||
| Non-PEO NEO Average | $1,689,248 | $(226,288) | – | $(260,708) | $538,406 | – | $663,845 | |||||||||||||||||||
| Fiscal 2022 | PEO | $4,724,958 | $(3,558,165) | – | $977,106 | – | – | $2,143,898 | ||||||||||||||||||
| Non-PEO NEO Average | $2,820,728 | $(934,551) | – | $96,694 | – | – | $1,982,871 | |||||||||||||||||||
| Fiscal 2021 | PEO | $5,197,536 | $825,780 | – | $1,173,109 | – | – | $7,196,425 | ||||||||||||||||||
| Non-PEO NEO Average | $1,676,193 | $257,512 | – | $519,552 | – | – | $2,453,257 | |||||||||||||||||||
| Fiscal 2020 | PEO | $18,345,465 | $(497,587) | – | $28,417 | $904,311 | – | $16,971,984 | ||||||||||||||||||
| Non-PEO NEO Average | $5,794,128 | $41,029 | – | $(387,005) | $246,801 | – | $5,201,351 | |||||||||||||||||||
All outstanding stock options were fully vested prior to fiscal 2023. For prior years, stock option fair values, as of each measurement date, were determined using valuation assumptions and methodologies (including expected term, volatility, dividend yield, and risk-free interest rates) that are generally consistent with those used to estimate fair value at grant. The below valuation assumptions used to calculate option fair values differed materially from those at the time of grant:
•Risk-free rates range from 0.12% to 1.36% for the pay versus performance valuations versus a range of 1.39% to 2.04% for grant date valuations.
•The expected term estimate ranges from 0.56 years to 7 years for the pay versus performance valuations versus a range of 5.14 years to 5.56 years for the grant date valuations.
Valuation assumptions for full value shares includes the following:
| Market Price at Current FYE | $5.03 | ||||
| Market Price at Prior FYE | $9.21 | ||||
| Range of Vest Date Market Prices | $5.03 - $11.22 | ||||
All other valuation assumptions are not substantially different than the grant date assumptions and there were no changes in calculation methodology.
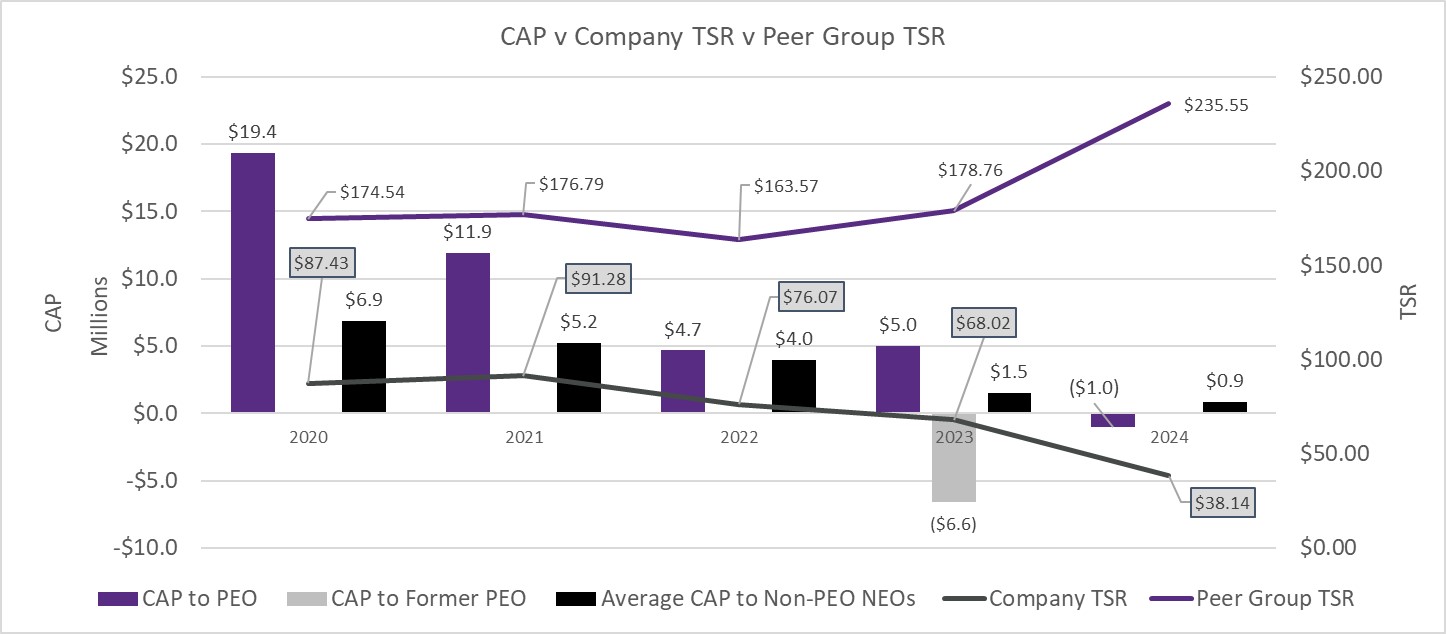
The graph below reflects the relationship between the CAP to PEO, Former PEO (for 2023 only) and Average CAP to Non-PEO NEO and the Company’s cumulative indexed TSR and peer group TSR (assuming an initial fixed investment of $100) for fiscal 2020, 2021, 2022, 2023 and 2024.
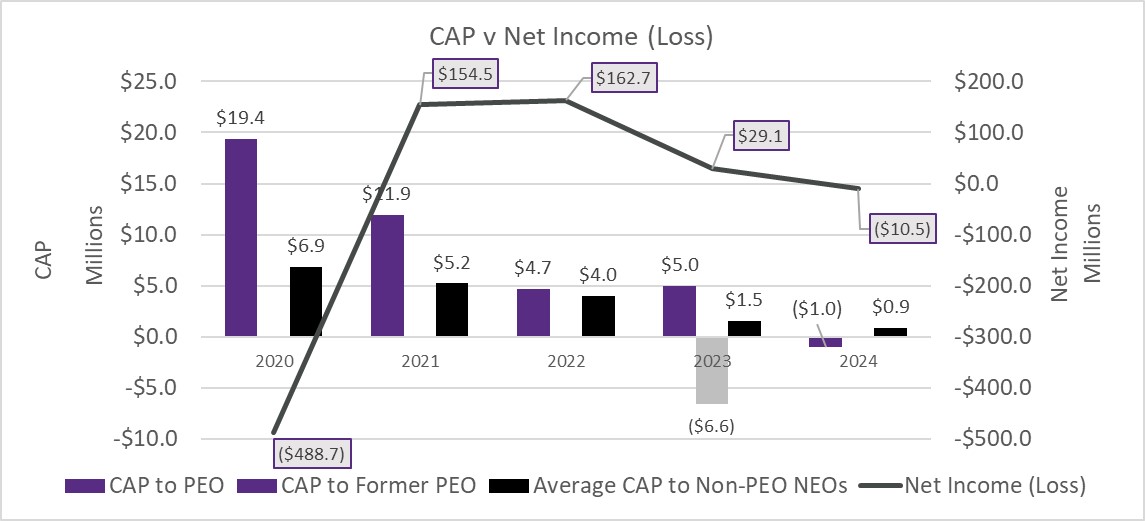
As the tables below illustrate, net income (loss) in fiscal 2020 was materially negatively impacted by the COVID-19 pandemic.
The graph below reflects the relationship between the CAP to PEO, Former PEO (for 2023 only) and Average CAP to Non-PEO NEO and the Company’s net income (loss) for fiscal 2020, 2021, 2022,2023, and 2024.
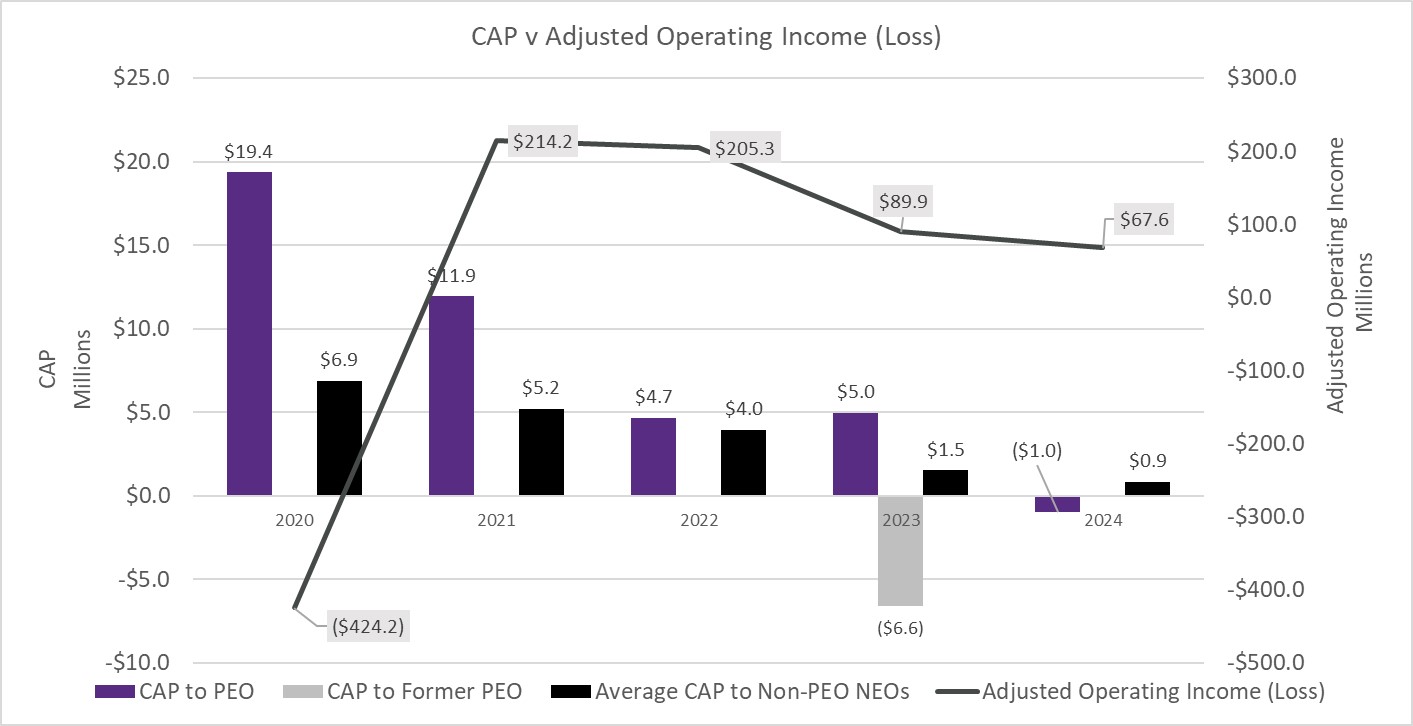
The graph below reflects the relationship between the CAP to PEO, Former PEO (for 2023 only) and Average CAP to Non-PEO NEO and the Company’s Adjusted Operating Income (loss) for fiscal 2020, 2021, 2022, 2023 and 2024.
The graph below reflects the relationship between the CAP to PEO, Former PEO (for 2023 only) and Average CAP to Non-PEO NEO and the Company’s cumulative indexed TSR and peer group TSR (assuming an initial fixed investment of $100) for fiscal 2020, 2021, 2022, 2023 and 2024.
| Most Important Financial Measures | ||
| Company Adjusted Operating Income (Loss)* | ||