Maximum long-term total return consistent with reasonable risk to principal.
This table describes the fees and expenses that you may pay if you buy, hold, and sell Institutional Shares of the Portfolio. You may pay brokerage commissions and other fees to financial intermediaries which are not reflected in the table and example below.
Annual Fund Operating Expenses |
Equity Portfolios - Institutional Shares
Disciplined International Equity Portfolio
Disciplined International Equity Portfolio - Institutional Shares
|
|
|---|---|---|
| Management Fees | 0.55% | |
| Other Expenses | 0.37% | |
| Total Annual Portfolio Operating Expenses | 0.92% | |
| Fee Waivers and Expense Reimbursements | 0.27% | [1] |
| Net Expenses | 0.65% | |
| [1] | Glenmede Investment Management LP (the “Advisor”) has contractually agreed to waive its fees and/or reimburse expenses to the extent that the Portfolio’s annual total operating expenses for Institutional Shares exceed 0.65% of the Portfolio’s average daily net assets attributable to Institutional Shares (excluding Acquired Fund fees and expenses, brokerage commissions, extraordinary items, interest and taxes). The Advisor has contractually agreed to these waivers and/or reimbursements until at least May 5, 2026 and may discontinue this arrangement at any time thereafter. This contractual fee waiver agreement may not be terminated before May 5, 2026 without the approval of The Glenmede Fund, Inc.’s (the “Fund”) Board of Directors (the “Board”). |
This Example is intended to help you compare the cost of investing in the Portfolio’s Institutional Shares with the cost of investing in other mutual funds. The Example assumes that you invest $10,000 in the Portfolio for the time periods indicated and then hold or redeem all of your shares at the end of those periods. The Example also assumes that your investment has a 5% return each year and that the Portfolio’s operating expenses remain the same, taking into account the fee waiver in the first year of each period. Although your actual costs may be higher or lower, based on these assumptions your costs would be:
The Portfolio pays transaction costs, such as commissions, when it buys and sells securities (or “turns over” its portfolio). A higher portfolio turnover rate may indicate higher transaction costs and may result in higher taxes when Portfolio shares are held in a taxable account. These costs, which are not reflected in annual portfolio operating expenses or in the Example, affect the Portfolio’s performance. The Portfolio may actively trade portfolio securities to achieve its principal investment strategies. During the most recent fiscal year, the Portfolio’s portfolio turnover rate was 97% of the average value of its portfolio.
Using quantitative analysis, under normal market circumstances, the Portfolio invests at least 80% of the value of its net assets (including borrowings for investment purposes) in equity securities of foreign companies, directly and/or through American
Depositary Receipts (“ADRs”). ADRs are depositary receipts issued in registered form by a U.S. bank or trust company evidencing ownership of underlying securities issued by foreign companies. Under normal market circumstances, the Portfolio will invest, directly and/or through ADRs in companies based in at least three countries other than the United States in primarily developed markets. The Advisor uses proprietary multi-factor computer models to select stocks and/or ADRs of foreign companies that the models identify as having reasonable prices, good fundamentals and rising earnings expectations. These computer models rank securities based on certain criteria, including valuation ratios, profitability and earnings-related measures, and material environmental, social and governance (ESG) criteria. The Portfolio may actively trade its securities to achieve its principal investment strategies.
The bar chart and table below provide some indication of the risks of investing in the Portfolio. The bar chart shows how the performance of the Portfolio has varied from year to year. The table shows how the Portfolio’s average annual total returns for one year, five years and ten years compare to those of selected market indices. The Portfolio’s past performance, before and after taxes, does not necessarily indicate how it will perform in the future. Performance reflects expense reimbursements and/or fee waivers made in 2016, 2017, 2018, 2019, 2020, 2021, 2022, 2023 and 2024. If such expense reimbursements or waivers were not in place, the Portfolio’s performance in 2016, 2017, 2018, 2019, 2020, 2021, 2022, 2023 and 2024 would be reduced. Updated performance information is available by visiting www.glenmedeim.com or by calling 1-800-442-8299.
As of the date of this Prospectus, the Portfolio had not offered Institutional Shares to investors. The returns below represent the returns for Advisor Shares of the Portfolio, which are offered in a separate prospectus. Institutional Shares and Advisor Shares of the Portfolio should have returns that are substantially the same because they represent investments in the same portfolio of securities and differ only to the extent that they have different expenses.
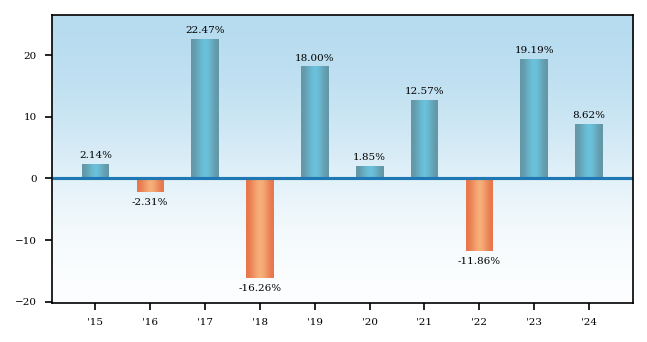
During the periods shown in the bar chart, the highest quarterly return was 15.16% (for the quarter ended December 31, 2022) and the lowest quarterly return was -24.55% (for the quarter ended March 31, 2020).
After-tax returns for the Portfolio are calculated using the historical highest individual Federal marginal income tax rates, and do not reflect the impact of state and local taxes. Actual after-tax returns depend on the investor’s tax situation and may differ from those shown. After-tax returns are not relevant to investors who hold their Portfolio shares through tax-deferred arrangements such as 401(k) plans or individual retirement accounts (“IRAs”).
Average Annual Returns - Equity Portfolios - Institutional Shares - Disciplined International Equity Portfolio |
1 Year |
5 Years |
10 Years |
|
|---|---|---|---|---|
| Disciplined International Equity Portfolio | 8.62% | 5.52% | 4.68% | |
| Return After Taxes on Distributions – Advisor Shares | Disciplined International Equity Portfolio | 6.71% | 4.86% | 4.22% | |
| Return After Taxes on Distributions and Sale of Fund Shares – Advisor Shares | Disciplined International Equity Portfolio | [1] | 6.99% | 4.55% | 3.90% |
| MSCI World ex-USA Index (reflects no deduction for fees, expenses or taxes) | 4.70% | 5.10% | 5.26% | |
| Morningstar Foreign Large Value Average | [2] | 4.39% | 4.63% | 4.33% |
| [1] | In certain cases, the Return After Taxes on Distribution and Sale of Fund Shares for a period may be higher than other return figures for the same period. This will occur when a capital loss is realized upon the sale of fund shares and provides an assumed tax benefit that increases the return. |
| [2] | The Morningstar Foreign Large Value Average is provided so that investors may compare the performance of the Portfolio with the performance of a peer group of funds that Morningstar, Inc. considers similar to the Portfolio. |