Long-term capital appreciation and option premiums consistent with reasonable risk to principal.
This table describes the fees and expenses that you may pay if you buy, hold, and sell Institutional Shares of the Portfolio. You may pay brokerage commissions and other fees to financial intermediaries which are not reflected in the table and example below.
Annual Fund Operating Expenses |
Equity Portfolios - Institutional Shares
Global Secured Options Portfolio
Global Secured Options Portfolio - Institutional Shares
|
|
|---|---|---|
| Management Fees | 0.55% | |
| Other Expenses | 0.49% | |
| Acquired Fund Fees and Expenses | 0.14% | |
| Total Annual Portfolio Operating Expenses | 1.18% | [1] |
| Fee Waivers and Expense Reimbursements | 0.39% | [2] |
| Net Expenses | 0.79% | |
| [1] | Total Annual Fund Operating Expenses shown in the table above may not correspond to the ratio of operating expenses to average net assets in the “Financial Highlights” section of this Prospectus to the extent that Acquired Fund Fees and Expenses are included in the table above. |
| [2] | Glenmede Investment Management LP (the “Advisor”) has contractually agreed to waive its fees and/or reimburse expenses to the extent that the Portfolio’s annual total operating expenses for Institutional Shares exceed 0.65% of the Portfolio’s average daily net assets attributable to Institutional Shares (excluding Acquired Fund fees and expenses, brokerage commissions, extraordinary items, interest and taxes). The Advisor has contractually agreed to these waivers and/or reimbursements until at least May 5, 2026 and may discontinue this arrangement at any time thereafter. This contractual fee waiver agreement may not be terminated before May 5, 2026 without the approval of The Glenmede Fund, Inc.’s (the “Fund”) Board of Directors (the “Board”). |
This Example is intended to help you compare the cost of investing in the Portfolio’s Institutional Shares with the cost of investing in other mutual funds. The Example assumes that you invest $10,000 in the Portfolio for the time periods indicated and then hold or redeem all of your shares at the end of those periods. The Example also assumes that your investment has a 5% return each year and that the Portfolio’s operating expenses remain the same, taking into account the fee waiver in the first year of each period. Although your actual costs may be higher or lower, based on these assumptions your costs would be:
The Portfolio pays transaction costs, such as commissions, when it buys and sells securities (or “turns over” its portfolio). A higher portfolio turnover rate may indicate higher transaction costs and may result in higher taxes when Portfolio shares are held in a taxable account. These costs, which are not reflected in annual portfolio operating expenses or in the Example, affect the Portfolio’s performance. The Portfolio may actively trade portfolio securities to achieve its principal investment strategies. During the most recent fiscal year, the Portfolio’s portfolio turnover rate was 0% of the average value of its portfolio.
Under normal market circumstances, the Portfolio uses option writing strategies in an effort to obtain option premiums and reduce risk. The Portfolio will implement buy-write (covered call) and/or cash-secured put option strategies on U.S. or foreign stock index exchange-traded funds (“ETFs”), U.S. or foreign stock indices and/or individual U.S. or foreign stocks held by the Portfolio. Covered call and cash-secured put options are intended to reduce volatility, earn option premiums and provide more stable returns. Selling call options reduces the risk of owning stocks by the receipt of the option premiums and selling put options reduces the purchase price of the underlying stock, but both strategies limit the opportunity to profit from an increase in the market value of the underlying security in exchange for up-front cash at the time of selling the call or put option. Under normal market circumstances, at least 80% of the value of the Portfolio’s net assets (including borrowings for investment purposes) will be subject to secured option strategies, which are written covered call and/or secured put options. Under normal market circumstances, the Portfolio will write covered call and/or secured put options on U.S. or foreign stock index ETFs, U.S. or foreign stock indices and/or individual U.S. or foreign stocks in at least three different countries, other than the United States, and will invest at least 40% of its net assets outside of the U.S. The Portfolio is called Global “Secured Options” because the call and put options it writes will be covered by owning the U.S. or foreign security, index or ETFs underlying the option, holding an offsetting option, segregating cash or other liquid assets at not less than the full value of the option or the exercise price, and/or using other permitted coverage methods. At any given time, the Portfolio’s assets may be subject to only calls or only puts, or a combination of both strategies. To the extent that the Portfolio’s assets are only subject to puts, the assets will consist of cash or cash equivalents in order to secure the puts. In that event, there may be few if any stocks or other securities held by the Portfolio. To the extent that the Portfolio’s assets are only subject to covered calls on a stock index, the Portfolio may hold stock index ETFs instead of individual U.S. or foreign stocks that replicate the movement of the applicable index, in addition to the other permitted coverage methods.
To the extent that the Portfolio’s assets are not only subject to cash-secured puts or calls on stock index covered by stock index ETFs, the Portfolio intends to invest in a diversified portfolio of U.S. or foreign equity securities of companies based in at least three different countries, other than the United States, with generally similar risk and return characteristics as the MSCI All Country World Index (“MSCI ACWI Index”). The Portfolio may invest in companies with small, medium or large market capitalizations in developed, developing or emerging markets in advancement of its investment objective. The Portfolio intends to invest in foreign securities in the form of American Depositary Receipts (“ADRs”) which are securities issued by a U.S. bank that represent interests in foreign equity securities listed on a U.S. stock exchange. The Portfolio may also buy call and put options on U.S. or foreign stock index ETFs, U.S. or foreign stock indices or individual U.S. or foreign stocks.
The Advisor’s selection of securities to buy or sell is based on a combination of proprietary multifactor computer models and fundamental analysis. The computer models rank securities based on certain criteria, such as valuation ratios, and other models focus on risk analysis and overall portfolio characteristics. The Advisor buys securities that the models identify as undervalued and more likely to appreciate, and sells securities that the Advisor identifies as overvalued and more likely to depreciate. The Portfolio may actively trade its securities to achieve its principal investment strategies.
The bar chart and table below provide some indication of the risks of investing in the Portfolio. The bar chart shows how the performance of the Portfolio has varied from year to year. The table shows how the Portfolio’s average annual total returns for one year, five years, and ten years compare to those of selected market indices. The Portfolio’s past performance, before and after taxes, does not necessarily indicate how it will perform in the future.
Performance reflects expense reimbursements and/or fee waivers made in 2019 and 2020. If such expense reimbursements or waivers were not in place, the Portfolio’s performance in 2019 and 2020 would be reduced. Updated performance information is available by visiting www.glenmedeim.com or by calling 1-800-442-8299.
As of the date of this Prospectus, the Portfolio had not offered Institutional Shares to investors. The returns below represent the returns for Advisor Shares of the Portfolio, which are offered in a separate prospectus. Institutional Shares and Advisor Shares of the Portfolio should have returns that are substantially the same because they represent investments in the same portfolio of securities and differ only to the extent that they have different expenses.
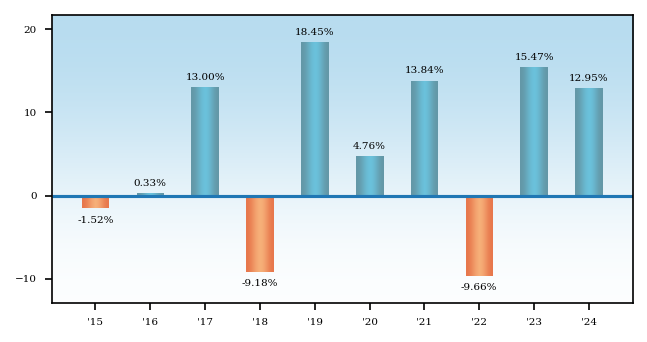
During the periods shown in the bar chart, the highest quarterly return was 14.65% (for the quarter ended June 30, 2020) and the lowest quarterly return was -20.80% (for the quarter ended March 31, 2020).
After-tax returns for the Portfolio are calculated using the historical highest individual Federal marginal income tax rates, and do not reflect the impact of state and local taxes. Actual after-tax returns depend on the investor’s tax situation and may differ from those shown. After-tax returns are not relevant to investors who hold their Portfolio shares through tax-deferred arrangements such as 401(k) plans or individual retirement accounts (“IRAs”).
Average Annual Returns - Equity Portfolios - Institutional Shares - Global Secured Options Portfolio |
1 Year |
5 Years |
10 Years |
|
|---|---|---|---|---|
| Global Secured Options Portfolio | 12.95% | 7.04% | 5.37% | |
| Return After Taxes on Distributions – Advisor Shares | Global Secured Options Portfolio | 6.72% | 4.52% | 0.23% | |
| Return After Taxes on Distributions and Sale of Fund Shares – Advisor Shares1 | Global Secured Options Portfolio | [1] | 10.07% | 4.83% | 2.79% |
| MSCI ACWI Index (reflects no deduction for fees, expenses or taxes) | 17.49% | 10.06% | 9.23% | |
| Blended PutWrite Index (reflects no deduction for fees, expenses or taxes) | [2] | 10.45% | 4.27% | 3.98% |
| [1] | In certain cases, the Return After Taxes on Distribution and Sale of Fund Shares for a period may be higher than other return figures for the same period. This will occur when a capital loss is realized upon the sale of fund shares and provides an assumed tax benefit that increases the return. |
| [2] | The Blended PutWrite Index is comprised of four benchmarks, weighted 40% CBOE S&P 500® PutWrite T-W Index, 10% CBOE Russell 2000 ® PutWrite Index, 40% CBOE MSCI EAFE PutWrite Index and 10% CBOE MSCI Emerging Markets PutWrite Index. It is provided so that investors may compare the performance of the Portfolio with the performance of a combination of indices that the Advisor considers similar to the Portfolio. |