| ASX Release 5 May 2025 Pillar 3 Report as at 31 March 2025 Westpac Banking Corporation (“Westpac”) today provides the attached Pillar 3 Report (March 2025). For further information: Hayden Cooper Justin McCarthy Group Head of Media Relations General Manager, Investor Relations 0402 393 619 0422 800 321 This document has been authorised for release by Tim Hartin, Company Secretary. Level 18, 275 Kent Street Sydney, NSW, 2000 |
| PILLAR 3 REPORT MARCH 2025 INCORPORATING THE REQUIREMENTS OF APS 330 WESTPAC BANKING CORPORATION ABN 33 007 457 141 |
| Acknowledgement of Indigenous Peoples Westpac acknowledges the First Peoples of Australia. We recognise their ongoing role as Traditional Owners of the land and waters of this country and pay our respects to Elders, past and present. We extend our respect to Westpac’s Aboriginal and Torres Strait Islander employees, partners and stakeholders and to the Indigenous Peoples in the other locations where we operate. In Aotearoa (New Zealand) we also acknowledge tāngata whenua and the unique relationship that Indigenous Peoples share with all New Zealanders under Te Tiriti o Waitangi. 2 WESTPAC GROUP MARCH 2025 PILLAR 3 REPORT Structure of Pillar 3 Report PILLAR 3 REPORT 3 Introduction 4 Key Metrics 5 Group Structure 8 Capital Overview 10 Credit Risk Management 19 Counterparty Credit Risk 30 Securitisation 35 Market Risk 40 Interest Rate Risk in the Bank Book (IRRBB) 45 Leverage Ratio 46 Macro-prudential Supervisory Measures 48 Funding and Liquidity Risk Management 49 Prudential Disclosure Policy 52 Management's Declaration 53 APPENDICES 54 Appendix I – Regulatory capital reconciliation 55 Appendix II – Level 3 entities’ assets and equity 57 Appendix III – Regulatory expected loss 58 GLOSSARY 59 DISCLOSURE REGARDING FORWARD-LOOKING STATEMENTS 63 In this report references to ‘Westpac’, 'WBC', ‘Westpac Group’, ‘the Group’, ‘we’, ‘us’ and ‘our’ are to Westpac Banking Corporation ABN 33 007 457 141 and its subsidiaries unless it clearly means just Westpac Banking Corporation. In this report, unless otherwise stated or the context otherwise requires, references to 'dollars', 'dollar amounts', ‘$’, ‘AUD’ or ‘A$’ are to Australian dollars. References to ‘US$’, ‘USD’ or ‘US dollars’ are to United States dollars, references to ‘NZ$’, ‘NZD’ or ‘NZ dollars’ are to New Zealand dollars, references to 'GBP' are to British Pound Sterling and references to 'EUR' are to European Euro. Refer to Other information in 2025 Interim Financial Results Announcement for information regarding the rates of exchange between the Australian dollar and other currencies applied by the Group as part of its operating activities as at 31 March 2025, 30 September 2024 and 31 March 2024. Any discrepancies between totals and sums of components in tables contained in this report are due to rounding. In this report, unless otherwise stated, disclosures reflect the Australian Prudential Regulation Authority’s (APRA) implementation of Basel III. Information contained in or accessible through the websites mentioned in this report does not form part of this report unless we specifically state that it is incorporated by reference and forms part of this report. Information on those websites owned by Westpac is current as at the date of this report. Except as required by law, we assume no obligation to revise or update those websites after the date of this report. We are not in a position to verify information on websites owned and/or operated by third parties. Westpac Banking Corporation ABN 33 007 457 141 |
| PILLAR 3 REPORT APPENDICES GLOSSARY DISCLOSURE REGARDING FORWARD-LOOKING STATEMENTS 3 PILLAR 3 REPORT INTRODUCTION KEY METRICS GROUP STRUCTURE CAPITAL OVERVIEW CREDIT RISK MANAGEMENT COUNTERPARTY CREDIT RISK SECURITISATION MARKET RISK INTEREST RATE RISK IN THE BANK BOOK (IRRBB) LEVERAGE RATIO MACRO-PRUDENTIAL SUPERVISORY MEASURES FUNDING AND LIQUIDITY RISK MANAGEMENT PRUDENTIAL DISCLOSURE POLICY MANAGEMENT'S DECLARATION |

| 4 WESTPAC GROUP MARCH 2025 PILLAR 3 REPORT INTRODUCTION Westpac Banking Corporation is an Authorised Deposit-taking Institution (ADI) subject to regulation by the Australian Prudential Regulation Authority (APRA). Under APS 330, APRA has accredited Westpac to use the Advanced Internal Ratings-Based Approach (A-IRB) for credit risk and the Standardised Measurement Approach (SMA) for operational risk. In accordance with APS 330 Public Disclosure, Westpac is required to disclose prudential information about its risk management practices. The frequency of information is provided on a quarterly, semi-annual or annual basis in accordance with the requirements of the Basel Committee on Banking Supervision (and as amended by APRA). In addition to this report, the regulatory disclosures section of the Westpac website1 contains the reporting requirements for capital instruments under paragraph 37 of APS 330. Capital instruments disclosures are updated when: • A new capital instrument is issued that will form part of regulatory capital; or • A capital instrument is redeemed, converted into Common equity tier 1 (CET1) capital, written off, or its terms and conditions are changed. APRA's revised APS 330 standard APRA's revised APS 330 became effective on 1 January 2025. Under the revised standard, Australian ADIs including Westpac, are required to comply with the Disclosure Requirements Standard issued by the Basel Committee on Banking Supervision (BCBS), subject to certain modifications specified by APRA. The revised standard is first applicable for Westpac’s March 2025 Pillar 3 Report. The standard includes new disclosures and the presentation format is usually prescribed. The frequency of disclosures varies, with specific items required on a quarterly, semi-annual or annual basis. On transition to the revised standard, DIS10: Disclosure requirement - Definitions and applications paragraph 10.7 and APRA permit ADIs to omit comparatives when new disclosures are reported for the first time. Where comparatives are available, however, Westpac has included this information. 1. http://www.westpac.com.au/about-westpac/investor-centre/financial-information/regulatory-disclosures/ |
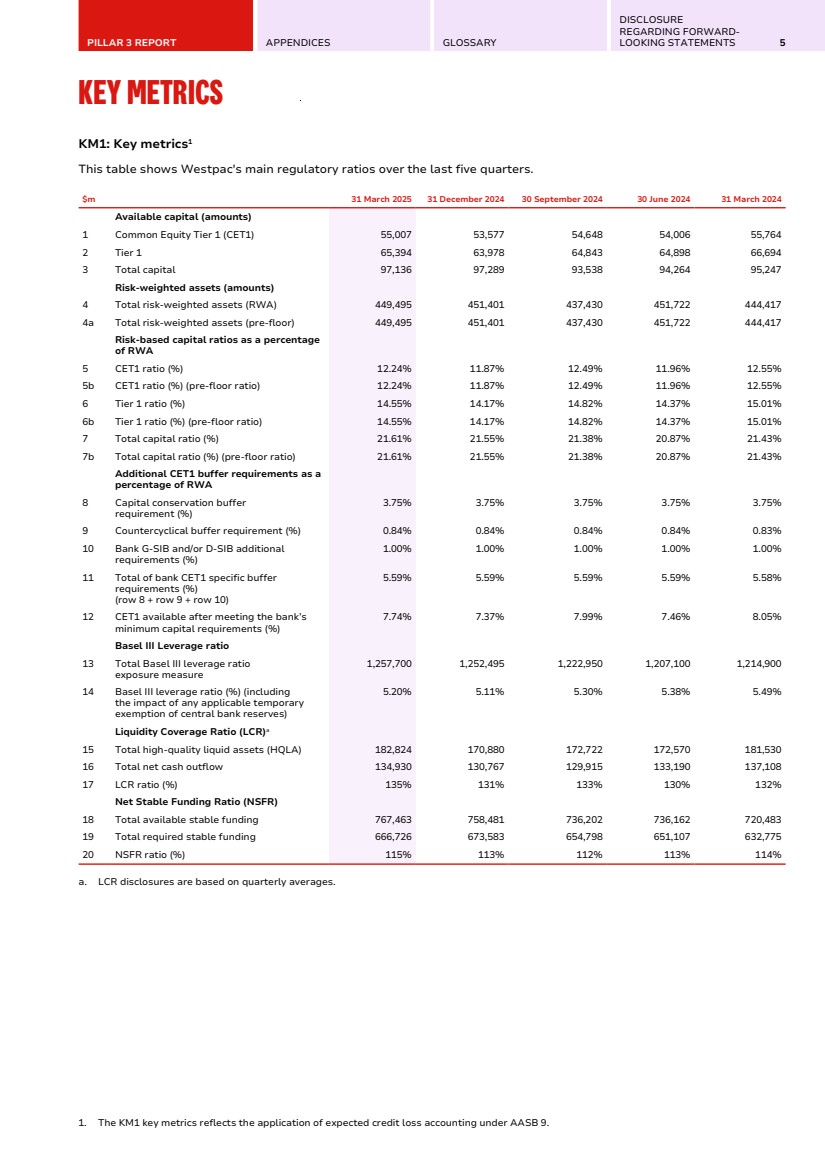
| PILLAR 3 REPORT APPENDICES GLOSSARY DISCLOSURE REGARDING FORWARD-LOOKING STATEMENTS 5 KEY METRICS KM1: Key metrics1 This table shows Westpac's main regulatory ratios over the last five quarters. $m 31 March 2025 31 December 2024 30 September 2024 30 June 2024 31 March 2024 Available capital (amounts) 1 Common Equity Tier 1 (CET1) 55,007 53,577 54,648 54,006 55,764 2 Tier 1 65,394 63,978 64,843 64,898 66,694 3 Total capital 97,136 97,289 93,538 94,264 95,247 Risk-weighted assets (amounts) 4 Total risk-weighted assets (RWA) 449,495 451,401 437,430 451,722 444,417 4a Total risk-weighted assets (pre-floor) 449,495 451,401 437,430 451,722 444,417 Risk-based capital ratios as a percentage of RWA 5 CET1 ratio (%) 12.24% 11.87% 12.49% 11.96% 12.55% 5b CET1 ratio (%) (pre-floor ratio) 12.24% 11.87% 12.49% 11.96% 12.55% 6 Tier 1 ratio (%) 14.55% 14.17% 14.82% 14.37% 15.01% 6b Tier 1 ratio (%) (pre-floor ratio) 14.55% 14.17% 14.82% 14.37% 15.01% 7 Total capital ratio (%) 21.61% 21.55% 21.38% 20.87% 21.43% 7b Total capital ratio (%) (pre-floor ratio) 21.61% 21.55% 21.38% 20.87% 21.43% Additional CET1 buffer requirements as a percentage of RWA 8 Capital conservation buffer requirement (%) 3.75% 3.75% 3.75% 3.75% 3.75% 9 Countercyclical buffer requirement (%) 0.84% 0.84% 0.84% 0.84% 0.83% 10 Bank G-SIB and/or D-SIB additional requirements (%) 1.00% 1.00% 1.00% 1.00% 1.00% 11 Total of bank CET1 specific buffer requirements (%) (row 8 + row 9 + row 10) 5.59% 5.59% 5.59% 5.59% 5.58% 12 CET1 available after meeting the bank’s minimum capital requirements (%) 7.74% 7.37% 7.99% 7.46% 8.05% Basel III Leverage ratio 13 Total Basel III leverage ratio exposure measure 1,257,700 1,252,495 1,222,950 1,207,100 1,214,900 14 Basel III leverage ratio (%) (including the impact of any applicable temporary exemption of central bank reserves) 5.20% 5.11% 5.30% 5.38% 5.49% Liquidity Coverage Ratio (LCR)a 15 Total high-quality liquid assets (HQLA) 182,824 170,880 172,722 172,570 181,530 16 Total net cash outflow 134,930 130,767 129,915 133,190 137,108 17 LCR ratio (%) 135% 131% 133% 130% 132% Net Stable Funding Ratio (NSFR) 18 Total available stable funding 767,463 758,481 736,202 736,162 720,483 19 Total required stable funding 666,726 673,583 654,798 651,107 632,775 20 NSFR ratio (%) 115% 113% 112% 113% 114% a. LCR disclosures are based on quarterly averages. 1. The KM1 key metrics reflects the application of expected credit loss accounting under AASB 9. |
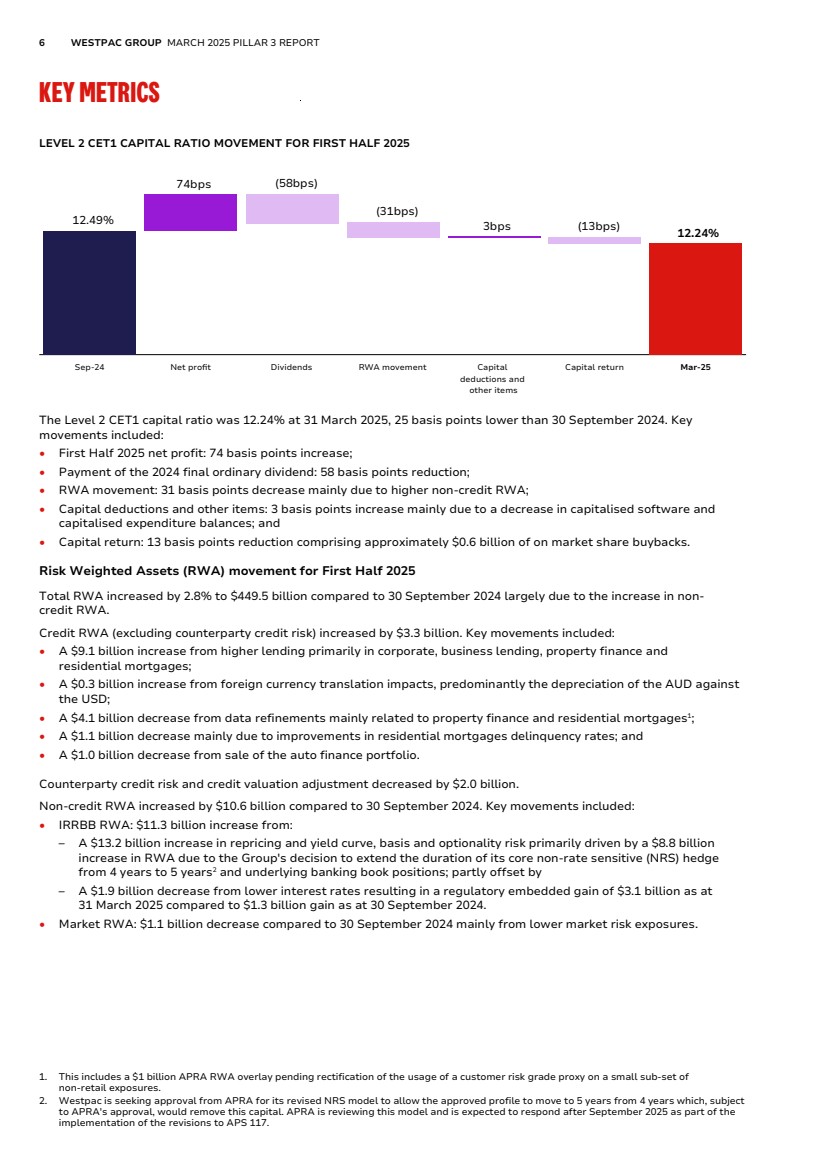
| 6 WESTPAC GROUP MARCH 2025 PILLAR 3 REPORT KEY METRICS LEVEL 2 CET1 CAPITAL RATIO MOVEMENT FOR FIRST HALF 2025 12.49% 74bps (58bps) (31bps) 3bps (13bps) 12.24% Sep-24 Net profit Dividends RWA movement Capital deductions and other items Capital return Mar-25 The Level 2 CET1 capital ratio was 12.24% at 31 March 2025, 25 basis points lower than 30 September 2024. Key movements included: • First Half 2025 net profit: 74 basis points increase; • Payment of the 2024 final ordinary dividend: 58 basis points reduction; • RWA movement: 31 basis points decrease mainly due to higher non-credit RWA; • Capital deductions and other items: 3 basis points increase mainly due to a decrease in capitalised software and capitalised expenditure balances; and • Capital return: 13 basis points reduction comprising approximately $0.6 billion of on market share buybacks. Risk Weighted Assets (RWA) movement for First Half 2025 Total RWA increased by 2.8% to $449.5 billion compared to 30 September 2024 largely due to the increase in non-credit RWA. Credit RWA (excluding counterparty credit risk) increased by $3.3 billion. Key movements included: • A $9.1 billion increase from higher lending primarily in corporate, business lending, property finance and residential mortgages; • A $0.3 billion increase from foreign currency translation impacts, predominantly the depreciation of the AUD against the USD; • A $4.1 billion decrease from data refinements mainly related to property finance and residential mortgages1 ; • A $1.1 billion decrease mainly due to improvements in residential mortgages delinquency rates; and • A $1.0 billion decrease from sale of the auto finance portfolio. Counterparty credit risk and credit valuation adjustment decreased by $2.0 billion. Non-credit RWA increased by $10.6 billion compared to 30 September 2024. Key movements included: • IRRBB RWA: $11.3 billion increase from: – A $13.2 billion increase in repricing and yield curve, basis and optionality risk primarily driven by a $8.8 billion increase in RWA due to the Group's decision to extend the duration of its core non-rate sensitive (NRS) hedge from 4 years to 5 years2 and underlying banking book positions; partly offset by – A $1.9 billion decrease from lower interest rates resulting in a regulatory embedded gain of $3.1 billion as at 31 March 2025 compared to $1.3 billion gain as at 30 September 2024. • Market RWA: $1.1 billion decrease compared to 30 September 2024 mainly from lower market risk exposures. 1. This includes a $1 billion APRA RWA overlay pending rectification of the usage of a customer risk grade proxy on a small sub-set of non-retail exposures. 2. Westpac is seeking approval from APRA for its revised NRS model to allow the approved profile to move to 5 years from 4 years which, subject to APRA's approval, would remove this capital. APRA is reviewing this model and is expected to respond after September 2025 as part of the implementation of the revisions to APS 117. |
| PILLAR 3 REPORT APPENDICES GLOSSARY DISCLOSURE REGARDING FORWARD-LOOKING STATEMENTS 7 Leverage ratio The leverage ratio represents the percentage of Tier 1 capital relative to the Exposure Measure1 . At 31 March 2025, Westpac's leverage ratio was 5.20%, down 10 basis points from 30 September 2024. The ratio remains well above APRA's regulatory minimum requirement of 3.5%. The decrease in the leverage ratio is mainly due to an increase in total exposures of $34.8 billion from higher lending. Liquidity Coverage Ratio (LCR) Westpac’s average LCR for the quarter ended 31 March 2025 was 135% (31 December 2024: 131%), well above the regulatory minimum of 100%. The increase in the ratio was due to the increased average holding of liquid assets. Net Stable Funding Ratio (NSFR) Westpac had an NSFR of 115% as of 31 March 2025 (31 December 2024: 113%) and continues to be above the regulatory minimum of 100%. The increase in the ratio was due to an increase in available stable funding alongside a reduction in required stable funding. CET1 Capital ratio movement for the quarter ended 31 March 2025 The Level 2 CET1 capital ratio increased by 37 basis points over the quarter. This reflects earnings, lower RWA and on market share buybacks. Over the quarter, lower RWA is due to a decrease in credit RWA, partly offset by higher non-credit RWA mainly related to IRRBB. 1. As defined under Attachment D of APS 110: Capital Adequacy. |
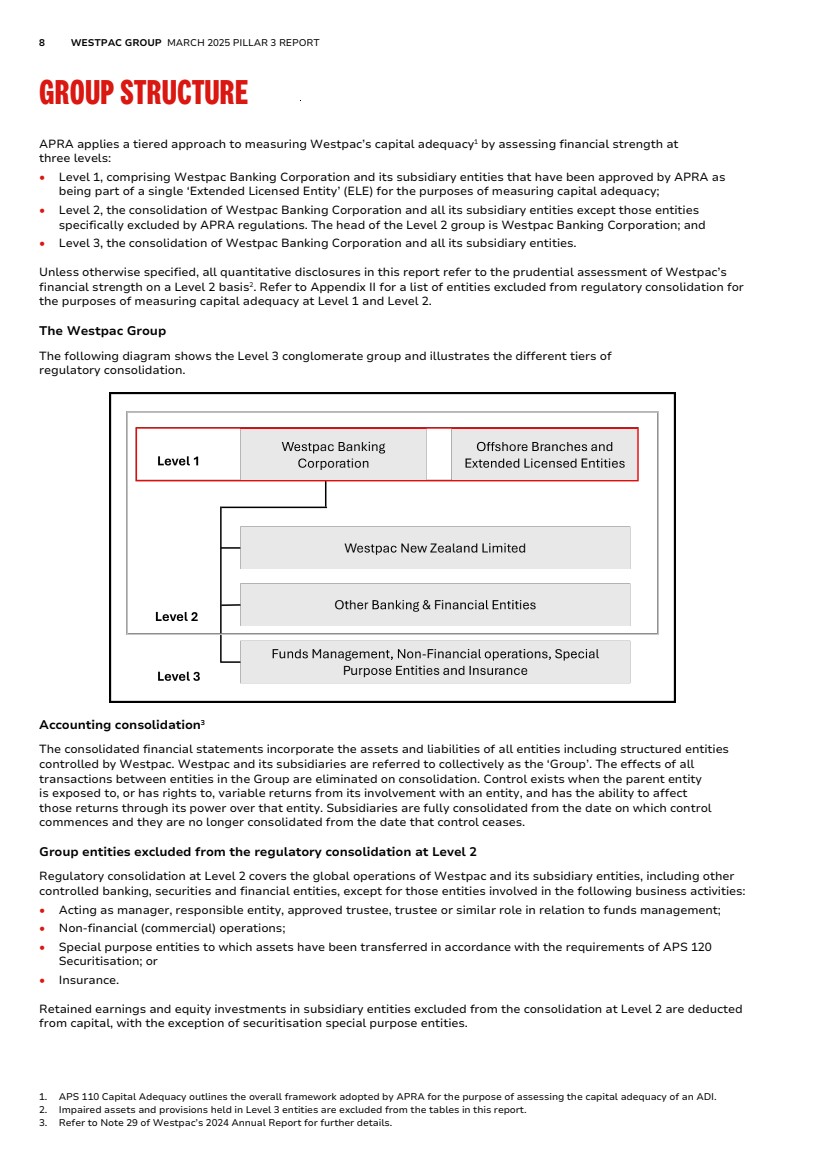
| 8 WESTPAC GROUP MARCH 2025 PILLAR 3 REPORT GROUP STRUCTURE APRA applies a tiered approach to measuring Westpac’s capital adequacy1 by assessing financial strength at three levels: • Level 1, comprising Westpac Banking Corporation and its subsidiary entities that have been approved by APRA as being part of a single ‘Extended Licensed Entity’ (ELE) for the purposes of measuring capital adequacy; • Level 2, the consolidation of Westpac Banking Corporation and all its subsidiary entities except those entities specifically excluded by APRA regulations. The head of the Level 2 group is Westpac Banking Corporation; and • Level 3, the consolidation of Westpac Banking Corporation and all its subsidiary entities. Unless otherwise specified, all quantitative disclosures in this report refer to the prudential assessment of Westpac’s financial strength on a Level 2 basis2 . Refer to Appendix II for a list of entities excluded from regulatory consolidation for the purposes of measuring capital adequacy at Level 1 and Level 2. The Westpac Group The following diagram shows the Level 3 conglomerate group and illustrates the different tiers of regulatory consolidation. Accounting consolidation3 The consolidated financial statements incorporate the assets and liabilities of all entities including structured entities controlled by Westpac. Westpac and its subsidiaries are referred to collectively as the ‘Group’. The effects of all transactions between entities in the Group are eliminated on consolidation. Control exists when the parent entity is exposed to, or has rights to, variable returns from its involvement with an entity, and has the ability to affect those returns through its power over that entity. Subsidiaries are fully consolidated from the date on which control commences and they are no longer consolidated from the date that control ceases. Group entities excluded from the regulatory consolidation at Level 2 Regulatory consolidation at Level 2 covers the global operations of Westpac and its subsidiary entities, including other controlled banking, securities and financial entities, except for those entities involved in the following business activities: • Acting as manager, responsible entity, approved trustee, trustee or similar role in relation to funds management; • Non-financial (commercial) operations; • Special purpose entities to which assets have been transferred in accordance with the requirements of APS 120 Securitisation; or • Insurance. Retained earnings and equity investments in subsidiary entities excluded from the consolidation at Level 2 are deducted from capital, with the exception of securitisation special purpose entities. 1. APS 110 Capital Adequacy outlines the overall framework adopted by APRA for the purpose of assessing the capital adequacy of an ADI. 2. Impaired assets and provisions held in Level 3 entities are excluded from the tables in this report. 3. Refer to Note 29 of Westpac’s 2024 Annual Report for further details. |
| PILLAR 3 REPORT APPENDICES GLOSSARY DISCLOSURE REGARDING FORWARD-LOOKING STATEMENTS 9 Subsidiary banking entities Westpac New Zealand Limited (WNZL), a wholly owned subsidiary entity, is a registered bank incorporated in New Zealand and regulated by, among others, the Reserve Bank of New Zealand (RBNZ) for prudential purposes. WNZL uses both A-IRB and Standardised methodologies for credit risk and the SMA for operational risk. Other subsidiary banking entities in the Group include Westpac Bank PNG Limited and Westpac Europe GMBH. For the purposes of determining Westpac’s capital adequacy, subsidiary banking entities are consolidated at Level 2. Customer operations Westpac is one of Australia's leading providers of banking and certain financial services, operating under multiple brands in Australia and in New Zealand, with a small presence in Europe, North America and Asia. Westpac provides banking products and services through its digital and online channels, supported by a branch and ATM network, contact centres and relationship and product managers. Restrictions and major impediments on the transfer of funds or regulatory capital within the Group Certain subsidiary banking and trustee entities are subject to specific and local prudential regulation in their own right, including capital adequacy requirements and investment or intra-group exposure limits. Westpac seeks to ensure that its subsidiary entities are adequately capitalised and adhere to regulatory requirements at all times. Dividends and capital are repatriated in line with the Group’s policy subject to subsidiary Board approval and local regulations. Intra-group exposure limits Exposures to related entities are managed within the prudential limits prescribed by APRA in APS 222 Associations with Related Entities1 . Westpac has an internal limit structure and approval process governing credit exposures to related entities. This limit structure and approval process, combined with APRA’s prudential limits, is designed to reduce the potential for unacceptable contagion risk. RBNZ capital review2 The RBNZ capital adequacy framework became effective from 1 July 2022. The reforms began being phased in from 1 October 2021, with changes yet to be fully implemented including: • WNZL Tier 1 capital requirement will increase to 16% of RWA by 1 July 2028, of which 13.5% must be CET1 and up to 2.5% may be AT1; • WNZL’s total capital requirement will increase to 18% of RWA by 1 July 2028, of which up to 2% can be Tier 2 capital; and • Eligible Tier 1 capital will comprise common equity and redeemable perpetual preference shares. Existing AT1 capital instruments will be phased out by 1 July 2028. On 31 March 2025, the RBNZ announced that it intends to conduct a review of the capital settings applicable to New Zealand incorporated deposit takers (including WNZL). The planned Prudential Capital Buffer increase of 1.0% will proceed on 1 July 2025, with the review to be conducted to allow for any changes to be signalled prior to the next capital requirement increase scheduled for 1 July 2026. 1. For the purposes of APS 222, subsidiaries controlled by Westpac, other than subsidiaries that form part of the ELE, represent ‘related entities’. Prudential and internal limits apply to intra-group exposures between the ELE and related entities, both on an individual and aggregate basis. 2. WNZL’s references to CET1, AT1 and other capital measures are subject to RBNZ's specific requirements and may not align with Australian requirements or definitions in the Glossary. |
| 10 WESTPAC GROUP MARCH 2025 PILLAR 3 REPORT CAPITAL OVERVIEW Capital management strategy Westpac's capital management strategy is reviewed on an ongoing basis, including through an annual Internal Capital Adequacy Assessment Process (ICAAP). Key considerations include: • Regulatory capital minimums together with the capital conservation buffer and countercyclical capital buffer are the Total CET1 Requirement. The Total CET1 Requirement for D-SIBs, including Westpac, is at least 10.25%1 ; • Strategy, business mix and operations and contingency plans; • Perspectives of external stakeholders including rating agencies as well as equity and debt investors; and • A stress testing framework that tests our resilience under a range of adverse economic scenarios. The Board has determined a target CET1 operating capital range of between 11.0% and 11.5%, in normal operating conditions. APRA announcement to phase out Additional Tier 1 (AT1) capital as eligible bank capital On 9 December 2024, APRA confirmed it will phase out AT1 capital instruments from the bank prudential framework. Under APRA’s proposed approach, large internationally active banks such as Westpac will replace 1.5% AT1 capital with 1.25% Tier 2 capital and 0.25% CET1 capital which would see the total CET1 requirement, including regulatory buffers, increase from 10.25% to 10.50%. APRA intends to finalise changes to relevant prudential standards before the end of 2025, with the updated framework to come into effect from 1 January 2027. In addition, from this date, existing AT1 capital instruments would be eligible to be included as Tier 2 capital, until their first scheduled call date. All existing AT1 capital instruments issued by an Australian bank would reach their first scheduled call date by 2032 at the latest. 1. Noting that APRA may apply higher CET1 requirements for an individual ADI. |
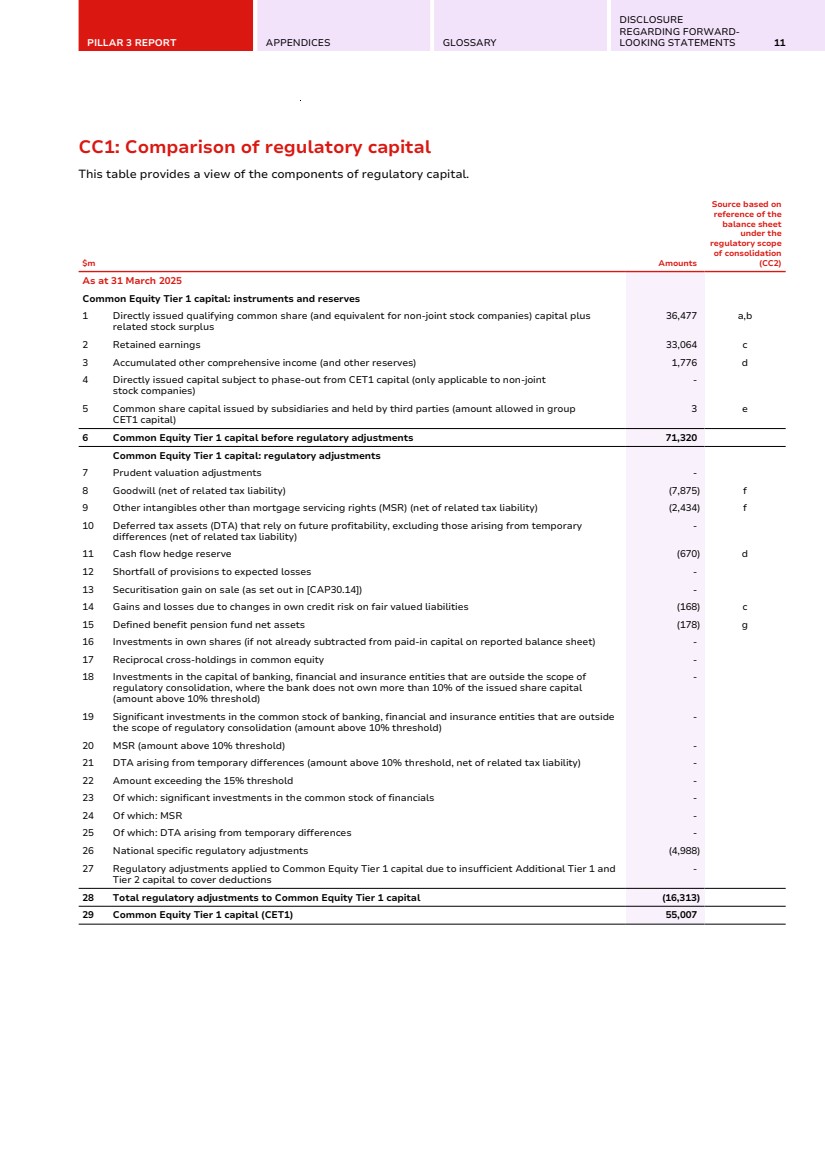
| PILLAR 3 REPORT APPENDICES GLOSSARY DISCLOSURE REGARDING FORWARD-LOOKING STATEMENTS 11 CC1: Comparison of regulatory capital This table provides a view of the components of regulatory capital. $m Amounts Source based on reference of the balance sheet under the regulatory scope of consolidation (CC2) As at 31 March 2025 Common Equity Tier 1 capital: instruments and reserves 1 Directly issued qualifying common share (and equivalent for non-joint stock companies) capital plus related stock surplus 36,477 a,b 2 Retained earnings 33,064 c 3 Accumulated other comprehensive income (and other reserves) 1,776 d 4 Directly issued capital subject to phase-out from CET1 capital (only applicable to non-joint stock companies) - 5 Common share capital issued by subsidiaries and held by third parties (amount allowed in group CET1 capital) 3 e 6 Common Equity Tier 1 capital before regulatory adjustments 71,320 Common Equity Tier 1 capital: regulatory adjustments 7 Prudent valuation adjustments - 8 Goodwill (net of related tax liability) (7,875) f 9 Other intangibles other than mortgage servicing rights (MSR) (net of related tax liability) (2,434) f 10 Deferred tax assets (DTA) that rely on future profitability, excluding those arising from temporary differences (net of related tax liability) - 11 Cash flow hedge reserve (670) d 12 Shortfall of provisions to expected losses - 13 Securitisation gain on sale (as set out in [CAP30.14]) - 14 Gains and losses due to changes in own credit risk on fair valued liabilities (168) c 15 Defined benefit pension fund net assets (178) g 16 Investments in own shares (if not already subtracted from paid-in capital on reported balance sheet) - 17 Reciprocal cross-holdings in common equity - 18 Investments in the capital of banking, financial and insurance entities that are outside the scope of regulatory consolidation, where the bank does not own more than 10% of the issued share capital (amount above 10% threshold) - 19 Significant investments in the common stock of banking, financial and insurance entities that are outside the scope of regulatory consolidation (amount above 10% threshold) - 20 MSR (amount above 10% threshold) - 21 DTA arising from temporary differences (amount above 10% threshold, net of related tax liability) - 22 Amount exceeding the 15% threshold - 23 Of which: significant investments in the common stock of financials - 24 Of which: MSR - 25 Of which: DTA arising from temporary differences - 26 National specific regulatory adjustments (4,988) 27 Regulatory adjustments applied to Common Equity Tier 1 capital due to insufficient Additional Tier 1 and Tier 2 capital to cover deductions - 28 Total regulatory adjustments to Common Equity Tier 1 capital (16,313) 29 Common Equity Tier 1 capital (CET1) 55,007 |
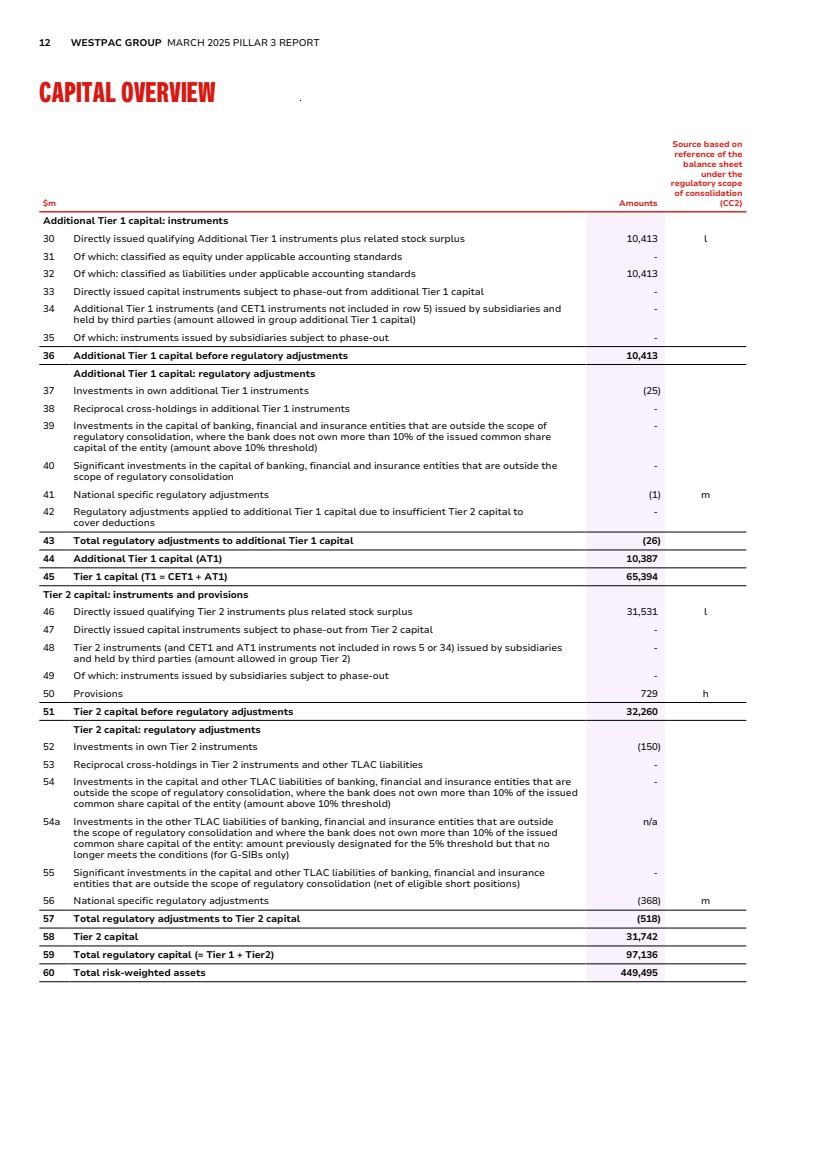
| 12 WESTPAC GROUP MARCH 2025 PILLAR 3 REPORT CAPITAL OVERVIEW $m Amounts Source based on reference of the balance sheet under the regulatory scope of consolidation (CC2) Additional Tier 1 capital: instruments 30 Directly issued qualifying Additional Tier 1 instruments plus related stock surplus 10,413 l 31 Of which: classified as equity under applicable accounting standards - 32 Of which: classified as liabilities under applicable accounting standards 10,413 33 Directly issued capital instruments subject to phase-out from additional Tier 1 capital - 34 Additional Tier 1 instruments (and CET1 instruments not included in row 5) issued by subsidiaries and held by third parties (amount allowed in group additional Tier 1 capital) - 35 Of which: instruments issued by subsidiaries subject to phase-out - 36 Additional Tier 1 capital before regulatory adjustments 10,413 Additional Tier 1 capital: regulatory adjustments 37 Investments in own additional Tier 1 instruments (25) 38 Reciprocal cross-holdings in additional Tier 1 instruments - 39 Investments in the capital of banking, financial and insurance entities that are outside the scope of regulatory consolidation, where the bank does not own more than 10% of the issued common share capital of the entity (amount above 10% threshold) - 40 Significant investments in the capital of banking, financial and insurance entities that are outside the scope of regulatory consolidation - 41 National specific regulatory adjustments (1) m 42 Regulatory adjustments applied to additional Tier 1 capital due to insufficient Tier 2 capital to cover deductions - 43 Total regulatory adjustments to additional Tier 1 capital (26) 44 Additional Tier 1 capital (AT1) 10,387 45 Tier 1 capital (T1 = CET1 + AT1) 65,394 Tier 2 capital: instruments and provisions 46 Directly issued qualifying Tier 2 instruments plus related stock surplus 31,531 l 47 Directly issued capital instruments subject to phase-out from Tier 2 capital - 48 Tier 2 instruments (and CET1 and AT1 instruments not included in rows 5 or 34) issued by subsidiaries and held by third parties (amount allowed in group Tier 2) - 49 Of which: instruments issued by subsidiaries subject to phase-out - 50 Provisions 729 h 51 Tier 2 capital before regulatory adjustments 32,260 Tier 2 capital: regulatory adjustments 52 Investments in own Tier 2 instruments (150) 53 Reciprocal cross-holdings in Tier 2 instruments and other TLAC liabilities - 54 Investments in the capital and other TLAC liabilities of banking, financial and insurance entities that are outside the scope of regulatory consolidation, where the bank does not own more than 10% of the issued common share capital of the entity (amount above 10% threshold) - 54a Investments in the other TLAC liabilities of banking, financial and insurance entities that are outside the scope of regulatory consolidation and where the bank does not own more than 10% of the issued common share capital of the entity: amount previously designated for the 5% threshold but that no longer meets the conditions (for G-SIBs only) n/a 55 Significant investments in the capital and other TLAC liabilities of banking, financial and insurance entities that are outside the scope of regulatory consolidation (net of eligible short positions) - 56 National specific regulatory adjustments (368) m 57 Total regulatory adjustments to Tier 2 capital (518) 58 Tier 2 capital 31,742 59 Total regulatory capital (= Tier 1 + Tier2) 97,136 60 Total risk-weighted assets 449,495 |
| PILLAR 3 REPORT APPENDICES GLOSSARY DISCLOSURE REGARDING FORWARD-LOOKING STATEMENTS 13 $m Amounts Source based on reference of the balance sheet under the regulatory scope of consolidation (CC2) Capital adequacy ratios and buffers 61 Common Equity Tier 1 capital (as a percentage of risk-weighted assets) 12.24% 62 Tier 1 capital (as a percentage of risk-weighted assets) 14.55% 63 Total capital (as a percentage of risk-weighted assets) 21.61% 64 Institution-specific buffer requirement (capital conservation buffer plus countercyclical buffer requirements plus higher loss absorbency requirement, expressed as a percentage of risk-weighted assets) 10.09% 65 Of which: capital conservation buffer requirement 3.75% 66 Of which: bank-specific countercyclical buffer requirement 0.84% 67 Of which: higher loss absorbency requirement 1.00% 68 Common Equity Tier 1 capital (as a percentage of risk-weighted assets) available after meeting the bank’s minimum capital requirements 7.74% National minima (if different from Basel III) 69 National minimum Common Equity Tier 1 capital adequacy ratio (if different from Basel III minimum) n/a 70 National minimum Tier 1 capital adequacy ratio (if different from Basel III minimum) n/a 71 National minimum Total capital adequacy ratio (if different from Basel III minimum) n/a Amounts below the thresholds for deduction (before risk-weighting) 72 Non-significant investments in the capital and other TLAC liabilities of other financial entities 145 i,g 73 Significant investments in the common stock of financial entities 175 j 74 MSR (net of related tax liability) - 75 DTA arising from temporary differences (net of related tax liability) 3,116 k Applicable caps on the inclusion of provisions in Tier 2 capital 76 Provisions eligible for inclusion in Tier 2 capital in respect of exposures subject to standardised approach (prior to application of cap) 83 h 77 Cap on inclusion of provisions in Tier 2 capital under standardised approach 352 78 Provisions eligible for inclusion in Tier 2 capital in respect of exposures subject to internal ratings-based approach (prior to application of cap) 646 h 79 Cap for inclusion of provisions in Tier 2 capital under internal ratings-based approach 1,902 |

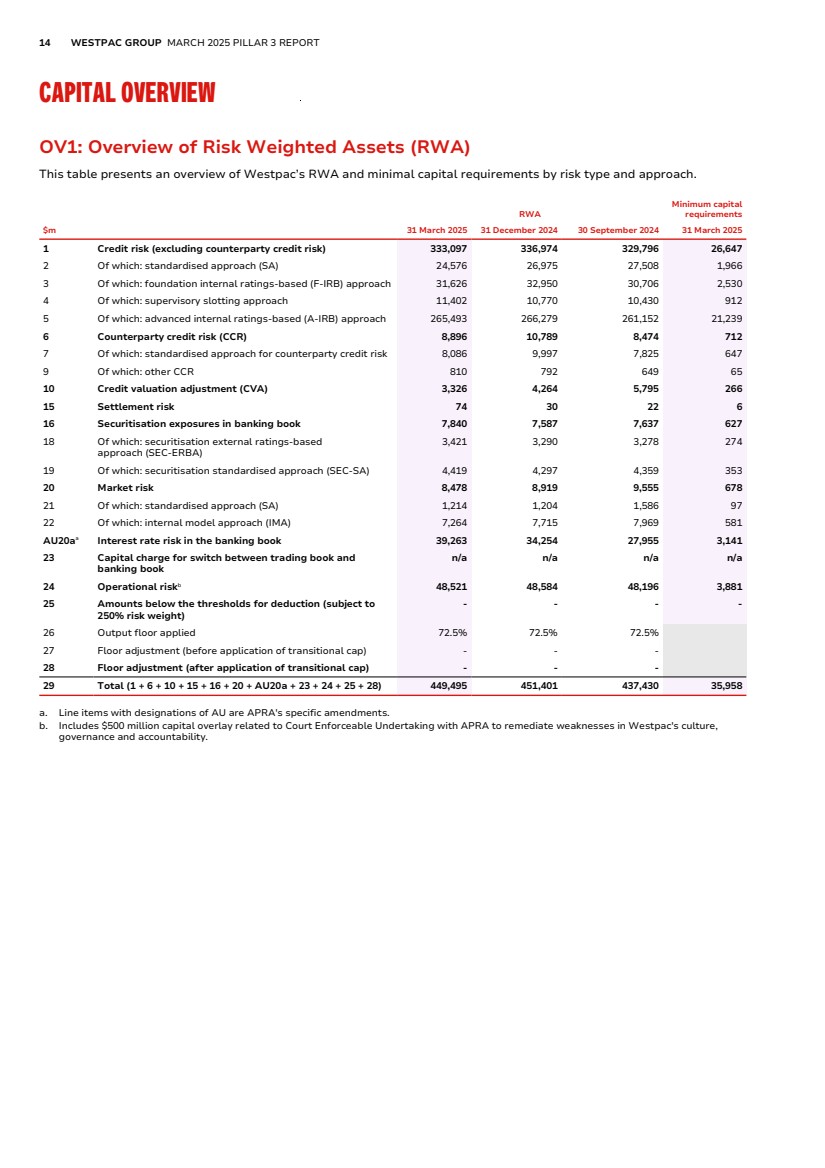
| 14 WESTPAC GROUP MARCH 2025 PILLAR 3 REPORT CAPITAL OVERVIEW OV1: Overview of Risk Weighted Assets (RWA) This table presents an overview of Westpac’s RWA and minimal capital requirements by risk type and approach. $m RWA Minimum capital requirements 31 March 2025 31 December 2024 30 September 2024 31 March 2025 1 Credit risk (excluding counterparty credit risk) 333,097 336,974 329,796 26,647 2 Of which: standardised approach (SA) 24,576 26,975 27,508 1,966 3 Of which: foundation internal ratings-based (F-IRB) approach 31,626 32,950 30,706 2,530 4 Of which: supervisory slotting approach 11,402 10,770 10,430 912 5 Of which: advanced internal ratings-based (A-IRB) approach 265,493 266,279 261,152 21,239 6 Counterparty credit risk (CCR) 8,896 10,789 8,474 712 7 Of which: standardised approach for counterparty credit risk 8,086 9,997 7,825 647 9 Of which: other CCR 810 792 649 65 10 Credit valuation adjustment (CVA) 3,326 4,264 5,795 266 15 Settlement risk 74 30 22 6 16 Securitisation exposures in banking book 7,840 7,587 7,637 627 18 Of which: securitisation external ratings-based approach (SEC-ERBA) 3,421 3,290 3,278 274 19 Of which: securitisation standardised approach (SEC-SA) 4,419 4,297 4,359 353 20 Market risk 8,478 8,919 9,555 678 21 Of which: standardised approach (SA) 1,214 1,204 1,586 97 22 Of which: internal model approach (IMA) 7,264 7,715 7,969 581 AU20aa Interest rate risk in the banking book 39,263 34,254 27,955 3,141 23 Capital charge for switch between trading book and banking book n/a n/a n/a n/a 24 Operational riskb 48,521 48,584 48,196 3,881 25 Amounts below the thresholds for deduction (subject to 250% risk weight) - - - - 26 Output floor applied 72.5% 72.5% 72.5% 27 Floor adjustment (before application of transitional cap) - - - 28 Floor adjustment (after application of transitional cap) - - - 29 Total (1 + 6 + 10 + 15 + 16 + 20 + AU20a + 23 + 24 + 25 + 28) 449,495 451,401 437,430 35,958 a. Line items with designations of AU are APRA's specific amendments. b. Includes $500 million capital overlay related to Court Enforceable Undertaking with APRA to remediate weaknesses in Westpac's culture, governance and accountability. |
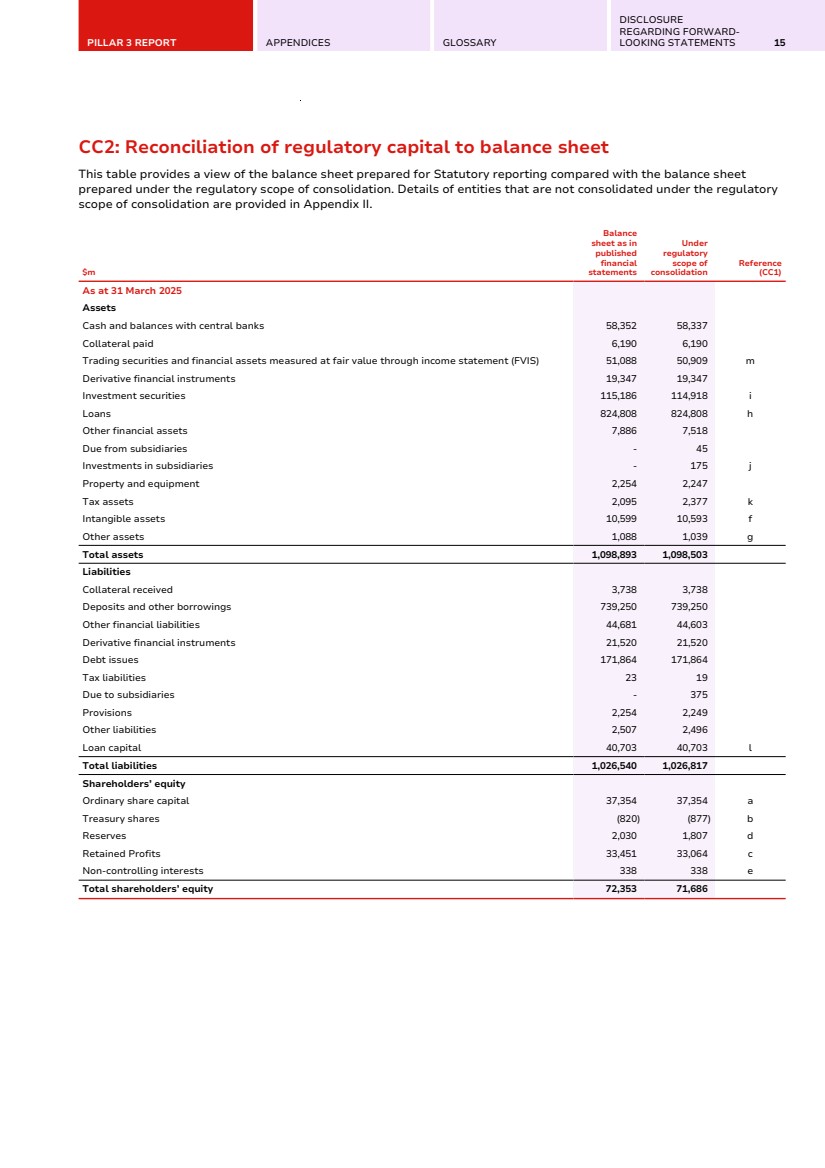
| PILLAR 3 REPORT APPENDICES GLOSSARY DISCLOSURE REGARDING FORWARD-LOOKING STATEMENTS 15 CC2: Reconciliation of regulatory capital to balance sheet This table provides a view of the balance sheet prepared for Statutory reporting compared with the balance sheet prepared under the regulatory scope of consolidation. Details of entities that are not consolidated under the regulatory scope of consolidation are provided in Appendix II. $m Balance sheet as in published financial statements Under regulatory scope of consolidation Reference (CC1) As at 31 March 2025 Assets Cash and balances with central banks 58,352 58,337 Collateral paid 6,190 6,190 Trading securities and financial assets measured at fair value through income statement (FVIS) 51,088 50,909 m Derivative financial instruments 19,347 19,347 Investment securities 115,186 114,918 i Loans 824,808 824,808 h Other financial assets 7,886 7,518 Due from subsidiaries - 45 Investments in subsidiaries - 175 j Property and equipment 2,254 2,247 Tax assets 2,095 2,377 k Intangible assets 10,599 10,593 f Other assets 1,088 1,039 g Total assets 1,098,893 1,098,503 Liabilities Collateral received 3,738 3,738 Deposits and other borrowings 739,250 739,250 Other financial liabilities 44,681 44,603 Derivative financial instruments 21,520 21,520 Debt issues 171,864 171,864 Tax liabilities 23 19 Due to subsidiaries - 375 Provisions 2,254 2,249 Other liabilities 2,507 2,496 Loan capital 40,703 40,703 l Total liabilities 1,026,540 1,026,817 Shareholders’ equity Ordinary share capital 37,354 37,354 a Treasury shares (820) (877) b Reserves 2,030 1,807 d Retained Profits 33,451 33,064 c Non-controlling interests 338 338 e Total shareholders’ equity 72,353 71,686 |
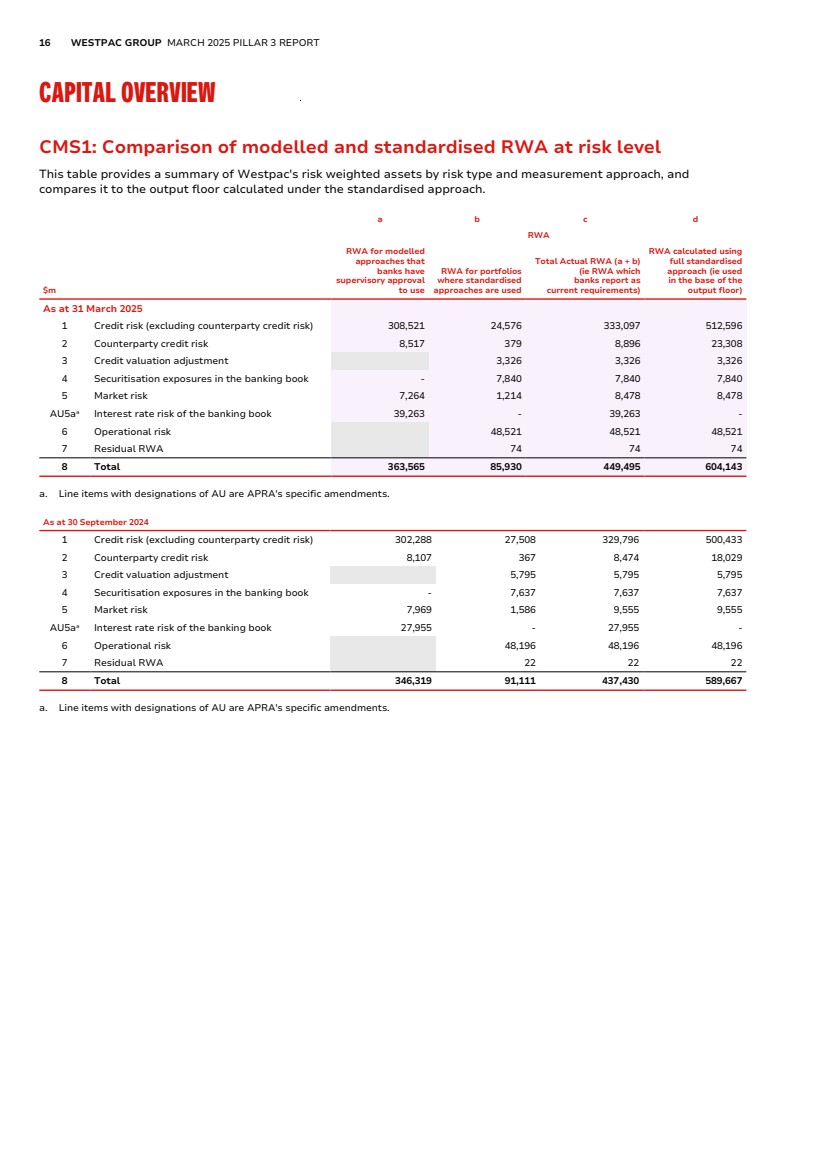
| 16 WESTPAC GROUP MARCH 2025 PILLAR 3 REPORT CAPITAL OVERVIEW CMS1: Comparison of modelled and standardised RWA at risk level This table provides a summary of Westpac's risk weighted assets by risk type and measurement approach, and compares it to the output floor calculated under the standardised approach. $m a b c d RWA RWA for modelled approaches that banks have supervisory approval to use RWA for portfolios where standardised approaches are used Total Actual RWA (a + b) (ie RWA which banks report as current requirements) RWA calculated using full standardised approach (ie used in the base of the output floor) As at 31 March 2025 1 Credit risk (excluding counterparty credit risk) 308,521 24,576 333,097 512,596 2 Counterparty credit risk 8,517 379 8,896 23,308 3 Credit valuation adjustment 3,326 3,326 3,326 4 Securitisation exposures in the banking book - 7,840 7,840 7,840 5 Market risk 7,264 1,214 8,478 8,478 AU5aa Interest rate risk of the banking book 39,263 - 39,263 - 6 Operational risk 48,521 48,521 48,521 7 Residual RWA 74 74 74 8 Total 363,565 85,930 449,495 604,143 a. Line items with designations of AU are APRA's specific amendments. As at 30 September 2024 1 Credit risk (excluding counterparty credit risk) 302,288 27,508 329,796 500,433 2 Counterparty credit risk 8,107 367 8,474 18,029 3 Credit valuation adjustment 5,795 5,795 5,795 4 Securitisation exposures in the banking book - 7,637 7,637 7,637 5 Market risk 7,969 1,586 9,555 9,555 AU5aa Interest rate risk of the banking book 27,955 - 27,955 - 6 Operational risk 48,196 48,196 48,196 7 Residual RWA 22 22 22 8 Total 346,319 91,111 437,430 589,667 a. Line items with designations of AU are APRA's specific amendments. |
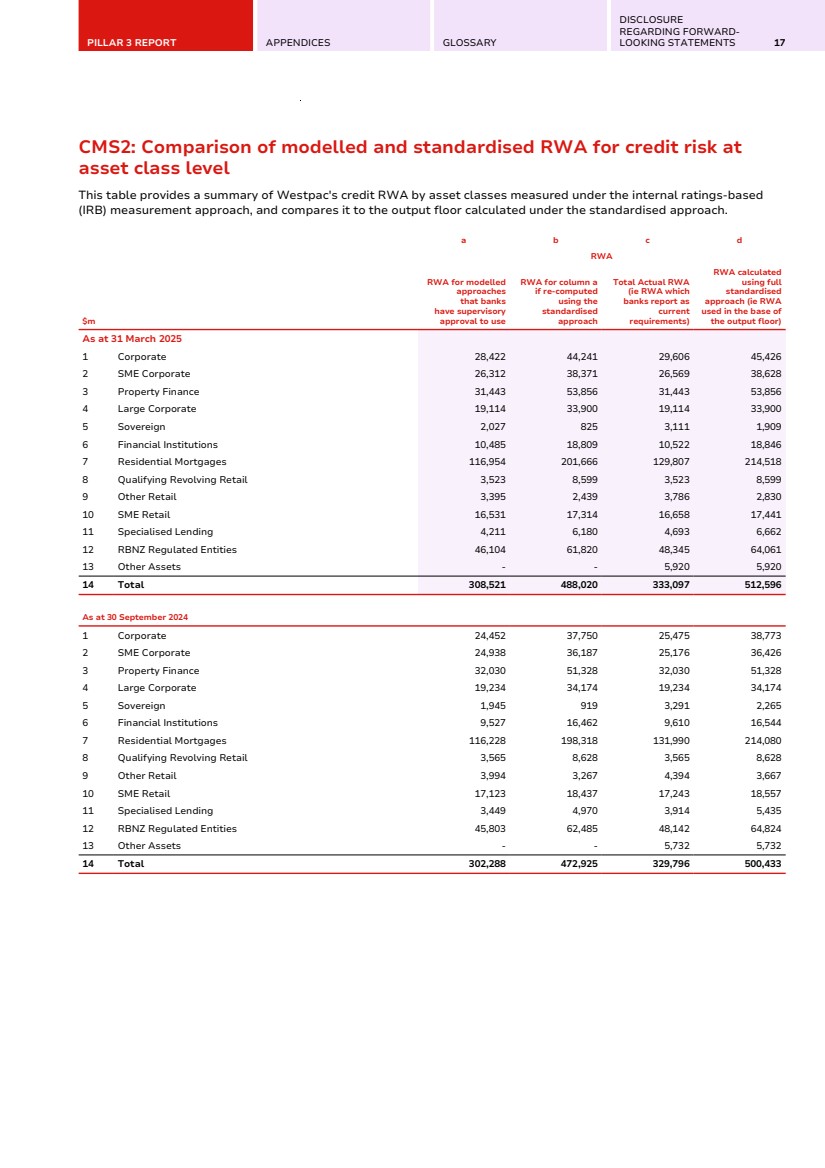
| PILLAR 3 REPORT APPENDICES GLOSSARY DISCLOSURE REGARDING FORWARD-LOOKING STATEMENTS 17 CMS2: Comparison of modelled and standardised RWA for credit risk at asset class level This table provides a summary of Westpac's credit RWA by asset classes measured under the internal ratings-based (IRB) measurement approach, and compares it to the output floor calculated under the standardised approach. $m a b c d RWA RWA for modelled approaches that banks have supervisory approval to use RWA for column a if re-computed using the standardised approach Total Actual RWA (ie RWA which banks report as current requirements) RWA calculated using full standardised approach (ie RWA used in the base of the output floor) As at 31 March 2025 1 Corporate 28,422 44,241 29,606 45,426 2 SME Corporate 26,312 38,371 26,569 38,628 3 Property Finance 31,443 53,856 31,443 53,856 4 Large Corporate 19,114 33,900 19,114 33,900 5 Sovereign 2,027 825 3,111 1,909 6 Financial Institutions 10,485 18,809 10,522 18,846 7 Residential Mortgages 116,954 201,666 129,807 214,518 8 Qualifying Revolving Retail 3,523 8,599 3,523 8,599 9 Other Retail 3,395 2,439 3,786 2,830 10 SME Retail 16,531 17,314 16,658 17,441 11 Specialised Lending 4,211 6,180 4,693 6,662 12 RBNZ Regulated Entities 46,104 61,820 48,345 64,061 13 Other Assets - - 5,920 5,920 14 Total 308,521 488,020 333,097 512,596 As at 30 September 2024 1 Corporate 24,452 37,750 25,475 38,773 2 SME Corporate 24,938 36,187 25,176 36,426 3 Property Finance 32,030 51,328 32,030 51,328 4 Large Corporate 19,234 34,174 19,234 34,174 5 Sovereign 1,945 919 3,291 2,265 6 Financial Institutions 9,527 16,462 9,610 16,544 7 Residential Mortgages 116,228 198,318 131,990 214,080 8 Qualifying Revolving Retail 3,565 8,628 3,565 8,628 9 Other Retail 3,994 3,267 4,394 3,667 10 SME Retail 17,123 18,437 17,243 18,557 11 Specialised Lending 3,449 4,970 3,914 5,435 12 RBNZ Regulated Entities 45,803 62,485 48,142 64,824 13 Other Assets - - 5,732 5,732 14 Total 302,288 472,925 329,796 500,433 |
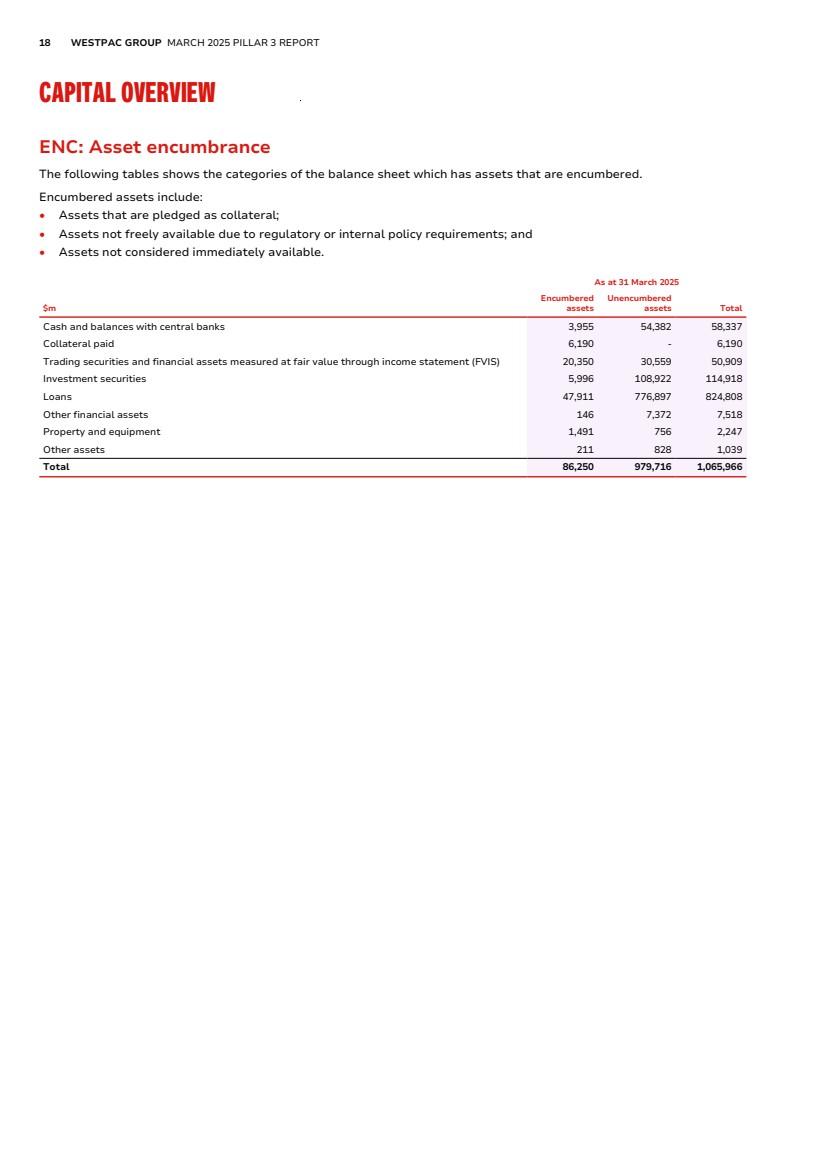
| 18 WESTPAC GROUP MARCH 2025 PILLAR 3 REPORT CAPITAL OVERVIEW ENC: Asset encumbrance The following tables shows the categories of the balance sheet which has assets that are encumbered. Encumbered assets include: • Assets that are pledged as collateral; • Assets not freely available due to regulatory or internal policy requirements; and • Assets not considered immediately available. As at 31 March 2025 $m Encumbered assets Unencumbered assets Total Cash and balances with central banks 3,955 54,382 58,337 Collateral paid 6,190 - 6,190 Trading securities and financial assets measured at fair value through income statement (FVIS) 20,350 30,559 50,909 Investment securities 5,996 108,922 114,918 Loans 47,911 776,897 824,808 Other financial assets 146 7,372 7,518 Property and equipment 1,491 756 2,247 Other assets 211 828 1,039 Total 86,250 979,716 1,065,966 |
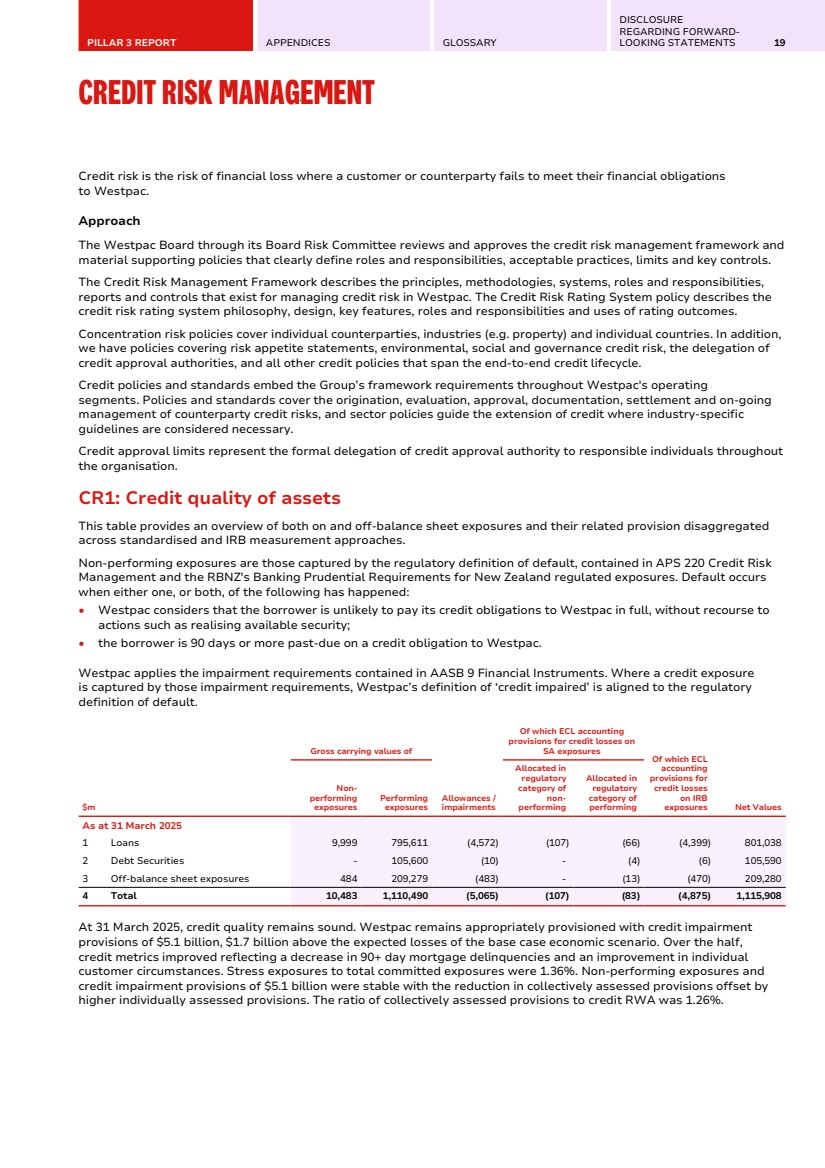
| PILLAR 3 REPORT APPENDICES GLOSSARY DISCLOSURE REGARDING FORWARD-LOOKING STATEMENTS 19 CREDIT RISK MANAGEMENT Credit risk is the risk of financial loss where a customer or counterparty fails to meet their financial obligations to Westpac. Approach The Westpac Board through its Board Risk Committee reviews and approves the credit risk management framework and material supporting policies that clearly define roles and responsibilities, acceptable practices, limits and key controls. The Credit Risk Management Framework describes the principles, methodologies, systems, roles and responsibilities, reports and controls that exist for managing credit risk in Westpac. The Credit Risk Rating System policy describes the credit risk rating system philosophy, design, key features, roles and responsibilities and uses of rating outcomes. Concentration risk policies cover individual counterparties, industries (e.g. property) and individual countries. In addition, we have policies covering risk appetite statements, environmental, social and governance credit risk, the delegation of credit approval authorities, and all other credit policies that span the end-to-end credit lifecycle. Credit policies and standards embed the Group’s framework requirements throughout Westpac's operating segments. Policies and standards cover the origination, evaluation, approval, documentation, settlement and on-going management of counterparty credit risks, and sector policies guide the extension of credit where industry-specific guidelines are considered necessary. Credit approval limits represent the formal delegation of credit approval authority to responsible individuals throughout the organisation. CR1: Credit quality of assets This table provides an overview of both on and off-balance sheet exposures and their related provision disaggregated across standardised and IRB measurement approaches. Non-performing exposures are those captured by the regulatory definition of default, contained in APS 220 Credit Risk Management and the RBNZ's Banking Prudential Requirements for New Zealand regulated exposures. Default occurs when either one, or both, of the following has happened: • Westpac considers that the borrower is unlikely to pay its credit obligations to Westpac in full, without recourse to actions such as realising available security; • the borrower is 90 days or more past-due on a credit obligation to Westpac. Westpac applies the impairment requirements contained in AASB 9 Financial Instruments. Where a credit exposure is captured by those impairment requirements, Westpac’s definition of ‘credit impaired’ is aligned to the regulatory definition of default. $m Gross carrying values of Allowances / impairments Of which ECL accounting provisions for credit losses on SA exposures Of which ECL accounting provisions for credit losses on IRB exposures Net Values Non-performing exposures Performing exposures Allocated in regulatory category of non-performing Allocated in regulatory category of performing As at 31 March 2025 1 Loans 9,999 795,611 (4,572) (107) (66) (4,399) 801,038 2 Debt Securities - 105,600 (10) - (4) (6) 105,590 3 Off-balance sheet exposures 484 209,279 (483) - (13) (470) 209,280 4 Total 10,483 1,110,490 (5,065) (107) (83) (4,875) 1,115,908 At 31 March 2025, credit quality remains sound. Westpac remains appropriately provisioned with credit impairment provisions of $5.1 billion, $1.7 billion above the expected losses of the base case economic scenario. Over the half, credit metrics improved reflecting a decrease in 90+ day mortgage delinquencies and an improvement in individual customer circumstances. Stress exposures to total committed exposures were 1.36%. Non-performing exposures and credit impairment provisions of $5.1 billion were stable with the reduction in collectively assessed provisions offset by higher individually assessed provisions. The ratio of collectively assessed provisions to credit RWA was 1.26%. |
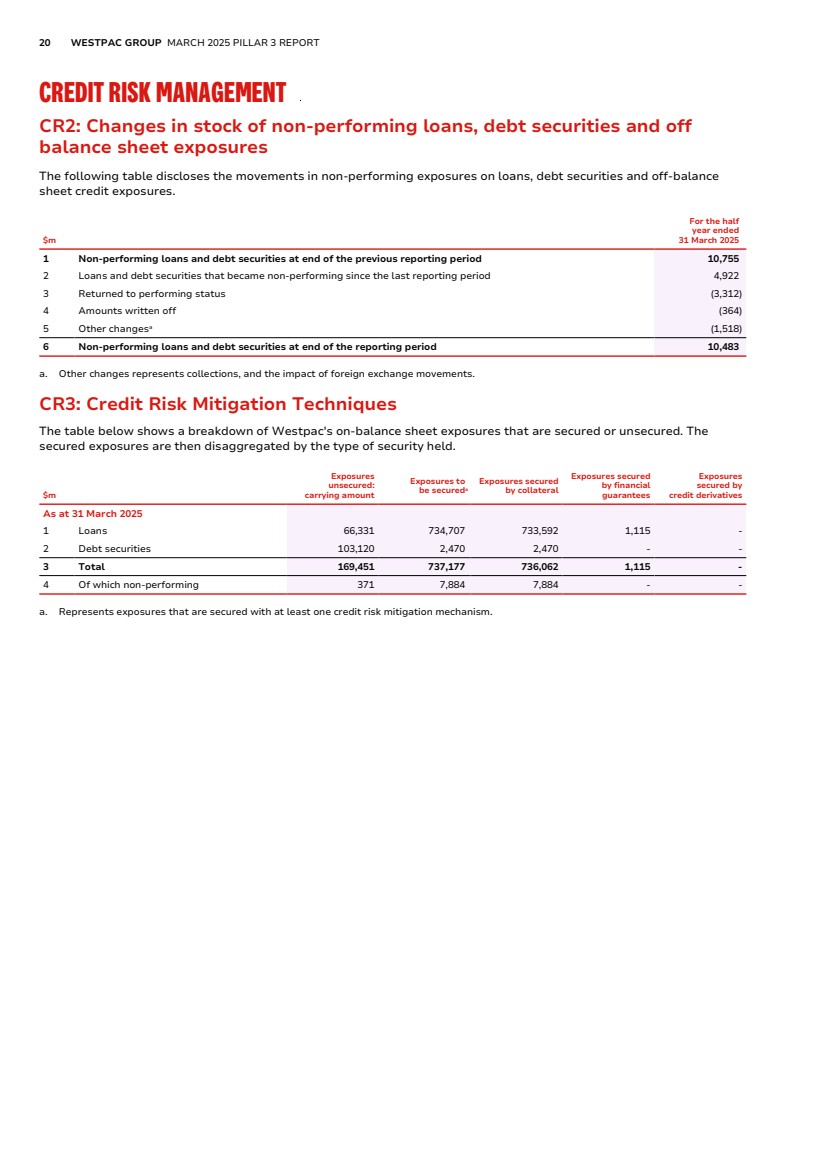
| 20 WESTPAC GROUP MARCH 2025 PILLAR 3 REPORT CREDIT RISK MANAGEMENT CR2: Changes in stock of non-performing loans, debt securities and off balance sheet exposures The following table discloses the movements in non-performing exposures on loans, debt securities and off-balance sheet credit exposures. $m For the half year ended 31 March 2025 1 Non-performing loans and debt securities at end of the previous reporting period 10,755 2 Loans and debt securities that became non-performing since the last reporting period 4,922 3 Returned to performing status (3,312) 4 Amounts written off (364) 5 Other changesa (1,518) 6 Non-performing loans and debt securities at end of the reporting period 10,483 a. Other changes represents collections, and the impact of foreign exchange movements. CR3: Credit Risk Mitigation Techniques The table below shows a breakdown of Westpac's on-balance sheet exposures that are secured or unsecured. The secured exposures are then disaggregated by the type of security held. $m Exposures unsecured: carrying amount Exposures to be secureda Exposures secured by collateral Exposures secured by financial guarantees Exposures secured by credit derivatives As at 31 March 2025 1 Loans 66,331 734,707 733,592 1,115 - 2 Debt securities 103,120 2,470 2,470 - - 3 Total 169,451 737,177 736,062 1,115 - 4 Of which non-performing 371 7,884 7,884 - - a. Represents exposures that are secured with at least one credit risk mitigation mechanism. |
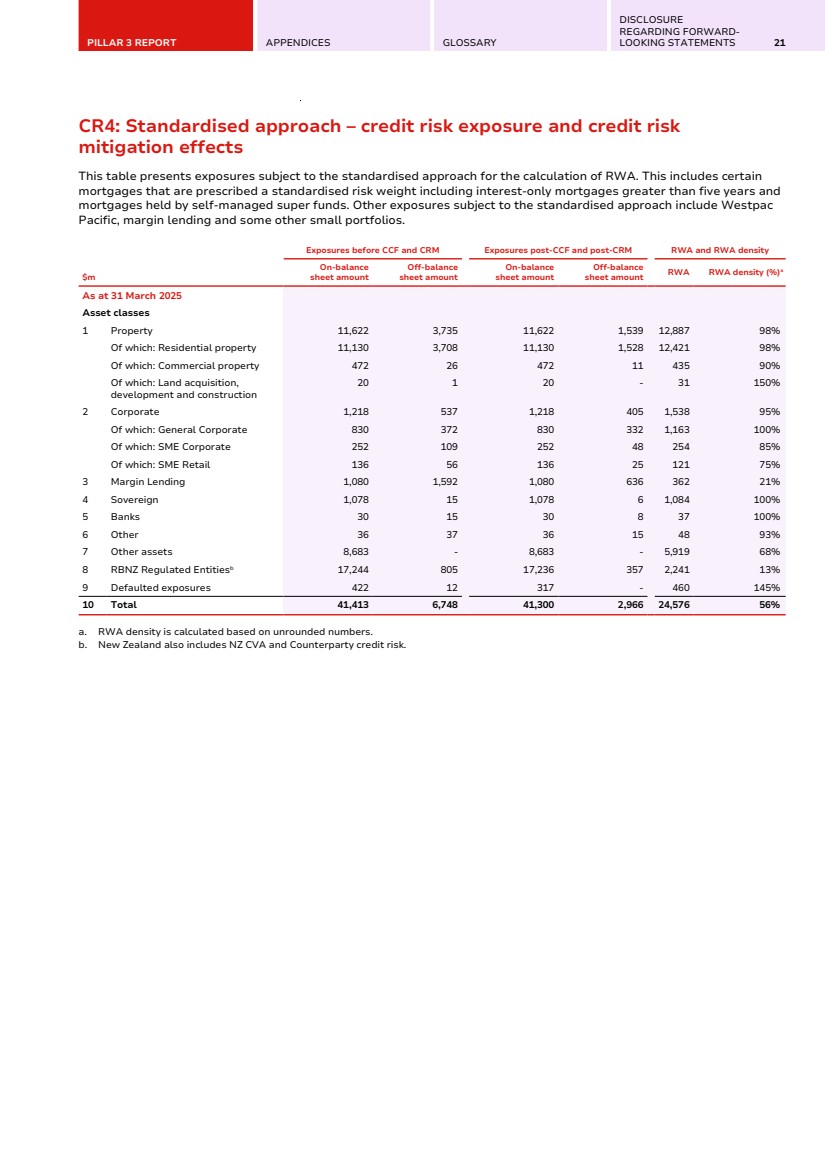
| PILLAR 3 REPORT APPENDICES GLOSSARY DISCLOSURE REGARDING FORWARD-LOOKING STATEMENTS 21 CR4: Standardised approach – credit risk exposure and credit risk mitigation effects This table presents exposures subject to the standardised approach for the calculation of RWA. This includes certain mortgages that are prescribed a standardised risk weight including interest-only mortgages greater than five years and mortgages held by self-managed super funds. Other exposures subject to the standardised approach include Westpac Pacific, margin lending and some other small portfolios. $m Exposures before CCF and CRM Exposures post-CCF and post-CRM RWA and RWA density On-balance sheet amount Off-balance sheet amount On-balance sheet amount Off-balance sheet amount RWA RWA density (%)a As at 31 March 2025 Asset classes 1 Property 11,622 3,735 11,622 1,539 12,887 98% Of which: Residential property 11,130 3,708 11,130 1,528 12,421 98% Of which: Commercial property 472 26 472 11 435 90% Of which: Land acquisition, development and construction 20 1 20 - 31 150% 2 Corporate 1,218 537 1,218 405 1,538 95% Of which: General Corporate 830 372 830 332 1,163 100% Of which: SME Corporate 252 109 252 48 254 85% Of which: SME Retail 136 56 136 25 121 75% 3 Margin Lending 1,080 1,592 1,080 636 362 21% 4 Sovereign 1,078 15 1,078 6 1,084 100% 5 Banks 30 15 30 8 37 100% 6 Other 36 37 36 15 48 93% 7 Other assets 8,683 - 8,683 - 5,919 68% 8 RBNZ Regulated Entitiesb 17,244 805 17,236 357 2,241 13% 9 Defaulted exposures 422 12 317 - 460 145% 10 Total 41,413 6,748 41,300 2,966 24,576 56% a. RWA density is calculated based on unrounded numbers. b. New Zealand also includes NZ CVA and Counterparty credit risk. |
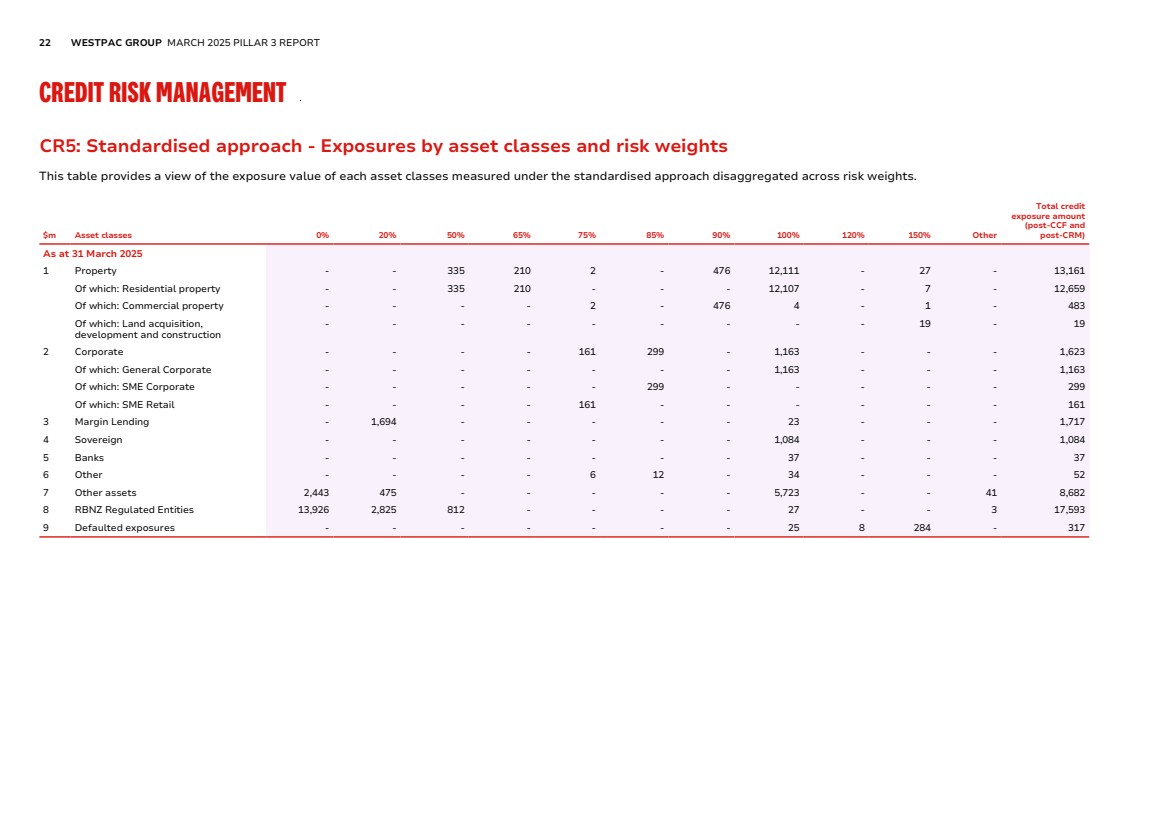
| 22 WESTPAC GROUP MARCH 2025 PILLAR 3 REPORT CREDIT RISK MANAGEMENT CR5: Standardised approach - Exposures by asset classes and risk weights This table provides a view of the exposure value of each asset classes measured under the standardised approach disaggregated across risk weights. $m Asset classes 0% 20% 50% 65% 75% 85% 90% 100% 120% 150% Other Total credit exposure amount (post-CCF and post-CRM) As at 31 March 2025 1 Property - - 335 210 2 - 476 12,111 - 27 - 13,161 Of which: Residential property - - 335 210 - - - 12,107 - 7 - 12,659 Of which: Commercial property - - - - 2 - 476 4 - 1 - 483 Of which: Land acquisition, development and construction - - - - - - - - - 19 - 19 2 Corporate - - - - 161 299 - 1,163 - - - 1,623 Of which: General Corporate - - - - - - - 1,163 - - - 1,163 Of which: SME Corporate - - - - - 299 - - - - - 299 Of which: SME Retail - - - - 161 - - - - - - 161 3 Margin Lending - 1,694 - - - - - 23 - - - 1,717 4 Sovereign - - - - - - - 1,084 - - - 1,084 5 Banks - - - - - - - 37 - - - 37 6 Other - - - - 6 12 - 34 - - - 52 7 Other assets 2,443 475 - - - - - 5,723 - - 41 8,682 8 RBNZ Regulated Entities 13,926 2,825 812 - - - - 27 - - 3 17,593 9 Defaulted exposures - - - - - - - 25 8 284 - 317 |
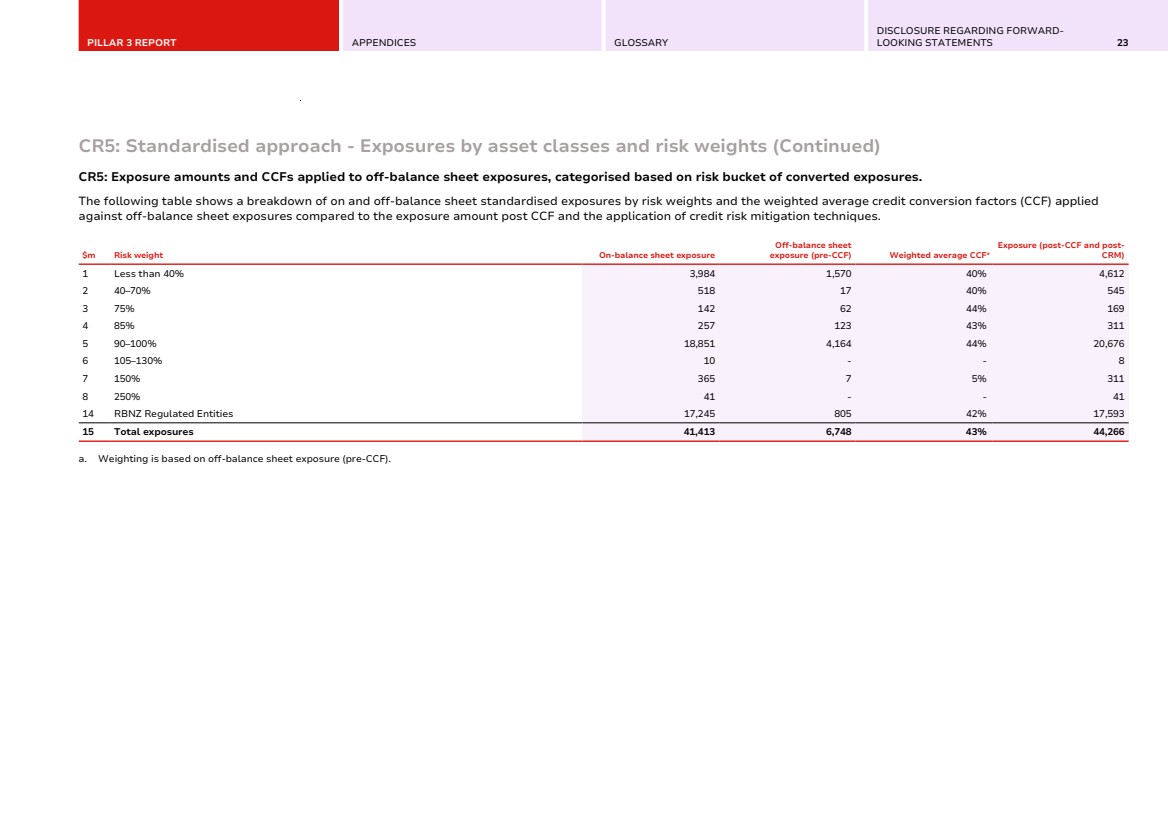
| PILLAR 3 REPORT APPENDICES GLOSSARY DISCLOSURE REGARDING FORWARD-LOOKING STATEMENTS 23 CR5: Standardised approach - Exposures by asset classes and risk weights (Continued) CR5: Exposure amounts and CCFs applied to off-balance sheet exposures, categorised based on risk bucket of converted exposures. The following table shows a breakdown of on and off-balance sheet standardised exposures by risk weights and the weighted average credit conversion factors (CCF) applied against off-balance sheet exposures compared to the exposure amount post CCF and the application of credit risk mitigation techniques. $m Risk weight On-balance sheet exposure Off-balance sheet exposure (pre-CCF) Weighted average CCFa Exposure (post-CCF and post-CRM) 1 Less than 40% 3,984 1,570 40% 4,612 2 40–70% 518 17 40% 545 3 75% 142 62 44% 169 4 85% 257 123 43% 311 5 90–100% 18,851 4,164 44% 20,676 6 105–130% 10 - - 8 7 150% 365 7 5% 311 8 250% 41 - - 41 14 RBNZ Regulated Entities 17,245 805 42% 17,593 15 Total exposures 41,413 6,748 43% 44,266 a. Weighting is based on off-balance sheet exposure (pre-CCF). |
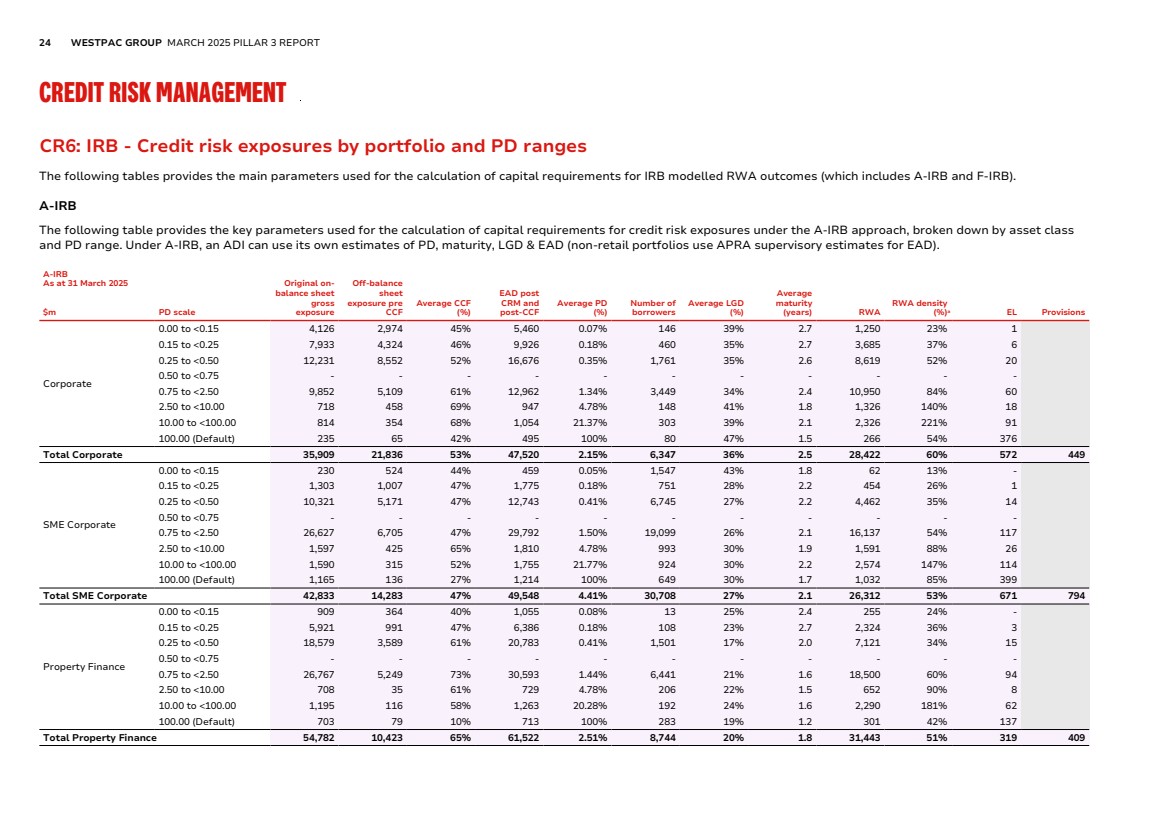
| 24 WESTPAC GROUP MARCH 2025 PILLAR 3 REPORT CREDIT RISK MANAGEMENT CR6: IRB - Credit risk exposures by portfolio and PD ranges The following tables provides the main parameters used for the calculation of capital requirements for IRB modelled RWA outcomes (which includes A-IRB and F-IRB). A-IRB The following table provides the key parameters used for the calculation of capital requirements for credit risk exposures under the A-IRB approach, broken down by asset class and PD range. Under A-IRB, an ADI can use its own estimates of PD, maturity, LGD & EAD (non-retail portfolios use APRA supervisory estimates for EAD). A-IRB As at 31 March 2025 $m PD scale Original on-balance sheet gross exposure Off-balance sheet exposure pre CCF Average CCF (%) EAD post CRM and post-CCF Average PD (%) Number of borrowers Average LGD (%) Average maturity (years) RWA RWA density (%)a EL Provisions Corporate 0.00 to <0.15 4,126 2,974 45% 5,460 0.07% 146 39% 2.7 1,250 23% 1 0.15 to <0.25 7,933 4,324 46% 9,926 0.18% 460 35% 2.7 3,685 37% 6 0.25 to <0.50 12,231 8,552 52% 16,676 0.35% 1,761 35% 2.6 8,619 52% 20 0.50 to <0.75 - - - - - - - - - - - 0.75 to <2.50 9,852 5,109 61% 12,962 1.34% 3,449 34% 2.4 10,950 84% 60 2.50 to <10.00 718 458 69% 947 4.78% 148 41% 1.8 1,326 140% 18 10.00 to <100.00 814 354 68% 1,054 21.37% 303 39% 2.1 2,326 221% 91 100.00 (Default) 235 65 42% 495 100% 80 47% 1.5 266 54% 376 Total Corporate 35,909 21,836 53% 47,520 2.15% 6,347 36% 2.5 28,422 60% 572 449 SME Corporate 0.00 to <0.15 230 524 44% 459 0.05% 1,547 43% 1.8 62 13% - 0.15 to <0.25 1,303 1,007 47% 1,775 0.18% 751 28% 2.2 454 26% 1 0.25 to <0.50 10,321 5,171 47% 12,743 0.41% 6,745 27% 2.2 4,462 35% 14 0.50 to <0.75 - - - - - - - - - - - 0.75 to <2.50 26,627 6,705 47% 29,792 1.50% 19,099 26% 2.1 16,137 54% 117 2.50 to <10.00 1,597 425 65% 1,810 4.78% 993 30% 1.9 1,591 88% 26 10.00 to <100.00 1,590 315 52% 1,755 21.77% 924 30% 2.2 2,574 147% 114 100.00 (Default) 1,165 136 27% 1,214 100% 649 30% 1.7 1,032 85% 399 Total SME Corporate 42,833 14,283 47% 49,548 4.41% 30,708 27% 2.1 26,312 53% 671 794 Property Finance 0.00 to <0.15 909 364 40% 1,055 0.08% 13 25% 2.4 255 24% - 0.15 to <0.25 5,921 991 47% 6,386 0.18% 108 23% 2.7 2,324 36% 3 0.25 to <0.50 18,579 3,589 61% 20,783 0.41% 1,501 17% 2.0 7,121 34% 15 0.50 to <0.75 - - - - - - - - - - - 0.75 to <2.50 26,767 5,249 73% 30,593 1.44% 6,441 21% 1.6 18,500 60% 94 2.50 to <10.00 708 35 61% 729 4.78% 206 22% 1.5 652 90% 8 10.00 to <100.00 1,195 116 58% 1,263 20.28% 192 24% 1.6 2,290 181% 62 100.00 (Default) 703 79 10% 713 100% 283 19% 1.2 301 42% 137 Total Property Finance 54,782 10,423 65% 61,522 2.51% 8,744 20% 1.8 31,443 51% 319 409 |
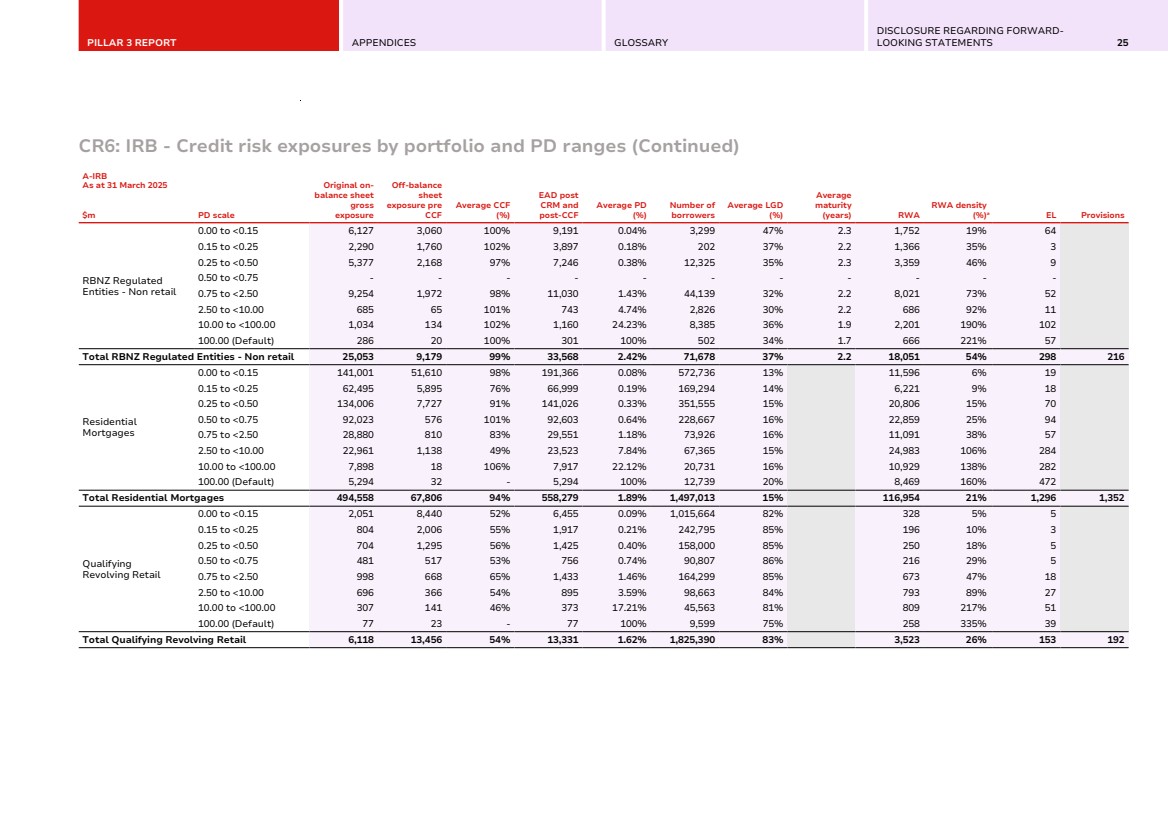
| PILLAR 3 REPORT APPENDICES GLOSSARY DISCLOSURE REGARDING FORWARD-LOOKING STATEMENTS 25 CR6: IRB - Credit risk exposures by portfolio and PD ranges (Continued) A-IRB As at 31 March 2025 $m PD scale Original on-balance sheet gross exposure Off-balance sheet exposure pre CCF Average CCF (%) EAD post CRM and post-CCF Average PD (%) Number of borrowers Average LGD (%) Average maturity (years) RWA RWA density (%)a EL Provisions RBNZ Regulated Entities - Non retail 0.00 to <0.15 6,127 3,060 100% 9,191 0.04% 3,299 47% 2.3 1,752 19% 64 0.15 to <0.25 2,290 1,760 102% 3,897 0.18% 202 37% 2.2 1,366 35% 3 0.25 to <0.50 5,377 2,168 97% 7,246 0.38% 12,325 35% 2.3 3,359 46% 9 0.50 to <0.75 - - - - - - - - - - - 0.75 to <2.50 9,254 1,972 98% 11,030 1.43% 44,139 32% 2.2 8,021 73% 52 2.50 to <10.00 685 65 101% 743 4.74% 2,826 30% 2.2 686 92% 11 10.00 to <100.00 1,034 134 102% 1,160 24.23% 8,385 36% 1.9 2,201 190% 102 100.00 (Default) 286 20 100% 301 100% 502 34% 1.7 666 221% 57 Total RBNZ Regulated Entities - Non retail 25,053 9,179 99% 33,568 2.42% 71,678 37% 2.2 18,051 54% 298 216 Residential Mortgages 0.00 to <0.15 141,001 51,610 98% 191,366 0.08% 572,736 13% 11,596 6% 19 0.15 to <0.25 62,495 5,895 76% 66,999 0.19% 169,294 14% 6,221 9% 18 0.25 to <0.50 134,006 7,727 91% 141,026 0.33% 351,555 15% 20,806 15% 70 0.50 to <0.75 92,023 576 101% 92,603 0.64% 228,667 16% 22,859 25% 94 0.75 to <2.50 28,880 810 83% 29,551 1.18% 73,926 16% 11,091 38% 57 2.50 to <10.00 22,961 1,138 49% 23,523 7.84% 67,365 15% 24,983 106% 284 10.00 to <100.00 7,898 18 106% 7,917 22.12% 20,731 16% 10,929 138% 282 100.00 (Default) 5,294 32 - 5,294 100% 12,739 20% 8,469 160% 472 Total Residential Mortgages 494,558 67,806 94% 558,279 1.89% 1,497,013 15% 116,954 21% 1,296 1,352 Qualifying Revolving Retail 0.00 to <0.15 2,051 8,440 52% 6,455 0.09% 1,015,664 82% 328 5% 5 0.15 to <0.25 804 2,006 55% 1,917 0.21% 242,795 85% 196 10% 3 0.25 to <0.50 704 1,295 56% 1,425 0.40% 158,000 85% 250 18% 5 0.50 to <0.75 481 517 53% 756 0.74% 90,807 86% 216 29% 5 0.75 to <2.50 998 668 65% 1,433 1.46% 164,299 85% 673 47% 18 2.50 to <10.00 696 366 54% 895 3.59% 98,663 84% 793 89% 27 10.00 to <100.00 307 141 46% 373 17.21% 45,563 81% 809 217% 51 100.00 (Default) 77 23 - 77 100% 9,599 75% 258 335% 39 Total Qualifying Revolving Retail 6,118 13,456 54% 13,331 1.62% 1,825,390 83% 3,523 26% 153 192 |
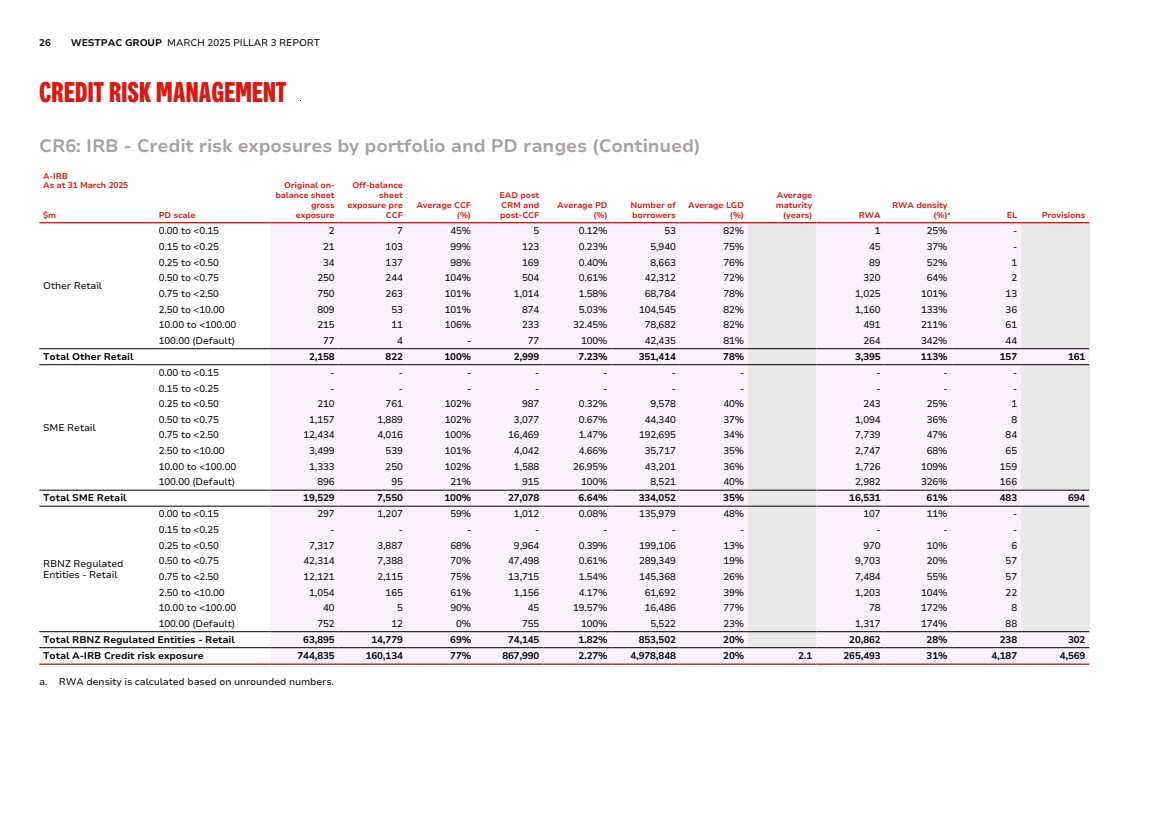
| 26 WESTPAC GROUP MARCH 2025 PILLAR 3 REPORT CREDIT RISK MANAGEMENT CR6: IRB - Credit risk exposures by portfolio and PD ranges (Continued) A-IRB As at 31 March 2025 $m PD scale Original on-balance sheet gross exposure Off-balance sheet exposure pre CCF Average CCF (%) EAD post CRM and post-CCF Average PD (%) Number of borrowers Average LGD (%) Average maturity (years) RWA RWA density (%)a EL Provisions Other Retail 0.00 to <0.15 2 7 45% 5 0.12% 53 82% 1 25% - 0.15 to <0.25 21 103 99% 123 0.23% 5,940 75% 45 37% - 0.25 to <0.50 34 137 98% 169 0.40% 8,663 76% 89 52% 1 0.50 to <0.75 250 244 104% 504 0.61% 42,312 72% 320 64% 2 0.75 to <2.50 750 263 101% 1,014 1.58% 68,784 78% 1,025 101% 13 2.50 to <10.00 809 53 101% 874 5.03% 104,545 82% 1,160 133% 36 10.00 to <100.00 215 11 106% 233 32.45% 78,682 82% 491 211% 61 100.00 (Default) 77 4 - 77 100% 42,435 81% 264 342% 44 Total Other Retail 2,158 822 100% 2,999 7.23% 351,414 78% 3,395 113% 157 161 SME Retail 0.00 to <0.15 - - - - - - - - - - 0.15 to <0.25 - - - - - - - - - - 0.25 to <0.50 210 761 102% 987 0.32% 9,578 40% 243 25% 1 0.50 to <0.75 1,157 1,889 102% 3,077 0.67% 44,340 37% 1,094 36% 8 0.75 to <2.50 12,434 4,016 100% 16,469 1.47% 192,695 34% 7,739 47% 84 2.50 to <10.00 3,499 539 101% 4,042 4.66% 35,717 35% 2,747 68% 65 10.00 to <100.00 1,333 250 102% 1,588 26.95% 43,201 36% 1,726 109% 159 100.00 (Default) 896 95 21% 915 100% 8,521 40% 2,982 326% 166 Total SME Retail 19,529 7,550 100% 27,078 6.64% 334,052 35% 16,531 61% 483 694 RBNZ Regulated Entities - Retail 0.00 to <0.15 297 1,207 59% 1,012 0.08% 135,979 48% 107 11% - 0.15 to <0.25 - - - - - - - - - - 0.25 to <0.50 7,317 3,887 68% 9,964 0.39% 199,106 13% 970 10% 6 0.50 to <0.75 42,314 7,388 70% 47,498 0.61% 289,349 19% 9,703 20% 57 0.75 to <2.50 12,121 2,115 75% 13,715 1.54% 145,368 26% 7,484 55% 57 2.50 to <10.00 1,054 165 61% 1,156 4.17% 61,692 39% 1,203 104% 22 10.00 to <100.00 40 5 90% 45 19.57% 16,486 77% 78 172% 8 100.00 (Default) 752 12 0% 755 100% 5,522 23% 1,317 174% 88 Total RBNZ Regulated Entities - Retail 63,895 14,779 69% 74,145 1.82% 853,502 20% 20,862 28% 238 302 Total A-IRB Credit risk exposure 744,835 160,134 77% 867,990 2.27% 4,978,848 20% 2.1 265,493 31% 4,187 4,569 a. RWA density is calculated based on unrounded numbers. |
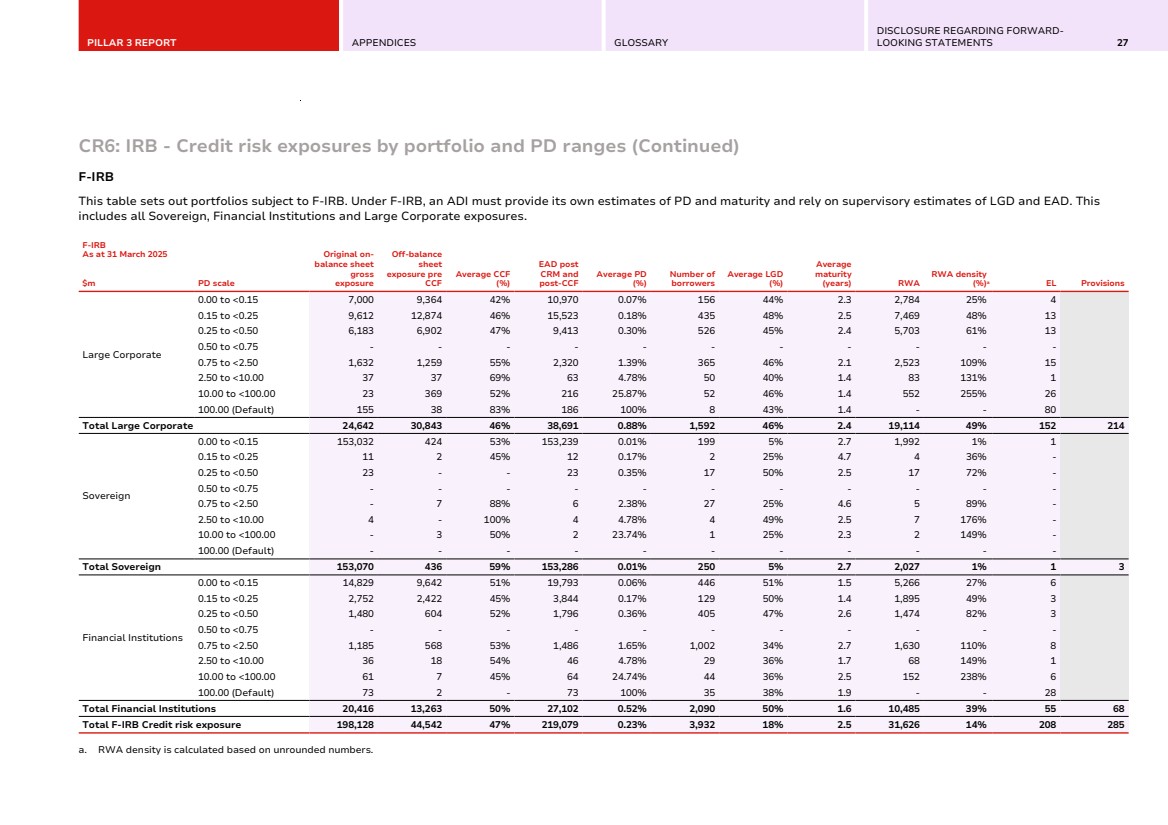
| PILLAR 3 REPORT APPENDICES GLOSSARY DISCLOSURE REGARDING FORWARD-LOOKING STATEMENTS 27 CR6: IRB - Credit risk exposures by portfolio and PD ranges (Continued) F-IRB This table sets out portfolios subject to F-IRB. Under F-IRB, an ADI must provide its own estimates of PD and maturity and rely on supervisory estimates of LGD and EAD. This includes all Sovereign, Financial Institutions and Large Corporate exposures. F-IRB As at 31 March 2025 $m PD scale Original on-balance sheet gross exposure Off-balance sheet exposure pre CCF Average CCF (%) EAD post CRM and post-CCF Average PD (%) Number of borrowers Average LGD (%) Average maturity (years) RWA RWA density (%)a EL Provisions Large Corporate 0.00 to <0.15 7,000 9,364 42% 10,970 0.07% 156 44% 2.3 2,784 25% 4 0.15 to <0.25 9,612 12,874 46% 15,523 0.18% 435 48% 2.5 7,469 48% 13 0.25 to <0.50 6,183 6,902 47% 9,413 0.30% 526 45% 2.4 5,703 61% 13 0.50 to <0.75 - - - - - - - - - - - 0.75 to <2.50 1,632 1,259 55% 2,320 1.39% 365 46% 2.1 2,523 109% 15 2.50 to <10.00 37 37 69% 63 4.78% 50 40% 1.4 83 131% 1 10.00 to <100.00 23 369 52% 216 25.87% 52 46% 1.4 552 255% 26 100.00 (Default) 155 38 83% 186 100% 8 43% 1.4 - - 80 Total Large Corporate 24,642 30,843 46% 38,691 0.88% 1,592 46% 2.4 19,114 49% 152 214 Sovereign 0.00 to <0.15 153,032 424 53% 153,239 0.01% 199 5% 2.7 1,992 1% 1 0.15 to <0.25 11 2 45% 12 0.17% 2 25% 4.7 4 36% - 0.25 to <0.50 23 - - 23 0.35% 17 50% 2.5 17 72% - 0.50 to <0.75 - - - - - - - - - - - 0.75 to <2.50 - 7 88% 6 2.38% 27 25% 4.6 5 89% - 2.50 to <10.00 4 - 100% 4 4.78% 4 49% 2.5 7 176% - 10.00 to <100.00 - 3 50% 2 23.74% 1 25% 2.3 2 149% - 100.00 (Default) - - - - - - - - - - - Total Sovereign 153,070 436 59% 153,286 0.01% 250 5% 2.7 2,027 1% 1 3 Financial Institutions 0.00 to <0.15 14,829 9,642 51% 19,793 0.06% 446 51% 1.5 5,266 27% 6 0.15 to <0.25 2,752 2,422 45% 3,844 0.17% 129 50% 1.4 1,895 49% 3 0.25 to <0.50 1,480 604 52% 1,796 0.36% 405 47% 2.6 1,474 82% 3 0.50 to <0.75 - - - - - - - - - - - 0.75 to <2.50 1,185 568 53% 1,486 1.65% 1,002 34% 2.7 1,630 110% 8 2.50 to <10.00 36 18 54% 46 4.78% 29 36% 1.7 68 149% 1 10.00 to <100.00 61 7 45% 64 24.74% 44 36% 2.5 152 238% 6 100.00 (Default) 73 2 - 73 100% 35 38% 1.9 - - 28 Total Financial Institutions 20,416 13,263 50% 27,102 0.52% 2,090 50% 1.6 10,485 39% 55 68 Total F-IRB Credit risk exposure 198,128 44,542 47% 219,079 0.23% 3,932 18% 2.5 31,626 14% 208 285 a. RWA density is calculated based on unrounded numbers. |
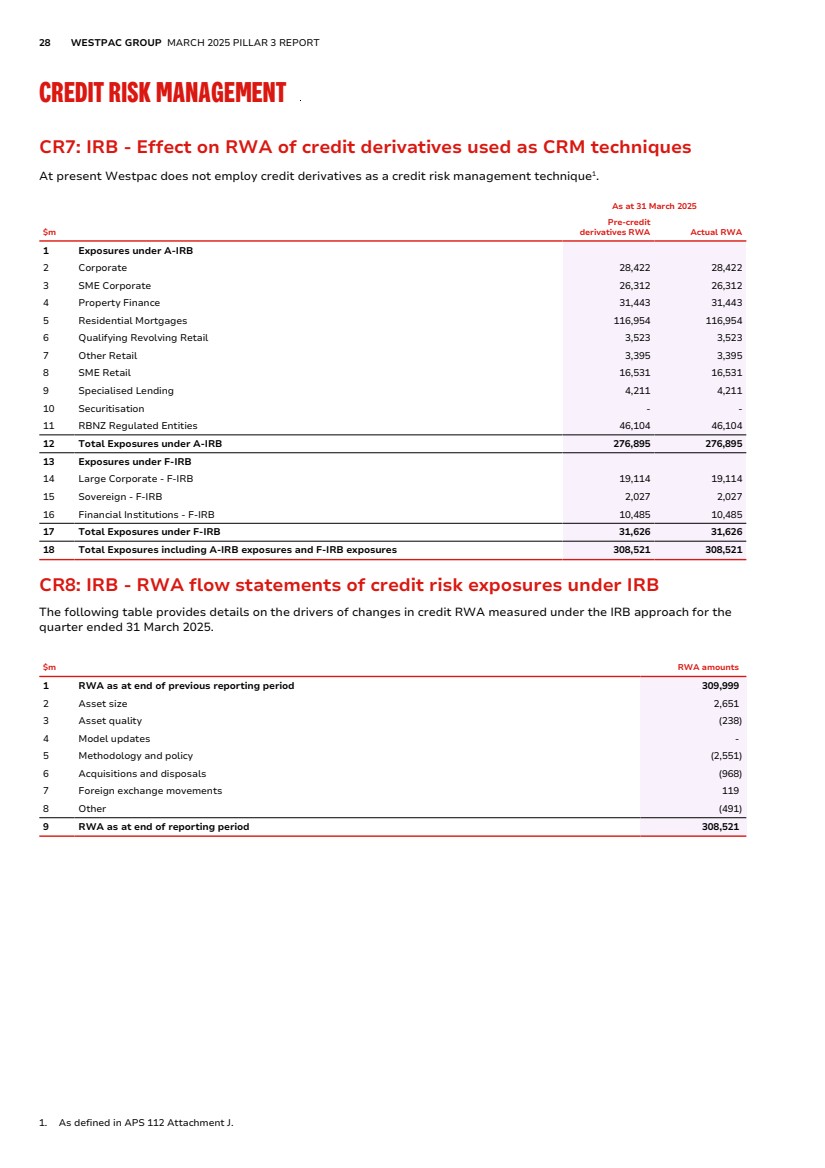
| 28 WESTPAC GROUP MARCH 2025 PILLAR 3 REPORT CREDIT RISK MANAGEMENT CR7: IRB - Effect on RWA of credit derivatives used as CRM techniques At present Westpac does not employ credit derivatives as a credit risk management technique1 . $m As at 31 March 2025 Pre-credit derivatives RWA Actual RWA 1 Exposures under A-IRB 2 Corporate 28,422 28,422 3 SME Corporate 26,312 26,312 4 Property Finance 31,443 31,443 5 Residential Mortgages 116,954 116,954 6 Qualifying Revolving Retail 3,523 3,523 7 Other Retail 3,395 3,395 8 SME Retail 16,531 16,531 9 Specialised Lending 4,211 4,211 10 Securitisation - - 11 RBNZ Regulated Entities 46,104 46,104 12 Total Exposures under A-IRB 276,895 276,895 13 Exposures under F-IRB 14 Large Corporate - F-IRB 19,114 19,114 15 Sovereign - F-IRB 2,027 2,027 16 Financial Institutions - F-IRB 10,485 10,485 17 Total Exposures under F-IRB 31,626 31,626 18 Total Exposures including A-IRB exposures and F-IRB exposures 308,521 308,521 CR8: IRB - RWA flow statements of credit risk exposures under IRB The following table provides details on the drivers of changes in credit RWA measured under the IRB approach for the quarter ended 31 March 2025. $m RWA amounts 1 RWA as at end of previous reporting period 309,999 2 Asset size 2,651 3 Asset quality (238) 4 Model updates - 5 Methodology and policy (2,551) 6 Acquisitions and disposals (968) 7 Foreign exchange movements 119 8 Other (491) 9 RWA as at end of reporting period 308,521 1. As defined in APS 112 Attachment J. |
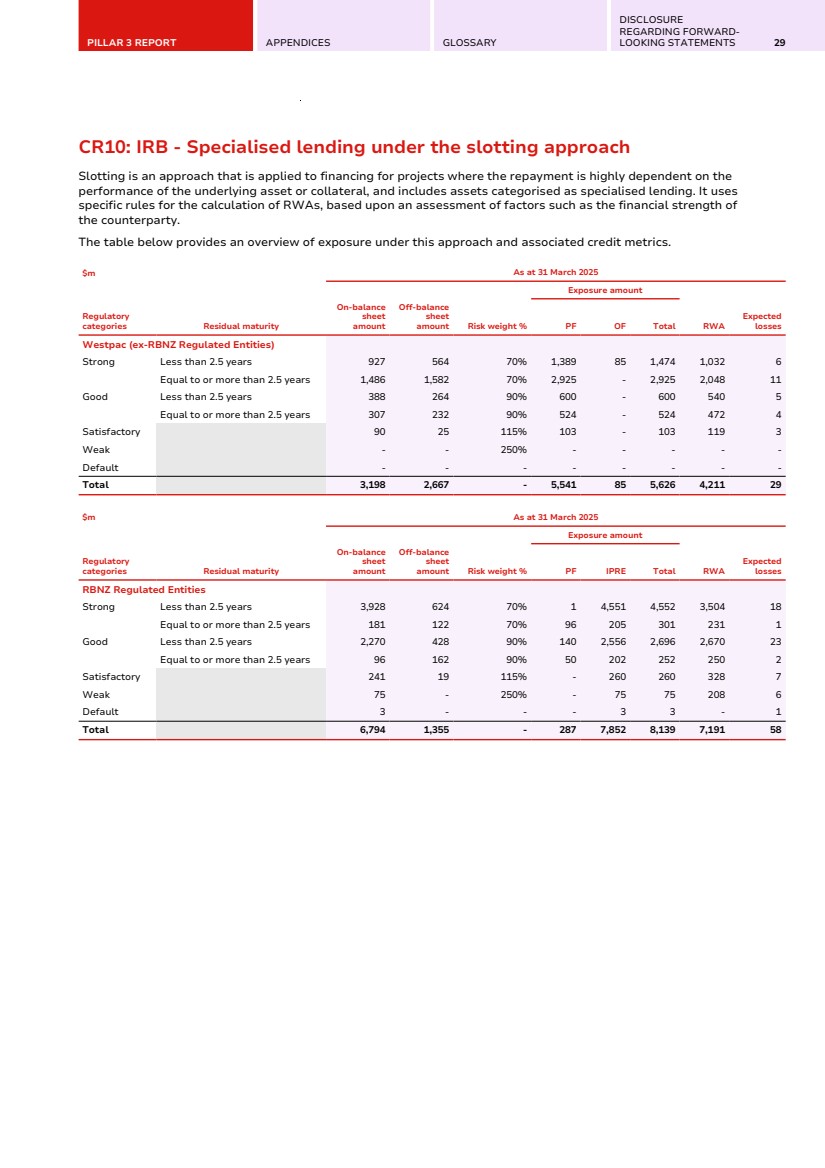
| PILLAR 3 REPORT APPENDICES GLOSSARY DISCLOSURE REGARDING FORWARD-LOOKING STATEMENTS 29 CR10: IRB - Specialised lending under the slotting approach Slotting is an approach that is applied to financing for projects where the repayment is highly dependent on the performance of the underlying asset or collateral, and includes assets categorised as specialised lending. It uses specific rules for the calculation of RWAs, based upon an assessment of factors such as the financial strength of the counterparty. The table below provides an overview of exposure under this approach and associated credit metrics. $m As at 31 March 2025 Regulatory categories Residual maturity Exposure amount On-balance sheet amount Off-balance sheet amount Risk weight % PF OF Total RWA Expected losses Westpac (ex-RBNZ Regulated Entities) Strong Less than 2.5 years 927 564 70% 1,389 85 1,474 1,032 6 Equal to or more than 2.5 years 1,486 1,582 70% 2,925 - 2,925 2,048 11 Good Less than 2.5 years 388 264 90% 600 - 600 540 5 Equal to or more than 2.5 years 307 232 90% 524 - 524 472 4 Satisfactory 90 25 115% 103 - 103 119 3 Weak - - 250% - - - - - Default - - - - - - - - Total 3,198 2,667 - 5,541 85 5,626 4,211 29 $m As at 31 March 2025 Regulatory categories Residual maturity Exposure amount On-balance sheet amount Off-balance sheet amount Risk weight % PF IPRE Total RWA Expected losses RBNZ Regulated Entities Strong Less than 2.5 years 3,928 624 70% 1 4,551 4,552 3,504 18 Equal to or more than 2.5 years 181 122 70% 96 205 301 231 1 Good Less than 2.5 years 2,270 428 90% 140 2,556 2,696 2,670 23 Equal to or more than 2.5 years 96 162 90% 50 202 252 250 2 Satisfactory 241 19 115% - 260 260 328 7 Weak 75 - 250% - 75 75 208 6 Default 3 - - - 3 3 - 1 Total 6,794 1,355 - 287 7,852 8,139 7,191 58 |
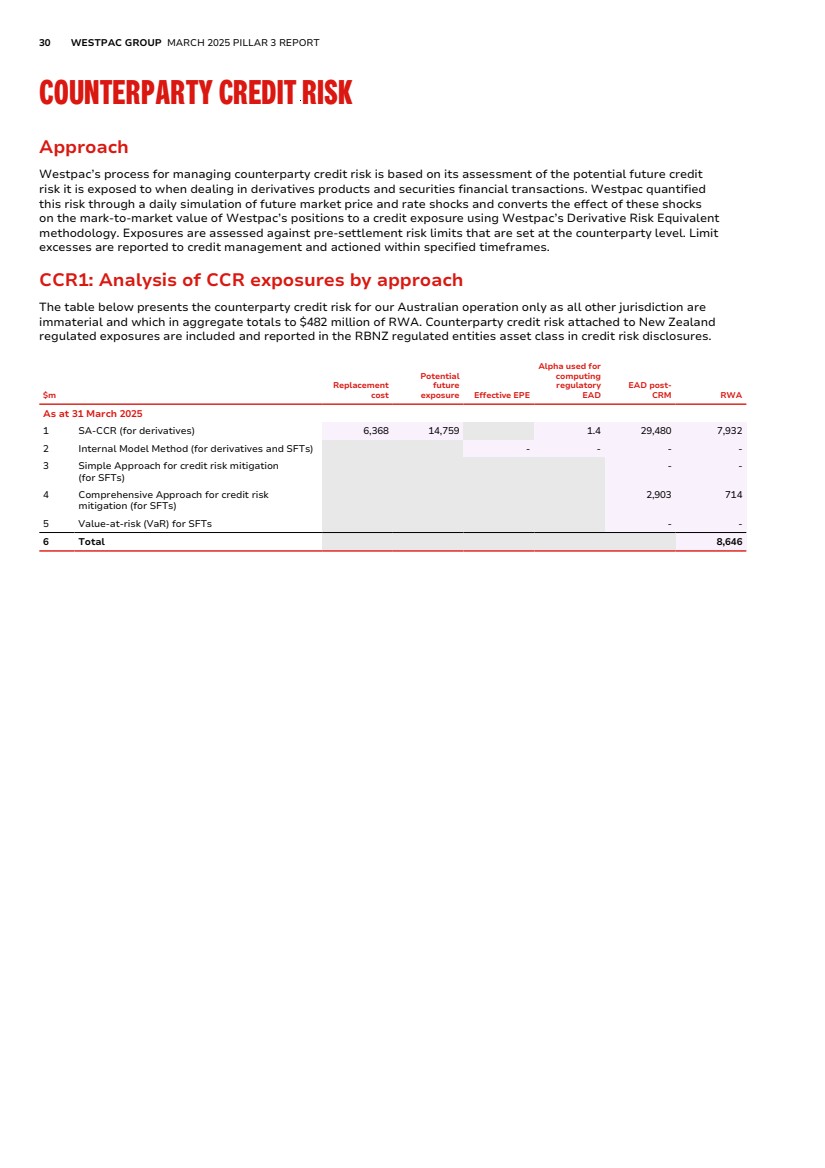
| 30 WESTPAC GROUP MARCH 2025 PILLAR 3 REPORT COUNTERPARTY CREDIT RISK Approach Westpac’s process for managing counterparty credit risk is based on its assessment of the potential future credit risk it is exposed to when dealing in derivatives products and securities financial transactions. Westpac quantified this risk through a daily simulation of future market price and rate shocks and converts the effect of these shocks on the mark-to-market value of Westpac’s positions to a credit exposure using Westpac’s Derivative Risk Equivalent methodology. Exposures are assessed against pre-settlement risk limits that are set at the counterparty level. Limit excesses are reported to credit management and actioned within specified timeframes. CCR1: Analysis of CCR exposures by approach The table below presents the counterparty credit risk for our Australian operation only as all other jurisdiction are immaterial and which in aggregate totals to $482 million of RWA. Counterparty credit risk attached to New Zealand regulated exposures are included and reported in the RBNZ regulated entities asset class in credit risk disclosures. $m Replacement cost Potential future exposure Effective EPE Alpha used for computing regulatory EAD EAD post-CRM RWA As at 31 March 2025 1 SA-CCR (for derivatives) 6,368 14,759 1.4 29,480 7,932 2 Internal Model Method (for derivatives and SFTs) - - - - 3 Simple Approach for credit risk mitigation (for SFTs) - - 4 Comprehensive Approach for credit risk mitigation (for SFTs) 2,903 714 5 Value-at-risk (VaR) for SFTs - - 6 Total 8,646 |
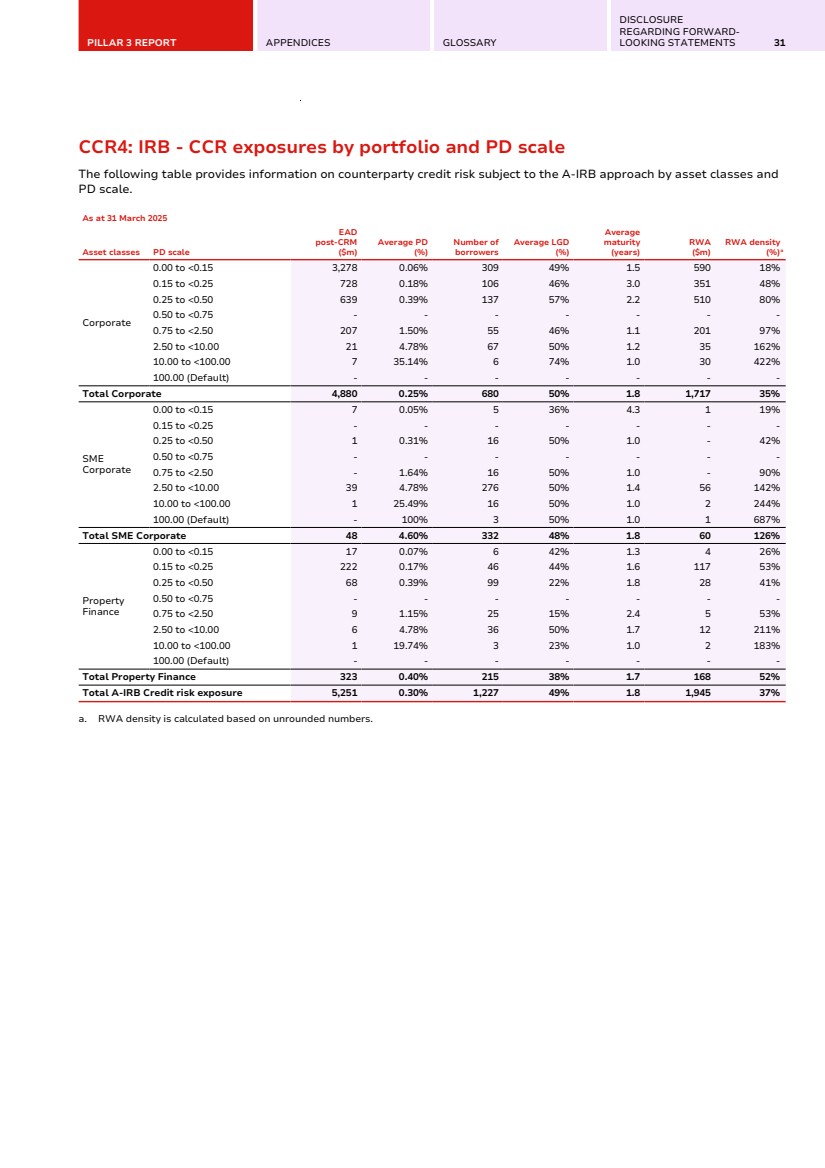
| PILLAR 3 REPORT APPENDICES GLOSSARY DISCLOSURE REGARDING FORWARD-LOOKING STATEMENTS 31 CCR4: IRB - CCR exposures by portfolio and PD scale The following table provides information on counterparty credit risk subject to the A-IRB approach by asset classes and PD scale. As at 31 March 2025 Asset classes PD scale EAD post-CRM ($m) Average PD (%) Number of borrowers Average LGD (%) Average maturity (years) RWA ($m) RWA density (%)a Corporate 0.00 to <0.15 3,278 0.06% 309 49% 1.5 590 18% 0.15 to <0.25 728 0.18% 106 46% 3.0 351 48% 0.25 to <0.50 639 0.39% 137 57% 2.2 510 80% 0.50 to <0.75 - - - - - - - 0.75 to <2.50 207 1.50% 55 46% 1.1 201 97% 2.50 to <10.00 21 4.78% 67 50% 1.2 35 162% 10.00 to <100.00 7 35.14% 6 74% 1.0 30 422% 100.00 (Default) - - - - - - - Total Corporate 4,880 0.25% 680 50% 1.8 1,717 35% SME Corporate 0.00 to <0.15 7 0.05% 5 36% 4.3 1 19% 0.15 to <0.25 - - - - - - - 0.25 to <0.50 1 0.31% 16 50% 1.0 - 42% 0.50 to <0.75 - - - - - - - 0.75 to <2.50 - 1.64% 16 50% 1.0 - 90% 2.50 to <10.00 39 4.78% 276 50% 1.4 56 142% 10.00 to <100.00 1 25.49% 16 50% 1.0 2 244% 100.00 (Default) - 100% 3 50% 1.0 1 687% Total SME Corporate 48 4.60% 332 48% 1.8 60 126% Property Finance 0.00 to <0.15 17 0.07% 6 42% 1.3 4 26% 0.15 to <0.25 222 0.17% 46 44% 1.6 117 53% 0.25 to <0.50 68 0.39% 99 22% 1.8 28 41% 0.50 to <0.75 - - - - - - - 0.75 to <2.50 9 1.15% 25 15% 2.4 5 53% 2.50 to <10.00 6 4.78% 36 50% 1.7 12 211% 10.00 to <100.00 1 19.74% 3 23% 1.0 2 183% 100.00 (Default) - - - - - - - Total Property Finance 323 0.40% 215 38% 1.7 168 52% Total A-IRB Credit risk exposure 5,251 0.30% 1,227 49% 1.8 1,945 37% a. RWA density is calculated based on unrounded numbers. |
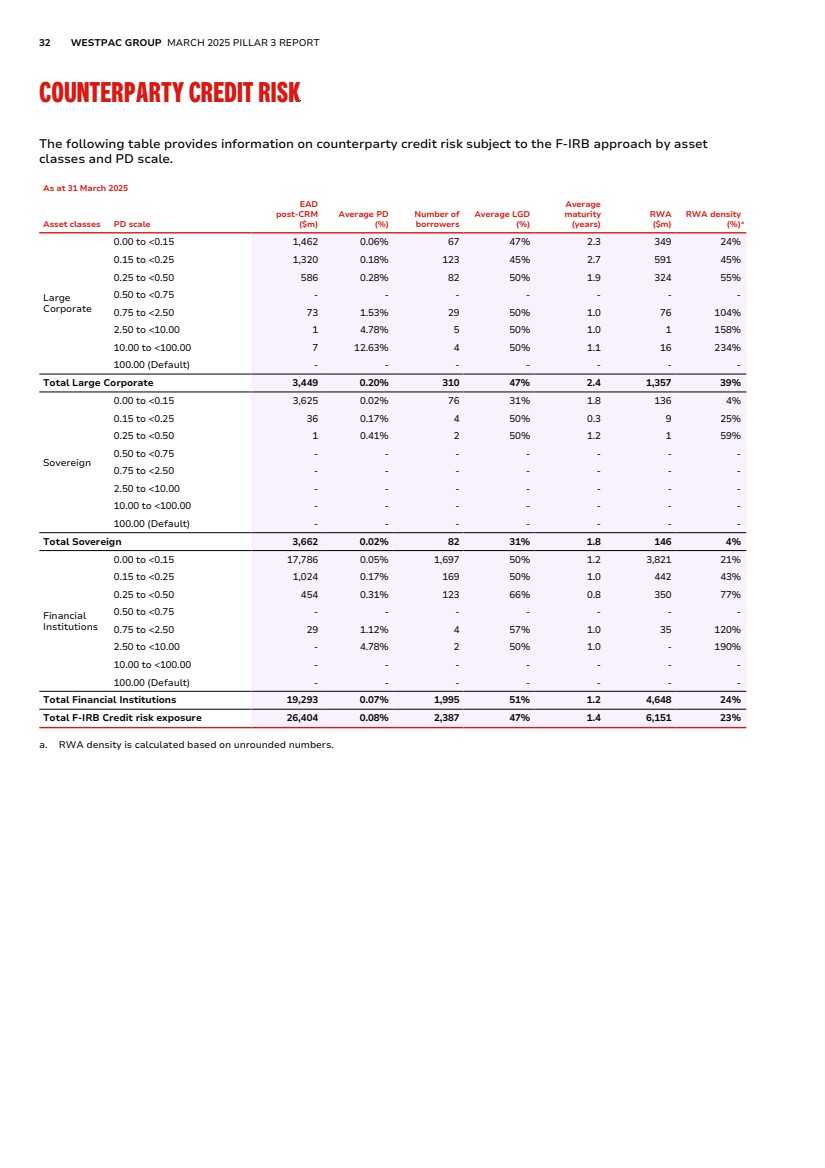
| 32 WESTPAC GROUP MARCH 2025 PILLAR 3 REPORT COUNTERPARTY CREDIT RISK The following table provides information on counterparty credit risk subject to the F-IRB approach by asset classes and PD scale. As at 31 March 2025 Asset classes PD scale EAD post-CRM ($m) Average PD (%) Number of borrowers Average LGD (%) Average maturity (years) RWA ($m) RWA density (%)a Large Corporate 0.00 to <0.15 1,462 0.06% 67 47% 2.3 349 24% 0.15 to <0.25 1,320 0.18% 123 45% 2.7 591 45% 0.25 to <0.50 586 0.28% 82 50% 1.9 324 55% 0.50 to <0.75 - - - - - - - 0.75 to <2.50 73 1.53% 29 50% 1.0 76 104% 2.50 to <10.00 1 4.78% 5 50% 1.0 1 158% 10.00 to <100.00 7 12.63% 4 50% 1.1 16 234% 100.00 (Default) - - - - - - - Total Large Corporate 3,449 0.20% 310 47% 2.4 1,357 39% Sovereign 0.00 to <0.15 3,625 0.02% 76 31% 1.8 136 4% 0.15 to <0.25 36 0.17% 4 50% 0.3 9 25% 0.25 to <0.50 1 0.41% 2 50% 1.2 1 59% 0.50 to <0.75 - - - - - - - 0.75 to <2.50 - - - - - - - 2.50 to <10.00 - - - - - - - 10.00 to <100.00 - - - - - - - 100.00 (Default) - - - - - - - Total Sovereign 3,662 0.02% 82 31% 1.8 146 4% Financial Institutions 0.00 to <0.15 17,786 0.05% 1,697 50% 1.2 3,821 21% 0.15 to <0.25 1,024 0.17% 169 50% 1.0 442 43% 0.25 to <0.50 454 0.31% 123 66% 0.8 350 77% 0.50 to <0.75 - - - - - - - 0.75 to <2.50 29 1.12% 4 57% 1.0 35 120% 2.50 to <10.00 - 4.78% 2 50% 1.0 - 190% 10.00 to <100.00 - - - - - - - 100.00 (Default) - - - - - - - Total Financial Institutions 19,293 0.07% 1,995 51% 1.2 4,648 24% Total F-IRB Credit risk exposure 26,404 0.08% 2,387 47% 1.4 6,151 23% a. RWA density is calculated based on unrounded numbers. |
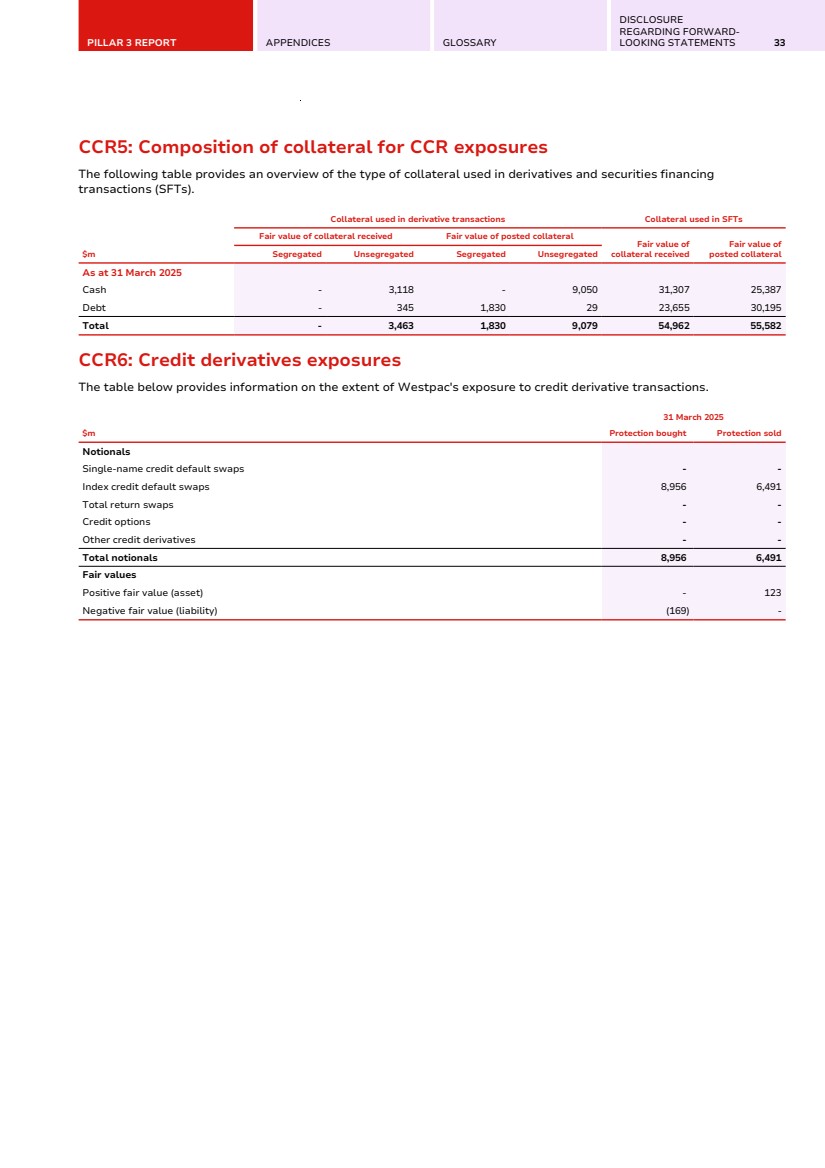
| PILLAR 3 REPORT APPENDICES GLOSSARY DISCLOSURE REGARDING FORWARD-LOOKING STATEMENTS 33 CCR5: Composition of collateral for CCR exposures The following table provides an overview of the type of collateral used in derivatives and securities financing transactions (SFTs). $m Collateral used in derivative transactions Collateral used in SFTs Fair value of collateral received Fair value of posted collateral Fair value of collateral received Fair value of Segregated Unsegregated Segregated Unsegregated posted collateral As at 31 March 2025 Cash - 3,118 - 9,050 31,307 25,387 Debt - 345 1,830 29 23,655 30,195 Total - 3,463 1,830 9,079 54,962 55,582 CCR6: Credit derivatives exposures The table below provides information on the extent of Westpac's exposure to credit derivative transactions. $m 31 March 2025 Protection bought Protection sold Notionals Single-name credit default swaps - - Index credit default swaps 8,956 6,491 Total return swaps - - Credit options - - Other credit derivatives - - Total notionals 8,956 6,491 Fair values Positive fair value (asset) - 123 Negative fair value (liability) (169) - |
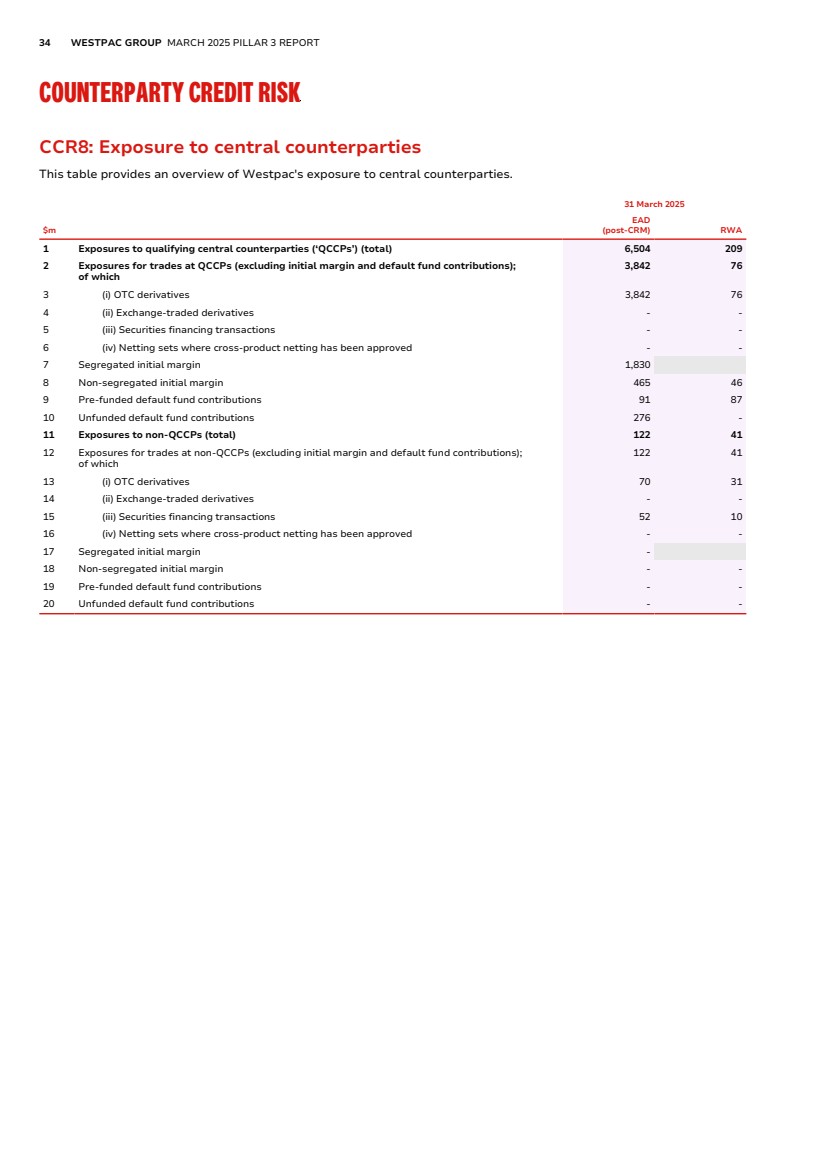
| 34 WESTPAC GROUP MARCH 2025 PILLAR 3 REPORT COUNTERPARTY CREDIT RISK CCR8: Exposure to central counterparties This table provides an overview of Westpac's exposure to central counterparties. $m 31 March 2025 EAD (post-CRM) RWA 1 Exposures to qualifying central counterparties (‘QCCPs’) (total) 6,504 209 2 Exposures for trades at QCCPs (excluding initial margin and default fund contributions); of which 3,842 76 3 (i) OTC derivatives 3,842 76 4 (ii) Exchange-traded derivatives - - 5 (iii) Securities financing transactions - - 6 (iv) Netting sets where cross-product netting has been approved - - 7 Segregated initial margin 1,830 8 Non-segregated initial margin 465 46 9 Pre-funded default fund contributions 91 87 10 Unfunded default fund contributions 276 - 11 Exposures to non-QCCPs (total) 122 41 12 Exposures for trades at non-QCCPs (excluding initial margin and default fund contributions); of which 122 41 13 (i) OTC derivatives 70 31 14 (ii) Exchange-traded derivatives - - 15 (iii) Securities financing transactions 52 10 16 (iv) Netting sets where cross-product netting has been approved - - 17 Segregated initial margin - 18 Non-segregated initial margin - - 19 Pre-funded default fund contributions - - 20 Unfunded default fund contributions - - |
| PILLAR 3 REPORT APPENDICES GLOSSARY DISCLOSURE REGARDING FORWARD-LOOKING STATEMENTS 35 SECURITISATION A securitisation is a financial structure where the cash flow from a pool of assets is used to service obligations to at least two different tranches of classes of creditors (typically holders of debt securities), with each class or tranche reflecting a different degree of credit risk (i.e. one class of creditors is entitled to receive payments from the pool before another class of creditors). Securitisation transactions are generally grouped into two broad categories: • Traditional or true sale securitisations, which involve the transfer of ownership of the underlying asset pool to a third party; and • Synthetic transactions, where the ownership of the underlying asset pool remains with the originator and only the credit risk of the pool is transferred to a third party, using credit derivatives or guarantees. In line with current APRA requirements, Westpac does not currently undertake any synthetic securitisations. Approach Westpac’s securitisation activities range from a seller of its own assets, to an investor in third-party transactions and includes the arranging of transactions, the provision of securitisation services and the provision of funding for clients, including clients requiring access to capital markets. Securitisation activity follows Westpac’s credit policies and approval processes. The regulatory capital treatment of securitisation exposures is measured in accordance with APS 120 other than the securitisation exposures of an overseas banking subsidiary that is prudentially regulated by a prescribed authority. Outside of Australia, Westpac has securitisation exposures in Westpac New Zealand Limited. For these exposures, Westpac calculates risk-weighted assets using the Reserve Bank of New Zealand’s prudential rules. These exposures are separately included in the RBNZ Regulated Entities line item. Westpac makes deductions from CET1 capital that are required under APS 120. APS 120 also specifies that securitisation exposures held in the trading book1 are subject to the requirements of Prudential Standard APS 116 Capital Adequacy: Market Risk. Under APS 120 the approaches employed include the External Ratings Based Approach (ERBA) which is largely based on external credit ratings and the Supervisory Formula Approach (SFA) for unrated exposures. Westpac’s role in the securitisation process • Securitisation of Westpac originated assets Securitisation is used by Westpac to manage funding and liquidity and may also be used for capital management. It allows Westpac the ability to use a pool of assets to increase Westpac's wholesale funding capacity. Westpac may provide arm's length facilities and services to the securitisation vehicles. These typically include the provision of financing, redraw facilities and derivative contracts. Westpac has entered into self securitisation transactions for funding and liquidity purposes. These are the same as traditional securitisations, except that Westpac is the holder of all classes of notes issued (other than where senior notes have been pledged as eligible collateral with the RBA). These self securitisations do not change risk weighted assets. No securitisation transactions for Westpac originated assets are classified as re-securitisation exposure which are deemed to mean a securitisation exposure in which at least one of the underlying exposure in the pool is a securitisation exposure. • Provision of securitisation services, including funding and arranging assets backed bond issues Securitisation facilities provided by Westpac may include re-securitisation exposures. Westpac also buys and sells securitisation exposure in the secondary market to facilitate portfolio management activity by its institutional customers who hold asset backed bonds. 1. Trading book activity represents positions in financial instruments, including derivative products and other off-balance sheet instruments, that are held either with trading intent or to hedge other elements of the trading book. |
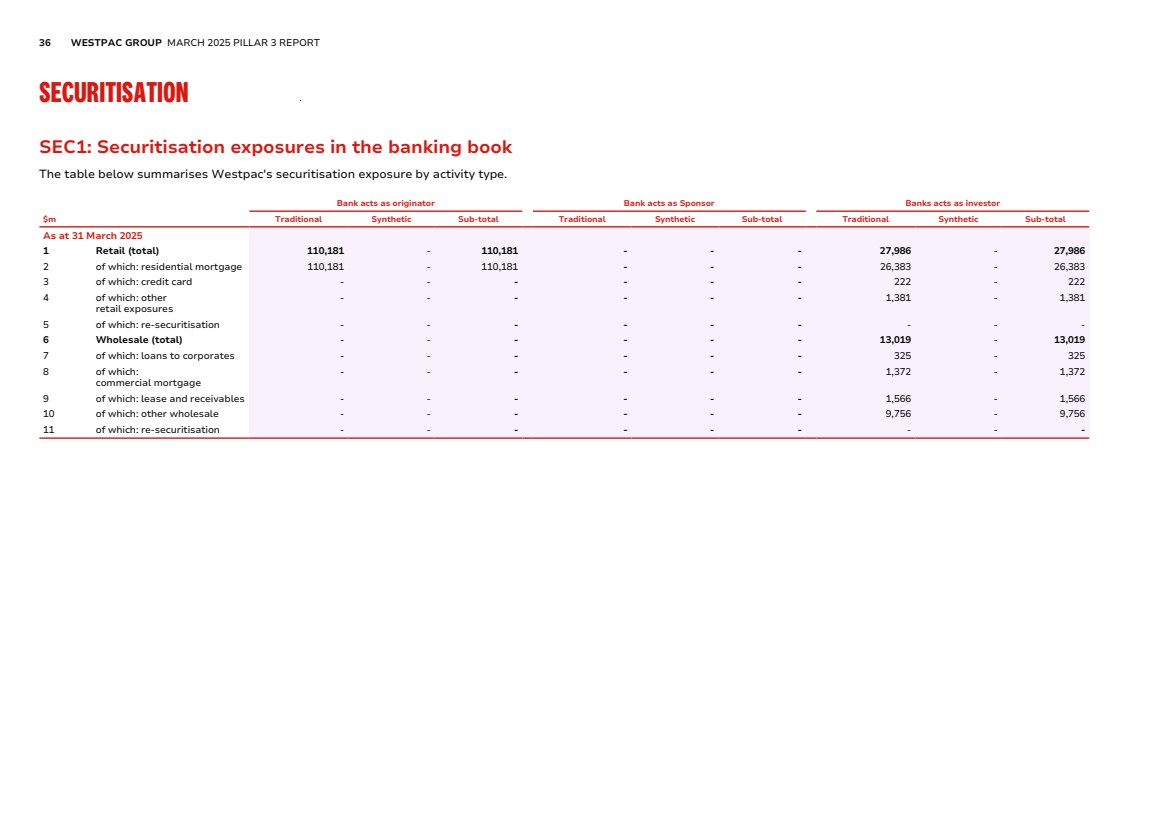
| 36 WESTPAC GROUP MARCH 2025 PILLAR 3 REPORT SECURITISATION SEC1: Securitisation exposures in the banking book The table below summarises Westpac's securitisation exposure by activity type. Bank acts as originator Bank acts as Sponsor Banks acts as investor $m Traditional Synthetic Sub-total Traditional Synthetic Sub-total Traditional Synthetic Sub-total As at 31 March 2025 1 Retail (total) 110,181 - 110,181 - - - 27,986 - 27,986 2 of which: residential mortgage 110,181 - 110,181 - - - 26,383 - 26,383 3 of which: credit card - - - - - - 222 - 222 4 of which: other retail exposures - - - - - - 1,381 - 1,381 5 of which: re-securitisation - - - - - - - - - 6 Wholesale (total) - - - - - - 13,019 - 13,019 7 of which: loans to corporates - - - - - - 325 - 325 8 of which: commercial mortgage - - - - - - 1,372 - 1,372 9 of which: lease and receivables - - - - - - 1,566 - 1,566 10 of which: other wholesale - - - - - - 9,756 - 9,756 11 of which: re-securitisation - - - - - - - - - |
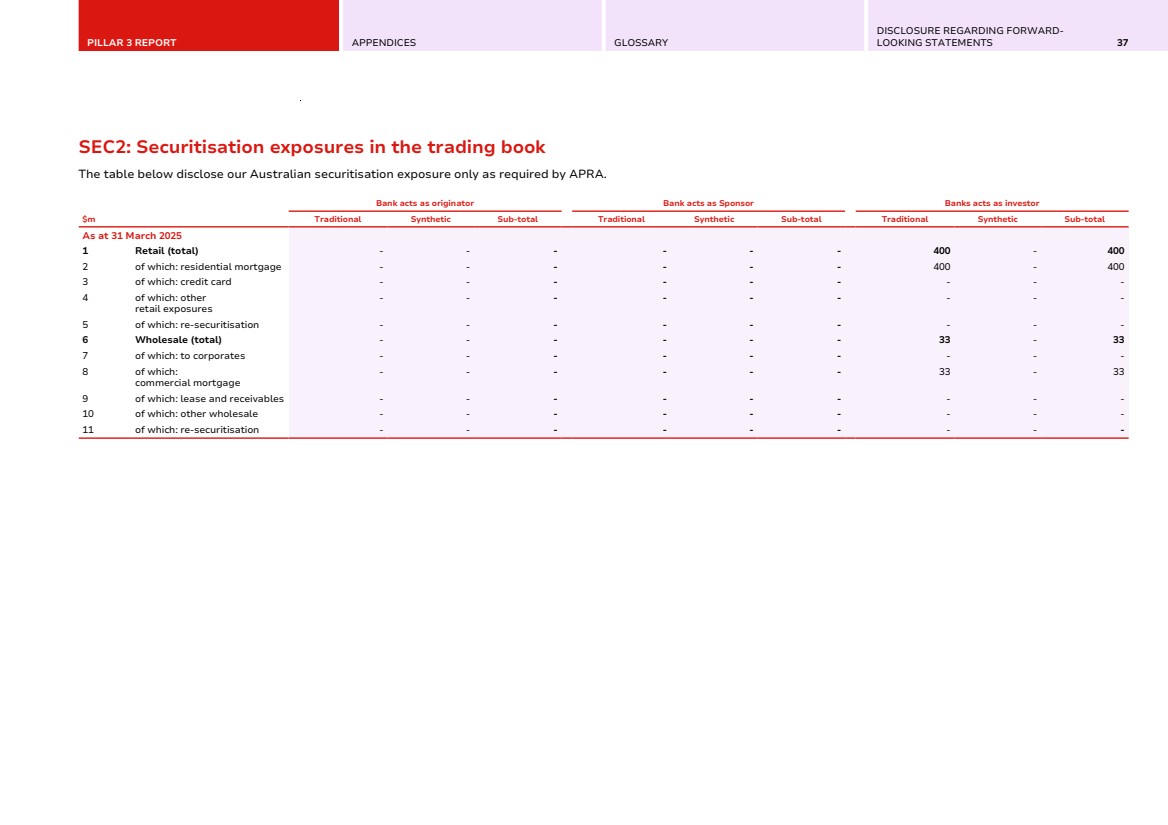
| PILLAR 3 REPORT APPENDICES GLOSSARY DISCLOSURE REGARDING FORWARD-LOOKING STATEMENTS 37 SEC2: Securitisation exposures in the trading book The table below disclose our Australian securitisation exposure only as required by APRA. Bank acts as originator Bank acts as Sponsor Banks acts as investor $m Traditional Synthetic Sub-total Traditional Synthetic Sub-total Traditional Synthetic Sub-total As at 31 March 2025 1 Retail (total) - - - - - - 400 - 400 2 of which: residential mortgage - - - - - - 400 - 400 3 of which: credit card - - - - - - - - - 4 of which: other retail exposures - - - - - - - - - 5 of which: re-securitisation - - - - - - - - - 6 Wholesale (total) - - - - - - 33 - 33 7 of which: to corporates - - - - - - - - - 8 of which: commercial mortgage - - - - - - 33 - 33 9 of which: lease and receivables - - - - - - - - - 10 of which: other wholesale - - - - - - - - - 11 of which: re-securitisation - - - - - - - - - |
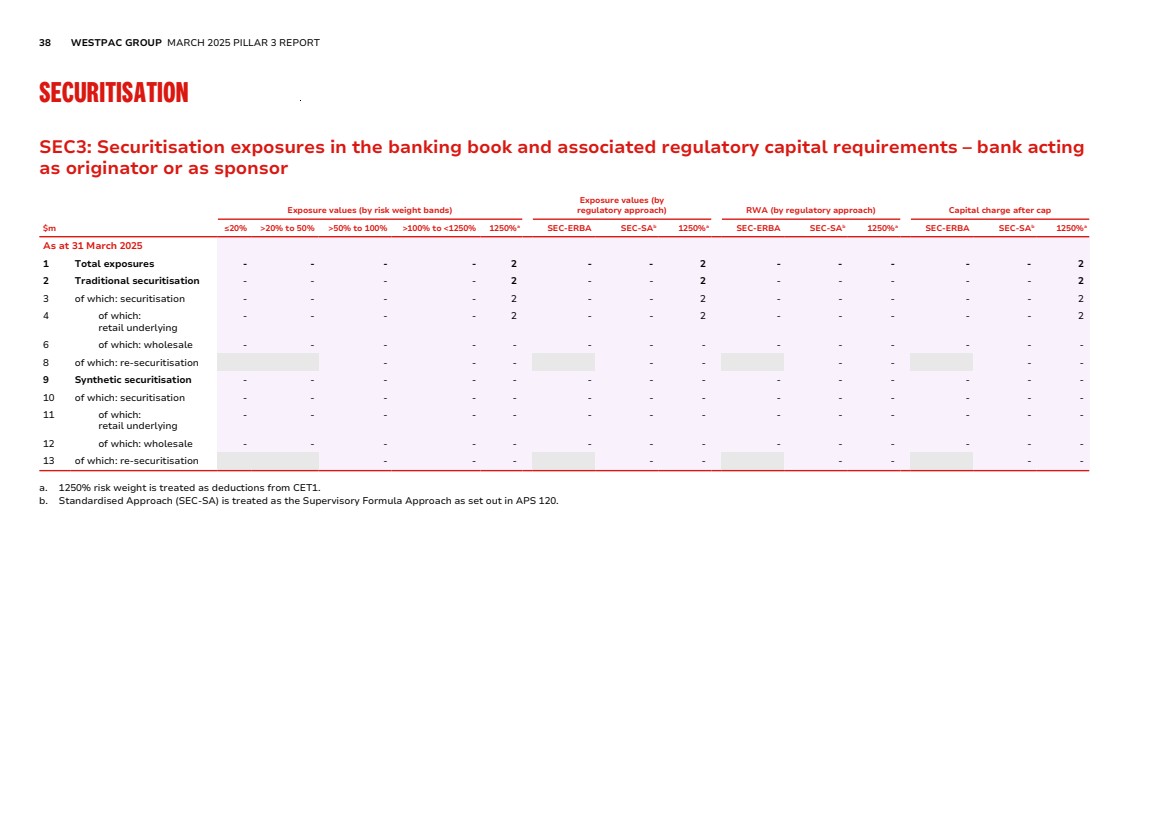
| 38 WESTPAC GROUP MARCH 2025 PILLAR 3 REPORT SECURITISATION SEC3: Securitisation exposures in the banking book and associated regulatory capital requirements – bank acting as originator or as sponsor Exposure values (by risk weight bands) Exposure values (by regulatory approach) RWA (by regulatory approach) Capital charge after cap $m ≤20% >20% to 50% >50% to 100% >100% to <1250% 1250%a SEC-ERBA SEC-SAb 1250%a SEC-ERBA SEC-SAb 1250%a SEC-ERBA SEC-SAb 1250%a As at 31 March 2025 1 Total exposures - - - - 2 - - 2 - - - - - 2 2 Traditional securitisation - - - - 2 - - 2 - - - - - 2 3 of which: securitisation - - - - 2 - - 2 - - - - - 2 4 of which: retail underlying - - - - 2 - - 2 - - - - - 2 6 of which: wholesale - - - - - - - - - - - - - - 8 of which: re-securitisation - - - - - - - - - 9 Synthetic securitisation - - - - - - - - - - - - - - 10 of which: securitisation - - - - - - - - - - - - - - 11 of which: retail underlying - - - - - - - - - - - - - - 12 of which: wholesale - - - - - - - - - - - - - - 13 of which: re-securitisation - - - - - - - - - a. 1250% risk weight is treated as deductions from CET1. b. Standardised Approach (SEC-SA) is treated as the Supervisory Formula Approach as set out in APS 120. |
| PILLAR 3 REPORT APPENDICES GLOSSARY DISCLOSURE REGARDING FORWARD-LOOKING STATEMENTS 39 SEC4: Securitisation exposures in the banking book and associated capital requirements – bank acting as investor Exposure values (by risk weight bands) Exposure values (by regulatory approach) RWA (by regulatory approach) Capital charge after cap $m ≤20% >20% to 50% >50% to 100% >100% to <1250% 1250%a SEC-ERBA SEC-SAb 1250%a SEC-ERBA SEC-SAb 1250%a SEC-ERBA SEC-SAb 1250%a As at 31 March 2025 1 Total exposures 34,873 5,794 330 7 - 16,189 24,816 - 3,421 4,419 - 274 353 - 2 Traditional securitisation 34,873 5,794 330 7 - 16,189 24,816 - 3,421 4,419 - 274 353 - 3 of which: securitisation 34,873 5,794 330 7 - 16,189 24,816 - 3,421 4,419 - 274 353 - 4 of which: retail underlying 27,060 780 143 2 - 12,245 15,741 - 2,516 2,575 - 202 206 - 6 of which: wholesale 7,813 5,014 187 5 - 3,944 9,075 - 905 1,844 - 72 147 - 8 of which: re-securitisation - - - - - - - - - 9 Synthetic securitisation - - - - - - - - - - - - - - 10 of which: securitisation - - - - - - - - - - - - - - 11 of which: retail underlying - - - - - - - - - - - - - - 12 of which: wholesale - - - - - - - - - - - - - - 13 of which: re-securitisation - - - - - - - - - a. 1250% risk weight is treated as deductions from CET1. b. Standardised Approach (SEC-SA) is treated as the Supervisory Formula Approach as set out in APS 120. |
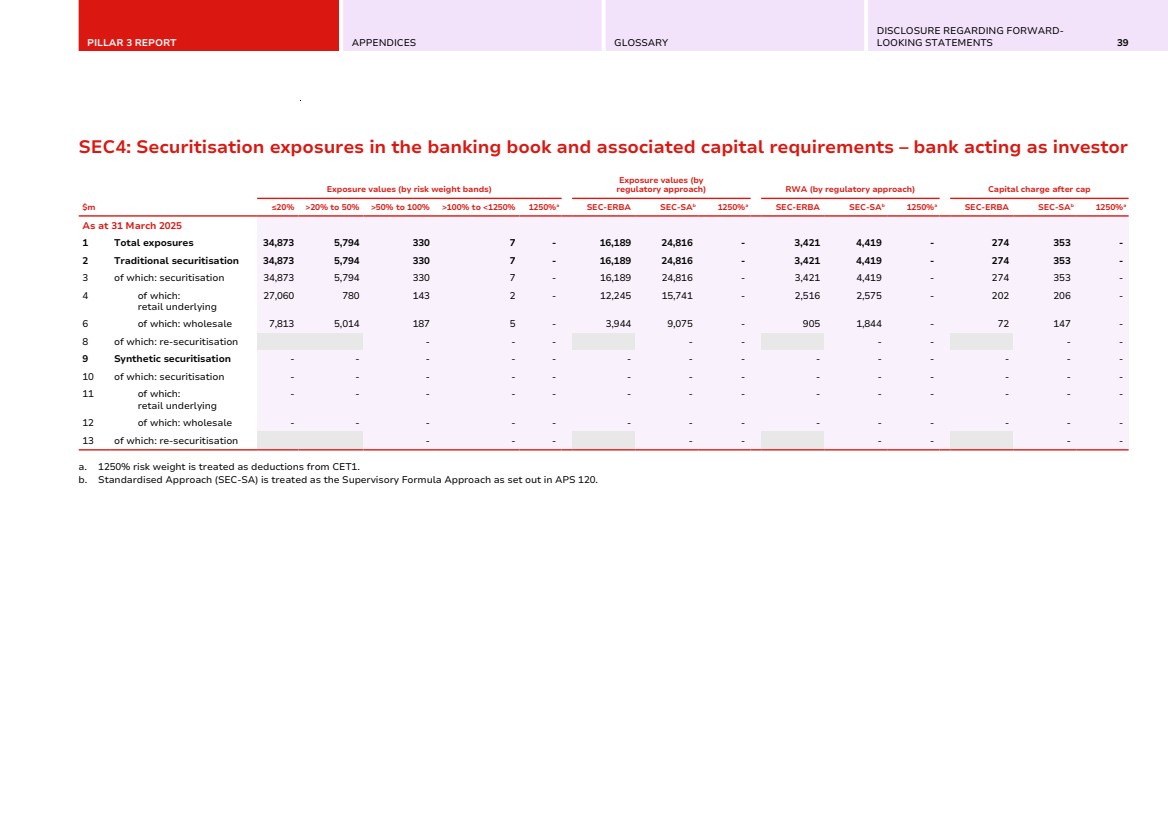
| 40 WESTPAC GROUP MARCH 2025 PILLAR 3 REPORT MARKET RISK Traded Market Risk Westpac’s exposure to traded market risk arises out of Financial Markets and Treasury trading activities. This is quantified for regulatory capital purposes using both the internal model approach and the standardised method, details of which are provided below. Approach Financial Markets in WIB supports customers through activities including market making and distribution of capital markets products. The types of market risk arising from these activities include interest rate, foreign exchange, commodity, credit spread, volatility risk and derivative valuation adjustments due to credit and funding risk. Treasury’s trading activity includes the management of interest rate, foreign exchange and credit spread risks associated with the wholesale funding book, liquid asset portfolios and foreign exchange repatriations. Treasury also manages interest rate risk in the banking book which is discussed in the IRRBB section. Trading activities are managed within the Westpac Board Risk Committee (BRiskC) approved Market Risk Management Framework. The supporting Traded Market Risk Policy contains the Board-approved Value at Risk (VaR) and Stressed Value at Risk (SVaR) limits. Market risk is managed using VaR, SVaR and structural risk limits (including volume limits and basis point value limits) in conjunction with scenario analysis and stress testing. Market risk limits used by management are based upon Westpac’s risk appetite and business strategies, in addition to the consideration of market liquidity and concentration risk. Trades are fair valued daily using rates that have been captured from an independent market data source that has been approved by the Revaluation Committee (RC). Where there is no source of independent rates, data will either be derived using a methodology approved by the RC or sourced from external market dealers. Rates that are dealer-sourced or have limited independent sources are reviewed at least monthly for appropriateness. The RC meets monthly to review the results of independent price verification performed. In addition, valuation adjustments may be made as deductions from CET1 Capital for exposures which are not captured through the fair valuation framework. Guidance for prudential valuation practices are documented in the Westpac Model Risk policy, and model owners are required to assess the extent of valuation uncertainty and limitations in product valuations systems. This is reviewed by Model Risk as part of independent model validation. Where applicable, prudential valuation adjustments are taken by Finance beyond any fair value adjustments that may apply. Risk framework Description Risk reporting Daily monitoring of current exposure and limit utilisation is conducted independently by the Market Risk team, that monitors market risk exposures against VaR, SVaR and structural limits. This team reports directly to the Westpac Institutional Bank and Treasury Chief Risk Officer (CRO) who in turn reports to the Group CRO. Daily VaR and SVaR position reports are produced by risk type, by product lines and by geographic region. These are supplemented by structural risk reporting, advice of profit and loss trigger levels and stress test escalation trigger points. Model accreditation has been granted by APRA for the use of an internal model for the determination of regulatory capital for the key classes of interest rate (general market), foreign exchange, commodity and equity risks (including equity specific risk). Under the model, regulatory capital is derived from both the current VaR window and a SVaR window, where these VaR measures are calculated over a 10-day time horizon to a 99th percentile, one-tailed confidence interval. Specific risk refers to the variations in individual security prices that cannot be explained by general market movements, and event and default risk. Interest rate specific risk capital (specific issuer risk) is calculated using the Standard method and is added to the VaR regulatory capital measure. Westpac currently holds an industry-wide capital overlay which was introduced from 31 December 2021 and relates to APRA’s revised risks-not-in-VaR framework. This overlay will be applied until the Group’s revised framework is approved by APRA. |
| PILLAR 3 REPORT APPENDICES GLOSSARY DISCLOSURE REGARDING FORWARD-LOOKING STATEMENTS 41 Risk framework Description VaR and SVaR limits for Traded Market Risk Market risk arising from trading book activities is primarily measured using VaR based on an historical simulation methodology. Westpac estimates VaR as the potential loss in earnings from adverse market movements and is calculated to a 99% confidence level using the most recent 12 months of historical market data. SVaR is an additional VaR measure which uses 12 months of historical market data that includes a period of significant financial stress. VaR and SVaR take account of all known material market variables that may cause a change in the value of the trading portfolio, including interest rates, foreign exchange rates, price changes, volatility, and the correlation between these variables. The Board-approved market risk VaR and SVaR limits for trading activities are supported by separate VaR and SVaR sub-limits for the trading activities of Financial Markets and Treasury. Westpac uses a full revaluation historical simulation approach for calculating VaR for general market risk for all portfolios. A small number of linear products are modelled using a sensitivity-based approach which is demonstrated to adequately replicate the risk. Products use valuation models which are marked to market or marked to model and aligned to the approaches used for valuations for official profit and loss. This is monitored by back testing and profit and loss attribution analysis between the risk and valuation systems to ensure alignment and investigation of any material differences. Stress testing through scenarios is performed daily at the Group, trading book and portfolio level to ensure limits are adequately calibrated to risk appetite and strategy. Stress testing Stress scenarios represent a combination of historical and hypothetical events and are reviewed regularly with a view to incorporating emerging risks. Responsibilities for the approval and oversight of stress test policies, parameters and results are allocated to accountable members of the various committees across the market risk governance framework. The Market Risk Stress Test Policy, containing the stress test escalation framework, is approved by the Head of Market, Capital and Liquidity Risk. Back-testing Market Risk performs daily back-testing analysis to assess the validity of the VaR numbers when compared to the actual clean and hypothetical trading outcomes to ensure that model integrity is maintained. A review of both the actual and potential profit and loss outcomes is also undertaken to monitor any skew created by the historical data. Risk mitigation Market risk positions are managed by the trading desks consistent with delegated trading and product authorities. Risk management is carried out by qualified personnel with varying levels of seniority commensurate with the nature and scale of market risks under management. There is extensive hedging capability across cash and derivative products which is used to support the management of market risk within risk appetite at the Desk, Management and Board Level. The following controls allow monitoring by management: • trading authorities and responsibilities are clearly delineated at all levels; • a structured system of limits and reporting of risk exposures, including stress testing; • surveillance of dealing room conduct; • all new products and significant product variations undergo a rigorous approval process to identify business risks prior to launch; • models that are used to determine risk or profit and loss for Westpac’s accounts are independently reviewed; • duties are segregated so that employees involved in the origination, processing and valuation of transactions operate under separate reporting lines, minimising the opportunity for collusion; and • legal personnel review documentation for compliance with relevant laws and regulations. In addition, Group Audit provides independent assurance of the governance, risk management and internal controls. Capital and profit and loss notification framework The BRiskC has approved a profit and loss notification framework. Included in this framework are levels of escalation in accordance with the size of the profit or loss. Triggers are applied to both a 1-day and a rolling 20-day cumulative total. Banking book capital and profit and loss triggers consider changes in economic value as well as financial profit and loss. Structural foreign exchange rate risk Structural foreign exchange rate risk results from the generation of foreign currency denominated earnings and from Westpac’s capital deployed in offshore branches and subsidiaries, where it is denominated in currencies other than Australian dollars. The Australian dollar equivalent of offshore earnings and capital is subject to change as exchange rates fluctuate, which could introduce significant variability to Westpac’s reported financial results. The Group Asset and Liability committee provides oversight of the appropriateness of foreign exchange hedges on earnings and capital. |

| 42 WESTPAC GROUP MARCH 2025 PILLAR 3 REPORT MARKET RISK Market risk regulatory capital and risk weighted assets The table below details the capital and associated RWA by approach. The Internal model approach uses VaR and SVaR, while the Standard approach is used for interest rate specific risk. Capital required Risk weighted assets $m 31 March 2025 30 September 2024 31 March 2024 31 March 2025 30 September 2024 31 March 2024 Internal model approach 581 637 765 7,264 7,969 9,563 Standard approach 97 127 135 1,214 1,586 1,688 Total 678 764 900 8,478 9,555 11,251 VaR by risk type For the 6 months ended $m High Low Average Period end 31 March 2025 Interest rate risk 16.7 4.3 7.7 9.9 Foreign exchange risk 4.0 1.1 2.1 2.4 Equity risk - - - - Commodity risk 1.2 0.4 0.7 1.0 Other market risks 4.8 2.3 3.2 4.7 Diversification benefit n/a n/a (4.9) (7.8) Net market riska 17.9 6.6 8.8 10.2 30 September 2024 Interest rate risk 12.8 5.4 7.7 6.2 Foreign exchange risk 5.9 1.1 2.1 3.0 Equity risk - - - - Commodity risk 1.4 0.6 0.9 0.9 Other market risks 3.7 1.9 2.8 3.0 Diversification benefit n/a n/a (4.5) (4.7) Net market riska 14.5 6.8 9.1 8.3 31 March 2024 Interest rate risk 21.2 7.6 13.9 7.6 Foreign exchange risk 7.3 0.9 2.7 1.6 Equity risk - - - - Commodity risk 1.7 0.9 1.5 1.1 Other market risks 10.1 2.6 8.0 2.7 Diversification benefit n/a n/a (9.2) (3.8) Net market riska 23.4 8.8 16.8 9.2 a. VaR and SVaR measures shown here use a 1 day time horizon. The net market risk measure reflects the aggregate diversified risk position for the period. Therefore, individual risk factors will not sum to this total. |
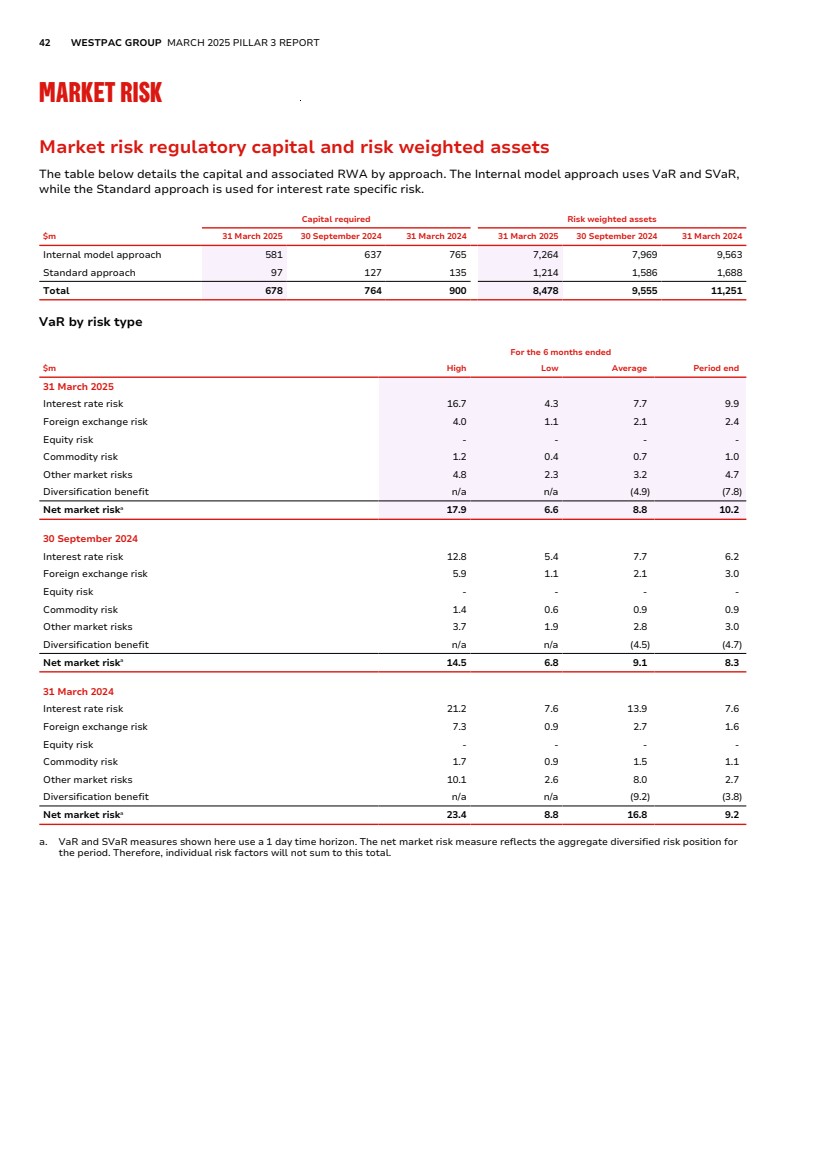
| PILLAR 3 REPORT APPENDICES GLOSSARY DISCLOSURE REGARDING FORWARD-LOOKING STATEMENTS 43 SVaR by risk type For the 6 months ended $m High Low Average Period end 31 March 2025 Interest rate risk 72.9 35.1 54.0 52.8 Foreign exchange risk 8.3 1.9 4.3 3.2 Equity risk - - - - Commodity risk 4.2 0.6 1.3 2.7 Other market risks 21.6 10.7 13.5 11.6 Diversification benefit n/a n/a (20.0) (13.2) Net market riska 73.7 38.0 53.1 57.1 30 September 2024 Interest rate risk 95.4 32.5 62.4 38.2 Foreign exchange risk 10.8 1.5 3.5 6.0 Equity risk - - - - Commodity risk 2.1 0.8 1.2 1.2 Other market risks 18.6 13.9 16.0 16.5 Diversification benefit n/a n/a (20.7) (19.8) Net market riska 93.3 32.7 62.4 42.1 31 March 2024 Interest rate risk 83.6 43.3 61.4 60.8 Foreign exchange risk 16.6 1.7 4.3 2.5 Equity risk - - - - Commodity risk 2.6 1.3 1.8 1.5 Other market risks 18.8 15.1 17.3 17.2 Diversification benefit n/a n/a (18.9) (17.0) Net market riska 87.3 50.7 65.9 65.0 a. The net market risk measure reflects the aggregate diversified risk position for the period. Therefore, individual risk factors will not sum to this total. |
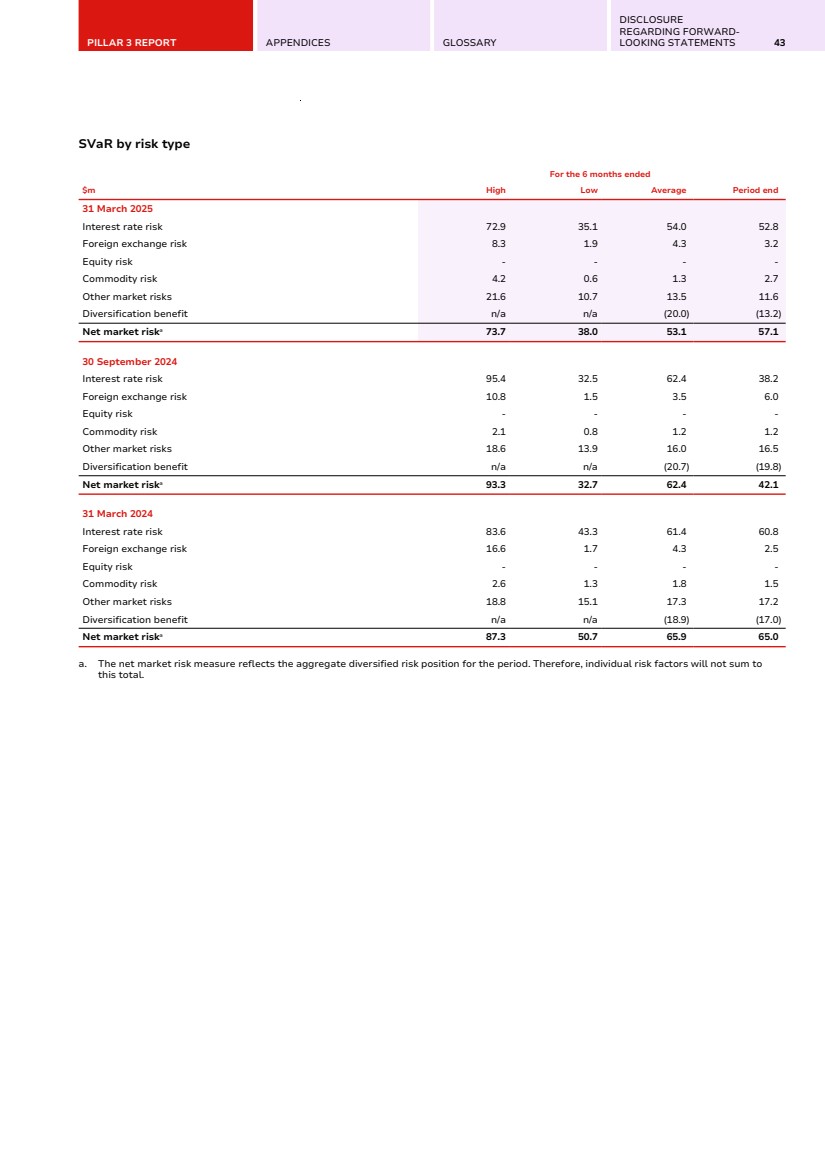
| 44 WESTPAC GROUP MARCH 2025 PILLAR 3 REPORT MARKET RISK Back-testing results The following graph gives a comparison of actual profit and loss to VaR over the 6 months ended 31 March 2025. Each point on the graph represents 1 day’s trading profit or loss. This result is placed on the graph relative to the associated VaR utilisation. The downward sloping line represents the point where a loss is equal to VaR utilisation. |
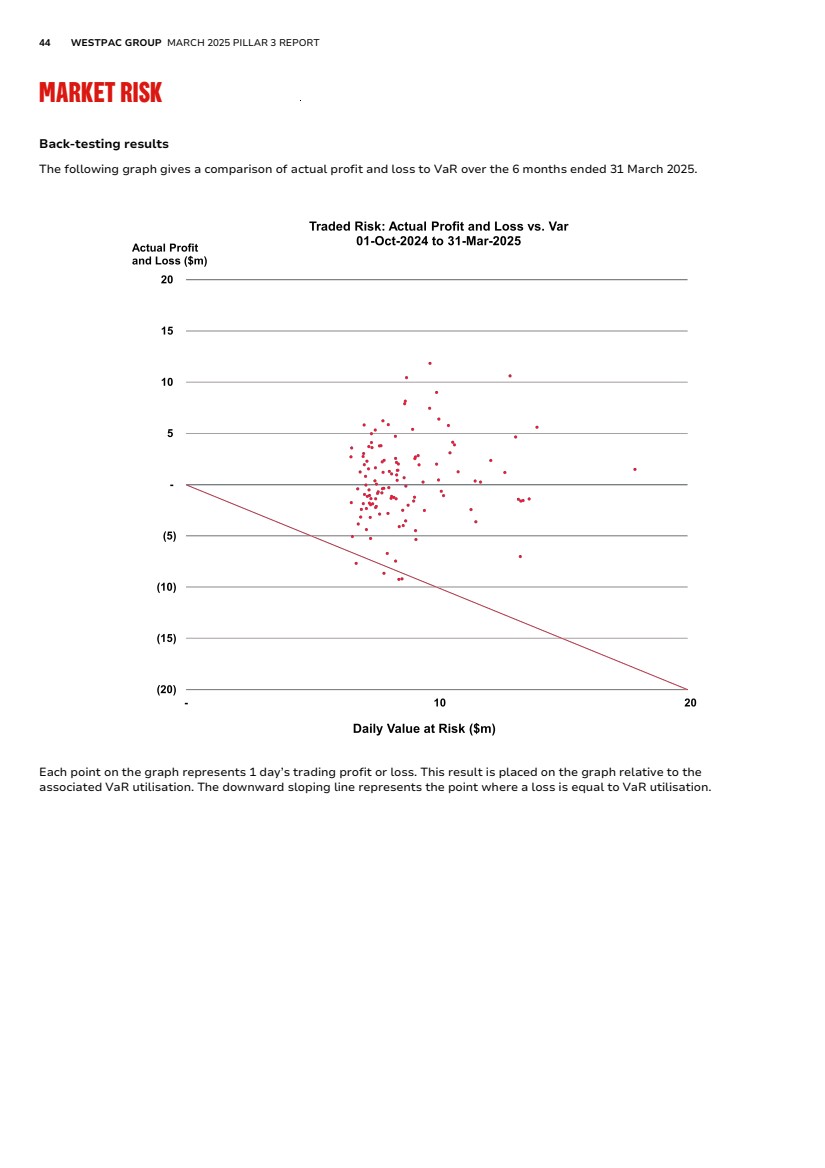
| PILLAR 3 REPORT APPENDICES GLOSSARY DISCLOSURE REGARDING FORWARD-LOOKING STATEMENTS 45 INTEREST RATE RISK IN THE BANK BOOK (IRRBB) Interest rate risk is the Group’s exposure to movements in interest rates. IRRBB arises from changes in market interest rates that impact the Group’s earnings (net interest income (NII)) or the economic value of balance sheet categories. The Group manages interest rate risk to achieve reasonable earnings stability over time. The activities that give rise to this risk include customer lending and deposit taking, balance sheet funding and liquidity management, and capital management. Approach IRRBB is managed and governed under the Group’s Market Risk Management Framework which is approved by the Board Risk Committee. This framework is supported by a comprehensive IRRBB measurement system for the quantification of these risks and the potential impact from changes in market interest rates. It includes independent Risk oversight in line with the Group’s Three Lines of Defence framework. IRRBB regulatory capital and RWA1 This table presents IRRRB regulatory capital and RWA. Refer to Key metrics for movement drivers. 31 March 30 September 31 March $m 2025 2024 2024 Total capital required 3,141 2,236 2,688 Risk weighted assets 39,263 27,955 33,599 Change in economic value of a sudden upward and downward movement in interest rates The table below represents the change in economic value of a sudden upward or downward movement in interest rates based on a 200 basis point parallel shift. The results include the regulatory earnings offset. The sensitivity to upward or downward movements in interest rates has increased due to the Group's decision to extend the duration of its core non-rate sensitive hedge from 4 to 5 years and underlying banking activities. 31 March 2025 30 September 2024 31 March 2024 200bp Parallel 200bp Parallel 200bp Parallel 200bp Parallel 200bp Parallel 200bp Parallel $m Increase Decrease Increase Decrease Increase Decrease AUD (1,935) 2,072 (899) 934 (978) 1,014 NZD 85 (89) 95 (99) 96 (98) USD (18) 19 6 (7) (3) 4 Other 8 (8) 11 (11) 15 (15) Total (1,860) 1,994 (787) 817 (870) 905 1. Regulatory capital and interest rate shock calculations for IRRBB are based on the existing APS 117 requirements. The revised APS 117 will come into effect on 1 October 2025. |
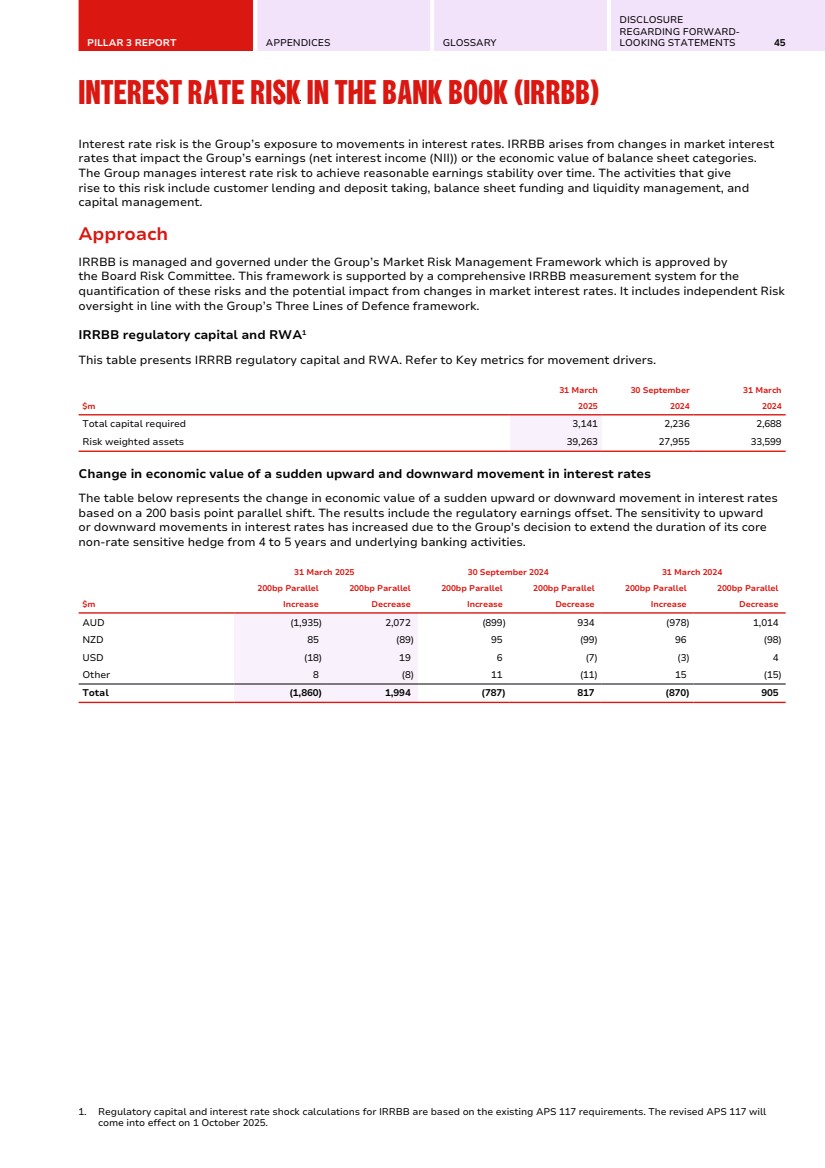
| 46 WESTPAC GROUP MARCH 2025 PILLAR 3 REPORT LEVERAGE RATIO LR1: Summary comparison of accounting assets vs leverage ratio exposure measure This table presents an overview of adjustments against Westpac’s published total assets for leveraged ratio calculations purposes. $m 31 March 2025 1 Total consolidated assets as per published financial statements 1,098,893 2 Adjustment for investments in banking, financial, insurance or commercial entities that are consolidated for accounting purposes but outside the scope of regulatory consolidation (390) 3 Adjustment for securitised exposures that meet the operational requirements for the recognition of risk transference - 4 Adjustments for temporary exemption of central bank reserves (if applicable) - 5 Adjustment for fiduciary assets recognised on the balance sheet pursuant to the operative accounting framework but excluded from the leverage ratio exposure measure - 6 Adjustments for regular-way purchases and sales of financial assets subject to trade date accounting - 7 Adjustments for eligible cash pooling transactions 24,053 8 Adjustments for derivative financial instruments 16,129 9 Adjustment for securities financing transactions (ie repurchase agreements and similar secured lending) 24,125 10 Adjustment for off-balance sheet items (ie conversion to credit equivalent amounts of off-balance sheet exposures) 110,889 11 Adjustments for prudent valuation adjustments and specific and general provisions which have reduced Tier 1 capital - 12 Other adjustments (15,999) 13 Leverage ratio exposure measure 1,257,700 |

| PILLAR 3 REPORT APPENDICES GLOSSARY DISCLOSURE REGARDING FORWARD-LOOKING STATEMENTS 47 LR2: Leverage ratio common disclosure template The table below provides a detailed breakdown of the components of the leverage ratio denominator, as well as information on the leverage ratio, minimum requirements and buffers. $m 31 March 2025 31 December 2024 On-balance sheet exposures 1 On-balance sheet exposures (excluding derivatives and securities financing transactions (SFTs), but including collateral) 1,086,105 1,075,282 2 Gross-up for derivatives collateral provided where deducted from balance sheet assets pursuant to the operative accounting framework 3,955 4,923 3 (Deductions of receivable assets for cash variation margin provided in derivatives transactions) (4,883) (6,766) 4 (Adjustment for securities received under securities financing transactions that are recognised as an asset) - - 5 (Specific and general provisions associated with on-balance sheet exposures that are deducted from Tier 1 capital) - - 6 (Asset amounts deducted in determining Tier 1 capital and regulatory adjustments) (15,999) (16,064) 7 Total on-balance sheet exposures (excluding derivatives and SFTs) (sum of rows 1 to 6) 1,069,178 1,057,375 Derivative exposures 8 Replacement cost associated with all derivatives transactions (where applicable net of eligible cash variation margin, with bilateral netting and/or the specific treatment for client cleared derivatives) 9,891 18,674 9 Add-on amounts for potential future exposure associated with all derivatives transactions 26,513 25,167 10 (Exempted central counterparty (CCP) leg of client-cleared trade exposures) - - 11 Adjusted effective notional amount of written credit derivatives 4,804 1,697 12 (Adjusted effective notional offsets and add-on deductions for written credit derivatives) (4,804) (1,697) 13 Total derivative exposures (sum of rows 8 to 12) 36,404 43,841 Securities financing transaction exposures 14 Gross SFT assets (with no recognition of netting), after adjustment for sale accounting transactions 39,538 40,121 15 (Netted amounts of cash payables and cash receivables of gross SFT assets) - - 16 Counterparty credit risk exposure for SFT assets 1,691 1,732 17 Agent transaction exposures - - 18 Total securities financing transaction exposures (sum of rows 14 to 17) 41,229 41,853 Other off-balance sheet exposures 19 Off-balance sheet exposure at gross notional amount 223,286 221,850 20 (Adjustments for conversion to credit equivalent amounts) (112,397) (112,424) 21 (Specific and general provisions associated with off-balance sheet exposures deducted in determining Tier 1 capital) - - 22 Off-balance sheet items (sum of rows 19 to 21) 110,889 109,426 Capital and total exposures 23 Tier 1 capital 65,394 63,978 24 Total exposures (sum of rows 7, 13, 18 and 22) 1,257,700 1,252,495 Leverage ratio 25 Leverage ratio (including the impact of any applicable temporary exemption of central bank reserves) 5.20% 5.11% 25a Leverage ratio (excluding the impact of any applicable temporary exemption of central bank reserves) 5.20% 5.11% 26 National minimum leverage ratio requirement 3.50% 3.50% 27 Applicable leverage buffers - - Disclosure of mean values 28 Mean value of gross SFT assets, after adjustment for sale accounting transactions and netted of amounts of associated cash payables and cash receivables 39,538 40,121 29 Quarter-end value of gross SFT assets, after adjustment for sale accounting transactions and netted of amounts of associated cash payables and cash receivables 41,088 43,707 30 Total exposures (including the impact of any applicable temporary exemption of central bank reserves) incorporating mean values from row 28 of gross SFT assets (after adjustment for sale accounting transactions and netted of amounts of associated cash payables and cash receivables) 1,257,700 1,252,495 30a Total exposures (excluding the impact of any applicable temporary exemption of central bank reserves) incorporating mean values from row 28 of gross SFT assets (after adjustment for sale accounting transactions and netted of amounts of associated cash payables and cash receivables) 1,257,700 1,252,495 31 Basel III leverage ratio (including the impact of any applicable temporary exemption of central bank reserves) incorporating mean values from row 28 of gross SFT assets (after adjustment for sale accounting transactions and netted of amounts of associated cash payables and cash receivables) 5.20% 5.11% 31a Basel III leverage ratio (excluding the impact of any applicable temporary exemption of central bank reserves) incorporating mean values from row 28 of gross SFT assets (after adjustment for sale accounting transactions and netted of amounts of associated cash payables and cash receivables) 5.20% 5.11% Leverage ratio movement for the quarter ended 31 March 2025 The leverage ratio increased by 9 basis points over the quarter mainly from higher Tier 1 regulatory capital. |

| 48 WESTPAC GROUP MARCH 2025 PILLAR 3 REPORT MACRO-PRUDENTIAL SUPERVISORY MEASURES CCYB1: Geographical distribution of credit exposures used in the calculation of the bank-specific countercyclical capital buffer requirement This table sets out the ADI specific countercyclical capital buffer. The countercyclical capital buffer is an additional amount of capital that APRA can require banks to hold or release at certain points in the economic and financial cycle. As part of the capital framework, APRA has set a 1.0% default countercyclical capital buffer for Australian exposures. The following table provides a geographic breakdown of RWA associated with private sector credit exposures that are used to calculate the countercyclical capital buffer requirement. Geographical breakdown Countercyclical capital buffer rate RWA used in the computation of the countercyclical capital buffer ($m) Bank-specific countercyclical capital buffer rate Countercyclical capital buffer amount ($m) As at 31 March 2025 Australia 1.00% 284,746 0.82% United Kingdom 2.00% 1,268 0.01% Netherlands 2.00% 457 0.00% France 1.00% 516 0.00% Ireland 1.50% 175 0.00% Denmark 2.50% 54 0.00% South Korea 1.00% 133 0.00% Luxembourg 0.50% 148 0.00% Germany 0.75% 64 0.00% Belgium 1.00% 48 0.00% Hong Kong SAR 0.50% 83 0.00% Sweden 2.00% 10 0.00% Norway 2.50% 1 0.00% Other n/a 57,481 0.00% Total, where countercyclical capital buffer rate applies 287,703 0.00% Total of geographical breakdowns 345,184 0.84% 3,770 |
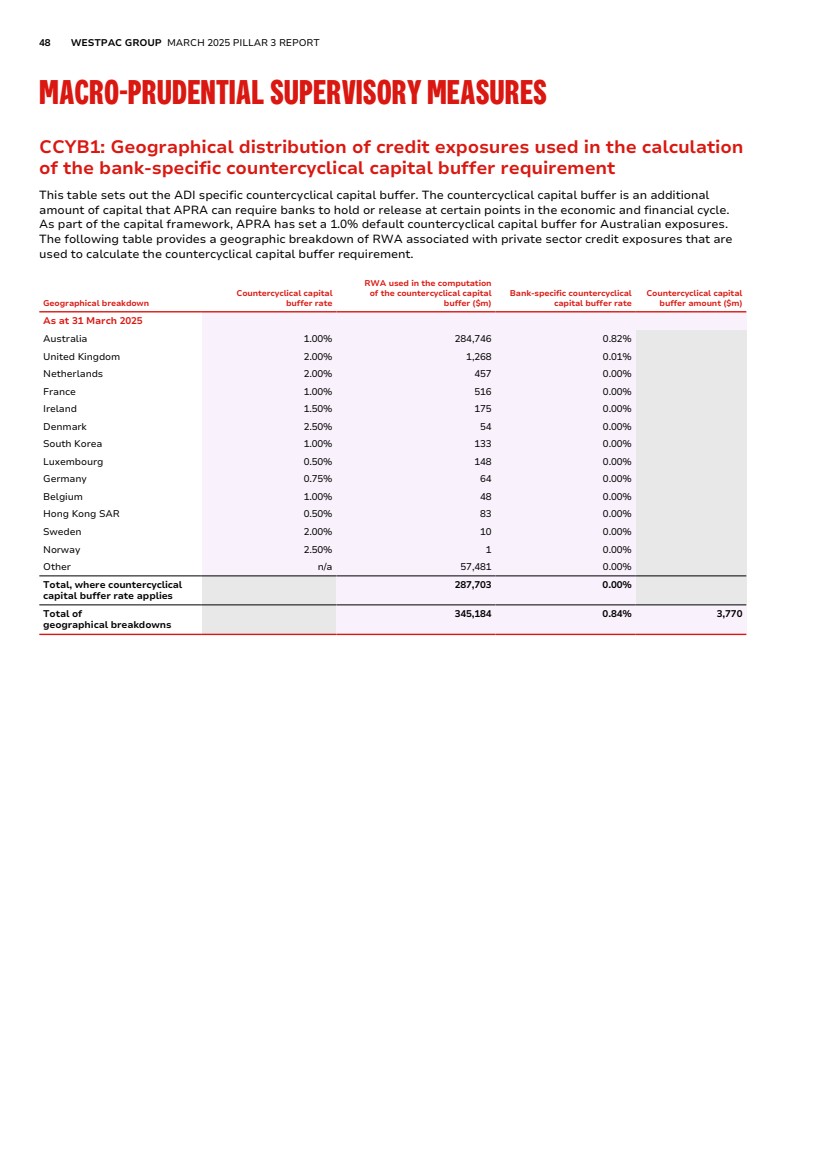
| PILLAR 3 REPORT APPENDICES GLOSSARY DISCLOSURE REGARDING FORWARD-LOOKING STATEMENTS 49 FUNDING AND LIQUIDITY RISK MANAGEMENT LIQ1: Liquidity Coverage Ratio The Liquidity Coverage Ratio (LCR) measures a bank’s ability to meet its liquidity needs under an acute liquidity stress scenario (prescribed by APRA), measured over a 30-day time frame. LCR is calculated as high-quality liquid assets (HQLA) as a percentage of net cash outflows (NCO). Average LCR is calculated as a simple average of the daily observations over the quarter. The number of data points used is reported in the table. Westpac’s average LCR for the quarter was 135% (31 December 2024: 131%) and continues to be above the regulatory minimum of 100% in line with the Group’s liquidity risk tolerance. The increase in average LCR for the quarter ended 31 March 2025 reflects an increase in average liquid assets, mainly driven by collateral inflows relating to interest rate movements and a weaker AUD relative to the USD, and a lower average customer funding gap driven by the relative growth in deposits. This was partially offset by higher average NCOs, mostly driven by higher wholesale funding maturities. HQLA averaged $178.3 billion over the quarter (31 December 2024: $168.8 billion), comprising of cash and balances with central banks, Australian government and semi-government bonds. Westpac also holds other HQLA, mainly qualifying RBNZ securities. Funding is sourced from retail, small business, corporate and institutional customer deposits and wholesale funding. Westpac seeks to minimise the outflows associated with this funding by targeting customer deposits with lower LCR outflow rates and actively manages the maturity profile of its wholesale funding portfolio. 31 March 2025 31 December 2024 $m Total unweighted value (average) Total weighted value (average) Total unweighted value (average) Total weighted value (average) Liquid assets, of which: 1 High-quality liquid assets (HQLA) 178,317 168,771 Alternative Liquid Assets (ALA) - - Reserve Bank of New Zealand (RBNZ) securities 4,507 2,109 Cash outflows 2 Retail deposits and deposits from small business customers, of which: 369,905 33,091 363,764 32,442 3 Stable deposits 174,830 8,742 174,181 8,709 4 Less stable deposits 195,075 24,349 189,583 23,733 5 Unsecured wholesale funding, of which: 172,162 77,014 163,053 71,433 6 Operational deposits (all counterparties) and deposits in networks of cooperative banks 78,155 19,470 75,699 18,858 7 Non-operational deposits (all counterparties) 81,743 45,280 78,206 43,427 8 Unsecured debt 12,264 12,264 9,148 9,148 9 Secured wholesale funding 213 505 10 Additional requirements, of which: 205,068 35,962 205,117 36,469 11 Outflows related to derivative exposures and other collateral requirements 17,627 16,937 18,697 18,180 12 Outflows related to loss of funding on debt products 1,654 1,654 816 816 13 Credit and liquidity facilities 185,787 17,371 185,604 17,473 14 Other contractual funding obligations 8,191 5,613 8,991 6,041 15 Other contingent funding obligations 65,190 4,894 67,077 5,118 16 Total Cash Outflows 156,787 152,008 Cash inflows 17 Secured lending (e.g. reverse repos) 9,738 - 12,285 - 18 Inflows from fully performing exposures 11,225 6,030 11,357 6,131 19 Other cash inflows 15,827 15,827 15,110 15,110 20 Total Cash Inflows 36,790 21,857 38,752 21,241 Total adjusted value Total adjusted value 21 Total HQLA 182,824 170,880 22 Total net cash outflows 134,930 130,767 23 Liquidity Coverage Ratio (%) 135% 131% Number of data points used 62 64 |
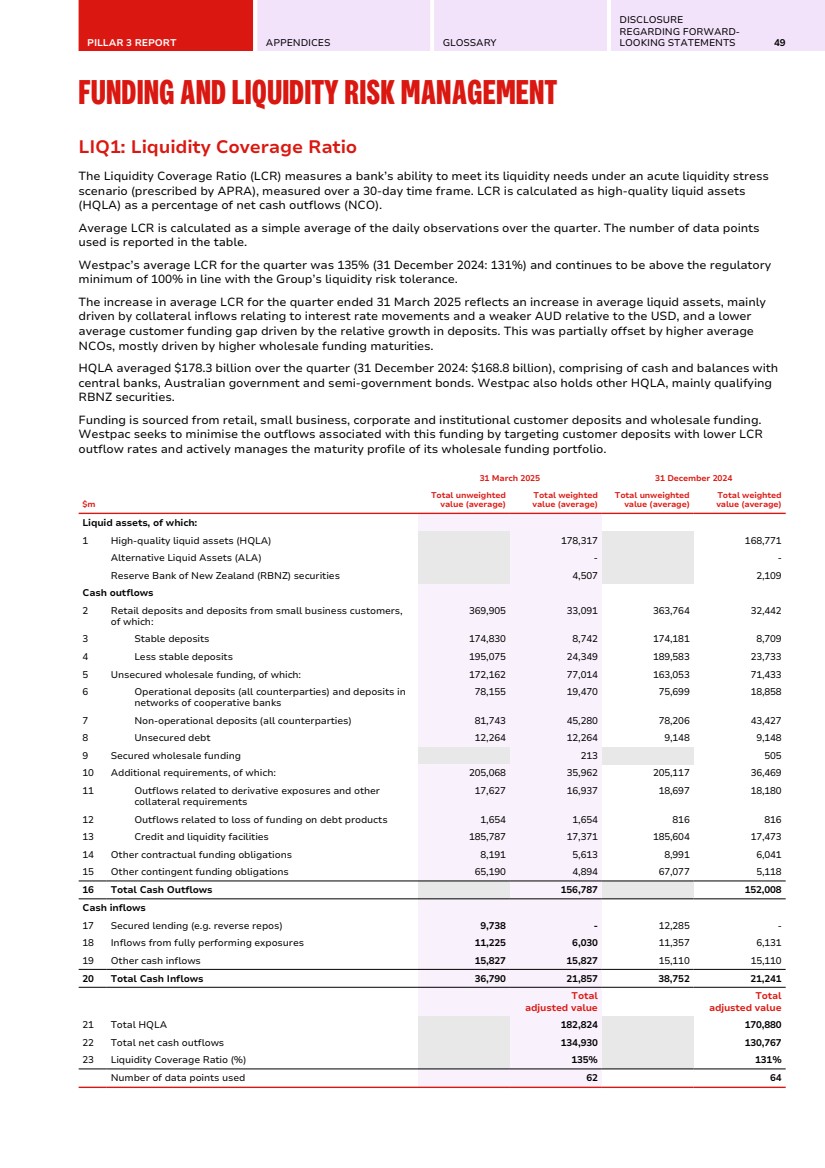
| 50 WESTPAC GROUP MARCH 2025 PILLAR 3 REPORT FUNDING AND LIQUIDITY RISK MANAGEMENT LIQ2: Net Stable Funding Ratio The NSFR requires that a bank has sufficient Available Stable Funding (ASF) to cover its Required Stable Funding (RSF) over a one-year horizon. The NSFR requires banks to hold sufficient stable funding to cover long term assets with a duration of greater than one year. Westpac’s NSFR for the quarter was 115%1 up from 113% for the quarter ended 31 December 2024 and continues to be above the regulatory minimum of 100%. The increase in the NSFR for the quarter reflects an increase in ASF of 1% ($9.0 billion) driven by growth in retail deposits, alongside a reduction in RSF of 1% ($6.9 billion) driven by a reduction in derivative assets. Unweighted value by residual maturity $m No maturity < 6 months 6 months to < 1 year ≥ 1 year Weighted value As at 31 March 2025 Available stable funding (ASF) item 1 Capital: 71,183 - - 42,590 113,772 2 Regulatory capital 71,183 - - 41,502 112,684 3 Other capital instruments - - - 1,088 1,088 4 Retail deposits and deposits from small business customers: 360,618 95,422 866 268 421,025 5 Stable deposits 172,783 26,138 3 4 188,982 6 Less stable deposits 187,835 69,284 863 264 232,043 7 Wholesale funding: 135,747 187,481 43,403 118,183 232,321 8 Operational deposits 75,925 - - - 37,963 9 Other wholesale funding 59,822 187,481 43,403 118,183 194,358 10 Liabilities with matching interdependent assets - - - - - 11 Other liabilities: - 22,469 - 345 345 12 NSFR derivative liabilities 6,346 - - 13 All other liabilities and equity not included in the above categories - 16,123 - 345 345 14 Total ASF 767,463 Required stable funding (RSF) item 15 Total NSFR high-quality liquid assets (HQLA) 5,814 15b Alternative Liquid Assets (ALA) - 15c Reserve Bank of New Zealand (RBNZ) securities 603 16 Deposits held at other financial institutions for operational purposes - - - - - 17 Performing loans and securities: 1,985 61,997 45,224 744,571 613,259 18 Performing loans to financial institutions secured by Level 1 HQLA 1,940 16,416 - - 3,581 19 Performing loans to financial institutions secured by non-Level 1 HQLA and unsecured performing loans to financial institutions 45 4,660 7,854 25,584 30,255 20 Performing loans to non-financial corporate clients, loans to retail and small business customers, and loans to sovereigns, central banks and public sectors entities (PSEs) - 31,855 28,146 170,193 173,641 21 of which: with a risk weight of less than or equal to 35% under APS 112 - 1,408 685 4,340 3,869 22 Performing residential mortgages - 5,751 5,933 532,232 388,361 23 of which: are standard loans to individuals with a LVR of 80% or below - - - 367,413 238,819 24 Securities that are not in default and do not qualify as HQLA, including exchange-traded equities - 3,315 3,291 16,562 17,421 25 Assets with matching interdependent liabilities - - - - - 26 Other assets: 8,469 3,898 295 43,665 36,949 27 Physical traded commodities, including gold 403 403 28 Assets posted as initial margin for derivative contracts and contributions to default funds of central counterparties - - 3,298 2,803 29 NSFR derivative assets - - 5,967 - 30 NSFR derivative liabilities before deduction of variation margin posted - - 11,665 2,333 31 All other assets not included in the above categories 8,066 3,898 295 22,735 31,410 32 Off-balance sheet items 211,519 - - 10,101 33 Total RSF 666,726 34 Net Stable Funding Ratio (%) 115% 1. Calculated as total ASF divided by total RSF as at end of the quarter. |
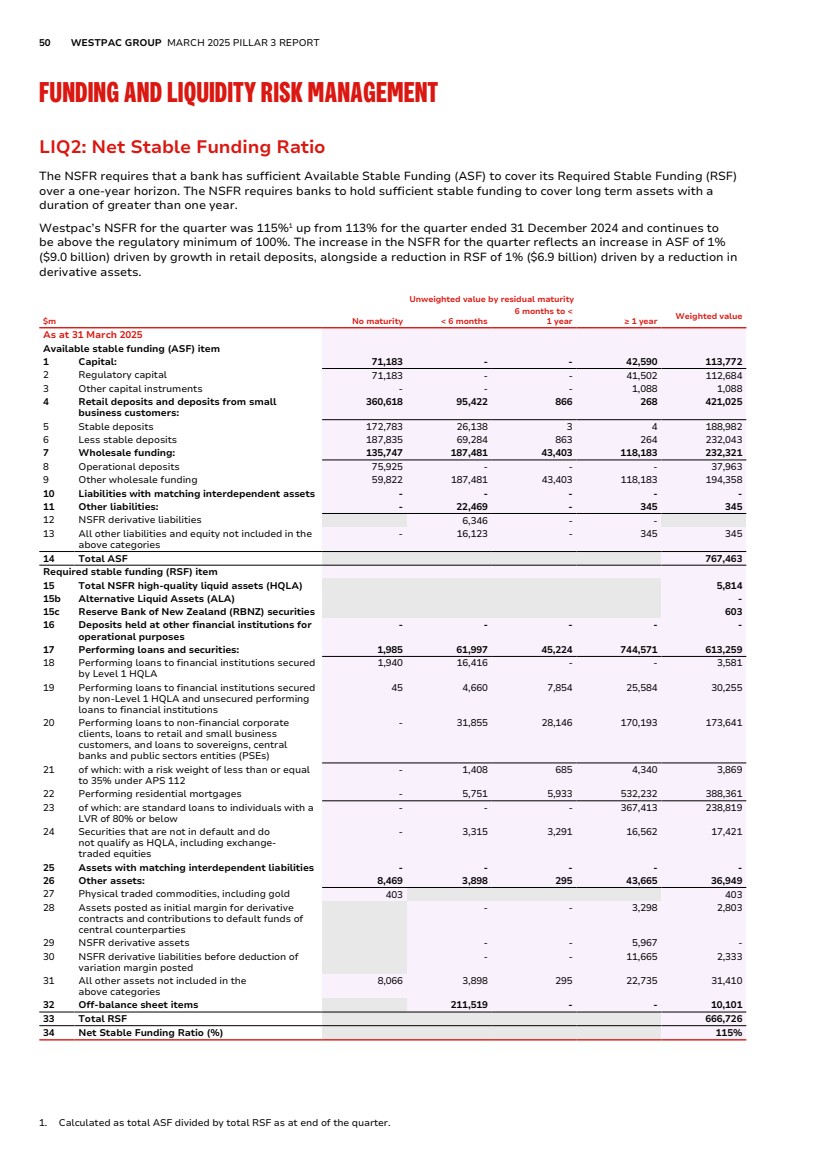
| PILLAR 3 REPORT APPENDICES GLOSSARY DISCLOSURE REGARDING FORWARD-LOOKING STATEMENTS 51 LIQ2: Net Stable Funding Ratio (Continued) Unweighted value by residual maturity $m No maturity < 6 months 6 months to < 1 year ≥ 1 year Weighted value As at 31 December 2024 Available Stable Funding (ASF) Item 1 Capital: 69,788 - - 42,688 112,476 2 Regulatory capital 69,788 - - 41,604 111,392 3 Other capital instruments - - - 1,084 1,084 4 Retail deposits and deposits from small business customers: 355,164 94,057 583 234 414,982 5 Stable deposits 172,446 26,032 5 4 188,563 6 Less stable deposits 182,718 68,025 578 230 226,419 7 Wholesale funding: 131,722 201,073 39,968 120,049 230,668 8 Operational deposits 75,989 - - - 37,994 9 Other wholesale funding 55,733 201,073 39,968 120,049 192,674 10 Liabilities with matching interdependent assets - - - - - 11 Other liabilities: - 19,006 - 355 355 12 NSFR derivative liabilities 6,787 - - 13 All other liabilities and equity not included in the above categories - 12,219 - 355 355 14 Total ASF 758,481 Required Stable Funding (RSF) Item 15 Total NSFR high-quality liquid assets (HQLA) 5,496 15b Alternative Liquid Assets (ALA) - 15c Reserve Bank of New Zealand (RBNZ) securities 276 16 Deposits held at other financial institutions for operational purposes - - - - - 17 Performing loans and securities: 1,264 59,310 47,674 742,351 612,700 18 Performing loans to financial institutions secured by Level 1 HQLA 1,217 17,004 - - 2,918 19 Performing loans to financial institutions secured by non-Level 1 HQLA and unsecured performing loans to financial institutions 47 3,722 8,139 25,169 29,844 20 Performing loans to non-financial corporate clients, loans to retail and small business customers, and loans to sovereigns, central banks and public sectors entities (PSEs) - 30,415 31,127 169,838 174,044 21 of which: with a risk weight of less than or equal to 35% under APS 112 - 1,078 918 4,416 3,870 22 Performing residential mortgages - 5,657 5,652 526,975 385,833 23 of which: are standard loans to individuals with a LVR of 80% or below - - - 357,489 232,368 24 Securities that are not in default and do not qualify as HQLA, including exchange-traded equities - 2,512 2,756 20,369 20,061 25 Assets with matching interdependent liabilities - - - - 26 Other assets: 8,445 1,112 348 54,849 44,979 27 Physical traded commodities, including gold 381 381 28 Assets posted as initial margin for derivative contracts and contributions to default funds of central counterparties - - 2,976 2,530 29 NSFR derivative assets - - 11,596 4,809 30 NSFR derivative liabilities before deduction of variation margin posted - - 14,761 2,952 31 All other assets not included in the above categories 8,064 1,112 348 25,516 34,307 32 Off-balance sheet items 213,028 10,132 33 Total RSF 673,583 34 Net Stable Funding Ratio (%) 113% |
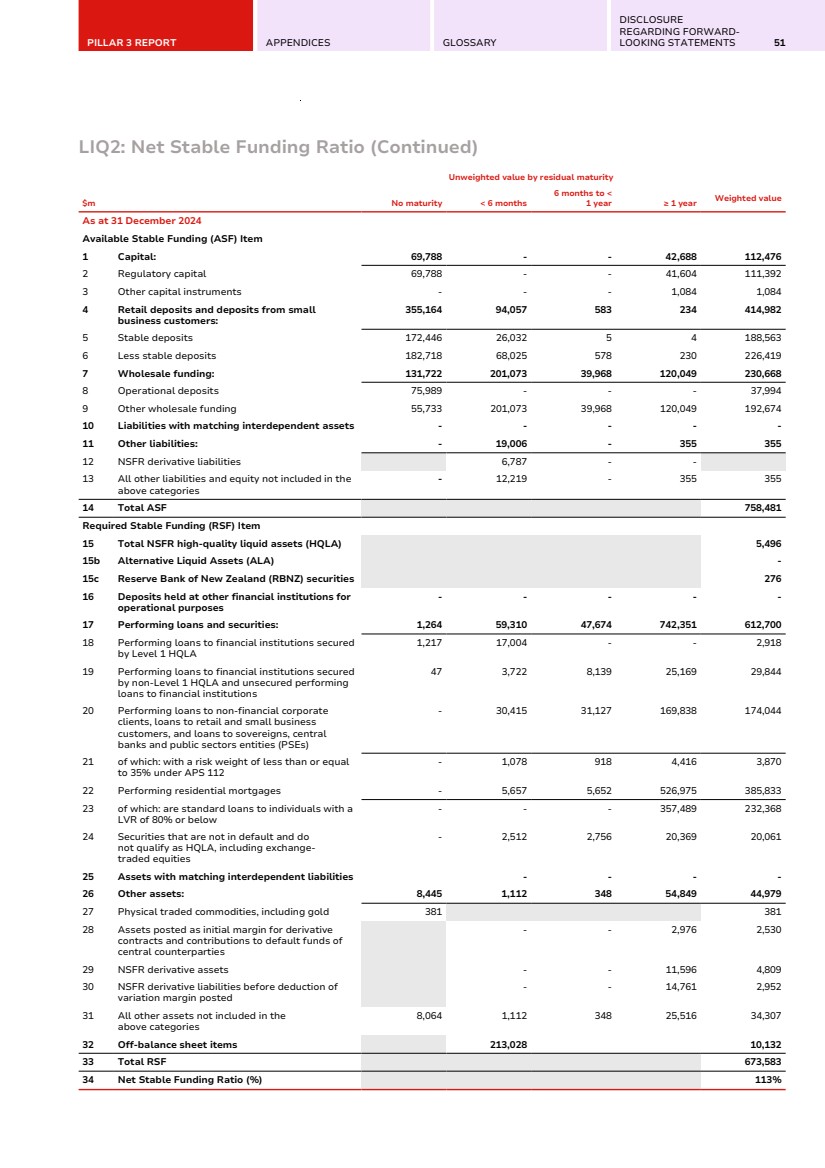
| 52 WESTPAC GROUP MARCH 2025 PILLAR 3 REPORT PRUDENTIAL DISCLOSURE POLICY This report has been prepared in accordance with Westpac's Prudential Disclosure Policy. This policy defines the framework for the preparation of Pillar 3 disclosures in compliance with APRA’s APS 330 requirements. The policy sets out the processes that ensure the appropriateness, accuracy, completeness, consistency and comparability of Westpac's disclosures. It is supported by the Group’s broader risk frameworks, policies, and procedures and has been approved by Westpac's Board. Key features of the policy includes frameworks over: • Accountability and process controls; • The appropriateness of the content contained in the disclosure; • The accuracy and comparability of the disclosure; and • The completeness of the disclosure. Accountability and process controls A standard owner is appointed for each Prudential Standard, and attestation of compliance against their respective standards are provided annually as part of the CPS 220 Risk Management due diligence process. The APS 330 standard owner is responsible for ensuring compliance with APS 330. Standard owners that contribute qualitative and quantitative information required for the Pillar 3 disclosures provide attestations over the accuracy and completeness of the information provided, and the effectiveness of the controls related to their information. The Chief Financial Officer (CFO) is the accountable officer of the Pillar 3 report and authorises its release, under delegation from the Board. The CFO authorisation is based on the processes that underpin the production of the disclosures. In addition to analytical reviews performed by the APS 330 standard owner, each contributing standard owner reviews their respective contribution. Reviews are also performed by senior management, including the CFO, the Chief Risk Officer (CRO), and the Chief Executive Officer (CEO). Prior to any release, the APS 330 standard owner reviews the verification report for completeness, and confirms to the Market Disclosure Officer that the disclosure is suitable for release. Appropriateness of the content The content of the disclosure is subject to review at each reporting period by Senior Management to determine relevance and alignment with the material risks applicable to the business. For risks that are considered material, management ensures that there are clear and comprehensive disclosures on Westpac's risk management appetite, strategy, processes and measurement, which are reported in the annual Pillar 3 report. Accuracy and comparability of disclosure Prior to the submission of information to APRA, the team generating the information conducts a meeting with their respective standard owners and the business to assess accuracy and alignment with their understanding of drivers. In addition to controls over verifications, the APS 330 standard owner (or their delegate) overviews and assesses: • Comparability across other disclosures such as those contain in Westpac's Financial Reports and submissions to APRA; and • The materiality of any matters impacting disclosure brought to their attention and whether adjustments are required. Completeness of disclosure Prior to each reporting period, Westpac completes an assessment of the reporting requirements and updates the report as required, which is approved by the APS 330 standard owner. |
| PILLAR 3 REPORT APPENDICES GLOSSARY DISCLOSURE REGARDING FORWARD-LOOKING STATEMENTS 53 MANAGEMENT'S DECLARATION I hereby certify that the information set out in the document has been prepared in accordance with Westpac's disclosure policy and complying with the requirements of the Australian Prudential Standards, APS 330 Public Disclosure. Michael Rowland Chief Financial Officer Sydney 04 May 2025 |
| 54 WESTPAC GROUP MARCH 2025 PILLAR 3 REPORT APPENDICES APPENDIX I – REGULATORY CAPITAL RECONCILIATION APPENDIX II – LEVEL 3 ENTITIES’ ASSETS AND EQUITY APPENDIX III – REGULATORY EXPECTED LOSS |

| PILLAR 3 REPORT APPENDICES GLOSSARY DISCLOSURE REGARDING FORWARD-LOOKING STATEMENTS 55 APPENDIX I – REGULATORY CAPITAL RECONCILIATION Below is the regulatory capital reconciliation table which shows further details of CC2. $m 31 March 2025 Capital Disclosure Template Reference (CC1) Deferred Tax Assets Total Tax Assets per Group Balance Sheet 2,095 Less: Current tax assets (34) Total Deferred Tax Assets per Group Balance Sheet 2,061 Add: Adjustments required in accordance with APRA prudential standardsa 1,055 Total Deferred Tax Assets after regulatory adjustments 3,116 Less: Amounts below prescribed threshold - risk weighted (3,116) Row 75 Total per Capital Disclosure Template - Deferred Tax Asset - Row 21 / 25 Goodwill and other intangible assets Total Goodwill and Intangibles Assets per level 2 Regulatory Balance Sheet 10,593 Less: Deferred Tax Liability associated with goodwill and other intangible assetsb (284) Less: Capitalised Software Disclosed Under Intangibles (2,434) Row 9 Total per Capital Disclosure Template - Goodwill 7,875 Row 8 Equity Investments Equity Investments in non-consolidated subsidiaries 175 Total Significant Investment in financial entities 175 Row 73 Non-significant Investment in financial entities 145 Row 72 Total Investments in financial institutions 320 Investment in commercial entities 74 Total Equity Investments before applying prescribed threshold 394 Less: Amounts below prescribed threshold (394) Total per Capital Disclosure Template - Equity Investments - Row 18/ 19/ 23 Additional Tier 1 Capital Total Loan Capital per Level 2 Regulatory Balance Sheet 40,703 Less: Tier 2 Capital Instruments Reported Below (30,419) Add: Capitalised Issue Costs for Additional Tier 1 Capital Instrumentsc 46 Less: Fair Value Adjustmentd 83 Total per Capital Disclosure Template - Tier 1 Capital 10,413 Row 36 Additional Tier 1 Capital included in Regulatory Capital USD AT1 securities 1,991 Westpac Capital Notes 5 1,690 Westpac Capital Notes 7 1,723 Westpac Capital Notes 8 1,750 Westpac Capital Notes 9 1,509 Westpac Capital Notes 10 1,750 Total Basel III complying instruments 10,413 Row 30 Total Basel III non complying instruments - Row 33 Total per Capital Disclosure Template - Additional Tier 1 Capital Instruments 10,413 Row 36 a. Represents deferred tax balances associated with reserves ineligible for inclusion in regulatory capital, goodwill and intangibles. b. For the purposes of CC1, Goodwill and other intangibles are presented net of tax. c. Unamortised issue costs relating to capital instruments are netted off against each instrument in the Balance Sheet. For regulatory capital purposes, these capital instruments are shown gross of unamortised issue costs. The unamortised issue costs are deducted from CET1 as part of capitalised expenses in Row 26 in CC1. d. For regulatory capital purposes, APRA requires these instruments to be included as if they were unhedged. |
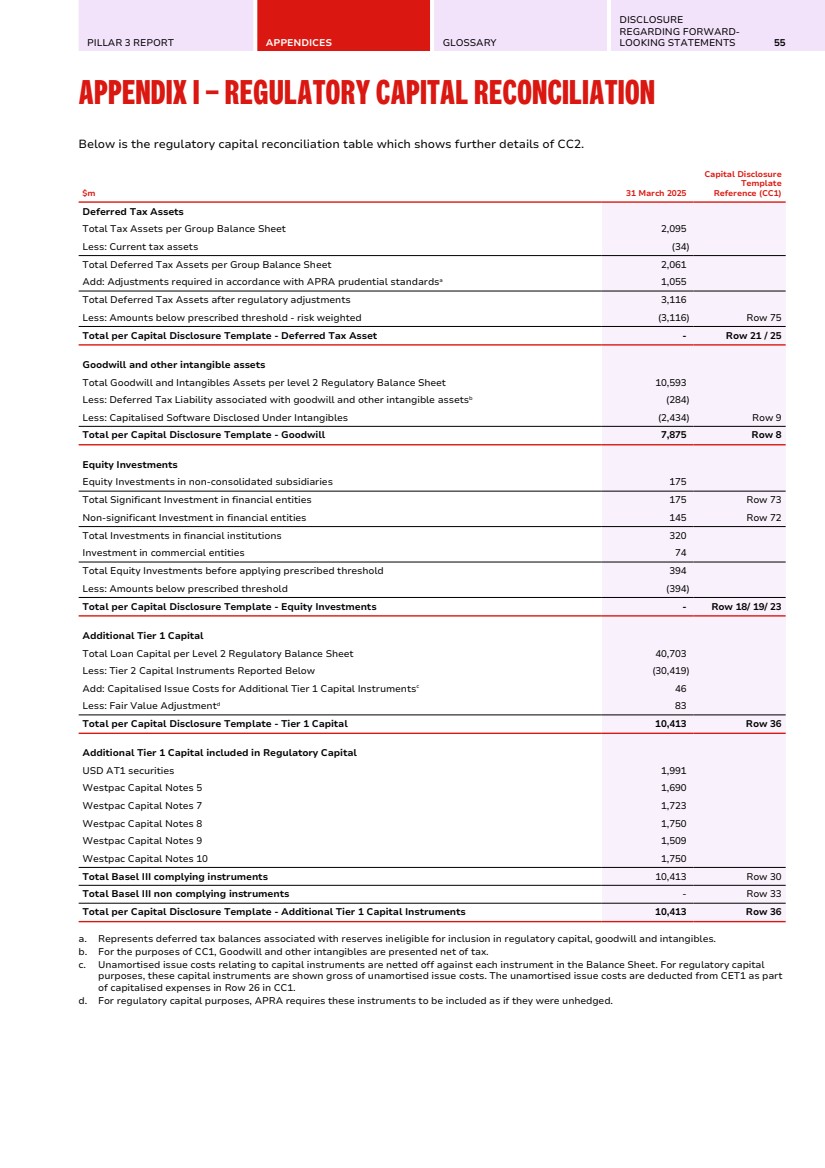
| 56 WESTPAC GROUP MARCH 2025 PILLAR 3 REPORT APPENDIX I – REGULATORY CAPITAL RECONCILIATION $m 31 March 2025 Capital Disclosure Template Reference (CC1) Tier 2 Capital Total Tier 2 Capital per Level 2 Regulatory Balance Sheet 30,419 Add: Capitalised Issue Costs for Tier 2 Capital Instrumentsa 57 Less: Fair Value Adjustmentb 2,343 Less: Cumulative amortisation of Tier 2 Capital Instrumentsc (256) Less: Loan capital not recognised for APRA purposes (1,032) Less: Basel III transitional adjustment - Provisions 729 Row 50 / 76 / 78 Total per Capital Disclosure Template - Tier 2 32,260 Row 51 Tier 2 Capital included in Regulatory Capital USD 100 million Westpac Subordinated Notes 159 JPY 20,000 million Westpac Subordinated Notes 85 JPY 10,200 million Westpac Subordinated Notes 45 JPY 10,000 million Westpac Subordinated Notes 44 USD 1,500 million Westpac Subordinated Notes 2,387 AUD 185 million Westpac Subordinated Notes 185 AUD 130 million Westpac Subordinated Notes 130 USD 1,000 million Westpac Subordinated Notes 1,591 USD 1,250 million Westpac Subordinated Notes 1,989 USD 1,000 million Westpac Subordinated Notes 1,591 USD 1,500 million Westpac Subordinated Notes 2,387 AUD 1,250 million Westpac Subordinated Notes 1,250 EUR 1,000 million Westpac Subordinated Notes 1,725 USD 1,000 million Westpac Subordinated Notes 1,591 USD 1,250 million Westpac Subordinated Notes 1,989 JPY 26,000 million Westpac Subordinated Notes 277 USD 1,000 million Westpac Subordinated Notes 1,591 SGD 450 million Westpac Subordinated Notes 534 AUD 1,500 million Westpac Subordinated Notes 1,500 AUD 300 million Westpac Subordinated Notes 300 AUD 1,100 million Westpac Subordinated Notes 1,100 AUD 1,500 million Westpac Subordinated Notes 1,500 USD 750 million Westpac Subordinated Notes 1,194 AUD 650 million Westpac Subordinated Notes 650 AUD 600 million Westpac Subordinated Notes 600 AUD 500 million Westpac Subordinated Notes 500 AUD 1,000 million Westpac Subordinated Notes 1,000 USD 1,500 million Westpac Subordinated Notes 2,387 AUD 850 million Westpac Subordinated Notes 850 AUD 400 million Westpac Subordinated Notes 400 Total Basel III complying instruments 31,531 Row 46 Total Basel III non complying instruments after transitional adjustment - Row 47 Provisions 729 Row 50 / 76 / 78 Total per Capital Disclosure Template - Tier 2 Capital Instruments 32,260 Row 51 Accumulated Other Comprehensive Income (and other reserves) Total reserves per Level 2 Regulatory Balance Sheet 1,807 Less: Share Based Payment Reserve not included within capital (31) Total per Capital Disclosure Template - Accumulated Other Comprehensive Income (and other reserves) 1,776 Row 3 Non-controlling interests Non-controlling interests per Level 2 Regulatory Balance Sheet 338 Less: Ineligible Non-controlling interests (339) Add: Surplus capital attributable to minority shareholders 4 Total per Capital Disclosure Template - Ordinary share capital issued by subsidiaries and held by third parties (amount allowed in group CET1) 3 Row 5 a. Unamortised issue costs relating to capital instruments are netted off against each instrument in the Balance Sheet. For regulatory capital purposes, these capital instruments are shown gross of unamortised issue costs. The unamortised issue costs are deducted from CET1 as part of capitalised expenses in Row 26 in CC1. b. For regulatory capital purposes, APRA requires these instruments to be included as if they were unhedged. c. APRA requires these instruments to be amortised by 20% of the original amount during each of the last five years to maturity. |
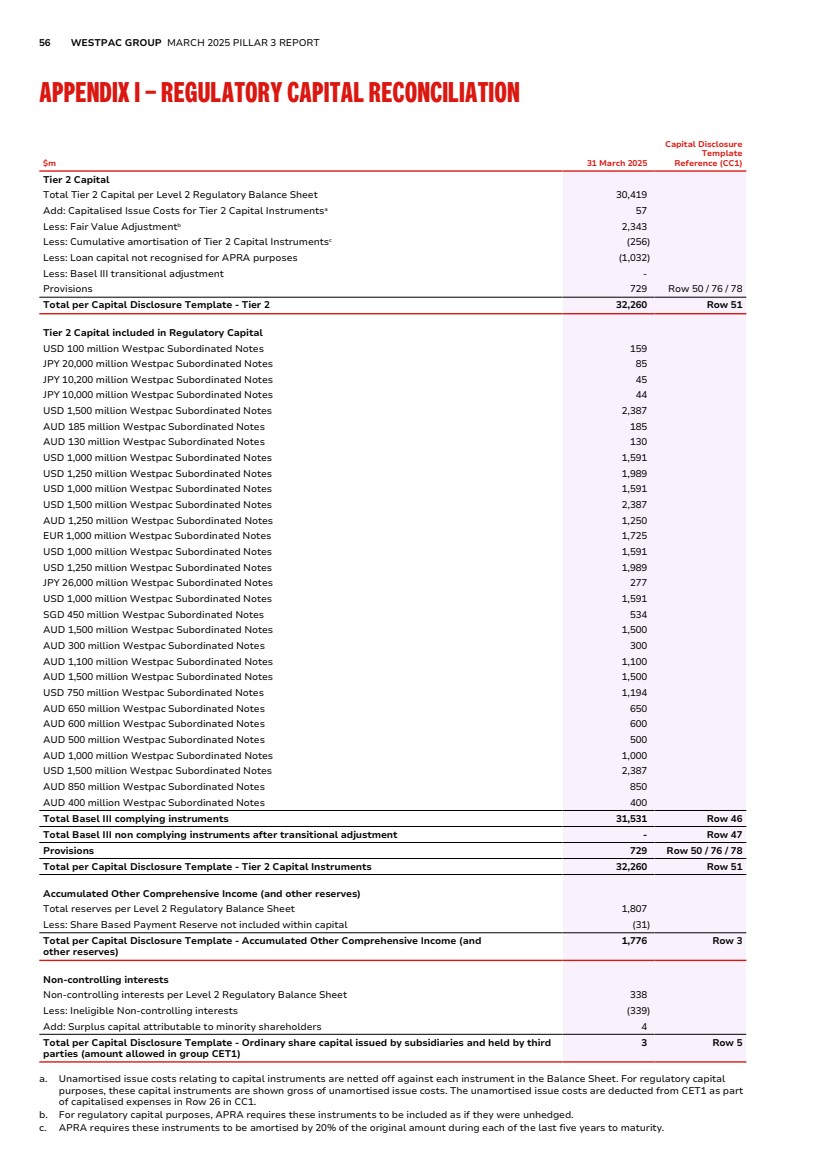
| PILLAR 3 REPORT APPENDICES GLOSSARY DISCLOSURE REGARDING FORWARD-LOOKING STATEMENTS 57 APPENDIX II – LEVEL 3 ENTITIES’ ASSETS AND EQUITY The following legal entities are excluded from the regulatory scope of consolidation. The total assets and equities should not be aggregated, as they are inclusive of inter-company balances and some of the entities are holding companies for other entities in the table shown below. 31 March 2025 Principal activity Total assets ($m) Total equity ($m) Asgard Capital Management Ltd Funds administrator 55 44 BT Funds Management (NZ) Limited Funds management 61 50 BT Funds Management Limited Registrable Superannuation Entity Licensee and Trustee 258 57 BT Funds Management No. 2 Limited Responsible Entity 10 9 BT Portfolio Services Ltd Funds administrator 129 68 GIS Private Nominees Pty Limited Investment services 26 23 Healthpoint Claims Pty. Limited Electronic health claims processing 40 39 Hyde Potts Insurance Services Pte. Limited Insurance 77 65 Magnitude Group Pty Ltd Dormant 4 4 Pendal Short Term Income Fund Trust 194 - Red Bird Ventures Limited Venture capital investments 11 11 Reinventure Fund, I.L.P. Venture capital investments 76 65 Reinventure Fund II I.L.P. Venture capital investments 87 86 Reinventure Fund III I.L.P Venture capital investments 80 79 Reinventure Special Purpose Investment Unit Trust Venture capital investments 39 39 Securitor Financial Group Pty Limited Dormant 3 3 Waratah Receivables Corporation Pty Limited Dormant - - Westpac Financial Services Limited Responsible Entity 26 16 Westpac New Zealand Staff Superannuation Scheme Trustee Limited Trustee - - Westpac RE Pty Limited Dormant 9 9 Westpac Securities Administration Limited Dormant 6 6 |
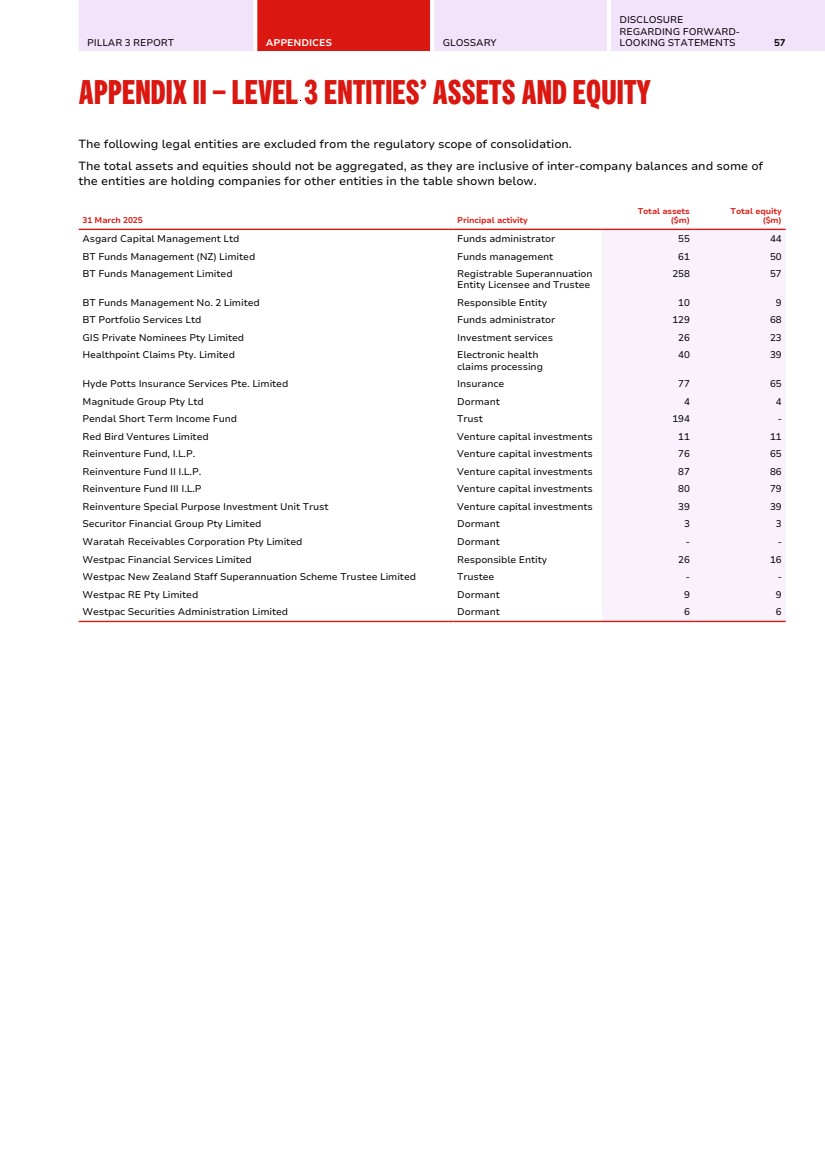
| 58 WESTPAC GROUP MARCH 2025 PILLAR 3 REPORT APPENDIX III – REGULATORY EXPECTED LOSS Capital deduction for regulatory expected loss For capital adequacy purposes APRA requires the amount of regulatory expected credit losses in excess of eligible provisions to be deducted from capital. The following table shows how the deduction is calculated. 31 March 30 September 31 March $m 2025 2024 2024 Provisions associated with eligible portfolios Total provisions for impairment charges 5,072 5,096 5,135 plus provisions associated with partial write-offs 297 290 288 less ineligible provisionsa (197) (201) (221) Total eligible provisions 5,172 5,185 5,202 Regulatory expected downturn loss 4,504 4,486 4,383 Excess/(shortfall) in eligible provisions compared to regulatory expected downturn loss 668 699 819 Common equity Tier 1 capital deduction for regulatory expected downturn loss in excess of eligible provisionsb - - - a. Provisions associated with portfolios subject to the Basel standardised approach to credit risk are not eligible. b. Regulatory expected loss is calculated for portfolios subject to the IRB approach to credit risk. The comparison between regulatory expected loss and eligible provisions is performed separately for defaulted and non-defaulted exposures. |
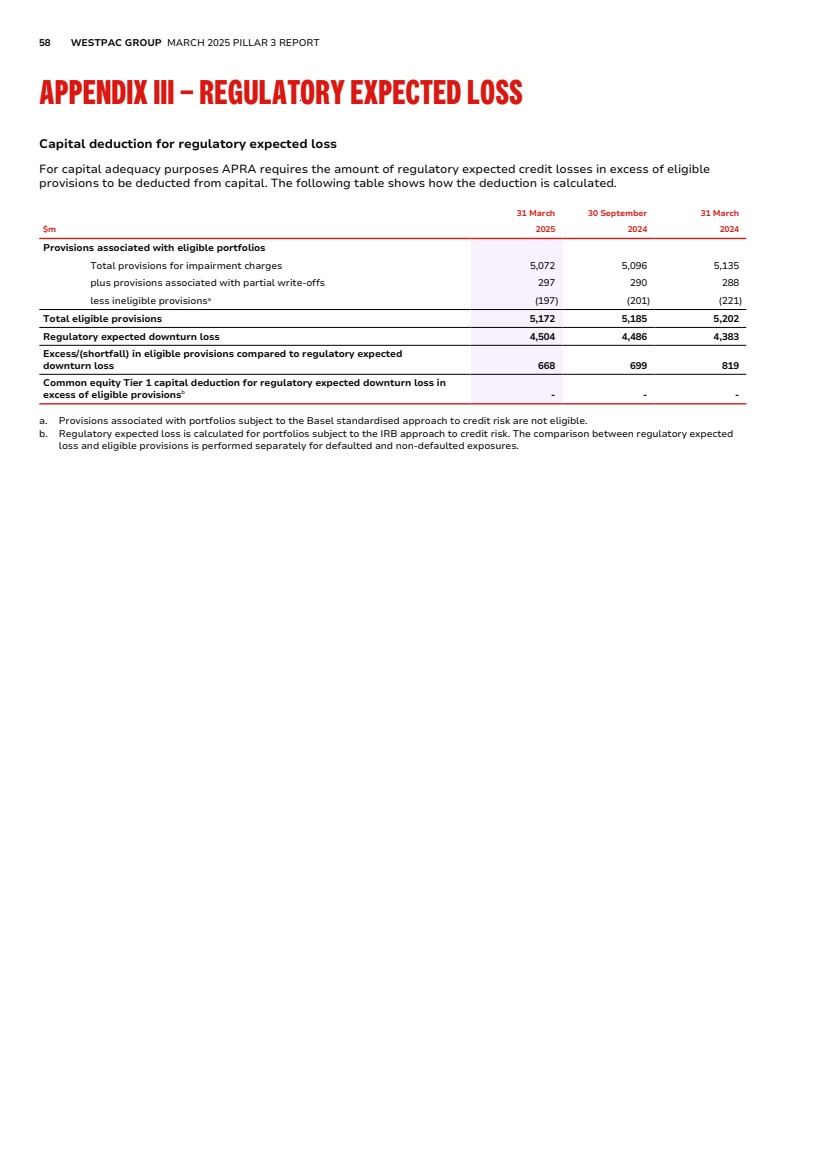
| PILLAR 3 REPORT APPENDICES GLOSSARY DISCLOSURE REGARDING FORWARD-LOOKING STATEMENTS 59 GLOSSARY |

| 60 WESTPAC GROUP MARCH 2025 PILLAR 3 REPORT GLOSSARY Capital Adequacy Description Additional Tier 1 capital (AT1) Comprises high quality components of capital that provide a permanent and unrestricted commitment of funds that are freely available to absorb losses but rank behind claims of depositors and other more senior creditors. They also provide for fully discretionary capital distributions. Common equity Tier 1 (CET1) capital The highest form of capital. The key components of common equity are shares, retained earnings and undistributed current year earnings. Internal Ratings-Based approach (IRB & A-IRB) These approaches allow banks to use internal estimates of the risks of their loans as inputs into the determination of the amount of credit risk capital needed to support the organisation. In the Advanced IRB (A-IRB) approach, banks must supply their own estimates for all three credit parameters – probability of default, loss given default and exposure at default. Leverage ratio The leverage ratio is defined by APRA as Tier 1 capital divided by the “Exposure measure” and is expressed as a percentage. “Exposure measure” includes on-balance sheet exposures, derivatives exposures, securities financing transaction (SFT) exposures, and other off-balance sheet exposures. Risk weighted assets (RWA) Assets (both on and off-balance sheet) are risk weighted according to each asset’s inherent potential for default and what the likely losses would be in case of default. In the case of non-asset backed risks (i.e. market, IRRBB and operational risk), RWA is determined by multiplying the capital requirements for those risks by 12.5. Securities financing transactions (SFT) APRA defines SFTs as “transactions such as repurchase agreements, reverse repurchase agreements, and security lending and borrowing, and margin lending transactions, where the value of the transactions depends on the market valuation of securities and the transactions are typically subject to margin agreements.” Tier 2 capital Includes other capital elements, which, to varying degrees, fall short of the quality of Tier 1 capital but still contribute to the overall strength of an entity as a gone concern capital. Funding and liquidity Alternative Liquid Assets (ALA) Assets that qualify for inclusion in the numerator of the LCR in jurisdictions where there is insufficient supply of HQLA. High-quality liquid assets (HQLA) Assets which meet APRA’s criteria for inclusion as HQLA in the numerator of the LCR. Liquidity coverage ratio (LCR) An APRA requirement to maintain an adequate level of unencumbered high-quality liquid assets, to meet liquidity needs for a 30 calendar day period under an APRA-defined severe stress scenario. Absent a situation of financial stress, the value of the LCR must not be less than 100%. LCR is calculated as the percentage ratio of stock of HQLA, and qualifying RBNZ securities over the total net cash out-flows in a modelled 30 day defined stressed scenario. Maturity The maturity date used is drawn from the contractual maturity date of the customer loans. Net cash outflows (NCO) Total expected cash outflows minus total expected cash inflows in the specified LCR stress scenario calculated in accordance with APRA’s liquidity standard. Net Stable Funding Ratio (NSFR) The NSFR is defined as the ratio of the amount of available stable funding (ASF) to the amount of required stable funding (RSF) defined by APRA. The amount of ASF is the portion of an ADI’s capital and liabilities expected to be a reliable source of funds over a one year time horizon. The amount of RSF is a function of the liquidity characteristics and residual maturities of an ADI’s assets and off-balance sheet activities. ADI’s must maintain an NSFR of at least 100%. Credit Risk Description Credit valuation adjustment (CVA) risk The risk of mark-to-market losses related to deterioration in the credit quality of a derivative counterparty also referred to as credit valuation adjustment (CVA) risk. Default From 1 January 2023: Refer to Non-Performing Exposures definition. Expected credit loss (ECL) Expected credit losses are a probability-weighted estimate of the cash shortfalls expected to result from defaults over the relevant time frame. They are determined by evaluating a range of possible outcomes and taking into account the time value of money, past events, current conditions and forecasts of future economic conditions. Exposure at default (EAD) EAD is calculated at facility level and includes outstandings as well as the proportion of committed undrawn that is expected to be drawn in the event of a future default. Industry Exposures to businesses, government and other financial institutions are classified into industry clusters based upon groups of related ANZSIC codes. Companies that operate in multiple industries are classified according to their primary industry. Consumer customers as classified as “retail” and not further broken down. Non-Performing exposures Credit default exposures, the initial recognition of which under APS 220 occurs where either one, or both, of the following has happened: • Westpac considers that the borrower is unlikely to pay its credit obligations to Westpac in full, and without recourse to actions such as realising available security; • the borrower is 90 days or more past-due on a credit obligation to Westpac. Probability of default (PD) Probability of default is a through-the-cycle assessment of the likelihood of a customer defaulting on its financial obligations within one year. |
| PILLAR 3 REPORT APPENDICES GLOSSARY DISCLOSURE REGARDING FORWARD-LOOKING STATEMENTS 61 Securitisation Description Banking book The banking book includes all securities that are not actively traded by Westpac. Off-balance sheet exposure Credit exposures arising from facilities that are not recorded on Westpac's balance sheet (under accounting methodology). Undrawn commitments and the expected future exposure calculated for Westpac's derivative products are included in off-balance sheet exposure. On-balance sheet exposure Credit exposures arising from facilities that are recorded on Westpac's balance sheet (under accounting methodology). Sponsor An ADI would generally be considered a sponsor if it, in fact or substance, manages or advises the securitisation program, places securities into the market, or provides liquidity and/or credit enhancements. Synthetic securitisation A securitisation whereby the credit risk, or part of the credit risk, of a pool is transferred to a third party which need not be an SPV. The transfer of credit risk can be undertaken through the use of funded (e.g. credit linked notes) or unfunded (e.g. credit default swaps) credit derivatives or guarantees. Trading book Trading book activity represents positions in financial instruments, including derivative products and other off-balance sheet instruments, that are held either with trading intent or to hedge other elements of the trading book. Market Risk Risks-not-in-VaR (RNIV) The RNIV framework is a component of APRA’s APS 116 internal model approach for market risk regulatory capital. Value at risk (VaR) VaR is a measure of the potential loss in economic value arising from adverse market movements and is calculated over a defined time horizon (typically 1-day or 1-year) at a 99% confidence interval using a minimum of one year of historical data. VaR takes account of all material market variables that may cause a change in the value of the trading portfolio or the banking book including interest rates, foreign exchange rates, price changes, volatility, and the correlation among these variables. Interest rate risk in the banking book Interest rate risk in the banking book (IRRBB) The risk of loss in earnings or economic value in the banking book as a consequence of movements in interest rates. |
| 62 WESTPAC GROUP MARCH 2025 PILLAR 3 REPORT GLOSSARY Other Description AASB Australian Accounting Standards Board ADI Authorised deposit-taking institutions are corporations that are authorised under the Banking Act 1959 to carry on banking business in Australia. A-IRB Advanced Internal Ratings-Based Approach APRA Australian Prudential Regulation Authority APS Australian Prudential Standard ASF Available Stable Funding BRiskC Board Risk Committee CCF Credit Conversion Factor CCP Central counterparty CCR Counterparty Credit Risk CRM Credit Risk Mitigation D-SIB Domestic Systemically Important Bank DTA Deferred tax assets EL Expected losses ELE An extended licensed entity (ELE) comprises an ADI and any subsidiaries of the ADI that have been approved by APRA as being part of a single ‘stand-alone’ entity. EPE Expected Positive Exposure ERBA External Rating Based Approach F-IRB Foundation Internal Ratings-Based Approach G-SIB Global Systemically Important Bank IPRE Income-producing residential real estate LGD Loss given default LVR Loan-to-valuation ratio MSR Mortgage servicing rights NRS Non-Rate Sensitive OF Object finance OTC Over-the-counter PF Project finance QCCPs Qualifying central counterparties RBA Reserve Bank of Australia RBNZ Reserve Bank of New Zealand RC Revaluation Committee RSF Required Stable Funding SA Standardised Approach SA-CCR Standardised Approach for counterparty credit risk SFA Supervisory Formula Approach SMA Standardised Measurement Approach SME Small and medium sized enterprise TLAC Total loss-absorbing capacity WNZL Westpac New Zealand Limited |
| PILLAR 3 REPORT APPENDICES GLOSSARY DISCLOSURE REGARDING FORWARD-LOOKING STATEMENTS 63 DISCLOSURE REGARDING FORWARD-LOOKING STATEMENTS |

| 64 WESTPAC GROUP MARCH 2025 PILLAR 3 REPORT DISCLOSURE REGARDING FORWARD-LOOKING STATEMENTS The information contained in this report contains statements that constitute “forward-looking statements” within the meaning of section 21E of the U.S. Securities Exchange Act of 1934. Forward-looking statements are statements that are not historical facts. Forward-looking statements appear in a number of places in this report and include statements regarding Westpac’s current intent, belief or expectations with respect to its business and operations, macro and micro economic and market conditions, results of operations and financial condition and performance, capital adequacy and liquidity and risk management, including, without limitation, future loan loss provisions and financial support to certain borrowers, forecasted economic indicators and performance metric outcomes, indicative drivers, climate- and other sustainability-related statements, commitments, targets, projections and metrics, and other estimated and proxy data. Words such as ‘will’, ‘may’, ‘expect’, ‘intend’, ‘seek’, ‘would’, ‘should’, ‘could’, ‘continue’, ‘plan’, ‘estimate’, ‘anticipate’, ‘believe’, ‘probability’, ‘indicative’, ‘risk’, ‘aim’, ‘outlook’, ‘forecast’, ‘f’cast’, ‘f’, ‘assumption’, ‘projection’, ‘target,’ goal’, ‘guidance’, 'objective', ‘ambition’ or other similar words, are used to identify forward-looking statements. These statements reflect Westpac’s current views on future events and are subject to change, certain known and unknown risks, uncertainties and assumptions and other factors which are, in many instances, beyond Westpac’s control (and the control of Westpac’s officers, employees, agents, and advisors), and have been made based on management’s and/or the Board's current expectations or beliefs concerning future developments and their potential effect upon Westpac. Forward-looking statements may also be made, verbally or in writing, by members of Westpac’s management or Board in connection with this report. Such statements are subject to the same limitations, uncertainties, assumptions and disclaimers set out in this report. There can be no assurance that future developments or performance will align with Westpac’s expectations or that the effect of future developments on Westpac will be those anticipated. Actual results could differ materially from those Westpac expects or which are expressed or implied in forward-looking statements, depending on various factors including, but not limited to, those described in the section titled ‘Risk factors’ in Westpac’s 2025 Interim Financial Results Announcement. When relying on forward-looking statements to make decisions with respect to Westpac, investors and others relying on information in this report should carefully consider such factors and other uncertainties and events. Except as required by law, Westpac assumes no obligation to revise or update any forward-looking statements in this report, whether from new information, future events, conditions or otherwise, after the date of this report. |

| WESTPAC.COM.AU |