| ASX Release 5 May 2025 Westpac 1H25 Presentation and Investor Discussion Pack Westpac Banking Corporation (Westpac”) today provides the attached Westpac 1H25 Presentation and Investor Discussion Pack. For further information: Hayden Cooper Justin McCarthy Group Head of Media Relations General Manager, Investor Relations 0402 393 619 0422 800 321 This document has been authorised for release by Tim Hartin, Company Secretary. Level 18, 275 Kent Street Sydney, NSW, 2000 |
| 2025 INTERIM FINANCIAL RESULTS FOR THE SIX MONTHS ENDED 31 MARCH 2025 PRESENTATION AND INVESTOR DISCUSSION PACK Westpac Banking Corporation ABN 33 007 457 141 |
| 2 Westpac Group 2025 Interim Results Presentation & Investor Discussion Pack WESTPAC 2025 INTERIM RESULTS INDEX 2025 Interim Results Presentation 3 Investor Discussion Pack 29 Earnings drivers 31 Credit quality and provisions 45 Capital, funding and liquidity 66 Supporting our customers 78 Sustainability 89 Segment results 93 Economics 100 Appendix 106 Contact us 112 Disclaimer 113 |
| ANTHONY MILLER CHIEF EXECUTIVE OFFICER |

| 4 Westpac Group 2025 Interim Results Presentation & Investor Discussion Pack PERFORM SERVICE EXCELLENCE ONE BEST WAY 1H25 HIGHLIGHTS STRONG FOUNDATIONS |
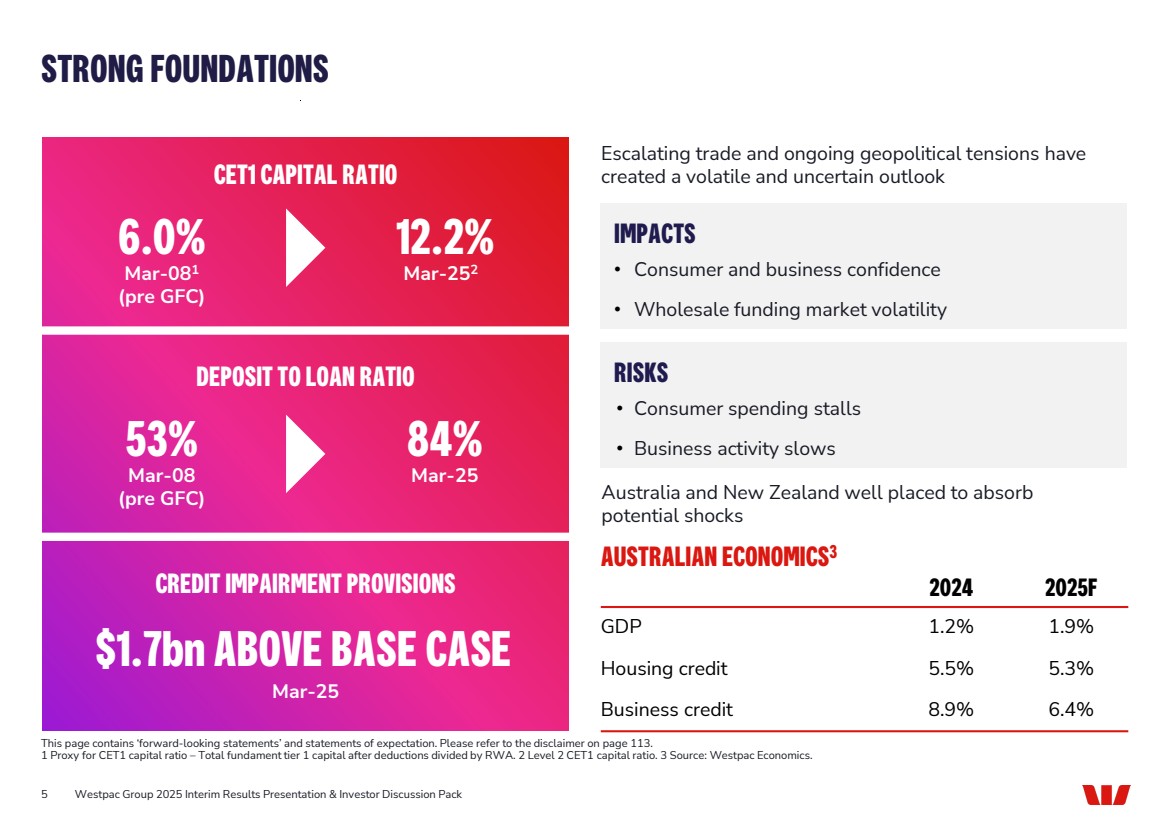
| Escalating trade and ongoing geopolitical tensions have created a volatile and uncertain outlook This page contains ‘forward-looking statements’ and statements of expectation. Please refer to the disclaimer on page 113. 1 Proxy for CET1 capital ratio – Total fundament tier 1 capital after deductions divided by RWA. 2 Level 2 CET1 capital ratio. 3 Source: Westpac Economics. 5 Westpac Group 2025 Interim Results Presentation & Investor Discussion Pack STRONG FOUNDATIONS AUSTRALIAN ECONOMICS3 2024 2025F GDP 1.2% 1.9% Housing credit 5.5% 5.3% Business credit 8.9% 6.4% 6.0% Mar-081 (pre GFC) CET1 CAPITAL RATIO 12.2% Mar-252 53% Mar-08 (pre GFC) DEPOSIT TO LOAN RATIO 84% Mar-25 $1.7bn ABOVE BASE CASE Mar-25 CREDIT IMPAIRMENT PROVISIONS IMPACTS • Consumer and business confidence • Wholesale funding market volatility RISKS • Consumer spending stalls • Business activity slows Australia and New Zealand well placed to absorb potential shocks |
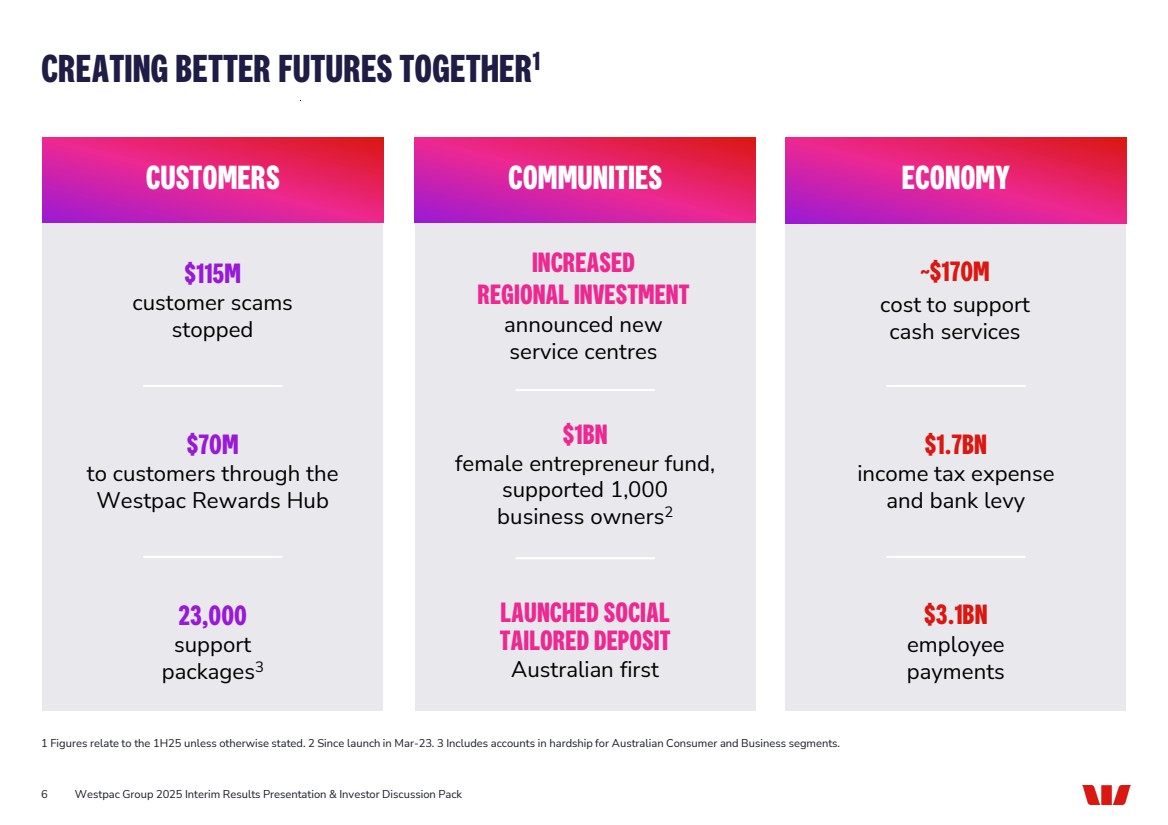
| CREATING BETTER FUTURES TOGETHER1 6 Westpac Group 2025 Interim Results Presentation & Investor Discussion Pack 1 Figures relate to the 1H25 unless otherwise stated. 2 Since launch in Mar-23. 3 Includes accounts in hardship for Australian Consumer and Business segments. CUSTOMERS COMMUNITIES ECONOMY ~$170M cost to support cash services INCREASED REGIONAL INVESTMENT announced new service centres $115M customer scams stopped $1.7BN income tax expense and bank levy $1BN female entrepreneur fund, supported 1,000 business owners2 $3.1BN employee payments 23,000 support packages3 $70M to customers through the Westpac Rewards Hub LAUNCHED SOCIAL TAILORED DEPOSIT Australian first |
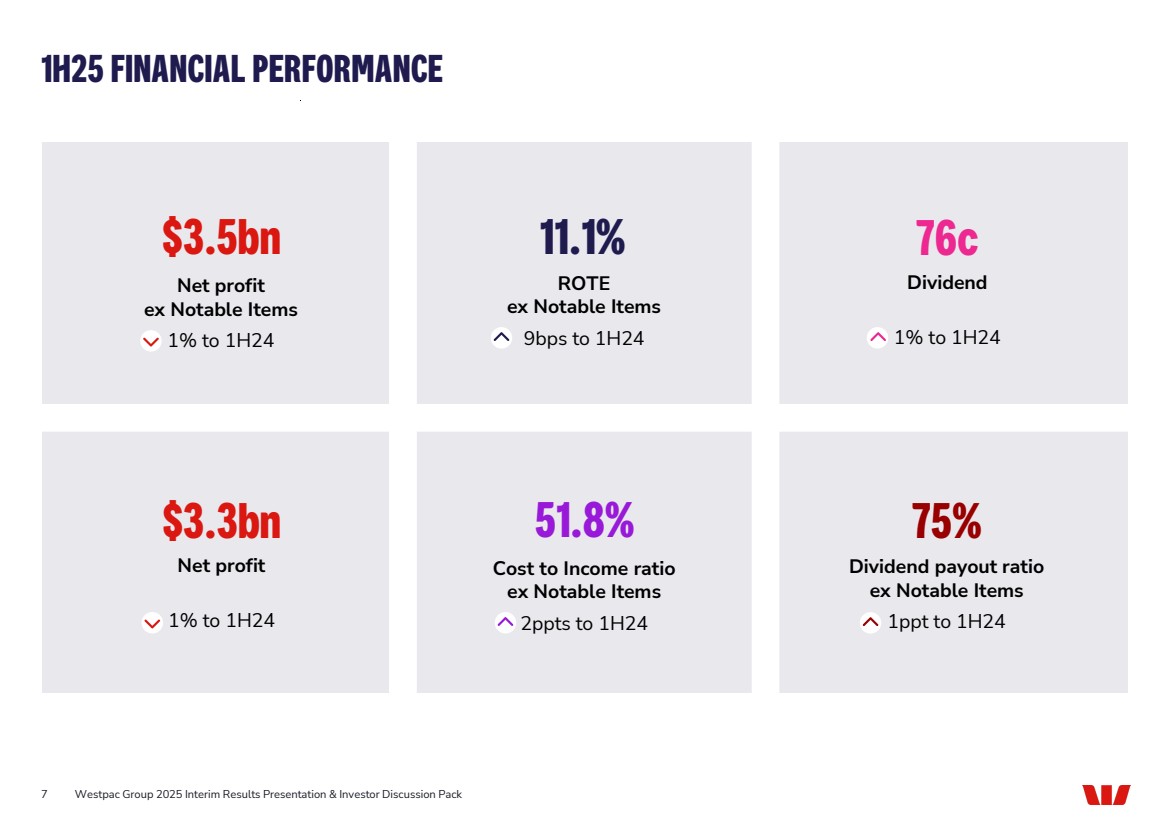
| 1H25 FINANCIAL PERFORMANCE 7 Westpac Group 2025 Interim Results Presentation & Investor Discussion Pack $3.5bn Net profit ex Notable Items 1% to 1H24 $3.3bn Net profit 1% to 1H24 11.1% ROTE ex Notable Items 9bps to 1H24 76c Dividend 1% to 1H24 51.8% Cost to Income ratio ex Notable Items 2ppts to 1H24 75% Dividend payout ratio ex Notable Items 1ppt to 1H24 |
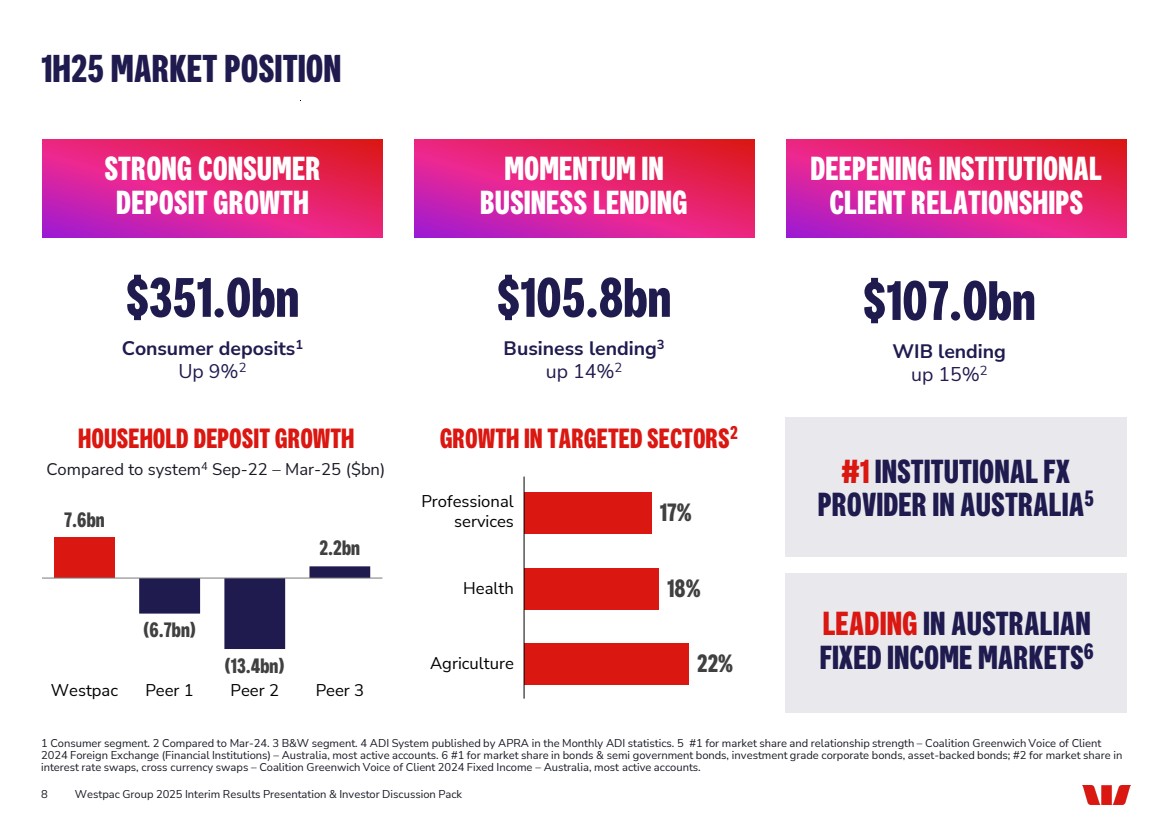
| MOMENTUM IN BUSINESS LENDING 22% 18% 17% $105.8bn Business lending3 up 14%2 8 HOUSEHOLD DEPOSIT GROWTH GROWTH IN TARGETED SECTORS2 Westpac Group 2025 Interim Results Presentation & Investor Discussion Pack 1H25 MARKET POSITION 1 Consumer segment. 2 Compared to Mar-24. 3 B&W segment. 4 ADI System published by APRA in the Monthly ADI statistics. 5 #1 for market share and relationship strength – Coalition Greenwich Voice of Client 2024 Foreign Exchange (Financial Institutions) – Australia, most active accounts. 6 #1 for market share in bonds & semi government bonds, investment grade corporate bonds, asset-backed bonds; #2 for market share in interest rate swaps, cross currency swaps – Coalition Greenwich Voice of Client 2024 Fixed Income – Australia, most active accounts. DEEPENING INSTITUTIONAL CLIENT RELATIONSHIPS $351.0bn Consumer deposits1 Up 9%2 Agriculture Health Professional services Compared to system4 Sep-22 – Mar-25 ($bn) STRONG CONSUMER DEPOSIT GROWTH 7.6bn (6.7bn) (13.4bn) 2.2bn Westpac Peer 1 Peer 2 Peer 3 $107.0bn WIB lending up 15%2 #1 INSTITUTIONAL FX PROVIDER IN AUSTRALIA5 LEADING IN AUSTRALIAN FIXED INCOME MARKETS6 |
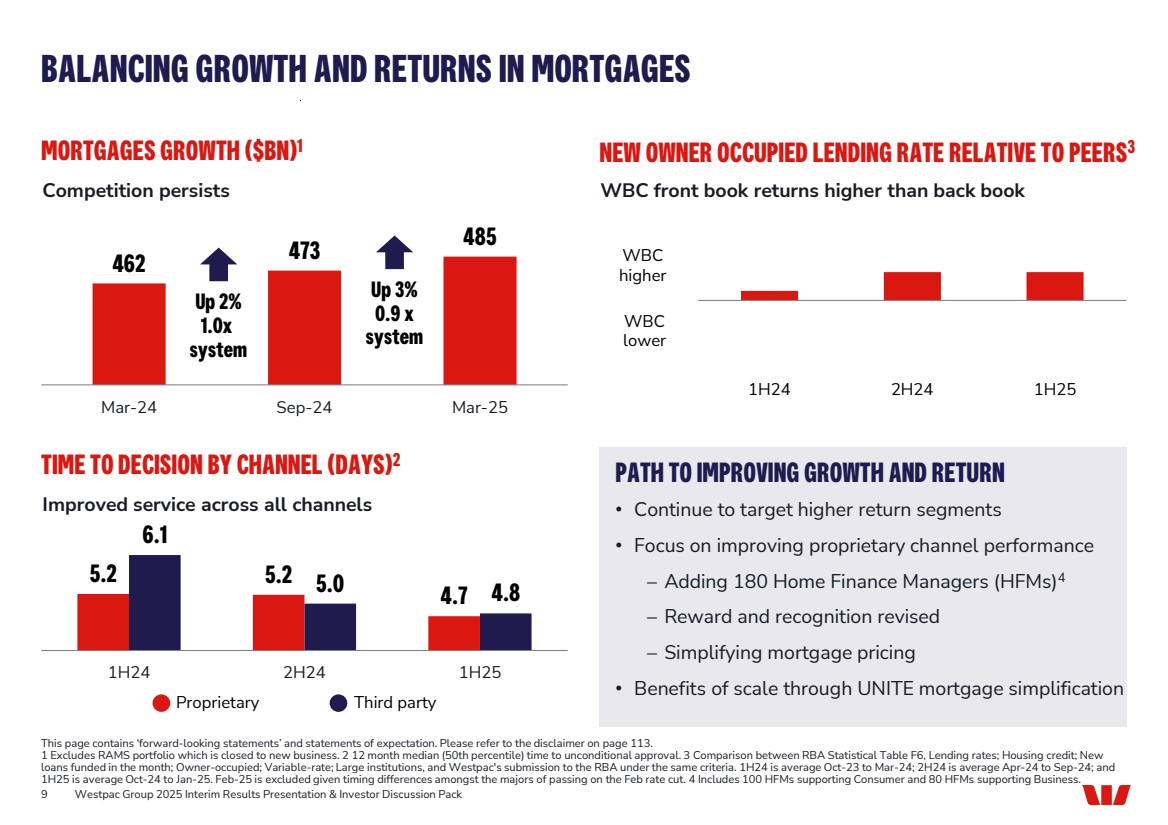
| 1H24 2H24 1H25 9 MORTGAGES GROWTH ($BN)1 462 473 485 Mar-24 Sep-24 Mar-25 NEW OWNER OCCUPIED LENDING RATE RELATIVE TO PEERS3 TIME TO DECISION BY CHANNEL (DAYS)2 PATH TO IMPROVING GROWTH AND RETURN • Continue to target higher return segments • Focus on improving proprietary channel performance − Adding 180 Home Finance Managers (HFMs)4 − Reward and recognition revised − Simplifying mortgage pricing • Benefits of scale through UNITE mortgage simplification Westpac Group 2025 Interim Results Presentation & Investor Discussion Pack BALANCING GROWTH AND RETURNS IN MORTGAGES This page contains ‘forward-looking statements’ and statements of expectation. Please refer to the disclaimer on page 113. 1 Excludes RAMS portfolio which is closed to new business. 2 12 month median (50th percentile) time to unconditional approval. 3 Comparison between RBA Statistical Table F6, Lending rates; Housing credit; New loans funded in the month; Owner-occupied; Variable-rate; Large institutions, and Westpac's submission to the RBA under the same criteria. 1H24 is average Oct-23 to Mar-24; 2H24 is average Apr-24 to Sep-24; and 1H25 is average Oct-24 to Jan-25. Feb-25 is excluded given timing differences amongst the majors of passing on the Feb rate cut. 4 Includes 100 HFMs supporting Consumer and 80 HFMs supporting Business. Up 3% 0.9 x system Up 2% 1.0x system WBC lower WBC higher Competition persists WBC front book returns higher than back book 5.2 5.2 4.7 6.1 5.0 4.8 1H24 2H24 1H25 Improved service across all channels Proprietary Third party |
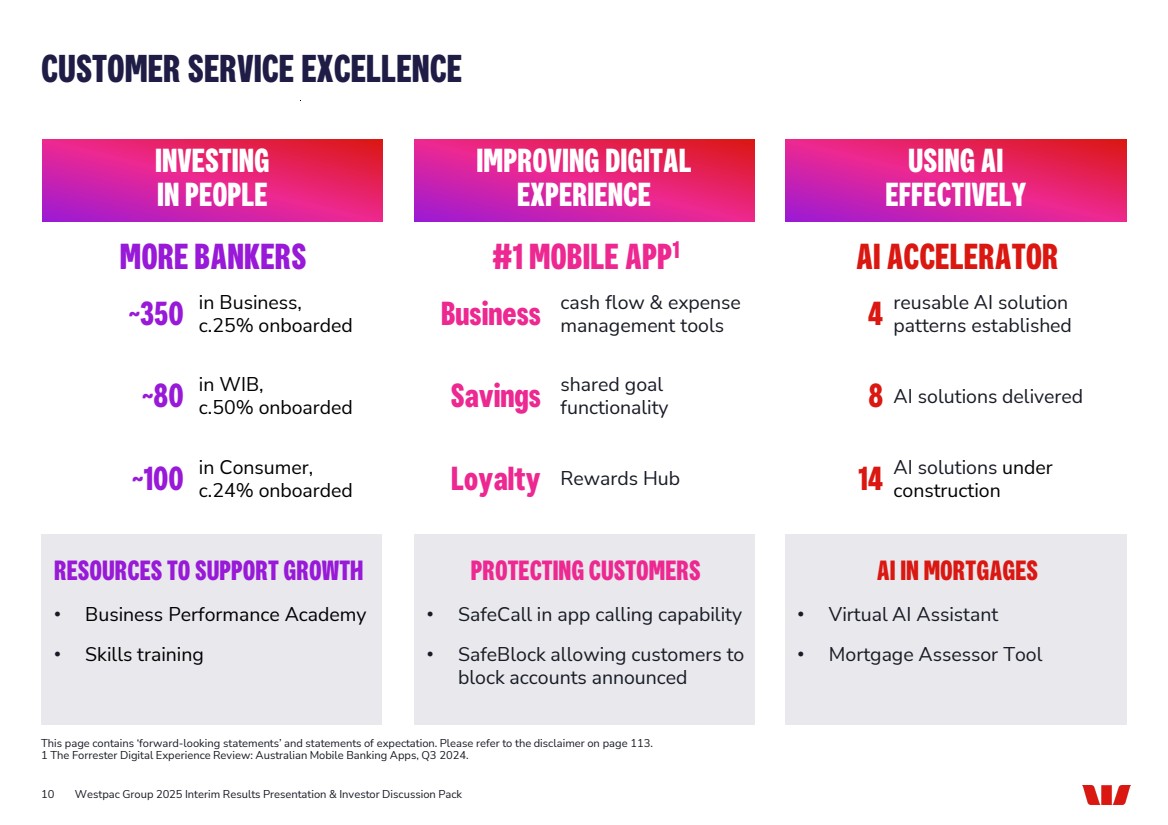
| Business Westpac Group 2025 Interim Results Presentation & Investor Discussion Pack CUSTOMER SERVICE EXCELLENCE This page contains ‘forward-looking statements’ and statements of expectation. Please refer to the disclaimer on page 113. 1 The Forrester Digital Experience Review: Australian Mobile Banking Apps, Q3 2024. 10 INVESTING IN PEOPLE IMPROVING DIGITAL EXPERIENCE USING AI EFFECTIVELY AI IN MORTGAGES • Virtual AI Assistant • Mortgage Assessor Tool RESOURCES TO SUPPORT GROWTH • Business Performance Academy • Skills training PROTECTING CUSTOMERS • SafeCall in app calling capability • SafeBlock allowing customers to block accounts announced ~350 ~80 ~100 cash flow & expense management tools in Business, c.25% onboarded in WIB, c.50% onboarded in Consumer, c.24% onboarded 4 8 14 reusable AI solution patterns established AI solutions delivered AI solutions under construction MORE BANKERS #1 MOBILE APP AI ACCELERATOR 1 Savings shared goal functionality Loyalty Rewards Hub |
| INNOVATING TO SUPPORT SERVICE EXCELLENCE 11 BIZEDGE OBJECTIVE: Fast, simple, digital lending origination experience WESTPAC ONE OBJECTIVE: Leading transaction banking capability with enhanced digital experience for Institutional clients 1H25 ACHIEVEMENTS: • Connected to the Australian payments network – key project milestone • Project delivery on track Westpac Group 2025 Interim Results Presentation & Investor Discussion Pack 1 Personal Property Securities Register. 2 National Credit Code. 1H25 ACHIEVEMENTS: • Rollout commenced in Mar-25 • Features: − Quick and easy log in − Automated company and PPSR1 searches − Built in NCC2 assessment − Real time application tracking • Benefits: − Saves bankers up to 60 mins per loan application − Reduces customer input by 50% |

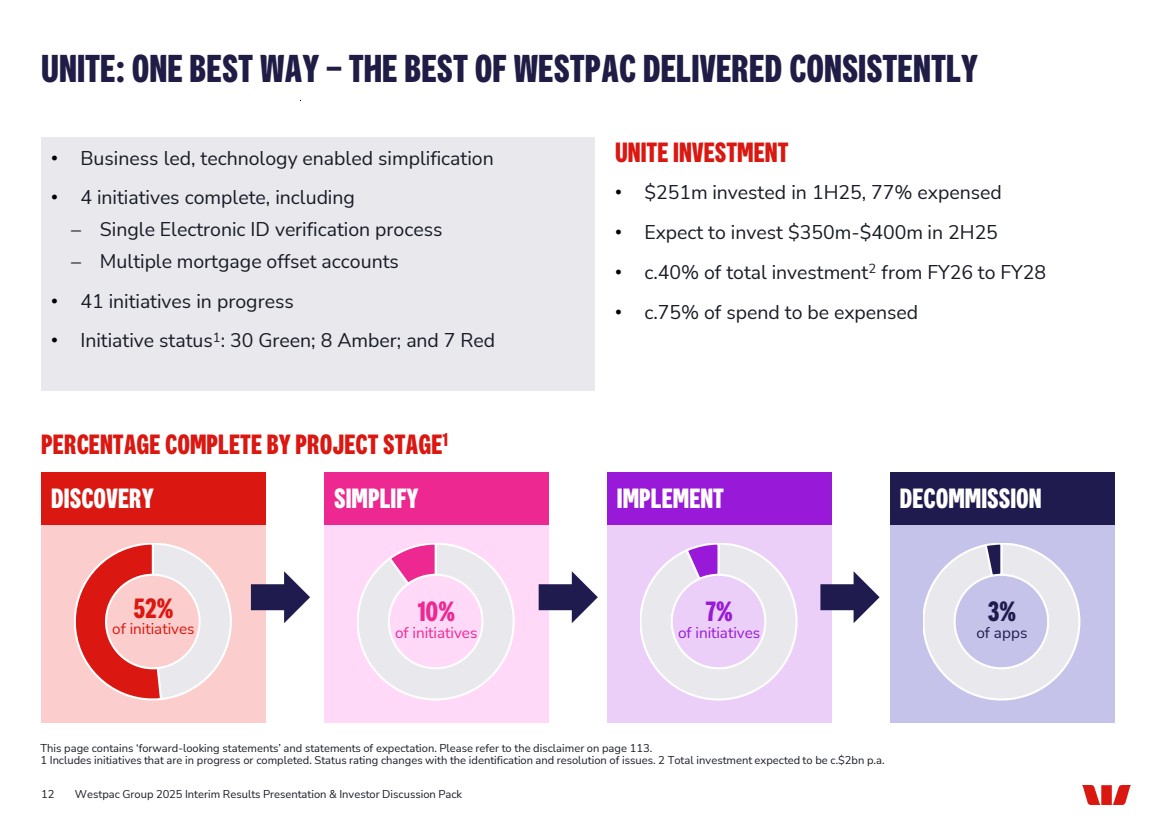
| 12 PERCENTAGE COMPLETE BY PROJECT STAGE1 • Business led, technology enabled simplification • 4 initiatives complete, including − Single Electronic ID verification process − Multiple mortgage offset accounts • 41 initiatives in progress • Initiative status1: 30 Green; 8 Amber; and 7 Red UNITE INVESTMENT • $251m invested in 1H25, 77% expensed • Expect to invest $350m-$400m in 2H25 • c.40% of total investment2 from FY26 to FY28 • c.75% of spend to be expensed Westpac Group 2025 Interim Results Presentation & Investor Discussion Pack UNITE: ONE BEST WAY – THE BEST OF WESTPAC DELIVERED CONSISTENTLY This page contains ‘forward-looking statements’ and statements of expectation. Please refer to the disclaimer on page 113. 1 Includes initiatives that are in progress or completed. Status rating changes with the identification and resolution of issues. 2 Total investment expected to be c.$2bn p.a. 7% of initiatives SIMPLIFY IMPLEMENT 10% of initiatives DECOMMISSION 3% of apps DISCOVERY 52% of initiatives |
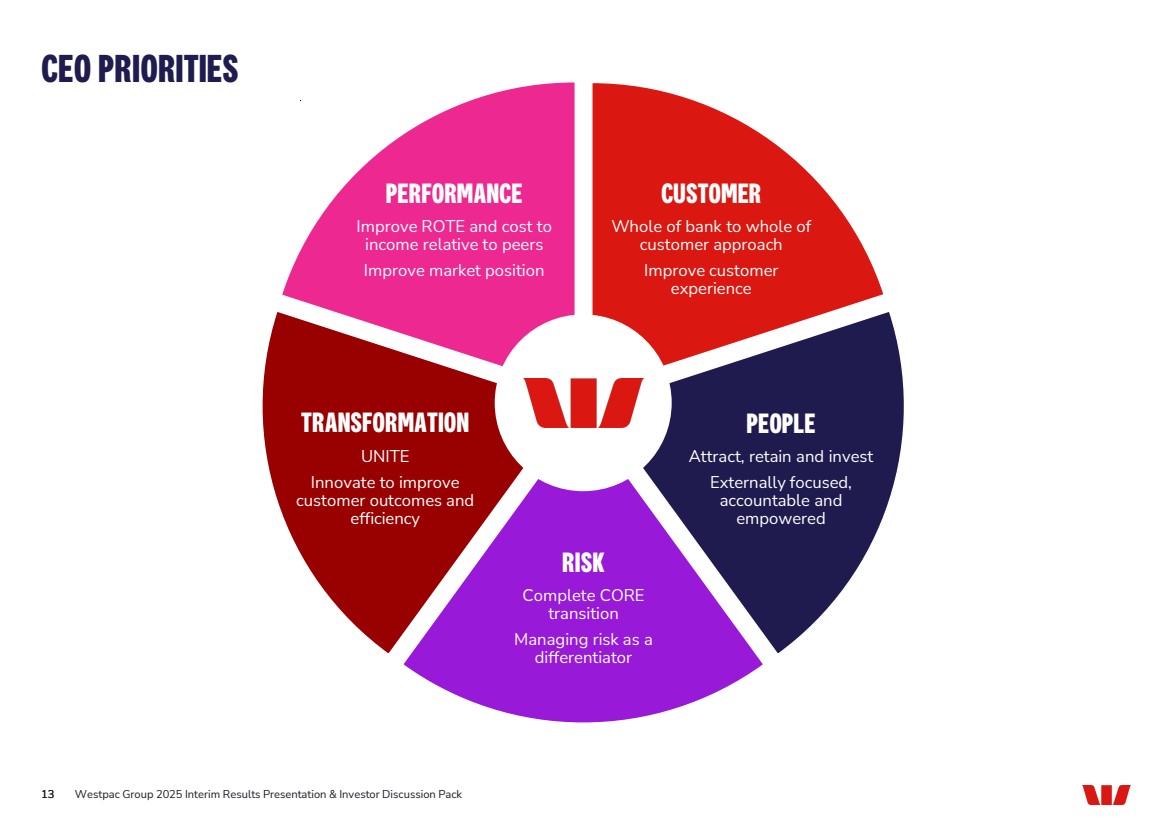
| CEO PRIORITIES 13 Westpac Group 2025 Interim Results Presentation & Investor Discussion Pack PERFORMANCE Improve ROTE and cost to income relative to peers Improve market position CUSTOMER Whole of bank to whole of customer approach Improve customer experience PEOPLE Attract, retain and invest Externally focused, accountable and empowered TRANSFORMATION UNITE Innovate to improve customer outcomes and efficiency RISK Complete CORE transition Managing risk as a differentiator |
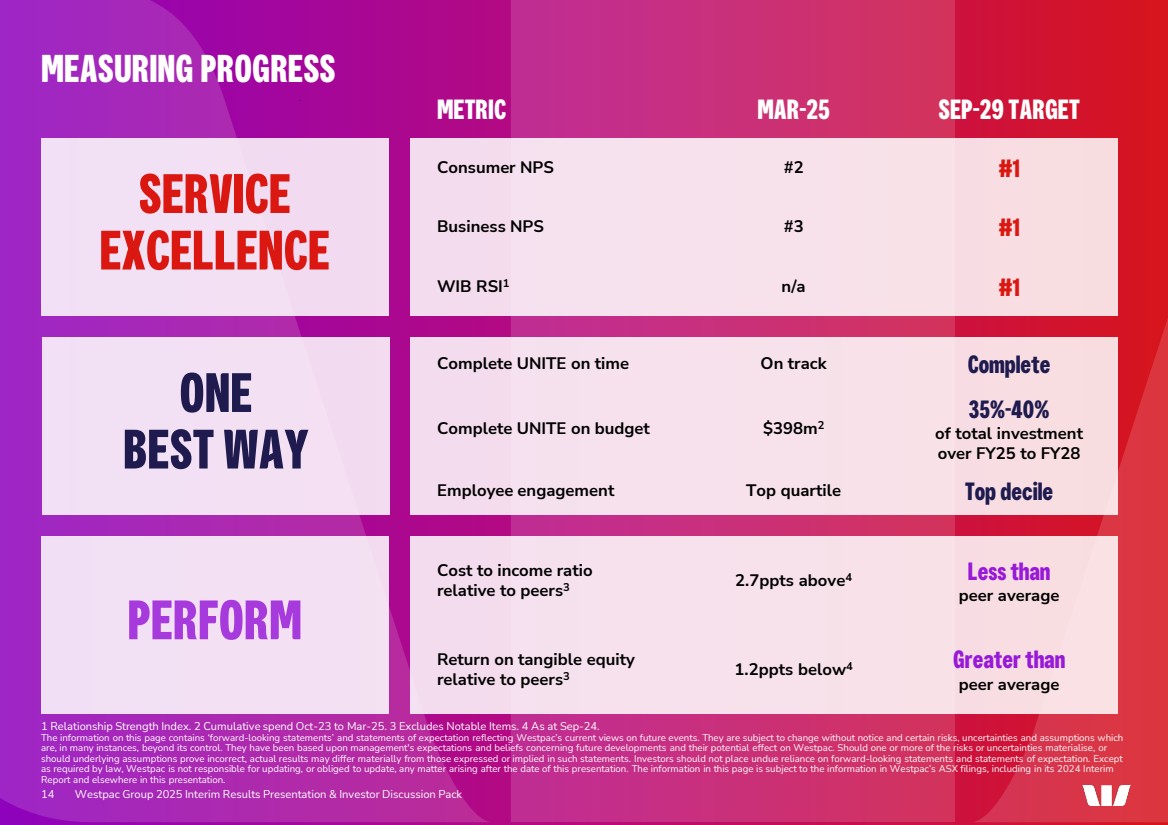
| PERFORM 14 Westpac Group 2025 Interim Results Presentation & Investor Discussion Pack 1 Relationship Strength Index. 2 Cumulative spend Oct-23 to Mar-25. 3 Excludes Notable Items. 4 As at Sep-24. The information on this page contains ‘forward-looking statements’ and statements of expectation reflecting Westpac’s current views on future events. They are subject to change without notice and certain risks, uncertainties and assumptions which are, in many instances, beyond its control. They have been based upon management's expectations and beliefs concerning future developments and their potential effect on Westpac. Should one or more of the risks or uncertainties materialise, or should underlying assumptions prove incorrect, actual results may differ materially from those expressed or implied in such statements. Investors should not place undue reliance on forward-looking statements and statements of expectation. Except as required by law, Westpac is not responsible for updating, or obliged to update, any matter arising after the date of this presentation. The information in this page is subject to the information in Westpac’s ASX filings, including in its 2024 Interim Report and elsewhere in this presentation. SERVICE EXCELLENCE ONE BEST WAY METRIC MAR-25 SEP-29 TARGET Consumer NPS #2 #1 Business NPS #3 #1 WIB RSI1 n/a #1 Complete UNITE on time On track Complete Complete UNITE on budget $398m2 35%-40% of total investment over FY25 to FY28 Employee engagement Top quartile Top decile Cost to income ratio relative to peers3 2.7ppts above4 Less than peer average Return on tangible equity relative to peers3 1.2ppts below4 Greater than peer average MEASURING PROGRESS |
| MICHAEL ROWLAND CHIEF FINANCIAL OFFICER |

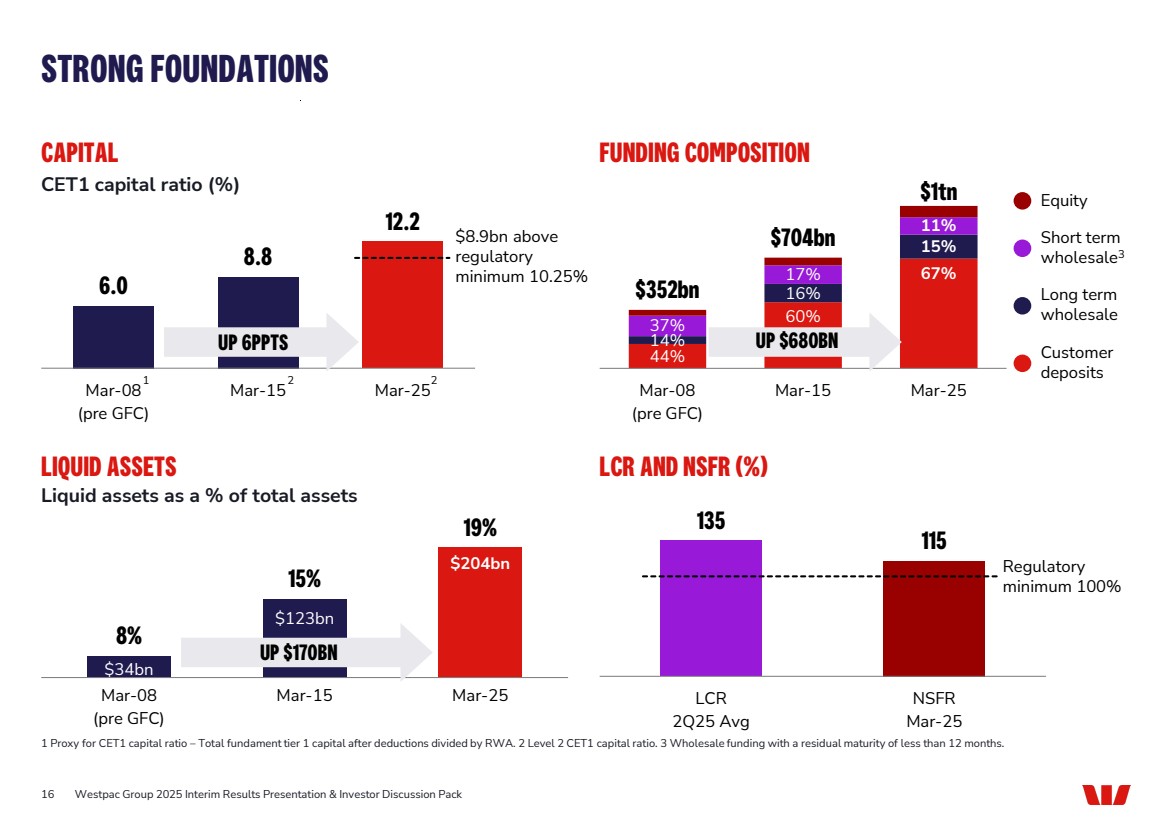
| 44% 60% 67% 14% 16% 15% 37% 17% 11% $352bn $704bn $1tn Mar-08 (pre GFC) Mar-15 Mar-25 16 CAPITAL 6.0 8.8 12.2 Mar-08 (pre GFC) Mar-15 Mar-25 LIQUID ASSETS LCR AND NSFR (%) Westpac Group 2025 Interim Results Presentation & Investor Discussion Pack STRONG FOUNDATIONS 1 Proxy for CET1 capital ratio – Total fundament tier 1 capital after deductions divided by RWA. 2 Level 2 CET1 capital ratio. 3 Wholesale funding with a residual maturity of less than 12 months. CET1 capital ratio (%) $34bn $123bn $204bn 8% 15% 19% Mar-08 (pre GFC) Mar-15 Mar-25 Liquid assets as a % of total assets Equity Short term wholesale3 Long term wholesale Customer deposits FUNDING COMPOSITION 135 115 LCR 2Q25 Avg NSFR Mar-25 Regulatory minimum 100% $8.9bn above regulatory minimum 10.25% 1 2 UP 6PPTS UP $680BN 2 UP $170BN |
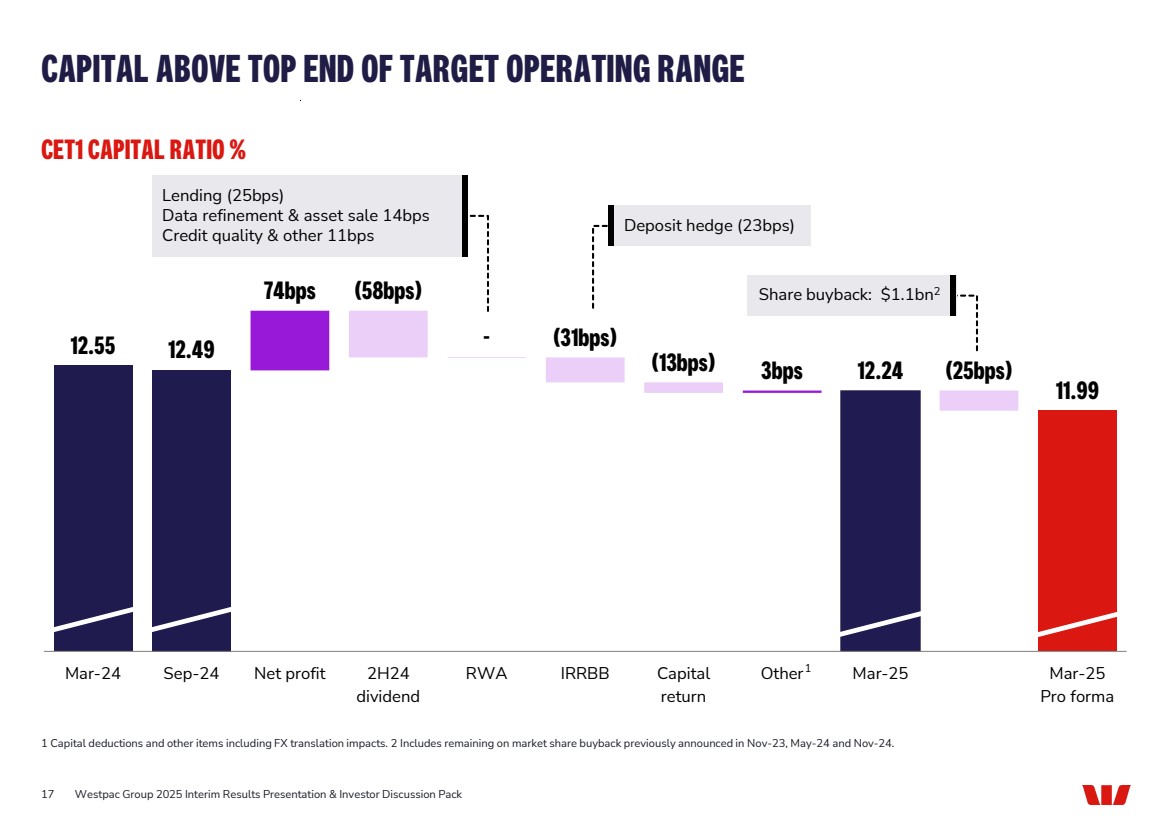
| 12.55 12.49 74bps - 3bps 12.24 11.99 (58bps) (31bps) (13bps) (25bps) Mar-24 Sep-24 Net profit 2H24 dividend RWA IRRBB Capital return Other Mar-25 Mar-25 Pro forma CAPITAL ABOVE TOP END OF TARGET OPERATING RANGE 17 1 Capital deductions and other items including FX translation impacts. 2 Includes remaining on market share buyback previously announced in Nov-23, May-24 and Nov-24. 1 Deposit hedge (23bps) Share buyback: $1.1bn2 CET1 CAPITAL RATIO % Westpac Group 2025 Interim Results Presentation & Investor Discussion Pack Lending (25bps) Data refinement & asset sale 14bps Credit quality & other 11bps |
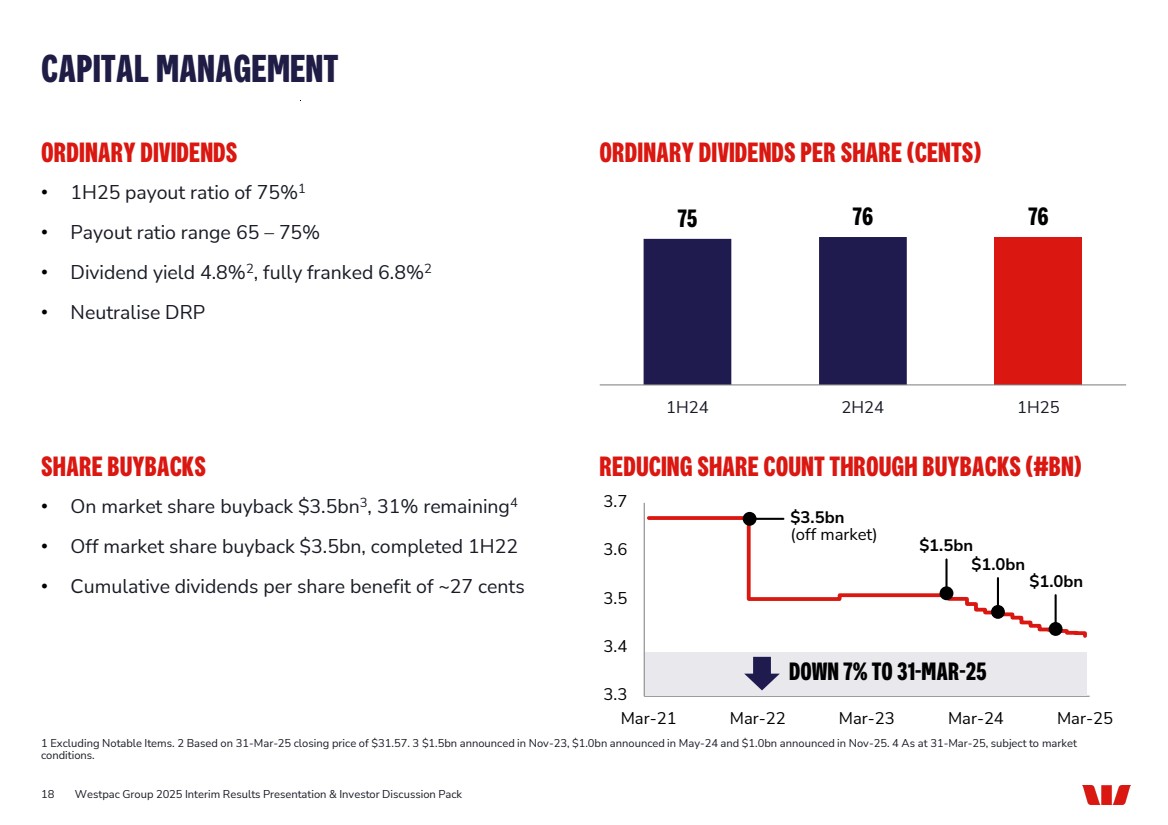
| 3.3 3.4 3.5 3.6 3.7 Mar-21 Mar-22 Mar-23 Mar-24 Mar-25 18 ORDINARY DIVIDENDS • 1H25 payout ratio of 75%1 • Payout ratio range 65 – 75% • Dividend yield 4.8%2, fully franked 6.8%2 • Neutralise DRP ORDINARY DIVIDENDS PER SHARE (CENTS) SHARE BUYBACKS • On market share buyback $3.5bn3, 31% remaining4 • Off market share buyback $3.5bn, completed 1H22 • Cumulative dividends per share benefit of ~27 cents REDUCING SHARE COUNT THROUGH BUYBACKS (#BN) Westpac Group 2025 Interim Results Presentation & Investor Discussion Pack CAPITAL MANAGEMENT 1 Excluding Notable Items. 2 Based on 31-Mar-25 closing price of $31.57. 3 $1.5bn announced in Nov-23, $1.0bn announced in May-24 and $1.0bn announced in Nov-25. 4 As at 31-Mar-25, subject to market conditions. $3.5bn (off market) $1.5bn $1.0bn $1.0bn DOWN 7% TO 31-MAR-25 75 76 76 1H24 2H24 1H25 |
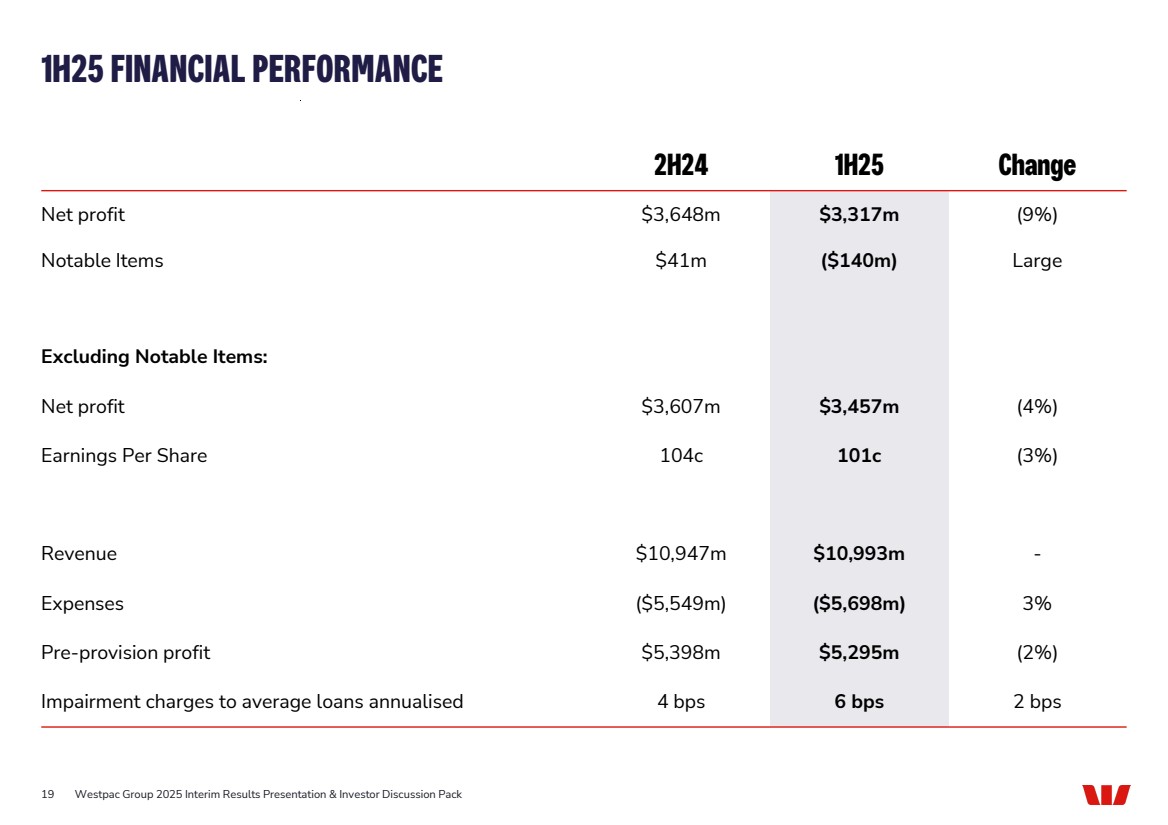
| 1H25 FINANCIAL PERFORMANCE 19 2H24 1H25 Change Net profit $3,648m $3,317m (9%) Notable Items $41m ($140m) Large Excluding Notable Items: Net profit $3,607m $3,457m (4%) Earnings Per Share 104c 101c (3%) Revenue $10,947m $10,993m - Expenses ($5,549m) ($5,698m) 3% Pre-provision profit $5,398m $5,295m (2%) Impairment charges to average loans annualised 4 bps 6 bps 2 bps Westpac Group 2025 Interim Results Presentation & Investor Discussion Pack |
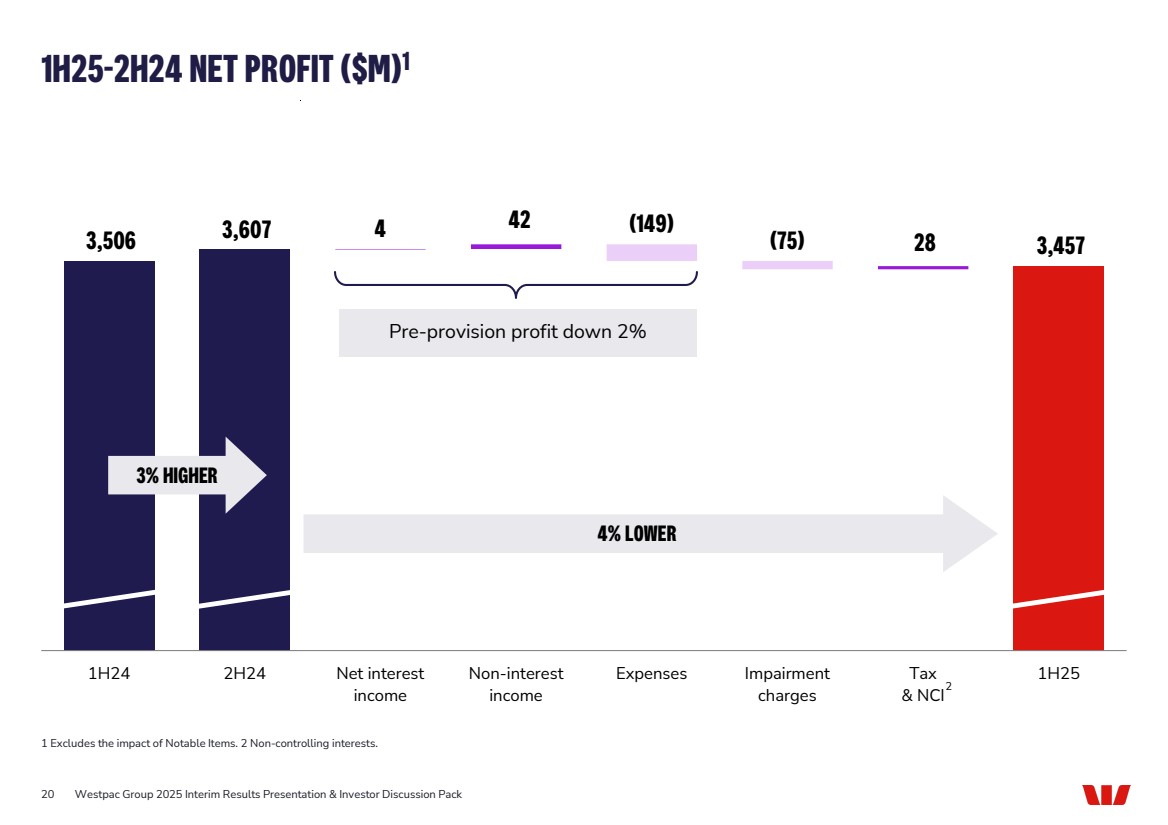
| 1H25-2H24 NET PROFIT ($M)1 20 3,506 3,607 4 (75) 3,457 42 (149) 28 1H24 2H24 Net interest income Non-interest income Expenses Impairment charges Tax & NCI 1H25 1 Excludes the impact of Notable Items. 2 Non-controlling interests. 2 Pre-provision profit down 2% 4% LOWER 3% HIGHER Westpac Group 2025 Interim Results Presentation & Investor Discussion Pack |
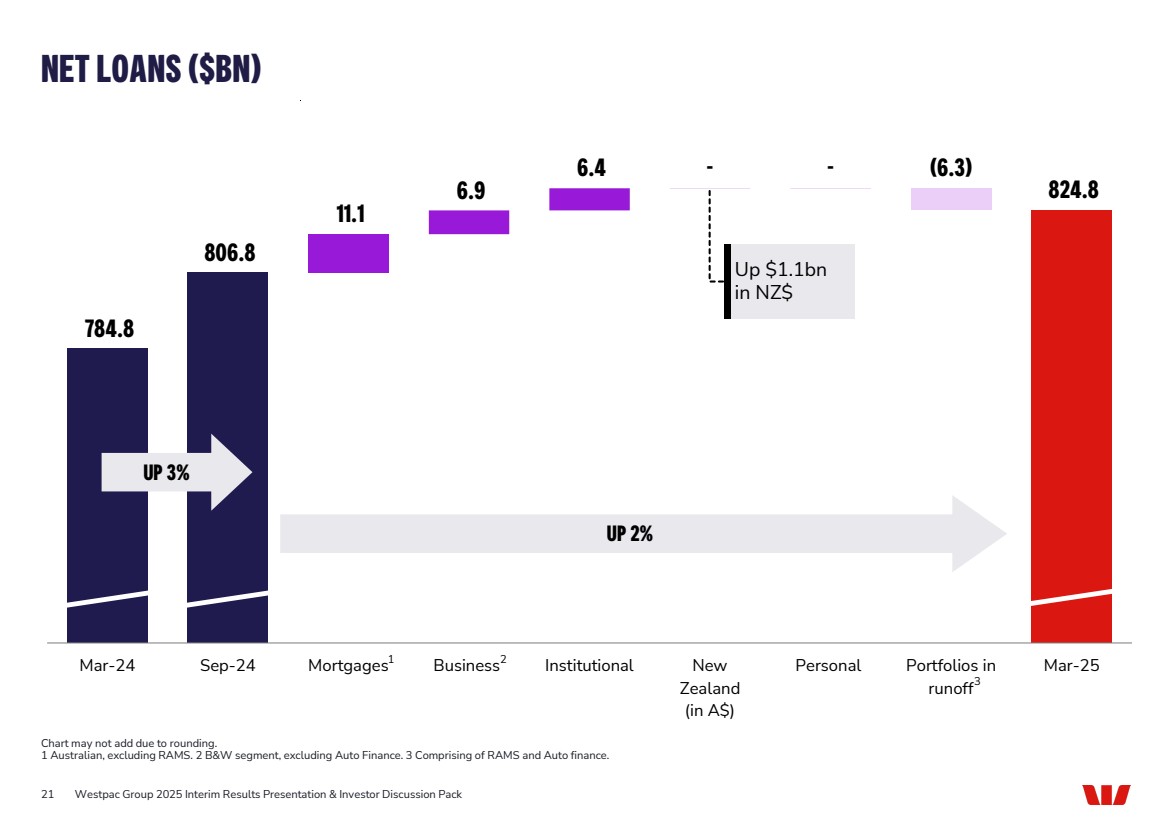
| NET LOANS ($BN) 21 784.8 806.8 11.1 6.9 6.4 - 824.8 - (6.3) Mar-24 Sep-24 Mortgages Business Institutional New Zealand (in A$) Personal Portfolios in runoff Mar-25 Chart may not add due to rounding. 1 Australian, excluding RAMS. 2 B&W segment, excluding Auto Finance. 3 Comprising of RAMS and Auto finance. UP 3% Up $1.1bn in NZ$ Westpac Group 2025 Interim Results Presentation & Investor Discussion Pack 1 3 UP 2% 2 |
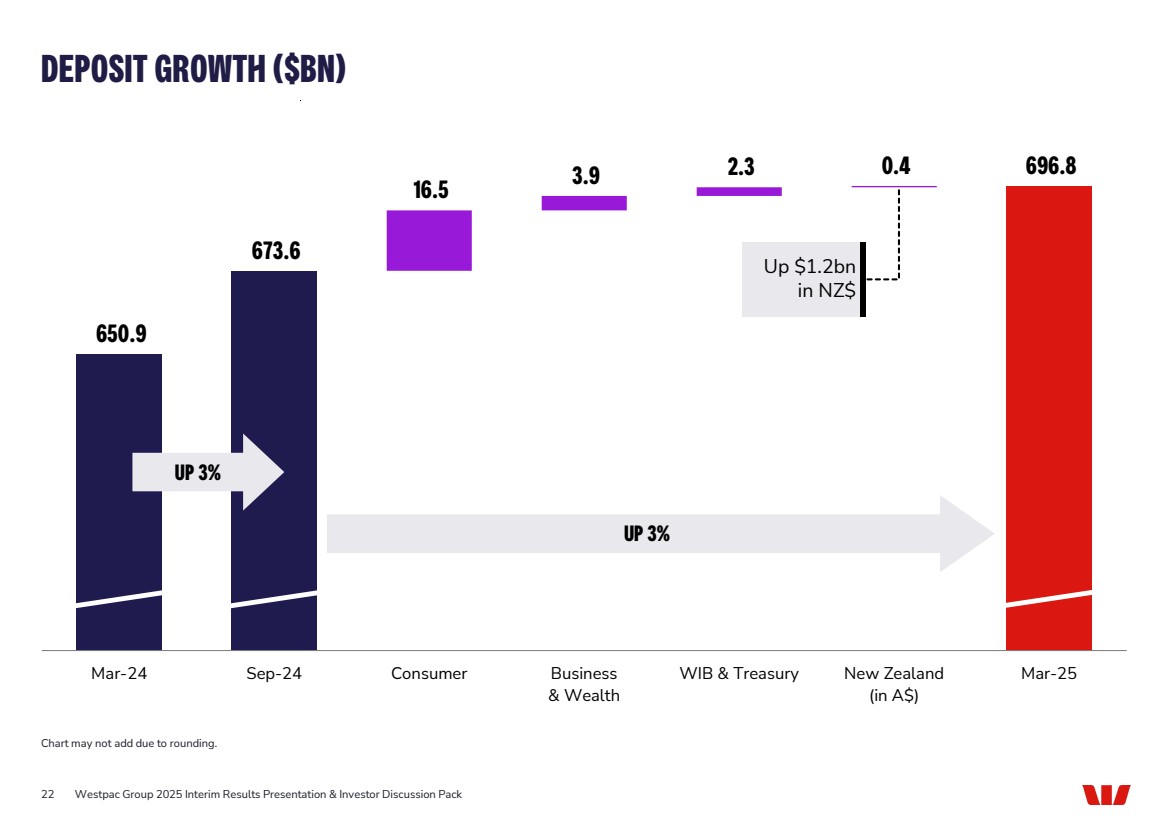
| 650.9 673.6 16.5 3.9 2.3 0.4 696.8 Mar-24 Sep-24 Consumer Business & Wealth WIB & Treasury New Zealand (in A$) Mar-25 DEPOSIT GROWTH ($BN) 22 Chart may not add due to rounding. UP 3% Up $1.2bn in NZ$ Westpac Group 2025 Interim Results Presentation & Investor Discussion Pack UP 3% |
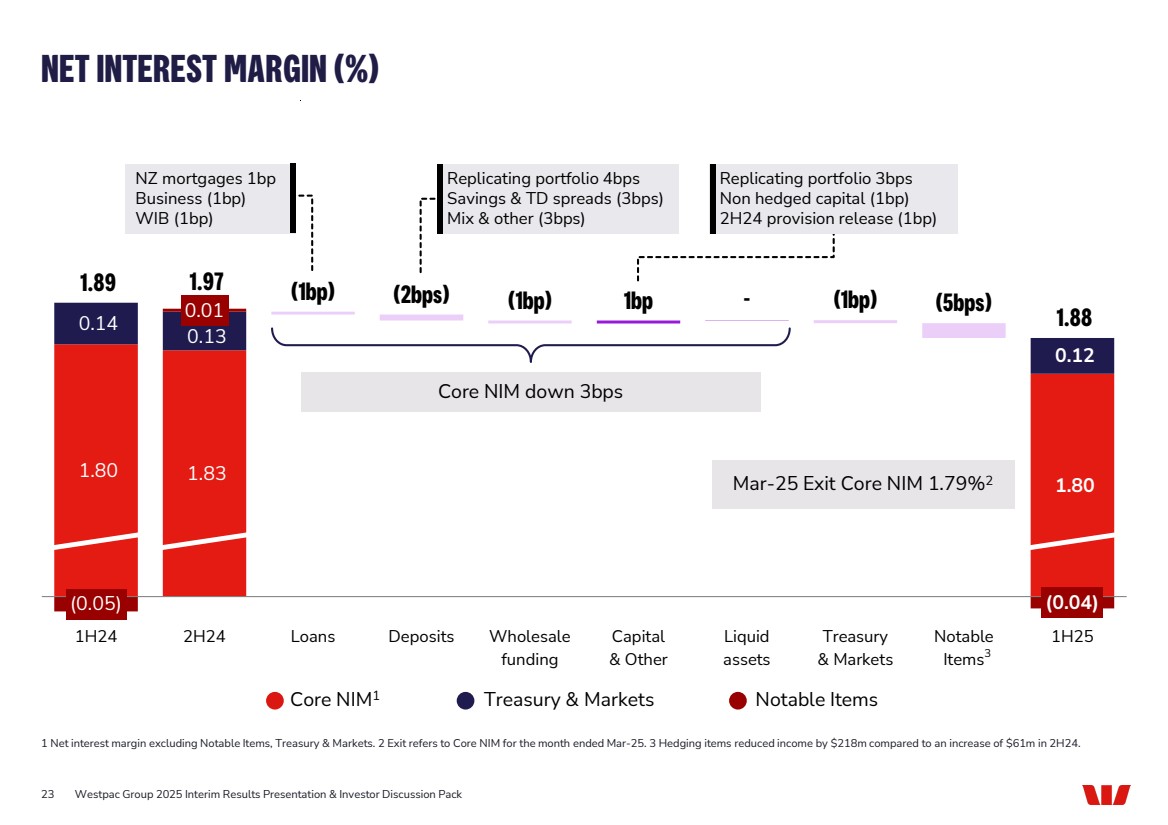
| NET INTEREST MARGIN (%) 23 1.80 1.83 1.80 0.14 0.13 0.12 (0.05) 0.01 (0.04) 1.89 1.97 (2bps) 1bp - (5bps) 1.88 (1bp) (1bp) (1bp) 1H24 2H24 Loans Deposits Wholesale funding Capital & Other Liquid assets Treasury & Markets Notable Items 1H25 1 Net interest margin excluding Notable Items, Treasury & Markets. 2 Exit refers to Core NIM for the month ended Mar-25. 3 Hedging items reduced income by $218m compared to an increase of $61m in 2H24. Core NIM1 Treasury & Markets Notable Items Core NIM down 3bps Mar-25 Exit Core NIM 1.79%2 Westpac Group 2025 Interim Results Presentation & Investor Discussion Pack 3 NZ mortgages 1bp Business (1bp) WIB (1bp) Replicating portfolio 4bps Savings & TD spreads (3bps) Mix & other (3bps) Replicating portfolio 3bps Non hedged capital (1bp) 2H24 provision release (1bp) |
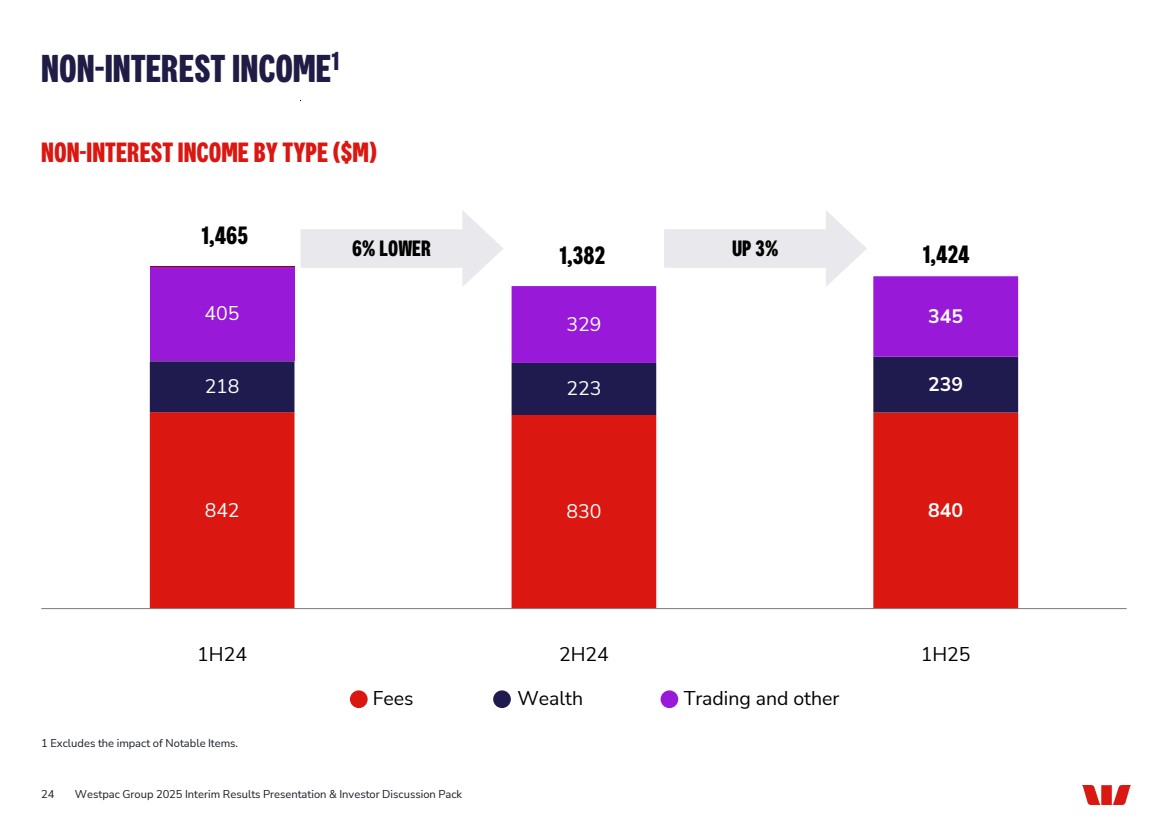
| NON-INTEREST INCOME1 24 NON-INTEREST INCOME BY TYPE ($M) 842 830 840 218 223 239 405 329 345 1,465 1,382 1,424 1H24 2H24 1H25 Westpac Group 2025 Interim Results Presentation & Investor Discussion Pack 1 Excludes the impact of Notable Items. Fees Wealth Trading and other 6% LOWER UP 3% |
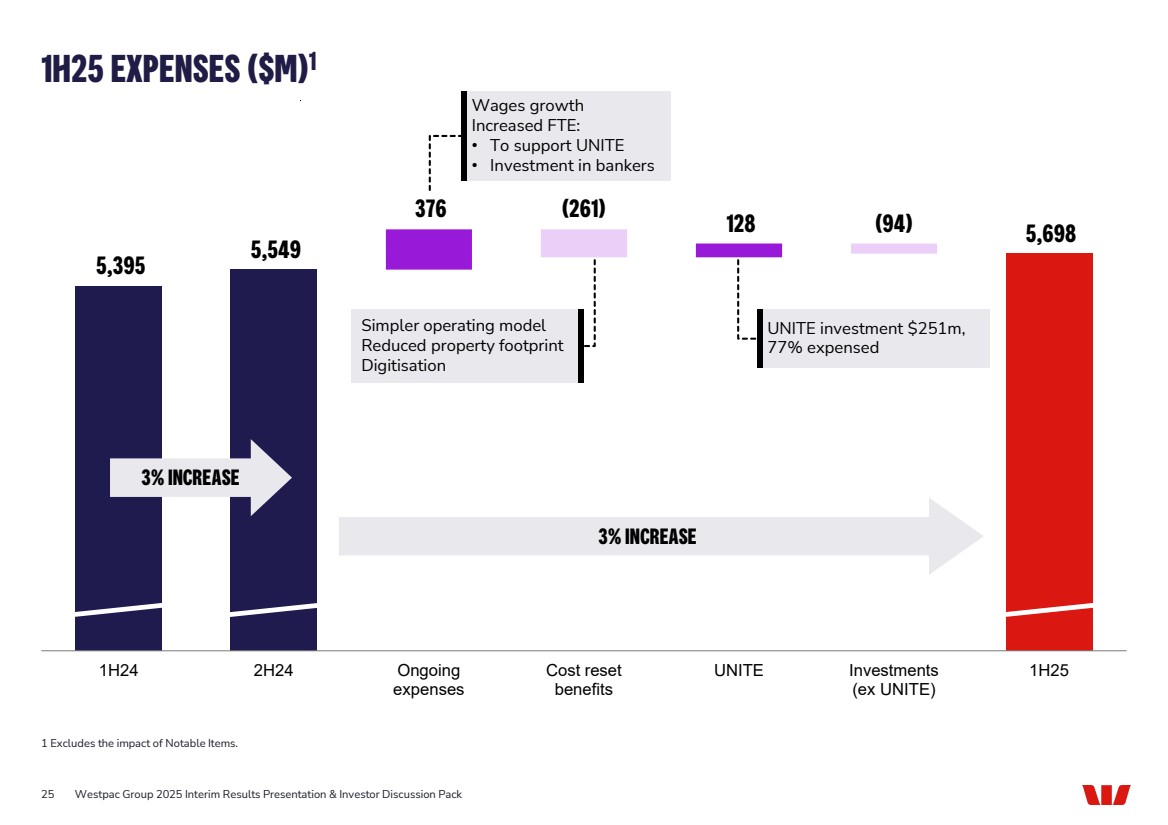
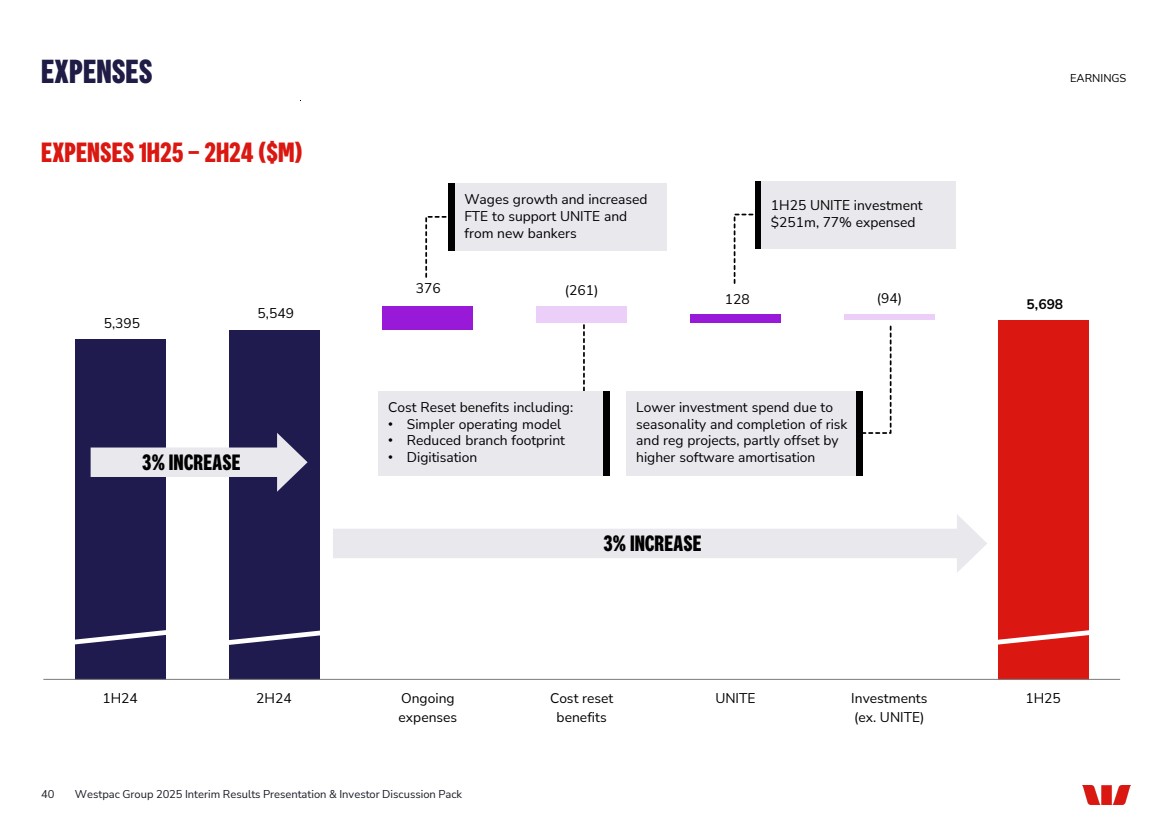
| 1H25 EXPENSES ($M)1 25 5,395 5,549 376 128 (94) 5,698 (261) 1H24 2H24 Ongoing expenses Cost reset benefits UNITE Investments (ex UNITE) 1H25 1 Excludes the impact of Notable Items. 3% INCREASE 3% INCREASE Wages growth Increased FTE: • To support UNITE • Investment in bankers Simpler operating model Reduced property footprint Digitisation Westpac Group 2025 Interim Results Presentation & Investor Discussion Pack UNITE investment $251m, 77% expensed |
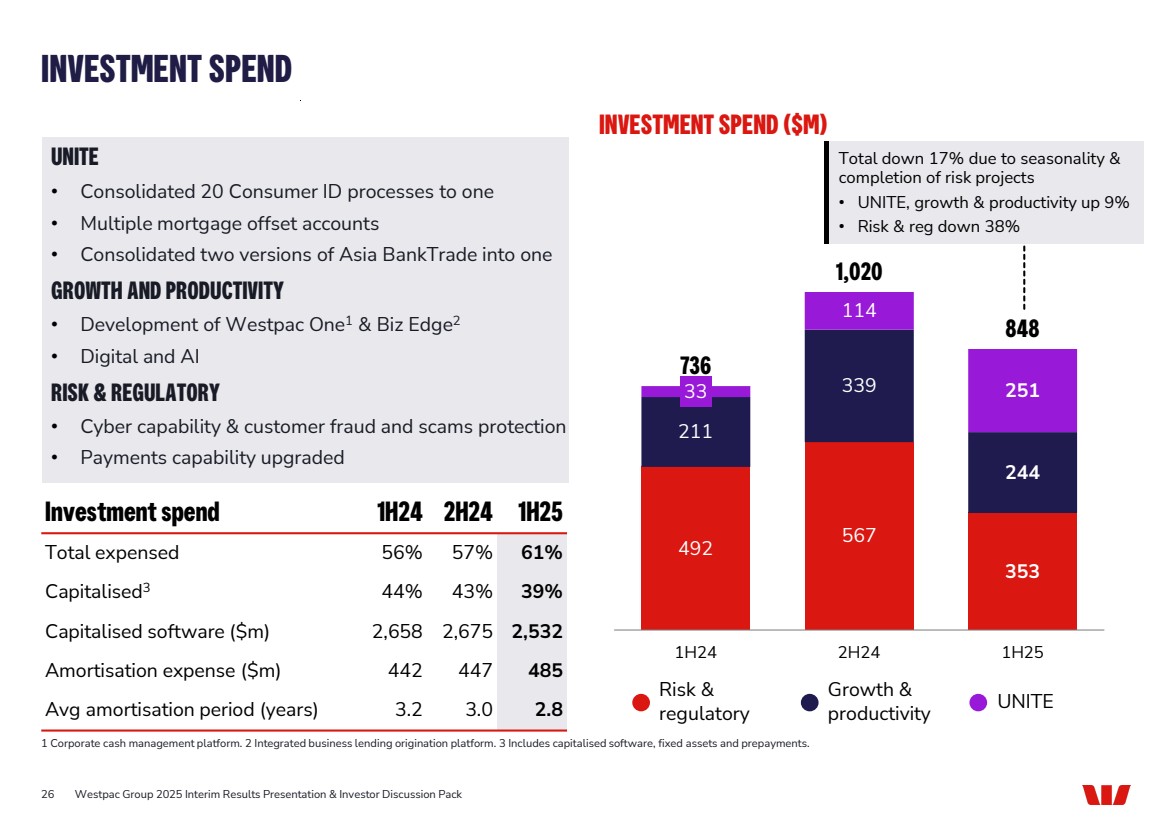
| 26 UNITE • Consolidated 20 Consumer ID processes to one • Multiple mortgage offset accounts • Consolidated two versions of Asia BankTrade into one GROWTH AND PRODUCTIVITY • Development of Westpac One1 & Biz Edge2 • Digital and AI RISK & REGULATORY • Cyber capability & customer fraud and scams protection • Payments capability upgraded INVESTMENT SPEND ($M) INVESTMENT SPEND 1 Corporate cash management platform. 2 Integrated business lending origination platform. 3 Includes capitalised software, fixed assets and prepayments. 492 567 353 211 339 244 33 114 251 736 1,020 848 1H24 2H24 1H25 Investment spend 1H24 2H24 1H25 Total expensed 56% 57% 61% Capitalised3 44% 43% 39% Capitalised software ($m) 2,658 2,675 2,532 Amortisation expense ($m) 442 447 485 Avg amortisation period (years) 3.2 3.0 2.8 Westpac Group 2025 Interim Results Presentation & Investor Discussion Pack Risk & regulatory Growth & productivity UNITE Total down 17% due to seasonality & completion of risk projects • UNITE, growth & productivity up 9% • Risk & reg down 38% |
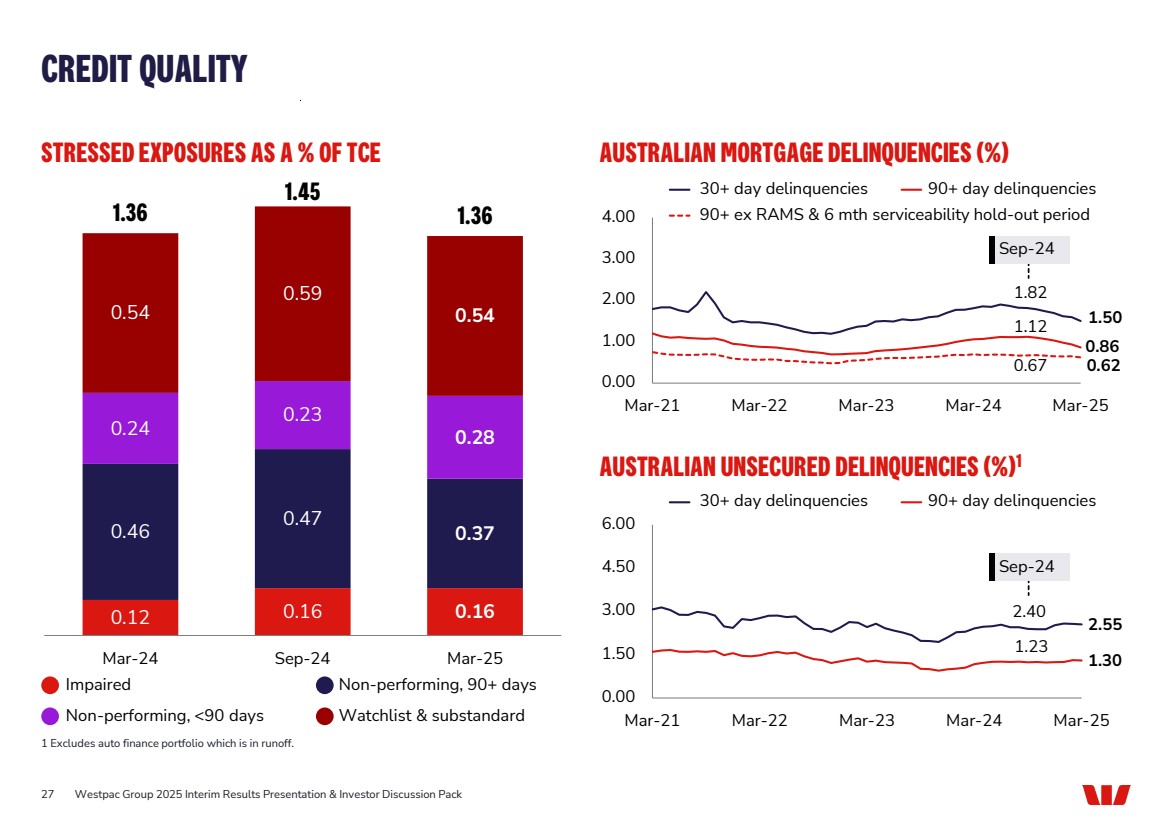
| 2.40 2.55 1.23 1.30 0.00 1.50 3.00 4.50 6.00 Mar-21 Mar-22 Mar-23 Mar-24 Mar-25 27 0.12 0.16 0.16 0.46 0.47 0.37 0.24 0.23 0.28 0.54 0.59 0.54 1.36 1.45 1.36 Mar-24 Sep-24 Mar-25 AUSTRALIAN MORTGAGE DELINQUENCIES (%) 0.86 1.12 1.50 1.82 0.67 0.62 0.00 1.00 2.00 3.00 4.00 Mar-21 Mar-22 Mar-23 Mar-24 Mar-25 AUSTRALIAN UNSECURED DELINQUENCIES (%)1 STRESSED EXPOSURES AS A % OF TCE CREDIT QUALITY 1 Excludes auto finance portfolio which is in runoff. Impaired Non-performing, 90+ days Non-performing, <90 days Watchlist & substandard 30+ day delinquencies 90+ day delinquencies 90+ ex RAMS & 6 mth serviceability hold-out period 30+ day delinquencies 90+ day delinquencies Westpac Group 2025 Interim Results Presentation & Investor Discussion Pack Sep-24 Sep-24 |
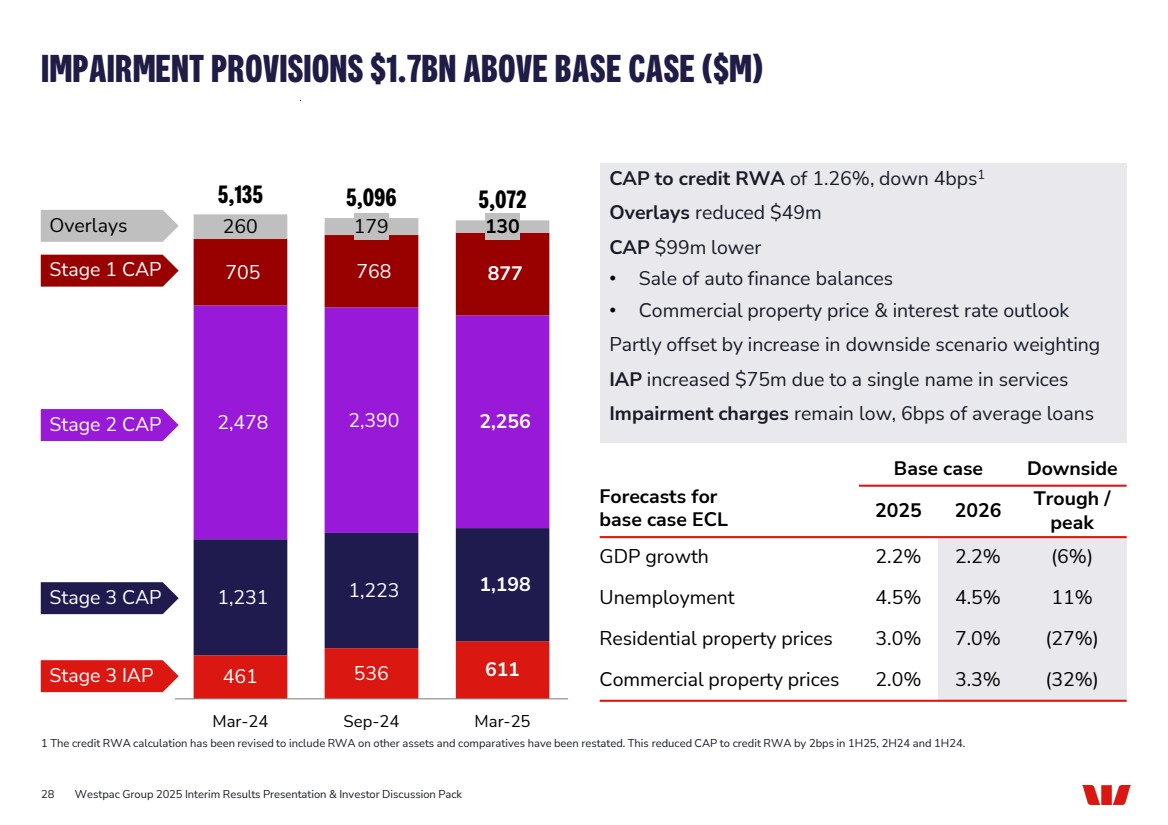
| 28 IMPAIRMENT PROVISIONS $1.7BN ABOVE BASE CASE ($M) 1 The credit RWA calculation has been revised to include RWA on other assets and comparatives have been restated. This reduced CAP to credit RWA by 2bps in 1H25, 2H24 and 1H24. Forecasts for base case ECL Base case Downside 2025 2026 Trough / peak GDP growth 2.2% 2.2% (6%) Unemployment 4.5% 4.5% 11% Residential property prices 3.0% 7.0% (27%) 461 Commercial property prices 2.0% 3.3% (32%) 536 611 1,231 1,223 1,198 2,478 2,390 2,256 705 768 877 260 179 130 5,135 5,096 5,072 Mar-24 Sep-24 Mar-25 Overlays Stage 3 IAP Stage 3 CAP Stage 1 CAP Stage 2 CAP Westpac Group 2025 Interim Results Presentation & Investor Discussion Pack CAP to credit RWA of 1.26%, down 4bps1 Overlays reduced $49m CAP $99m lower • Sale of auto finance balances • Commercial property price & interest rate outlook Partly offset by increase in downside scenario weighting IAP increased $75m due to a single name in services Impairment charges remain low, 6bps of average loans |
| INVESTOR DISCUSSION PACK |

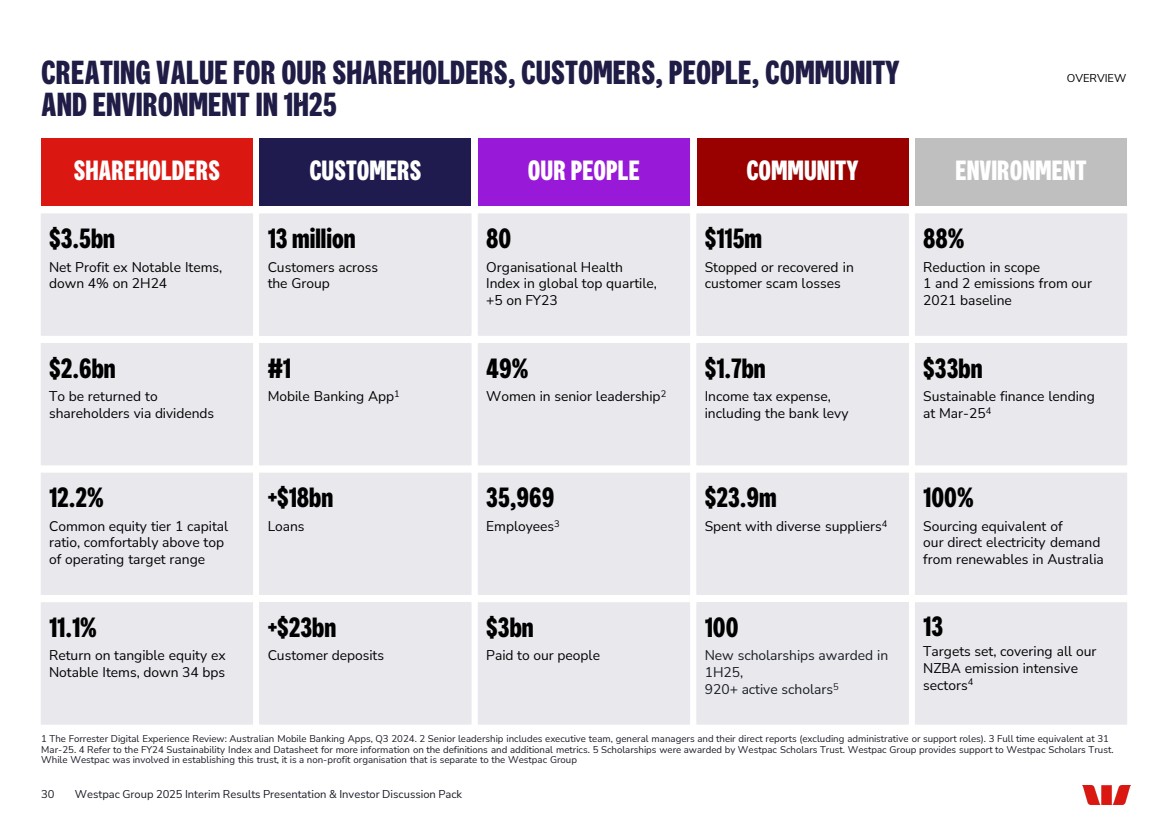
| CREATING VALUE FOR OUR SHAREHOLDERS, CUSTOMERS, PEOPLE, COMMUNITY AND ENVIRONMENT IN 1H25 30 OVERVIEW 1 The Forrester Digital Experience Review: Australian Mobile Banking Apps, Q3 2024. 2 Senior leadership includes executive team, general managers and their direct reports (excluding administrative or support roles). 3 Full time equivalent at 31 Mar-25. 4 Refer to the FY24 Sustainability Index and Datasheet for more information on the definitions and additional metrics. 5 Scholarships were awarded by Westpac Scholars Trust. Westpac Group provides support to Westpac Scholars Trust. While Westpac was involved in establishing this trust, it is a non-profit organisation that is separate to the Westpac Group $3.5bn Net Profit ex Notable Items, down 4% on 2H24 13 million Customers across the Group 80 Organisational Health Index in global top quartile, +5 on FY23 $115m Stopped or recovered in customer scam losses 88% Reduction in scope 1 and 2 emissions from our 2021 baseline $2.6bn To be returned to shareholders via dividends #1 Mobile Banking App1 49% Women in senior leadership2 $1.7bn Income tax expense, including the bank levy 12.2% Common equity tier 1 capital ratio, comfortably above top of operating target range +$18bn Loans 35,969 Employees3 $23.9m Spent with diverse suppliers4 100% Sourcing equivalent of our direct electricity demand from renewables in Australia 11.1% Return on tangible equity ex Notable Items, down 34 bps +$23bn Customer deposits $3bn Paid to our people 100 New scholarships awarded in 1H25, 920+ active scholars5 $33bn Sustainable finance lending at Mar-254 13 Targets set, covering all our NZBA emission intensive sectors4 SHAREHOLDERS CUSTOMERS OUR PEOPLE COMMUNITY ENVIRONMENT Westpac Group 2025 Interim Results Presentation & Investor Discussion Pack |
| EARNINGS DRIVERS |

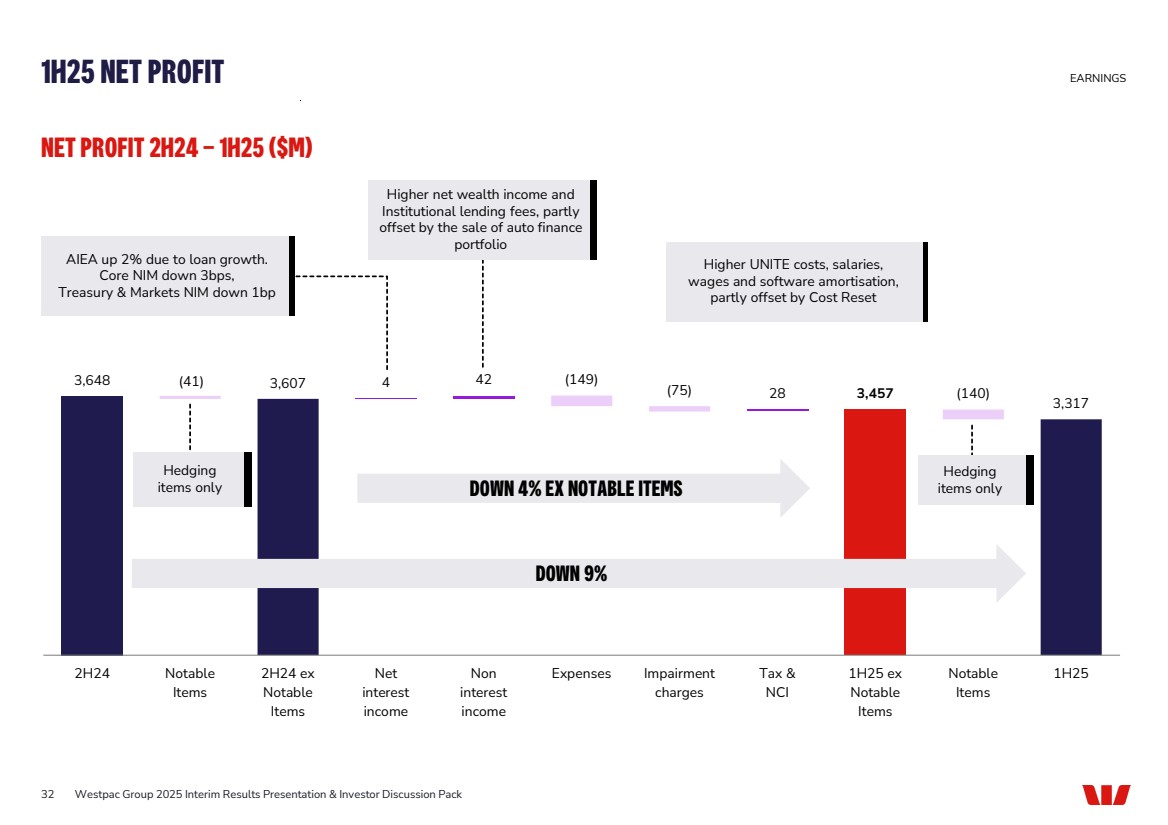
| 3,648 3,607 4 42 28 3,457 (140) 3,317 (41) (149) (75) 2H24 Notable Items 2H24 ex Notable Items Net interest income Non interest income Expenses Impairment charges Tax & NCI 1H25 ex Notable Items Notable Items 1H25 1H25 NET PROFIT EARNINGS DOWN 9% DOWN 4% EX NOTABLE ITEMS Higher UNITE costs, salaries, wages and software amortisation, partly offset by Cost Reset 32 NET PROFIT 2H24 – 1H25 ($M) Hedging items only Hedging items only Higher net wealth income and Institutional lending fees, partly offset by the sale of auto finance portfolio AIEA up 2% due to loan growth. Core NIM down 3bps, Treasury & Markets NIM down 1bp Westpac Group 2025 Interim Results Presentation & Investor Discussion Pack |
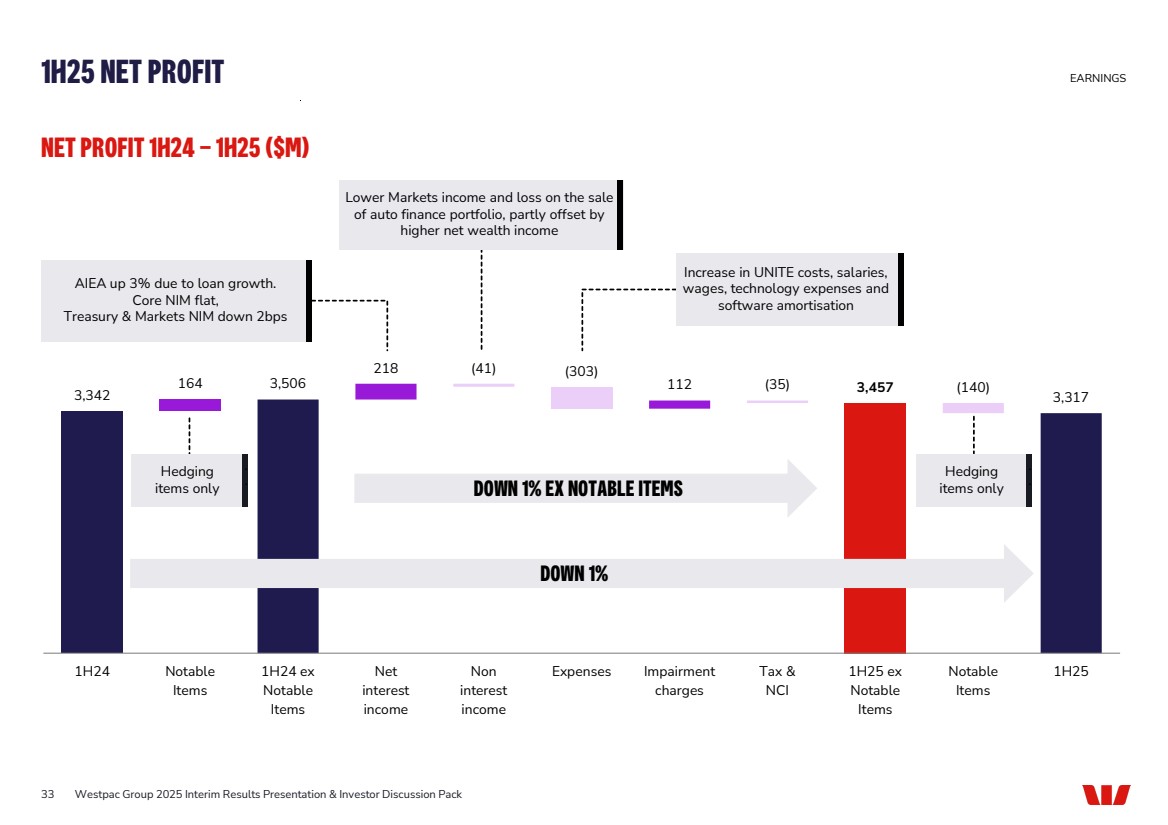
| 3,342 164 3,506 218 112 3,457 3,317 (41) (303) (35) (140) 1H24 Notable Items 1H24 ex Notable Items Net interest income Non interest income Expenses Impairment charges Tax & NCI 1H25 ex Notable Items Notable Items 1H25 1H25 NET PROFIT EARNINGS DOWN 1% DOWN 1% EX NOTABLE ITEMS AIEA up 3% due to loan growth. Core NIM flat, Treasury & Markets NIM down 2bps Lower Markets income and loss on the sale of auto finance portfolio, partly offset by higher net wealth income Increase in UNITE costs, salaries, wages, technology expenses and software amortisation 33 NET PROFIT 1H24 – 1H25 ($M) Hedging items only . . Westpac Group 2025 Interim Results Presentation & Investor Discussion Pack Hedging items only . . |
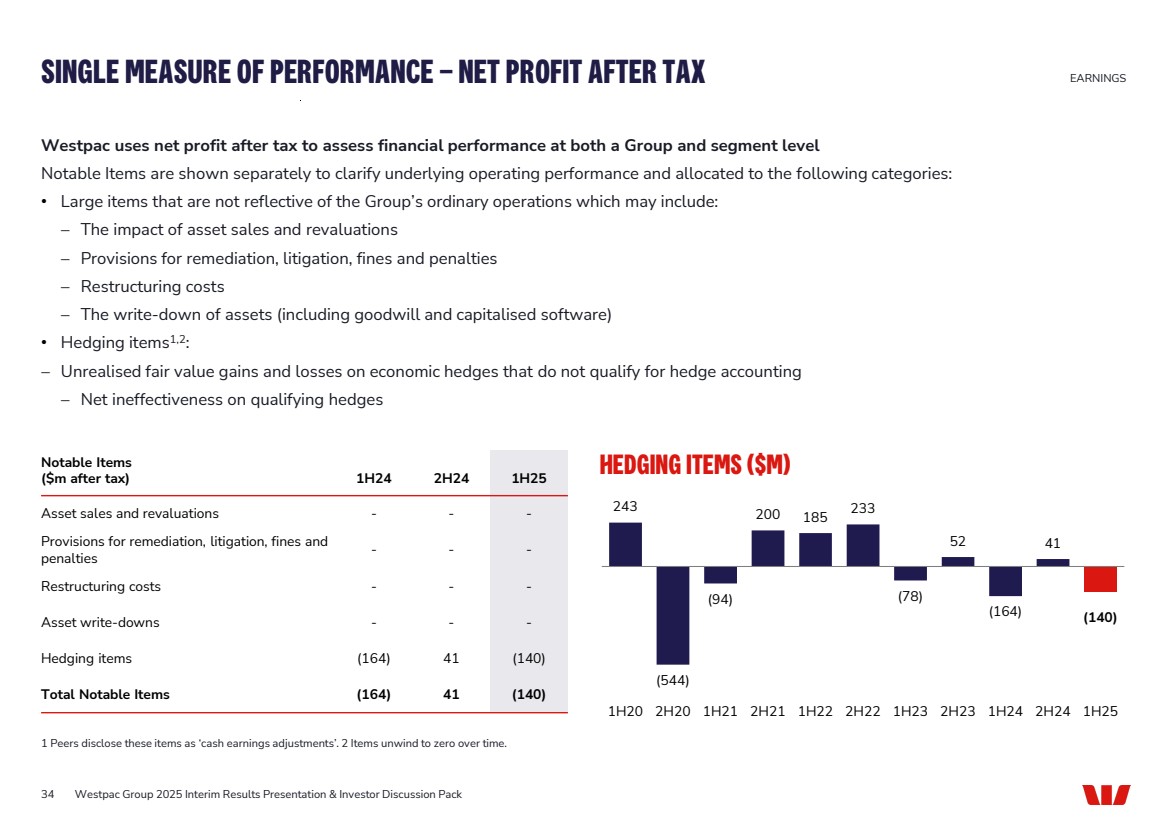
| 34 Westpac uses net profit after tax to assess financial performance at both a Group and segment level Notable Items are shown separately to clarify underlying operating performance and allocated to the following categories: • Large items that are not reflective of the Group’s ordinary operations which may include: − The impact of asset sales and revaluations − Provisions for remediation, litigation, fines and penalties − Restructuring costs − The write-down of assets (including goodwill and capitalised software) • Hedging items1,2: − Unrealised fair value gains and losses on economic hedges that do not qualify for hedge accounting − Net ineffectiveness on qualifying hedges HEDGING ITEMS ($M) Westpac Group 2025 Interim Results Presentation & Investor Discussion Pack SINGLE MEASURE OF PERFORMANCE – NET PROFIT AFTER TAX EARNINGS 1 Peers disclose these items as ‘cash earnings adjustments’. 2 Items unwind to zero over time. 243 (544) (94) 200 185 233 (78) 52 (164) 41 (140) 1H20 2H20 1H21 2H21 1H22 2H22 1H23 2H23 1H24 2H24 1H25 Notable Items ($m after tax) 1H24 2H24 1H25 Asset sales and revaluations - - - Provisions for remediation, litigation, fines and penalties - - - Restructuring costs - - - Asset write-downs - - - Hedging items (164) 41 (140) Total Notable Items (164) 41 (140) |
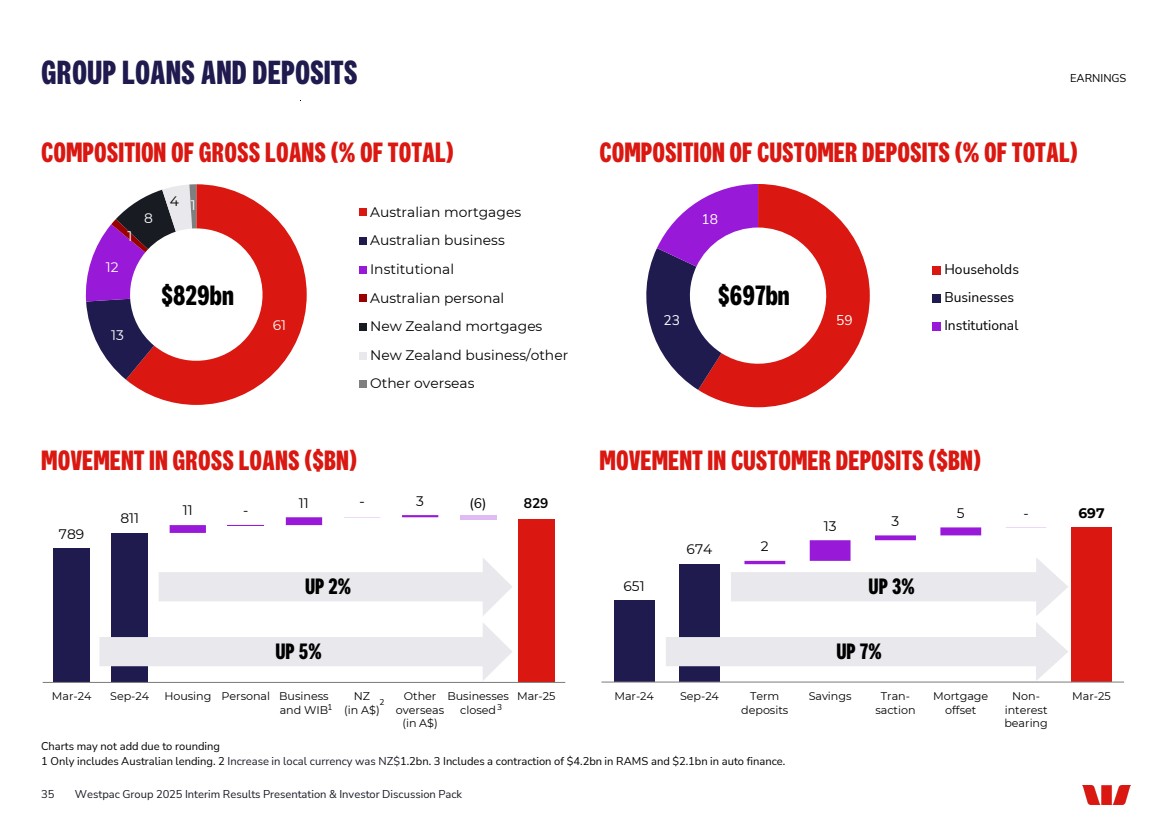
| 23 59 18 Households Businesses Institutional 35 COMPOSITION OF GROSS LOANS (% OF TOTAL) COMPOSITION OF CUSTOMER DEPOSITS (% OF TOTAL) MOVEMENT IN GROSS LOANS ($BN) GROUP LOANS AND DEPOSITS 789 811 11 - 11 - 3 (6) 829 Mar-24 Sep-24 Housing Personal Business and WIB NZ (in A$) Other overseas (in A$) Businesses closed Mar-25 $697bn UP 5% UP 2% 61 13 12 1 8 4 1 Australian mortgages Australian business Institutional Australian personal New Zealand mortgages New Zealand business/other Other overseas $829bn Westpac Group 2025 Interim Results Presentation & Investor Discussion Pack 1 Only includes Australian lending. 2 Increase in local currency was NZ$1.2bn. 3 Includes a contraction of $4.2bn in RAMS and $2.1bn in auto finance. 3 2 Charts may not add due to rounding 1 651 674 2 13 3 5 - 697 Mar-24 Sep-24 Term deposits Savings Tran-saction Mortgage offset Non-interest bearing Mar-25 UP 7% UP 3% MOVEMENT IN CUSTOMER DEPOSITS ($BN) EARNINGS |
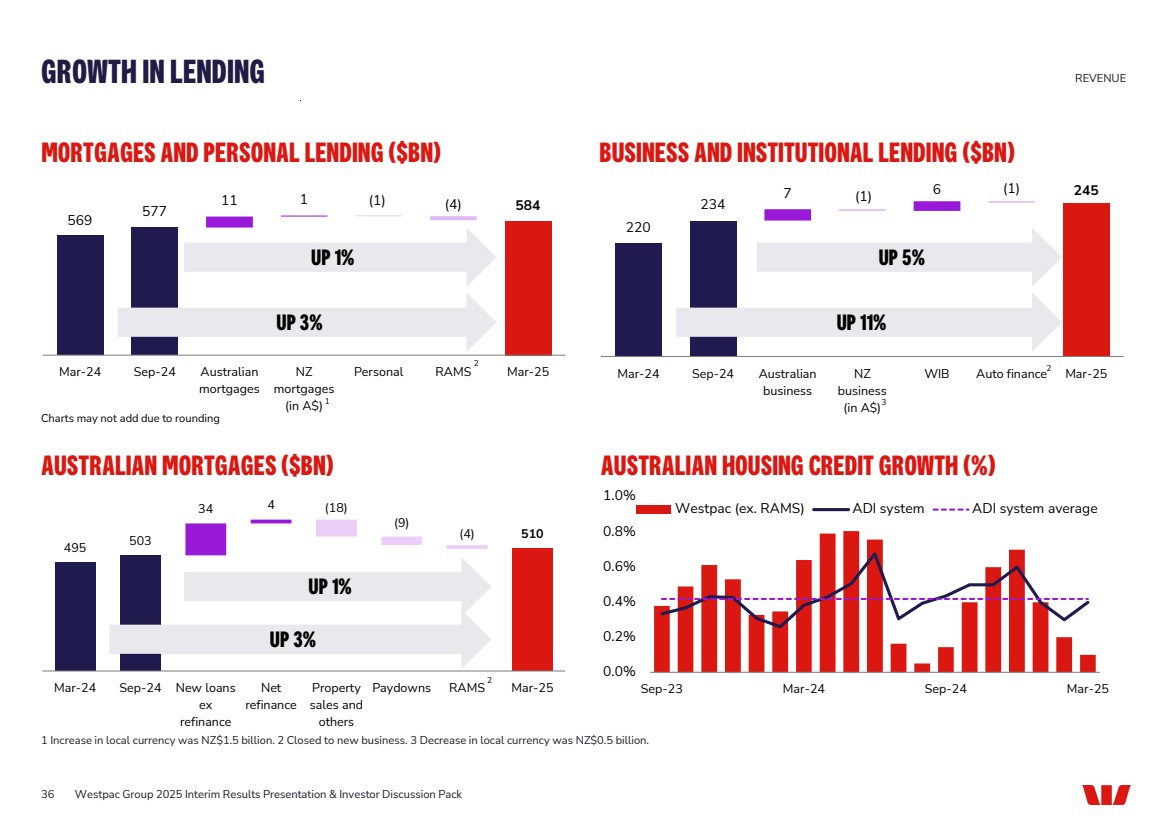
| 569 577 11 1 584 (1) (4) Mar-24 Sep-24 Australian mortgages NZ mortgages (in A$) Personal RAMS Mar-25 BUSINESS AND INSTITUTIONAL LENDING ($BN) 6 245 220 234 7 (1) (1) Mar-24 Sep-24 Australian business NZ business (in A$) WIB Auto finance Mar-25 MORTGAGES AND PERSONAL LENDING ($BN) AUSTRALIAN MORTGAGES ($BN) 495 503 34 4 510 (18) (9) (4) Mar-24 Sep-24 New loans ex refinance Net refinance Property sales and others Paydowns RAMS Mar-25 GROWTH IN LENDING REVENUE 1 Increase in local currency was NZ$1.5 billion. 2 Closed to new business. 3 Decrease in local currency was NZ$0.5 billion. UP 11% UP 5% 3 UP 3% UP 1% UP 3% UP 1% 36 AUSTRALIAN HOUSING CREDIT GROWTH (%) 0.0% 0.2% 0.4% 0.6% 0.8% 1.0% Sep-23 Mar-24 Sep-24 Mar-25 Westpac (ex. RAMS) ADI system ADI system average Westpac Group 2025 Interim Results Presentation & Investor Discussion Pack 1 2 2 2 Charts may not add due to rounding |
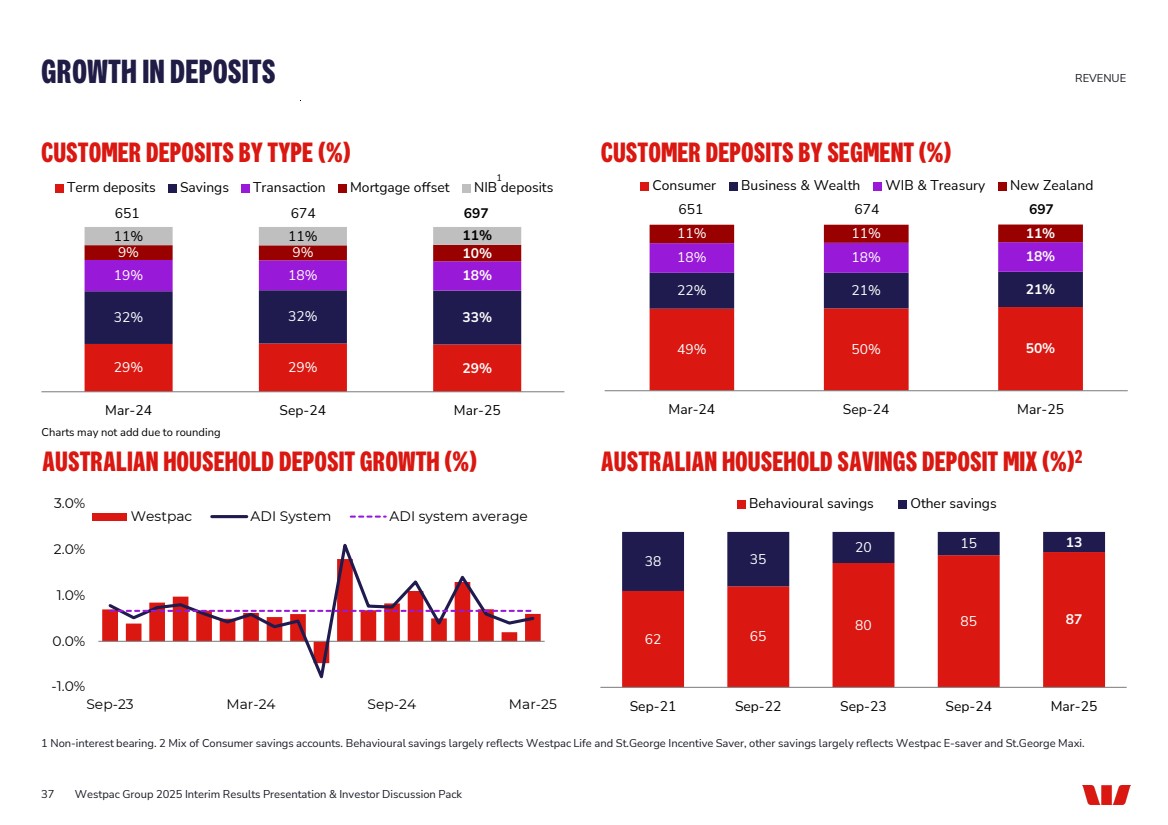
| 29% 29% 29% 32% 32% 33% 19% 18% 18% 9% 9% 10% 11% 11% 11% Mar-24 Sep-24 Mar-25 Term deposits Savings Transaction Mortgage offset NIB deposits 49% 50% 50% 22% 21% 21% 18% 18% 18% 11% 11% 11% Mar-24 Sep-24 Mar-25 Consumer Business & Wealth WIB & Treasury New Zealand CUSTOMER DEPOSITS BY TYPE (%) CUSTOMER DEPOSITS BY SEGMENT (%) GROWTH IN DEPOSITS REVENUE 1 Non-interest bearing. 2 Mix of Consumer savings accounts. Behavioural savings largely reflects Westpac Life and St.George Incentive Saver, other savings largely reflects Westpac E-saver and St.George Maxi. 1 651 674 697 37 AUSTRALIAN HOUSEHOLD DEPOSIT GROWTH (%) AUSTRALIAN HOUSEHOLD SAVINGS DEPOSIT MIX (%)2 Westpac Group 2025 Interim Results Presentation & Investor Discussion Pack Charts may not add due to rounding 62 65 80 85 87 38 35 20 15 13 Sep-21 Sep-22 Sep-23 Sep-24 Mar-25 Behavioural savings Other savings -1.0% 0.0% 1.0% 2.0% 3.0% Sep-23 Mar-24 Sep-24 Mar-25 Westpac ADI System ADI system average 651 674 697 |
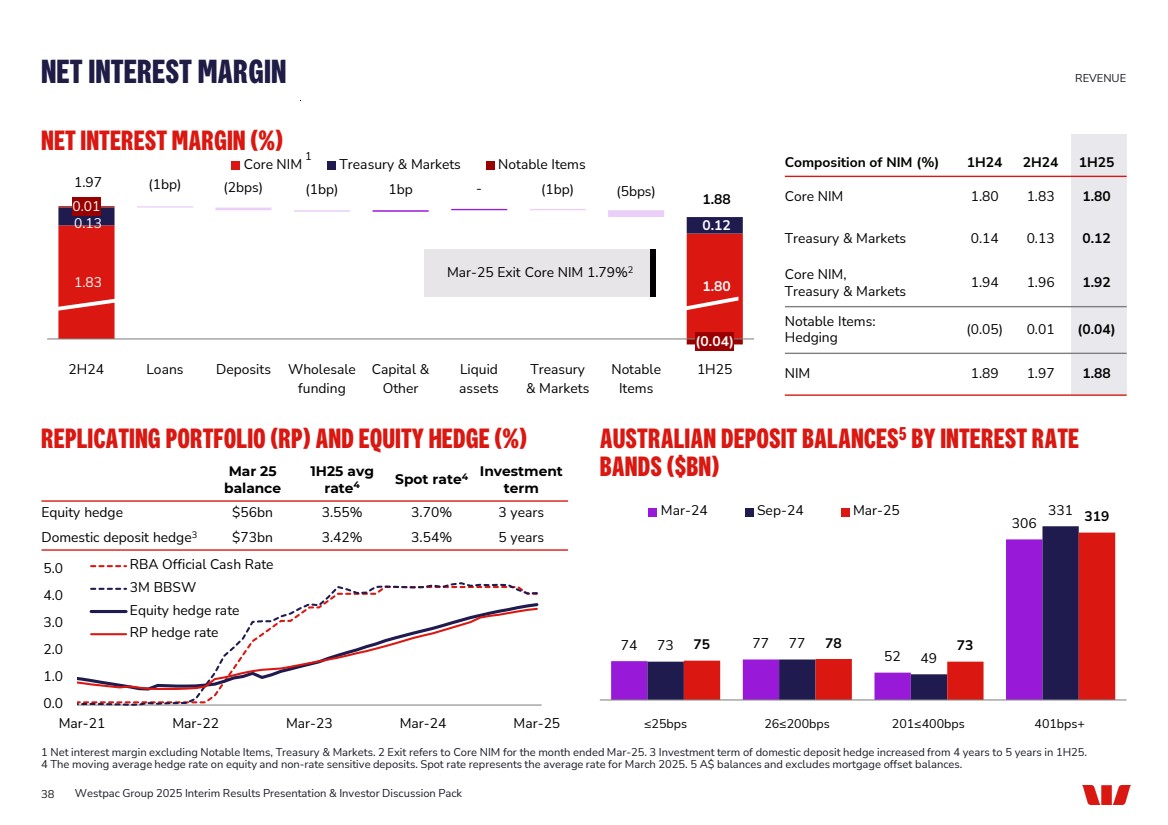
| 1.83 1.80 0.13 0.12 0.01 (0.04) 1.97 1bp - 1.88 (1bp) (2bps) (1bp) (1bp) (5bps) 2H24 Loans Deposits Wholesale funding Capital & Other Liquid assets Treasury & Markets Notable Items 1H25 Core NIM Treasury & Markets Notable Items NET INTEREST MARGIN (%) AUSTRALIAN DEPOSIT BALANCES5 BY INTEREST RATE BANDS ($BN) 74 77 52 306 73 77 49 331 75 78 73 319 Mar-24 Sep-24 Mar-25 NET INTEREST MARGIN REVENUE 1 Net interest margin excluding Notable Items, Treasury & Markets. 2 Exit refers to Core NIM for the month ended Mar-25. 3 Investment term of domestic deposit hedge increased from 4 years to 5 years in 1H25. 4 The moving average hedge rate on equity and non-rate sensitive deposits. Spot rate represents the average rate for March 2025. 5 A$ balances and excludes mortgage offset balances. Composition of NIM (%) 1H24 2H24 1H25 Core NIM 1.80 1.83 1.80 Treasury & Markets 0.14 0.13 0.12 Core NIM, Treasury & Markets 1.94 1.96 1.92 Notable Items: Hedging (0.05) 0.01 (0.04) NIM 1.89 1.97 1.88 ≤25bps 26≤200bps 201≤400bps 401bps+ 38 Mar-25 Exit Core NIM 1.79%2 Westpac Group 2025 Interim Results Presentation & Investor Discussion Pack REPLICATING PORTFOLIO (RP) AND EQUITY HEDGE (%) Mar 25 balance 1H25 avg rate4 Spot rate4 Investment term Equity hedge $56bn 3.55% 3.70% 3 years Domestic deposit hedge3 $73bn 3.42% 3.54% 5 years 1 0.0 1.0 2.0 3.0 4.0 5.0 Mar-21 Mar-22 Mar-23 Mar-24 Mar-25 RBA Official Cash Rate 3M BBSW Equity hedge rate RP hedge rate |
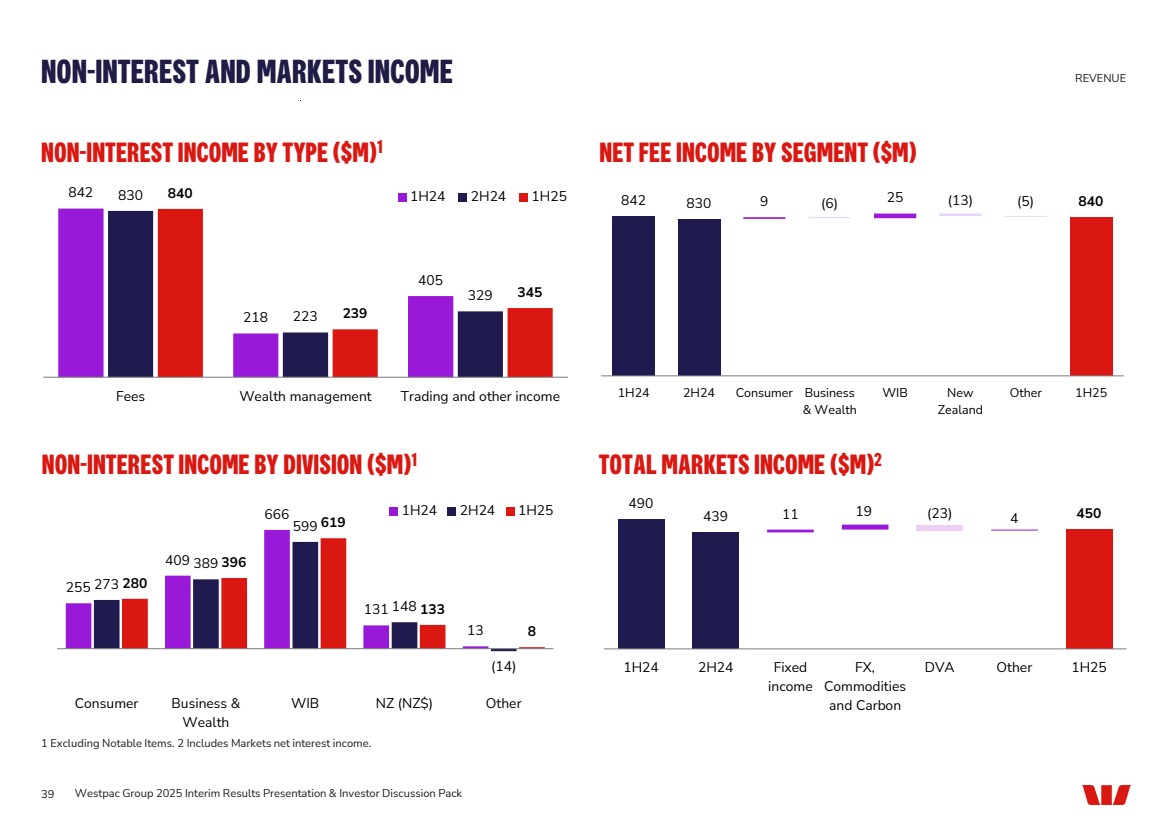
| NET FEE INCOME BY SEGMENT ($M) TOTAL MARKETS INCOME ($M)2 NON-INTEREST INCOME BY TYPE ($M)1 NON-INTEREST AND MARKETS INCOME REVENUE 1 Excluding Notable Items. 2 Includes Markets net interest income. 39 Westpac Group 2025 Interim Results Presentation & Investor Discussion Pack 842 830 9 (6) 25 (13) (5) 840 1H24 2H24 Consumer Business & Wealth WIB New Zealand Other 1H25 842 218 405 830 223 329 840 239 345 Fees Wealth management Trading and other income 1H24 2H24 1H25 NON-INTEREST INCOME BY DIVISION ($M)1 255 409 666 131 13 273 389 599 148 (14) 280 396 619 133 8 Consumer Business & Wealth WIB NZ (NZ$) Other 1H24 2H24 1H25 11 19 4 490 439 (23) 450 1H24 2H24 Fixed income FX, Commodities and Carbon DVA Other 1H25 |
| 376 128 (261) 5,395 5,549 5,698 (94) 1H24 2H24 Ongoing expenses Cost reset benefits UNITE Investments (ex. UNITE) 1H25 EXPENSES EARNINGS 40 EXPENSES 1H25 – 2H24 ($M) Westpac Group 2025 Interim Results Presentation & Investor Discussion Pack 3% INCREASE 3% INCREASE Lower investment spend due to seasonality and completion of risk and reg projects, partly offset by higher software amortisation 1H25 UNITE investment $251m, 77% expensed Cost Reset benefits including: • Simpler operating model • Reduced branch footprint • Digitisation Wages growth and increased FTE to support UNITE and from new bankers |
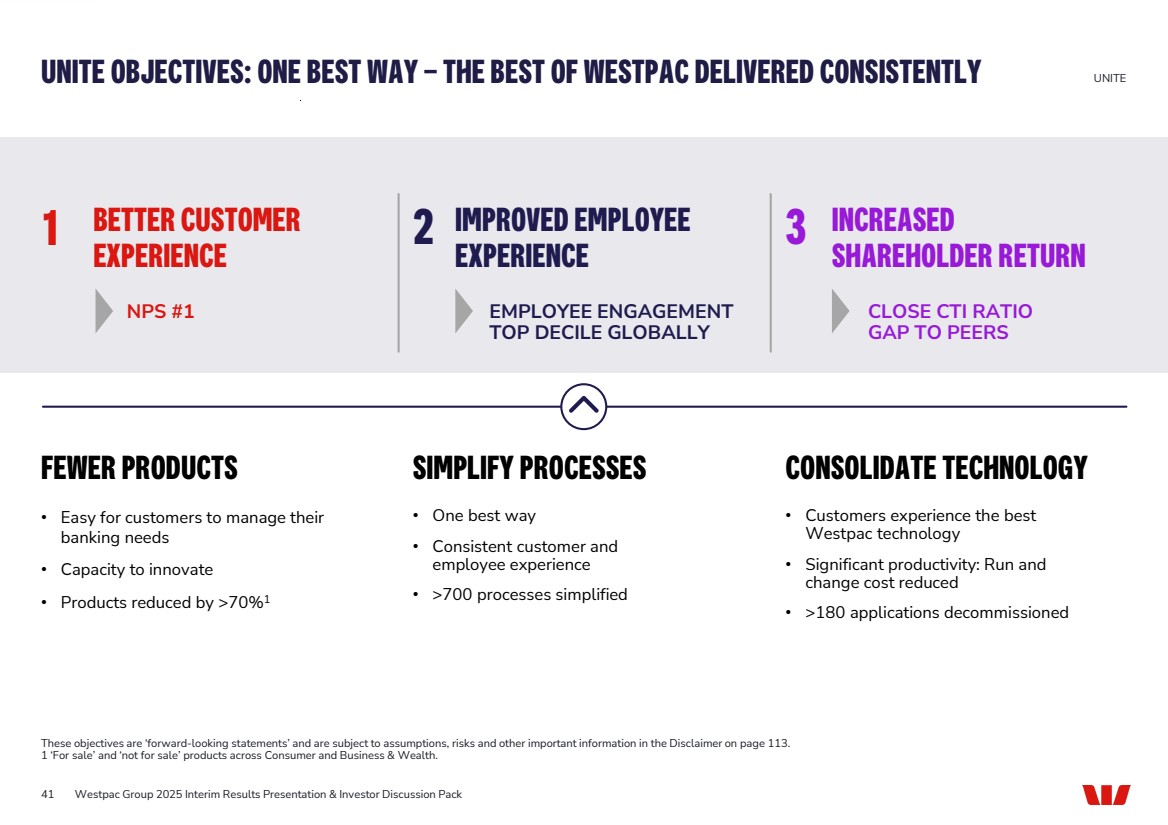
| UNITE OBJECTIVES: ONE BEST WAY – THE BEST OF WESTPAC DELIVERED CONSISTENTLY These objectives are ‘forward-looking statements’ and are subject to assumptions, risks and other important information in the Disclaimer on page 113. 1 ‘For sale’ and ‘not for sale’ products across Consumer and Business & Wealth. 41 CONSOLIDATE TECHNOLOGY • Customers experience the best Westpac technology • Significant productivity: Run and change cost reduced • >180 applications decommissioned FEWER PRODUCTS • Easy for customers to manage their banking needs • Capacity to innovate • Products reduced by >70%1 SIMPLIFY PROCESSES • One best way • Consistent customer and employee experience • >700 processes simplified BETTER CUSTOMER EXPERIENCE 1 NPS #1 IMPROVED EMPLOYEE EXPERIENCE 2 EMPLOYEE ENGAGEMENT TOP DECILE GLOBALLY INCREASED SHAREHOLDER RETURN 3 CLOSE CTI RATIO GAP TO PEERS Westpac Group 2025 Interim Results Presentation & Investor Discussion Pack UNITE |
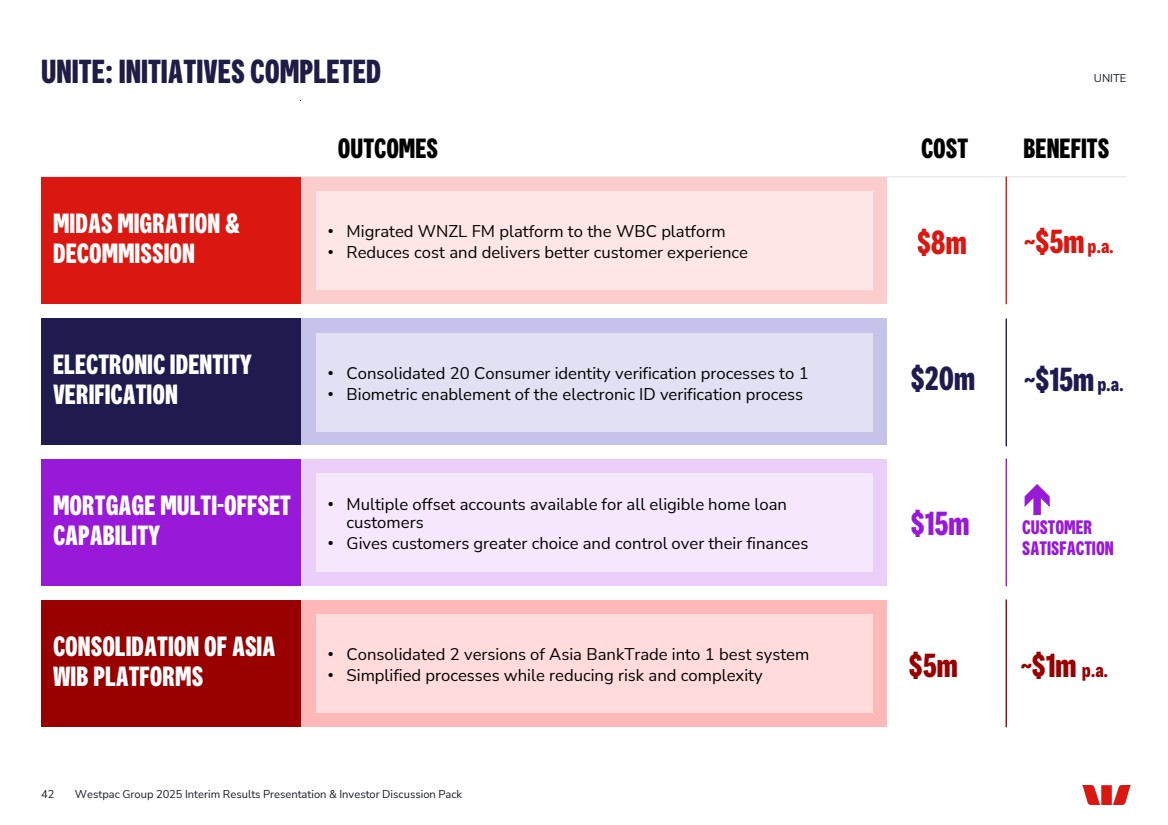
| MIDAS MIGRATION & DECOMMISSION ELECTRONIC IDENTITY VERIFICATION MORTGAGE MULTI-OFFSET CAPABILITY CONSOLIDATION OF ASIA WIB PLATFORMS 42 UNITE: INITIATIVES COMPLETED $8m ~$5mp.a. $20m ~$15mp.a. $15m CUSTOMER SATISFACTION $5m • Migrated WNZL FM platform to the WBC platform • Reduces cost and delivers better customer experience • Consolidated 20 Consumer identity verification processes to 1 • Biometric enablement of the electronic ID verification process • Multiple offset accounts available for all eligible home loan customers • Gives customers greater choice and control over their finances • Consolidated 2 versions of Asia BankTrade into 1 best system • Simplified processes while reducing risk and complexity ~$1m p.a. Westpac Group 2025 Interim Results Presentation & Investor Discussion Pack UNITE OUTCOMES COST BENEFITS |
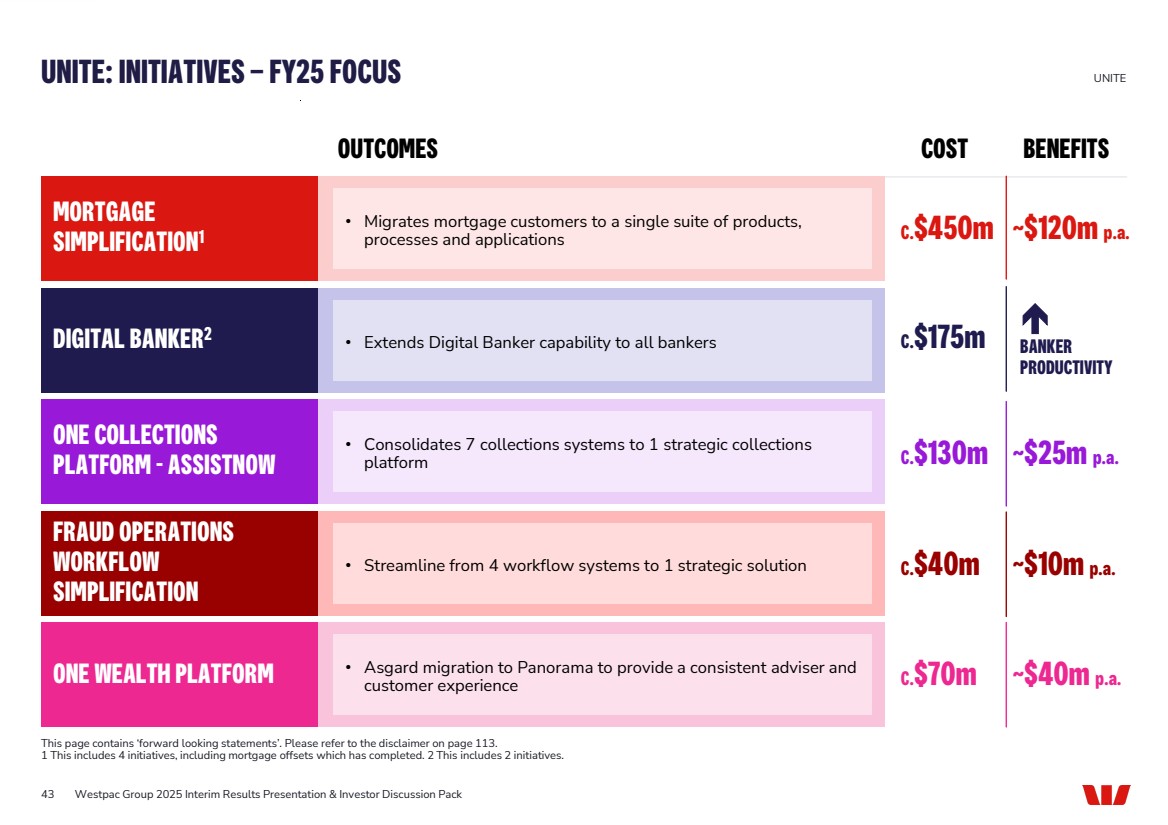
| 43 UNITE: INITIATIVES – FY25 FOCUS This page contains ‘forward looking statements’. Please refer to the disclaimer on page 113. 1 This includes 4 initiatives, including mortgage offsets which has completed. 2 This includes 2 initiatives. MORTGAGE SIMPLIFICATION1 • Migrates mortgage customers to a single suite of products, processes and applications C.$450m ~$120m p.a. DIGITAL BANKER2 • Extends Digital Banker capability to all bankers C.$175m BANKER PRODUCTIVITY ONE COLLECTIONS PLATFORM - ASSISTNOW • Consolidates 7 collections systems to 1 strategic collections platform C.$130m ~$25m p.a. FRAUD OPERATIONS WORKFLOW SIMPLIFICATION • Streamline from 4 workflow systems to 1 strategic solution C.$40m ~$10m p.a. ONE WEALTH PLATFORM C.$70m ~$40m p.a. • Asgard migration to Panorama to provide a consistent adviser and customer experience OUTCOMES COST BENEFITS Westpac Group 2025 Interim Results Presentation & Investor Discussion Pack UNITE |
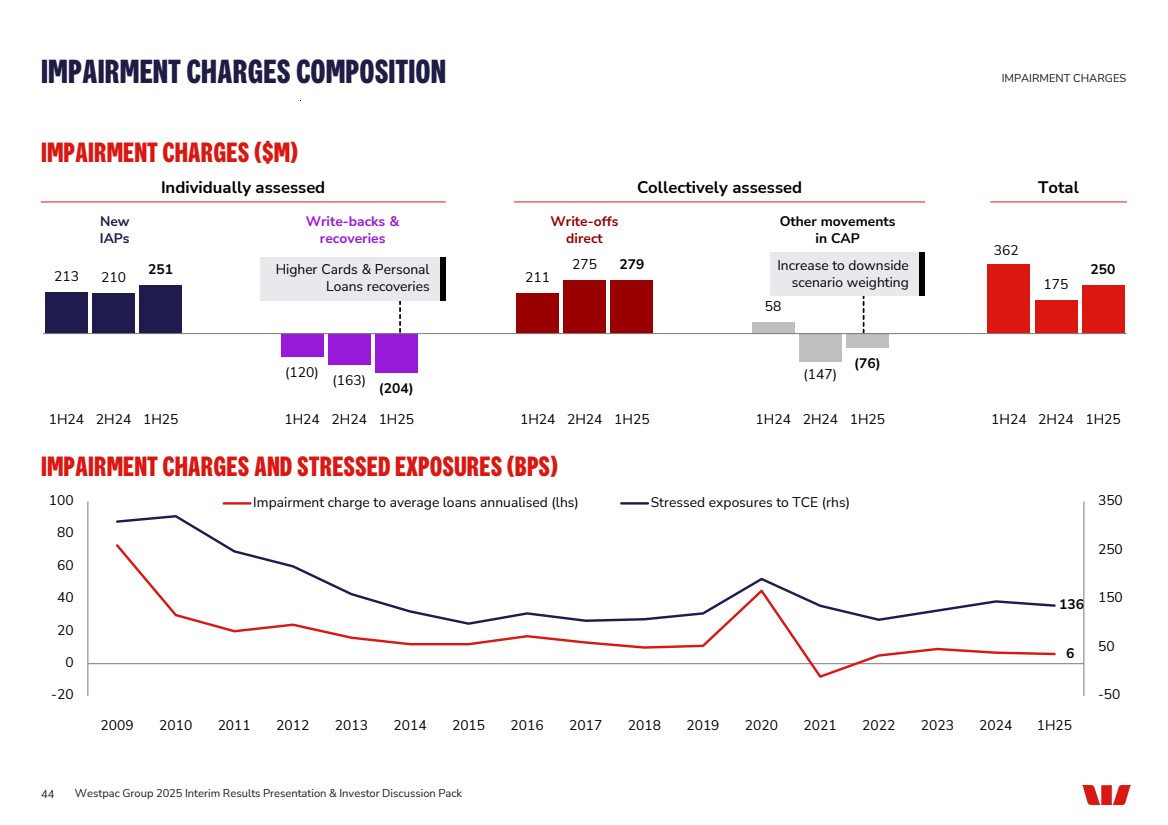
| 213 210 251 (120) (163) (204) 211 275 279 58 (147) (76) 362 175 250 1H24 2H24 1H25 1H24 2H24 1H25 1H24 2H24 1H25 1H24 2H24 1H25 1H24 2H24 1H25 IMPAIRMENT CHARGES ($M) 44 IMPAIRMENT CHARGES AND STRESSED EXPOSURES (BPS) 6 136 -50 50 150 250 350 -20 0 20 40 60 80 100 2009 2010 2011 2012 2013 2014 2015 2016 2017 2018 2019 2020 2021 2022 2023 2024 1H25 Impairment charge to average loans annualised (lhs) Stressed exposures to TCE (rhs) IMPAIRMENT CHARGES COMPOSITION IMPAIRMENT CHARGES New IAPs Write-backs & recoveries Write-offs direct Other movements in CAP Individually assessed Collectively assessed Total Westpac Group 2025 Interim Results Presentation & Investor Discussion Pack Higher Cards & Personal Loans recoveries Increase to downside scenario weighting |
| CREDIT QUALITY AND PROVISIONS |

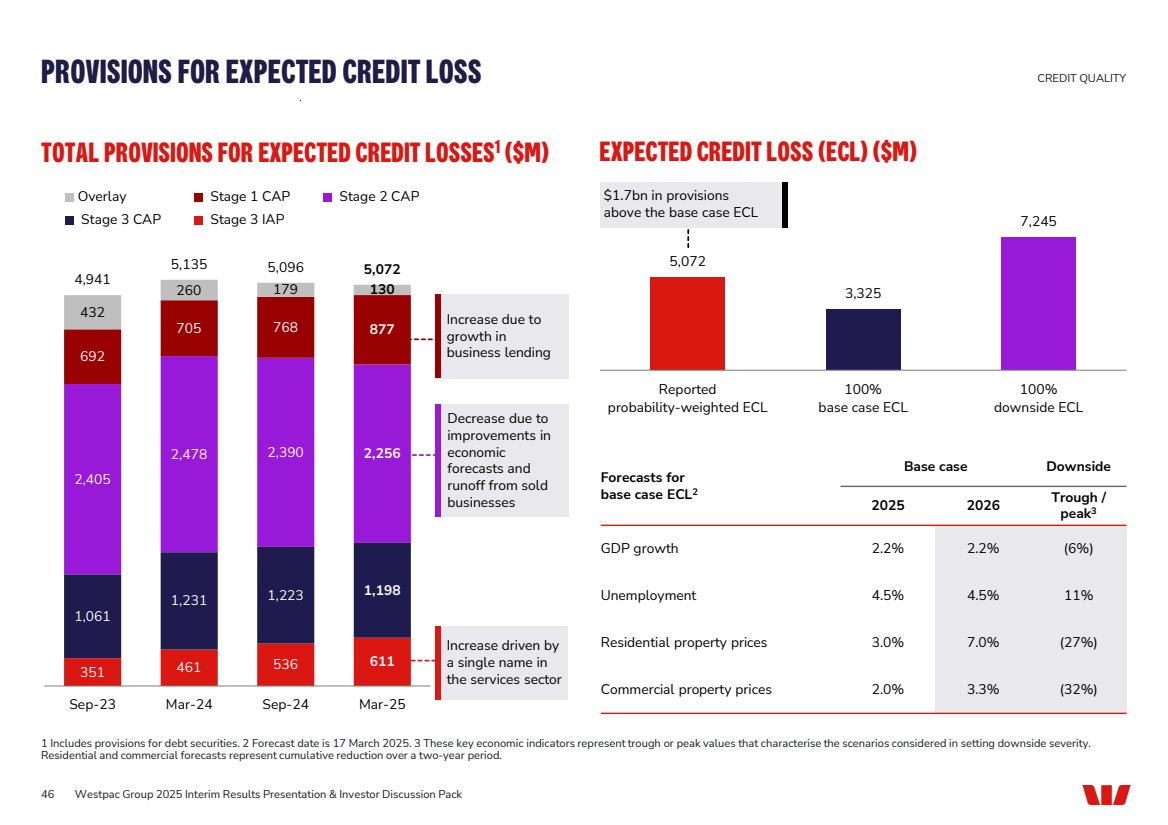
| 5,072 3,325 7,245 Reported probability-weighted ECL 100% base case ECL 100% downside ECL Forecasts for base case ECL2 Base case Downside 2025 2026 Trough / peak3 GDP growth 2.2% 2.2% (6%) Unemployment 4.5% 4.5% 11% Residential property prices 3.0% 7.0% (27%) Commercial property prices 2.0% 3.3% (32%) 351 461 536 611 1,061 1,231 1,223 1,198 2,405 2,478 2,390 2,256 692 705 768 877 432 260 179 130 4,941 5,135 5,096 5,072 Sep-23 Mar-24 Sep-24 Mar-25 Overlay Stage 1 CAP Stage 2 CAP Stage 3 CAP Stage 3 IAP TOTAL PROVISIONS FOR EXPECTED CREDIT LOSSES EXPECTED CREDIT LOSS (ECL) ($M) 1 ($M) PROVISIONS FOR EXPECTED CREDIT LOSS CREDIT QUALITY 1 Includes provisions for debt securities. 2 Forecast date is 17 March 2025. 3 These key economic indicators represent trough or peak values that characterise the scenarios considered in setting downside severity. Residential and commercial forecasts represent cumulative reduction over a two-year period. Increase driven by a single name in the services sector Increase due to growth in business lending 46 $1.7bn in provisions above the base case ECL Westpac Group 2025 Interim Results Presentation & Investor Discussion Pack Decrease due to improvements in economic forecasts and runoff from sold businesses |
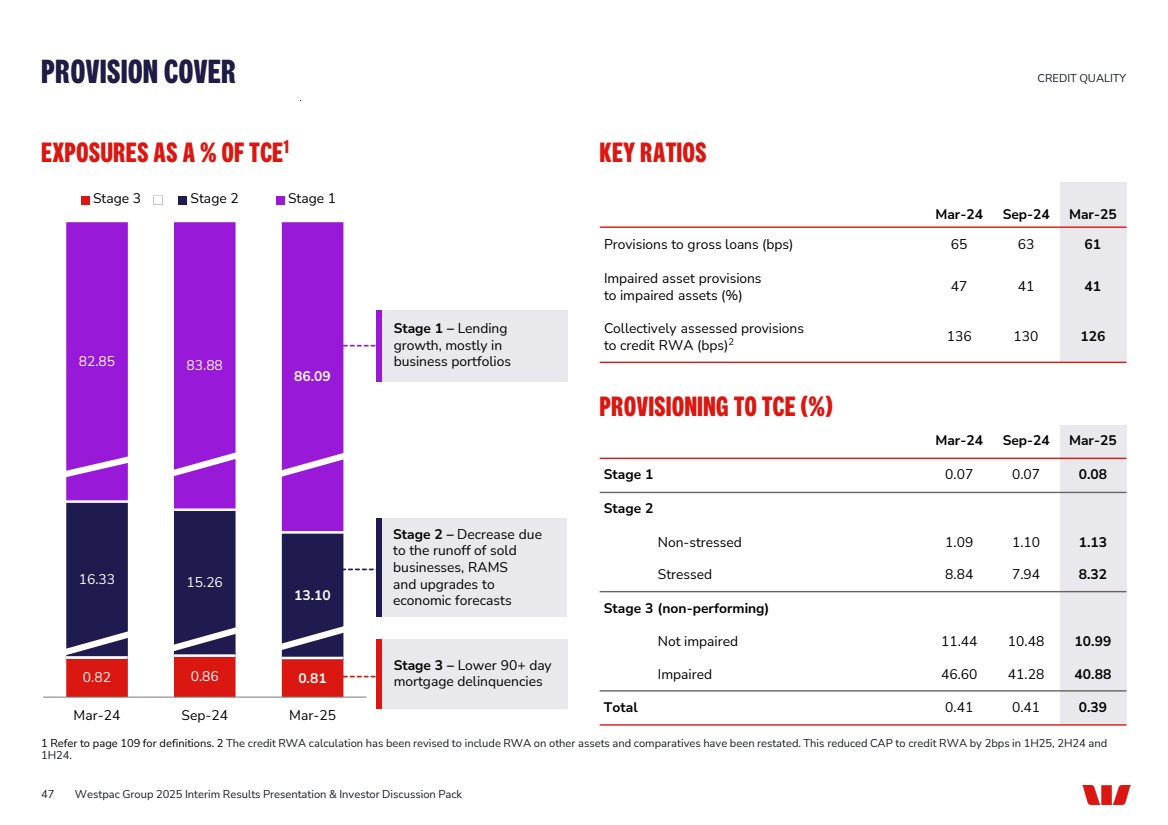
| KEY RATIOS Mar-24 Sep-24 Mar-25 Provisions to gross loans (bps) 65 63 61 Impaired asset provisions to impaired assets (%) 47 41 41 Collectively assessed provisions to credit RWA (bps)2 136 130 126 PROVISIONING TO TCE (%) EXPOSURES AS A % OF TCE1 PROVISION COVER CREDIT QUALITY 1 Refer to page 109 for definitions. 2 The credit RWA calculation has been revised to include RWA on other assets and comparatives have been restated. This reduced CAP to credit RWA by 2bps in 1H25, 2H24 and 1H24. 0.82 0.86 0.81 16.33 15.26 13.10 82.85 83.88 86.09 Mar-24 Sep-24 Mar-25 Stage 3 Stage 2 Stage 1 Mar-24 Sep-24 Mar-25 Stage 1 0.07 0.07 0.08 Stage 2 Non-stressed 1.09 1.10 1.13 Stressed 8.84 7.94 8.32 Stage 3 (non-performing) Not impaired 11.44 10.48 10.99 Impaired 46.60 41.28 40.88 Total 0.41 0.41 0.39 47 Westpac Group 2025 Interim Results Presentation & Investor Discussion Pack Stage 3 – Lower 90+ day mortgage delinquencies Stage 2 – Decrease due to the runoff of sold businesses, RAMS and upgrades to economic forecasts Stage 1 – Lending growth, mostly in business portfolios |
| 48 TOTAL COMMITTED EXPOSURE (TCE) BY RISK GRADE AT 31 MARCH 2025 ($M) Standard and Poor’s risk grade1 Australia NZ / Pacific Other overseas Group % of total AAA to AA- 200,162 26,527 30,699 257,388 20% A+ to A- 43,096 5,004 12,611 60,711 5% BBB+ to BBB- 86,955 11,006 12,025 109,986 9% BB+ to BB 95,902 14,988 731 111,621 9% BB- to B+ 51,365 8,186 215 59,766 5% <B+ 8,621 2,196 64 10,881 1% Mortgages 574,282 74,449 - 648,731 49% Other consumer products 24,863 3,864 - 28,727 2% TCE 1,085,246 146,220 56,345 1,287,811 TCE at 30 September 2024 1,075,520 143,546 33,275 1,252,341 Exposure by region2 (%) 85% 11% 4% 100% TOP 10 INSTITUTIONAL EXPOSURES TO CORPORATIONS AND NBFIS3 (% OF TCE) 1.1 1.1 1.2 1.3 Sep-22 Sep-23 Sep-24 Mar-25 TOP 10 EXPOSURES TO CORPORATIONS & NBFIS AT 31 MARCH 2025 ($M)4 0 600 1,200 1,800 2,400 3,000 A-BBB BBB+ A-A BBB+ A-A-A-AA-PORTFOLIO COMPOSITION CREDIT QUALITY 1 Risk grade equivalent. 2 Region is based on booking office. 3 NBFI is non-bank financial institutions. 4 Institutional counterparties; S&P rating or equivalent. Clearing house membership Westpac Group 2025 Interim Results Presentation & Investor Discussion Pack |

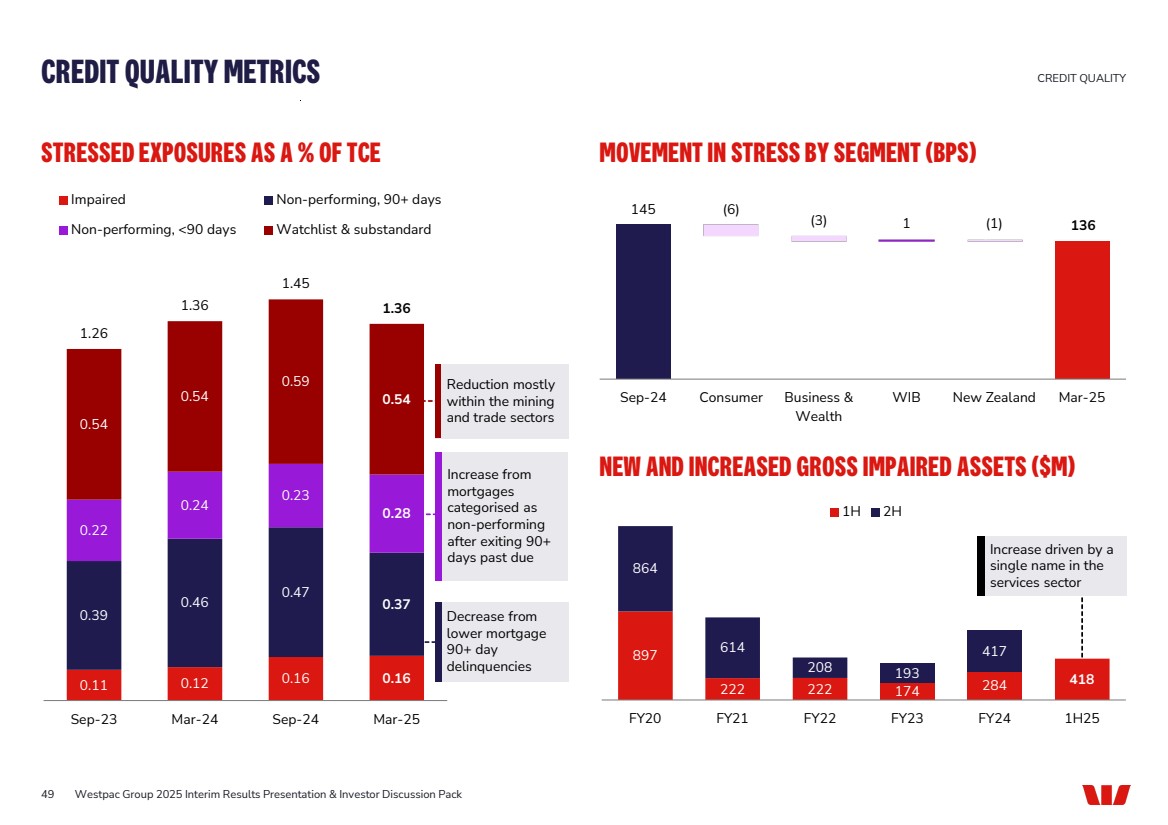
| 0.11 0.12 0.16 0.16 0.39 0.46 0.47 0.37 0.22 0.24 0.23 0.28 0.54 0.54 0.59 0.54 1.26 1.36 1.45 1.36 Sep-23 Mar-24 Sep-24 Mar-25 Impaired Non-performing, 90+ days Non-performing, <90 days Watchlist & substandard MOVEMENT IN STRESS BY SEGMENT (BPS) 145 (6) (3) 1 (1) 136 Sep-24 Consumer Business & Wealth WIB New Zealand Mar-25 NEW AND INCREASED GROSS IMPAIRED ASSETS ($M) 897 222 222 174 284 418 864 614 208 193 417 FY20 FY21 FY22 FY23 FY24 1H25 1H 2H STRESSED EXPOSURES AS A % OF TCE CREDIT QUALITY METRICS CREDIT QUALITY 49 Westpac Group 2025 Interim Results Presentation & Investor Discussion Pack Decrease from lower mortgage 90+ day delinquencies Reduction mostly within the mining and trade sectors Increase from mortgages categorised as non-performing after exiting 90+ days past due Increase driven by a single name in the services sector |
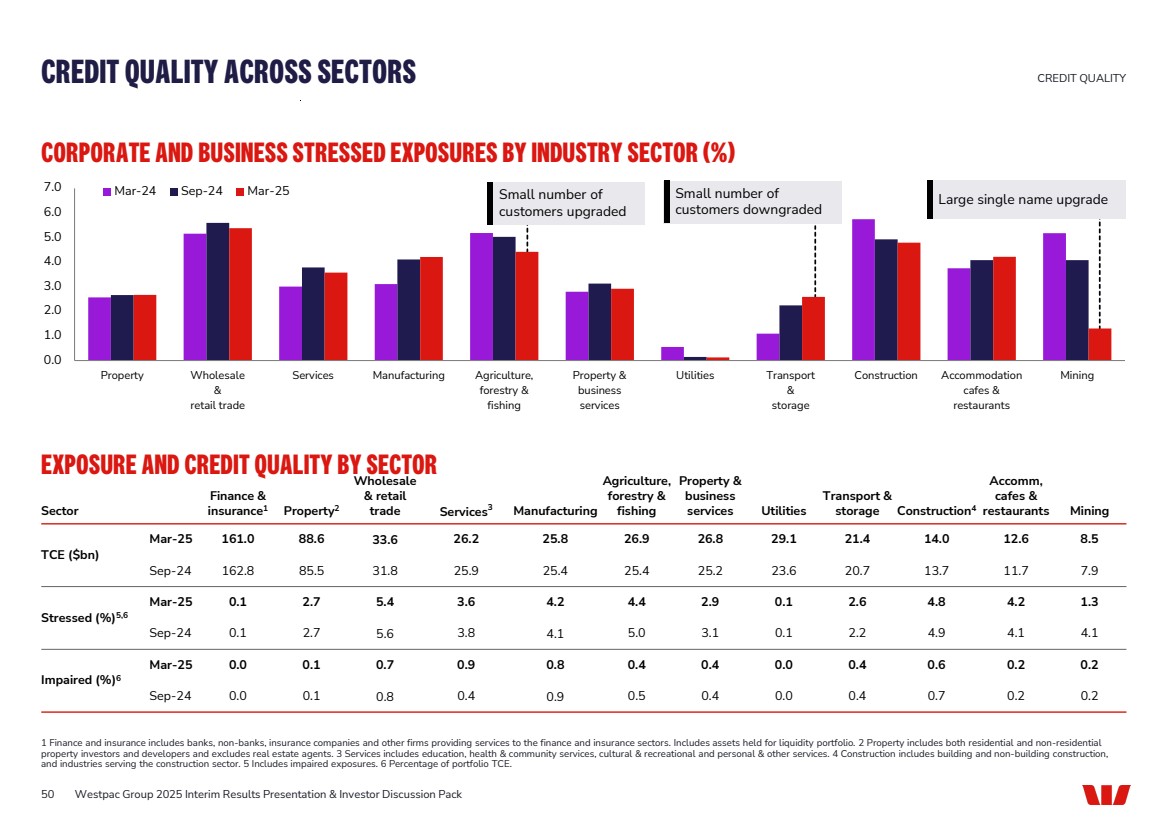
| CORPORATE AND BUSINESS STRESSED EXPOSURES BY INDUSTRY SECTOR (%) EXPOSURE AND CREDIT QUALITY BY SECTOR Sector Finance & insurance1 Property2 Wholesale & retail trade Services3 Manufacturing Agriculture, forestry & fishing Property & business services Utilities Transport & storage Construction4 Accomm, cafes & restaurants Mining TCE ($bn) Mar-25 161.0 88.6 33.6 26.2 25.8 26.9 26.8 29.1 21.4 14.0 12.6 8.5 Sep-24 162.8 85.5 31.8 25.9 25.4 25.4 25.2 23.6 20.7 13.7 11.7 7.9 Stressed (%)5,6 Mar-25 0.1 2.7 5.4 3.6 4.2 4.4 2.9 0.1 2.6 4.8 4.2 1.3 Sep-24 0.1 2.7 5.6 3.8 4.1 5.0 3.1 0.1 2.2 4.9 4.1 4.1 Impaired (%)6 Mar-25 0.0 0.1 0.7 0.9 0.8 0.4 0.4 0.0 0.4 0.6 0.2 0.2 Sep-24 0.0 0.1 0.8 0.4 0.9 0.5 0.4 0.0 0.4 0.7 0.2 0.2 CREDIT QUALITY ACROSS SECTORS CREDIT QUALITY 1 Finance and insurance includes banks, non-banks, insurance companies and other firms providing services to the finance and insurance sectors. Includes assets held for liquidity portfolio. 2 Property includes both residential and non-residential property investors and developers and excludes real estate agents. 3 Services includes education, health & community services, cultural & recreational and personal & other services. 4 Construction includes building and non-building construction, and industries serving the construction sector. 5 Includes impaired exposures. 6 Percentage of portfolio TCE. 50 Westpac Group 2025 Interim Results Presentation & Investor Discussion Pack Small number of customers downgraded Small number of customers upgraded Large single name upgrade 0.0 1.0 2.0 3.0 4.0 5.0 6.0 7.0 Property Wholesale & retail trade Services Manufacturing Agriculture, forestry & fishing Property & business services Utilities Transport & storage Construction Accommodation cafes & restaurants Mining Mar-24 Sep-24 Mar-25 |
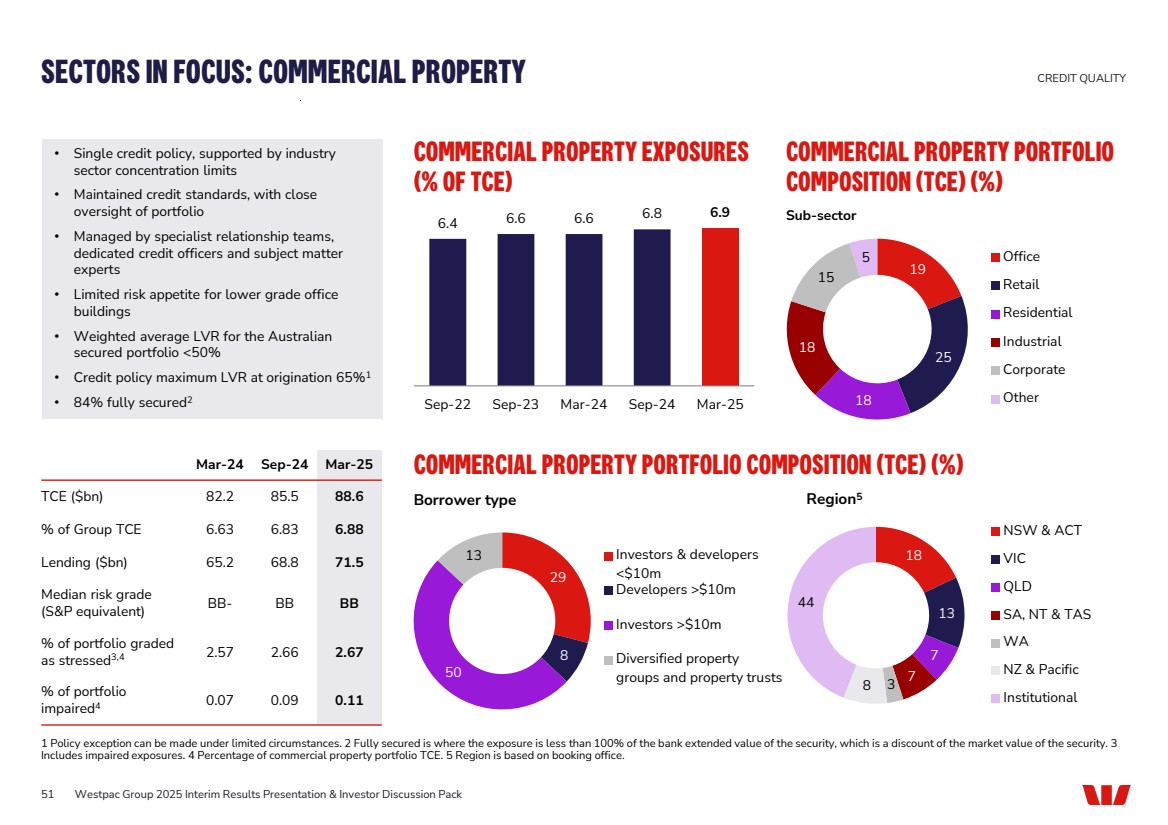
| Mar-24 Sep-24 Mar-25 TCE ($bn) 82.2 85.5 88.6 % of Group TCE 6.63 6.83 6.88 Lending ($bn) 65.2 68.8 71.5 Median risk grade (S&P equivalent) BB- BB BB % of portfolio graded as stressed3,4 2.57 2.66 2.67 % of portfolio impaired4 0.07 0.09 0.11 COMMERCIAL PROPERTY PORTFOLIO COMPOSITION (TCE) (%) 18 13 7 7 8 3 44 NSW & ACT VIC QLD SA, NT & TAS WA NZ & Pacific Institutional • Single credit policy, supported by industry sector concentration limits • Maintained credit standards, with close oversight of portfolio • Managed by specialist relationship teams, dedicated credit officers and subject matter experts • Limited risk appetite for lower grade office buildings • Weighted average LVR for the Australian secured portfolio <50% • Credit policy maximum LVR at origination 65%1 • 84% fully secured2 COMMERCIAL PROPERTY EXPOSURES (% OF TCE) 6.4 6.6 6.6 6.8 6.9 Sep-22 Sep-23 Mar-24 Sep-24 Mar-25 COMMERCIAL PROPERTY PORTFOLIO COMPOSITION (TCE) (%) 19 25 18 18 15 5 Office Retail Residential Industrial Corporate Other SECTORS IN FOCUS: COMMERCIAL PROPERTY CREDIT QUALITY 1 Policy exception can be made under limited circumstances. 2 Fully secured is where the exposure is less than 100% of the bank extended value of the security, which is a discount of the market value of the security. 3 Includes impaired exposures. 4 Percentage of commercial property portfolio TCE. 5 Region is based on booking office. Sub-sector Borrower type Region5 51 Westpac Group 2025 Interim Results Presentation & Investor Discussion Pack 29 8 50 13 Investors & developers <$10m Developers >$10m Investors >$10m Diversified property groups and property trusts |
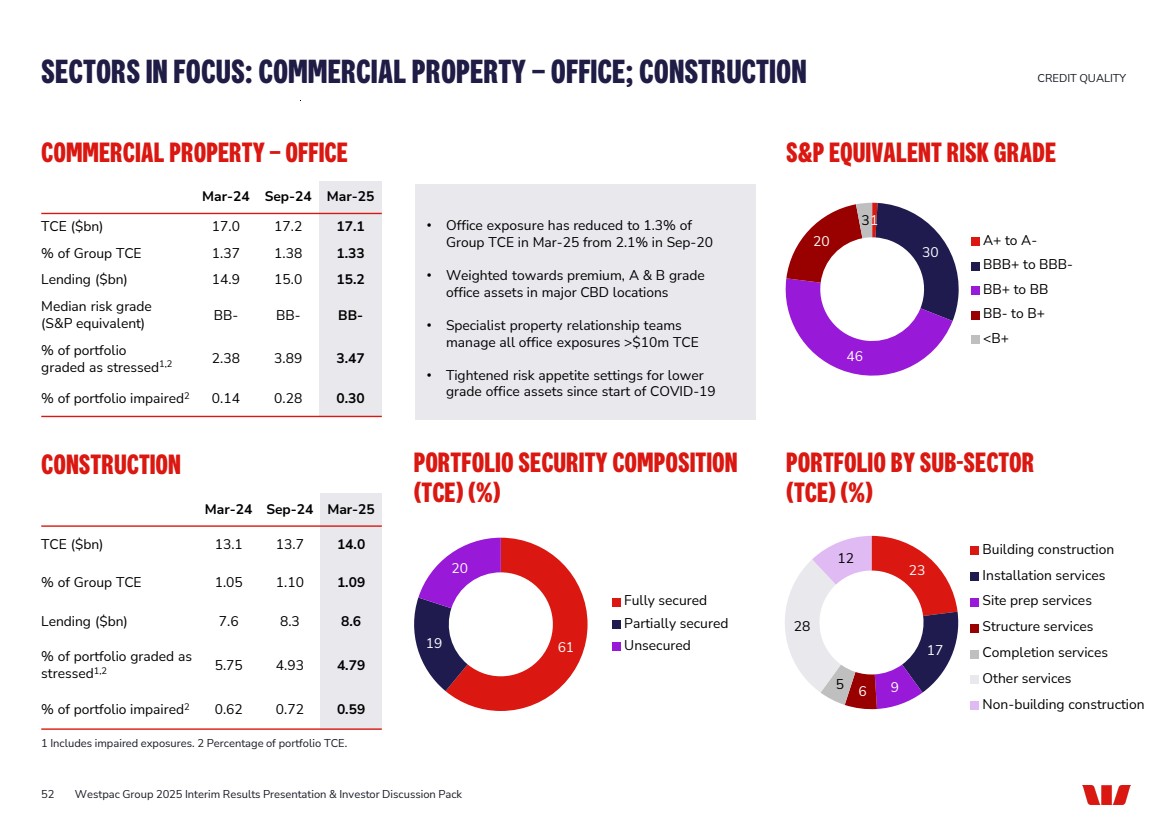
| CONSTRUCTION Mar-24 Sep-24 Mar-25 TCE ($bn) 13.1 13.7 14.0 % of Group TCE 1.05 1.10 1.09 Lending ($bn) 7.6 8.3 8.6 % of portfolio graded as stressed1,2 5.75 4.93 4.79 % of portfolio impaired2 0.62 0.72 0.59 PORTFOLIO SECURITY COMPOSITION (TCE) (%) 19 61 20 Fully secured Partially secured Unsecured PORTFOLIO BY SUB-SECTOR (TCE) (%) 23 17 5 6 9 28 12 Building construction Installation services Site prep services Structure services Completion services Other services Non-building construction COMMERCIAL PROPERTY – OFFICE Mar-24 Sep-24 Mar-25 TCE ($bn) 17.0 17.2 17.1 % of Group TCE 1.37 1.38 1.33 Lending ($bn) 14.9 15.0 15.2 Median risk grade (S&P equivalent) BB- BB- BB- % of portfolio graded as stressed1,2 2.38 3.89 3.47 % of portfolio impaired2 0.14 0.28 0.30 • Office exposure has reduced to 1.3% of Group TCE in Mar-25 from 2.1% in Sep-20 • Weighted towards premium, A & B grade office assets in major CBD locations • Specialist property relationship teams manage all office exposures >$10m TCE • Tightened risk appetite settings for lower grade office assets since start of COVID-19 S&P EQUIVALENT RISK GRADE 1 30 46 20 3 A+ to A-BBB+ to BBB-BB+ to BB BB- to B+ <B+ SECTORS IN FOCUS: COMMERCIAL PROPERTY – OFFICE; CONSTRUCTION CREDIT QUALITY 1 Includes impaired exposures. 2 Percentage of portfolio TCE. 52 Westpac Group 2025 Interim Results Presentation & Investor Discussion Pack |
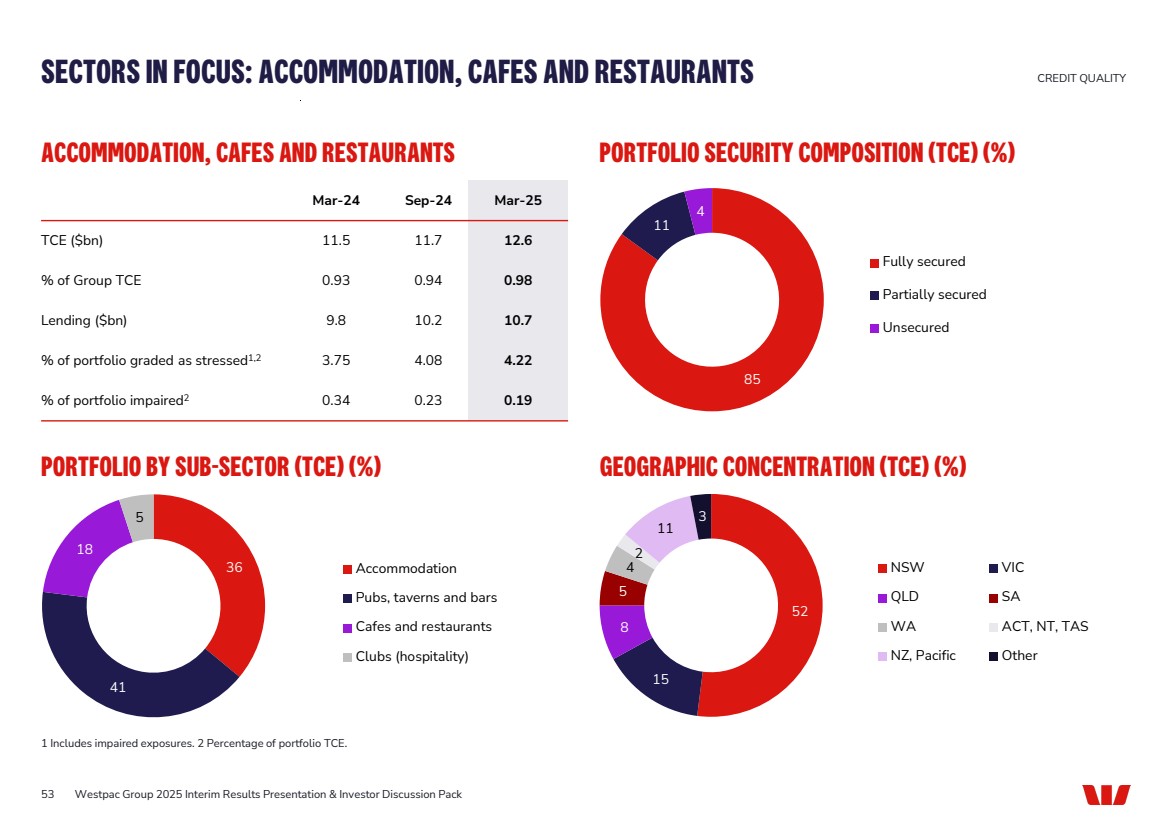
| ACCOMMODATION, CAFES AND RESTAURANTS PORTFOLIO SECURITY COMPOSITION (TCE) (%) PORTFOLIO BY SUB-SECTOR (TCE) (%) GEOGRAPHIC CONCENTRATION (TCE) (%) SECTORS IN FOCUS: ACCOMMODATION, CAFES AND RESTAURANTS CREDIT QUALITY 1 Includes impaired exposures. 2 Percentage of portfolio TCE. 53 Mar-24 Sep-24 Mar-25 TCE ($bn) 11.5 11.7 12.6 % of Group TCE 0.93 0.94 0.98 Lending ($bn) 9.8 10.2 10.7 % of portfolio graded as stressed1,2 3.75 4.08 4.22 % of portfolio impaired2 0.34 0.23 0.19 Westpac Group 2025 Interim Results Presentation & Investor Discussion Pack 85 11 4 Fully secured Partially secured Unsecured 36 41 18 5 Accommodation Pubs, taverns and bars Cafes and restaurants Clubs (hospitality) 52 15 8 5 4 2 11 3 NSW VIC QLD SA WA ACT, NT, TAS NZ, Pacific Other |
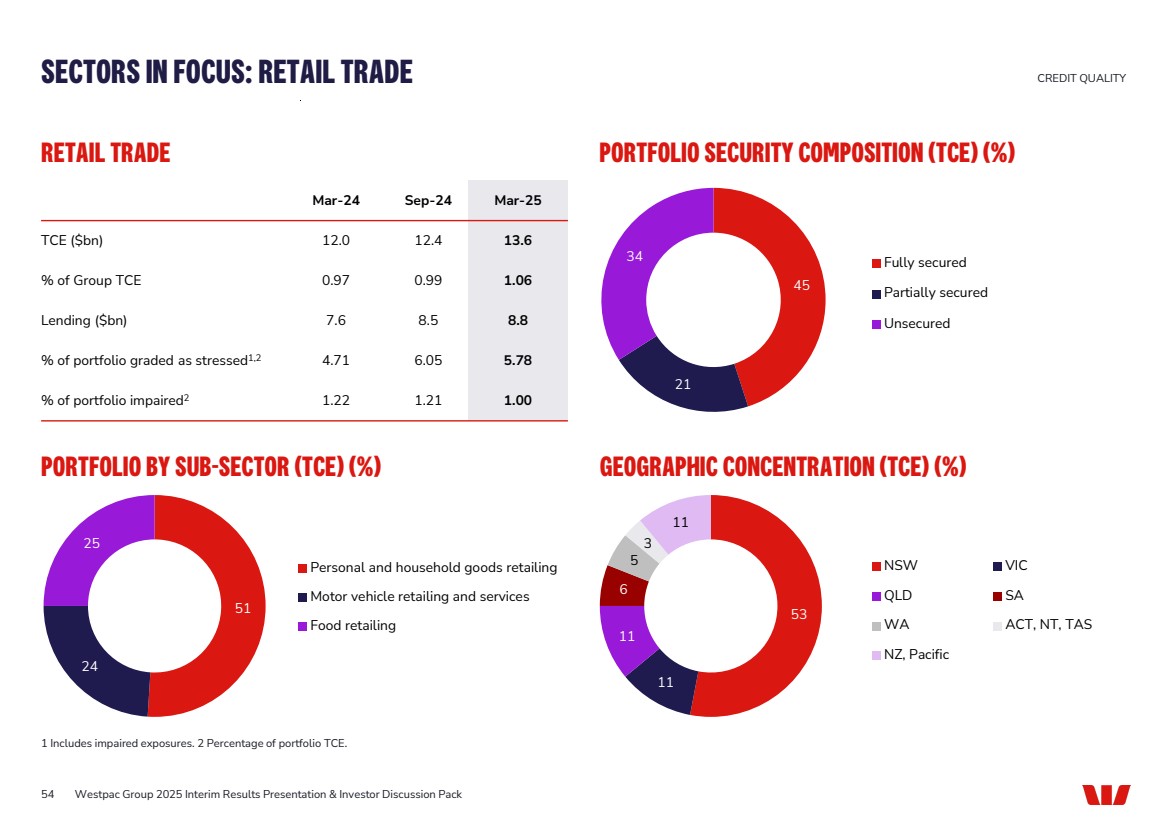
| Mar-24 Sep-24 Mar-25 TCE ($bn) 12.0 12.4 13.6 % of Group TCE 0.97 0.99 1.06 Lending ($bn) 7.6 8.5 8.8 % of portfolio graded as stressed1,2 4.71 6.05 5.78 % of portfolio impaired2 1.22 1.21 1.00 RETAIL TRADE PORTFOLIO SECURITY COMPOSITION (TCE) (%) PORTFOLIO BY SUB-SECTOR (TCE) (%) GEOGRAPHIC CONCENTRATION (TCE) (%) SECTORS IN FOCUS: RETAIL TRADE CREDIT QUALITY 1 Includes impaired exposures. 2 Percentage of portfolio TCE. 54 Westpac Group 2025 Interim Results Presentation & Investor Discussion Pack 45 21 34 Fully secured Partially secured Unsecured 51 24 25 Personal and household goods retailing Motor vehicle retailing and services Food retailing 53 11 11 6 5 3 11 NSW VIC QLD SA WA ACT, NT, TAS NZ, Pacific |
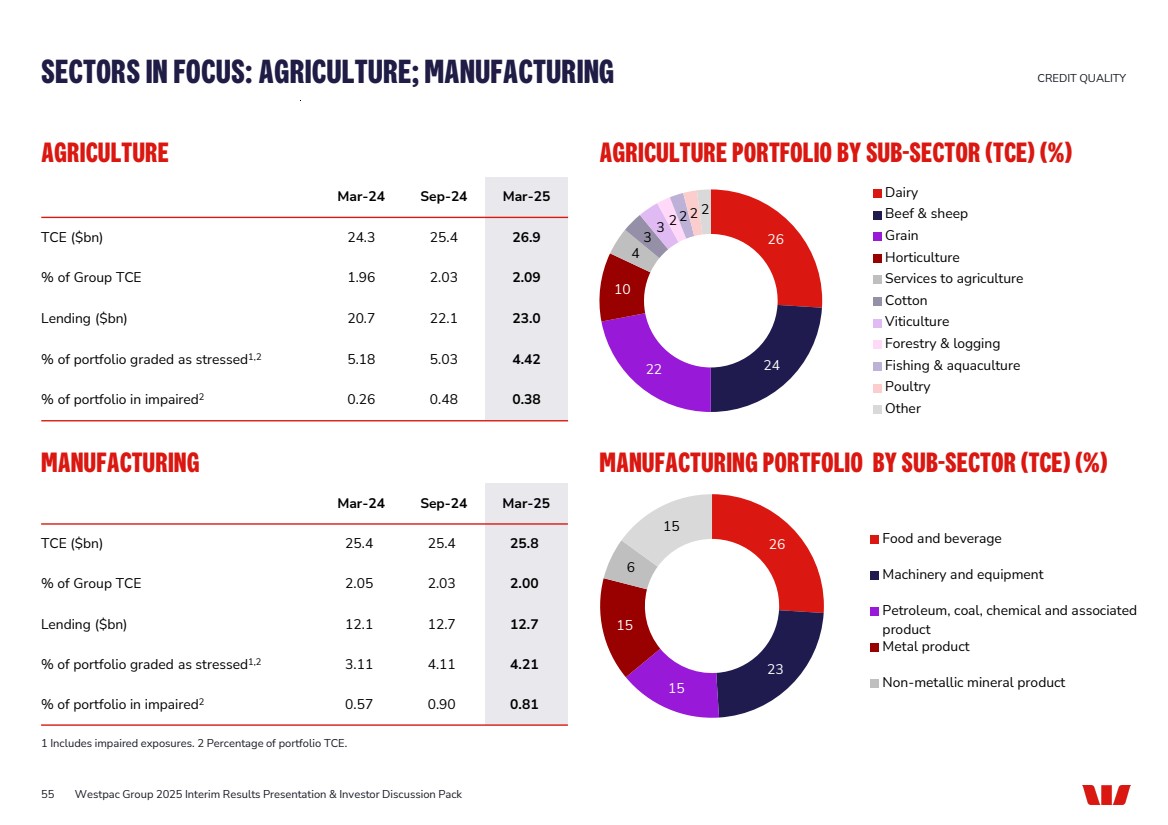
| AGRICULTURE AGRICULTURE PORTFOLIO BY SUB-SECTOR (TCE) (%) MANUFACTURING MANUFACTURING PORTFOLIO BY SUB-SECTOR (TCE) (%) SECTORS IN FOCUS: AGRICULTURE; MANUFACTURING CREDIT QUALITY 1 Includes impaired exposures. 2 Percentage of portfolio TCE. 55 Mar-24 Sep-24 Mar-25 TCE ($bn) 24.3 25.4 26.9 % of Group TCE 1.96 2.03 2.09 Lending ($bn) 20.7 22.1 23.0 % of portfolio graded as stressed1,2 5.18 5.03 4.42 % of portfolio in impaired2 0.26 0.48 0.38 Westpac Group 2025 Interim Results Presentation & Investor Discussion Pack Mar-24 Sep-24 Mar-25 TCE ($bn) 25.4 25.4 25.8 % of Group TCE 2.05 2.03 2.00 Lending ($bn) 12.1 12.7 12.7 % of portfolio graded as stressed1,2 3.11 4.11 4.21 % of portfolio in impaired2 0.57 0.90 0.81 26 23 15 15 6 15 Food and beverage Machinery and equipment Petroleum, coal, chemical and associated product Metal product Non-metallic mineral product 26 22 24 10 4 3 3 2 2 2 2 Dairy Beef & sheep Grain Horticulture Services to agriculture Cotton Viticulture Forestry & logging Fishing & aquaculture Poultry Other |
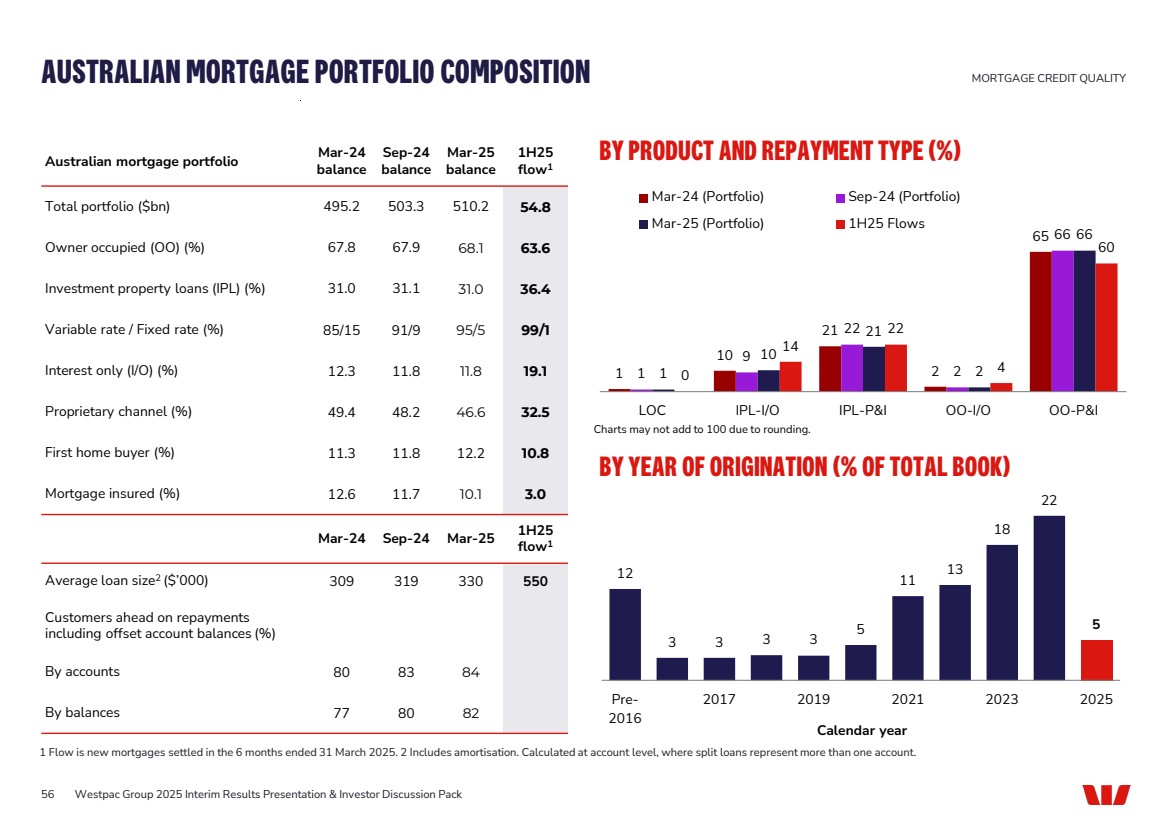
| 1 10 21 2 65 1 9 22 2 66 1 10 21 2 66 0 14 22 4 60 LOC IPL-I/O IPL-P&I OO-I/O OO-P&I Mar-24 (Portfolio) Sep-24 (Portfolio) Mar-25 (Portfolio) 1H25 Flows Australian mortgage portfolio Mar-24 balance Sep-24 balance Mar-25 balance 1H25 flow1 Total portfolio ($bn) 495.2 503.3 510.2 54.8 Owner occupied (OO) (%) 67.8 67.9 68.1 63.6 Investment property loans (IPL) (%) 31.0 31.1 31.0 36.4 Variable rate / Fixed rate (%) 85/15 91/9 95/5 99/1 Interest only (I/O) (%) 12.3 11.8 11.8 19.1 Proprietary channel (%) 49.4 48.2 46.6 32.5 First home buyer (%) 11.3 11.8 12.2 10.8 Mortgage insured (%) 12.6 11.7 10.1 3.0 Mar-24 Sep-24 Mar-25 1H25 flow1 Average loan size2 ($’000) 309 319 330 550 Customers ahead on repayments including offset account balances (%) By accounts 80 83 84 By balances 77 80 82 BY PRODUCT AND REPAYMENT TYPE (%) BY YEAR OF ORIGINATION (% OF TOTAL BOOK) AUSTRALIAN MORTGAGE PORTFOLIO COMPOSITION MORTGAGE CREDIT QUALITY 1 Flow is new mortgages settled in the 6 months ended 31 March 2025. 2 Includes amortisation. Calculated at account level, where split loans represent more than one account. 56 Calendar year Westpac Group 2025 Interim Results Presentation & Investor Discussion Pack 12 3 3 3 3 5 11 13 18 22 5 Pre-2016 2017 2019 2021 2023 2025 Charts may not add to 100 due to rounding. |
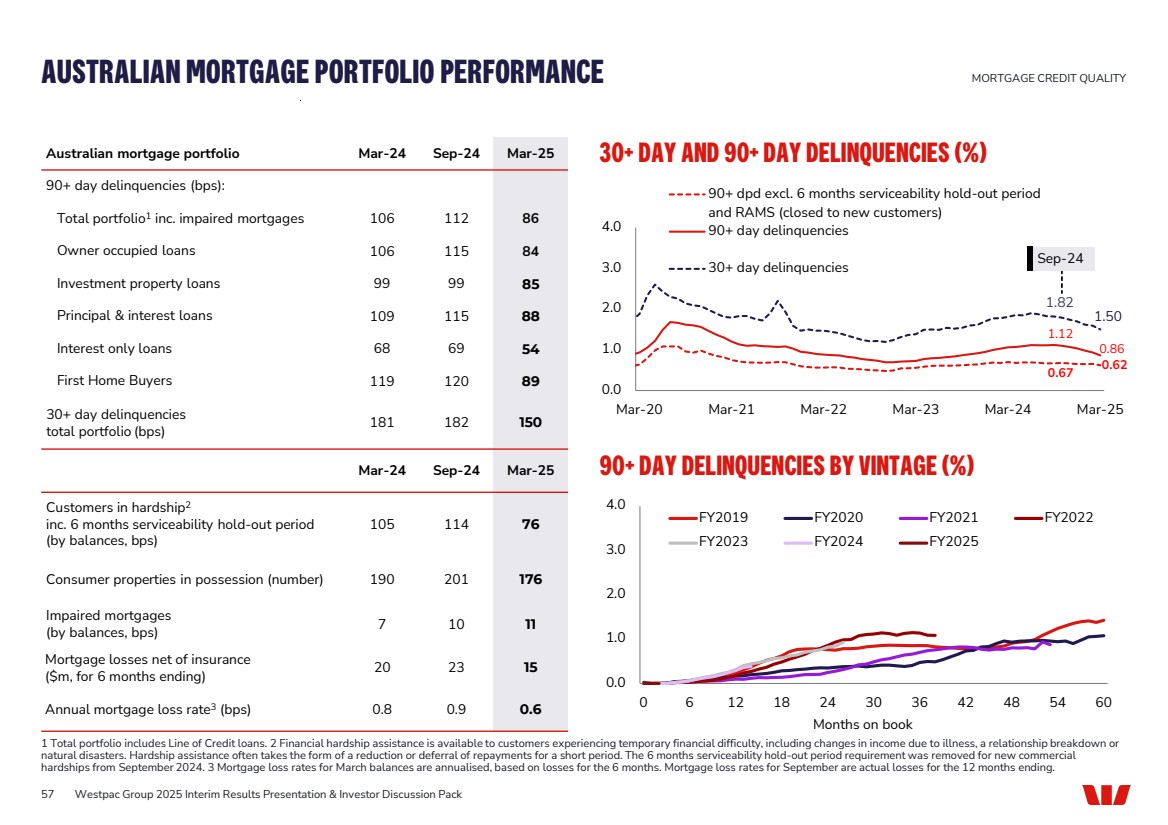
| 0.67 0.62 1.12 0.86 1.82 1.50 0.0 1.0 2.0 3.0 4.0 Mar-20 Mar-21 Mar-22 Mar-23 Mar-24 Mar-25 90+ dpd excl. 6 months serviceability hold-out period and RAMS (closed to new customers) 90+ day delinquencies 30+ day delinquencies Australian mortgage portfolio Mar-24 Sep-24 Mar-25 90+ day delinquencies (bps): Total portfolio1 inc. impaired mortgages 106 112 86 Owner occupied loans 106 115 84 Investment property loans 99 99 85 Principal & interest loans 109 115 88 Interest only loans 68 69 54 First Home Buyers 119 120 89 30+ day delinquencies total portfolio (bps) 181 182 150 Mar-24 Sep-24 Mar-25 Customers in hardship2 inc. 6 months serviceability hold-out period (by balances, bps) 105 114 76 Consumer properties in possession (number) 190 201 176 Impaired mortgages (by balances, bps) 7 10 11 Mortgage losses net of insurance ($m, for 6 months ending) 20 23 15 Annual mortgage loss rate3 (bps) 0.8 0.9 0.6 30+ DAY AND 90+ DAY DELINQUENCIES (%) 90+ DAY DELINQUENCIES BY VINTAGE (%) AUSTRALIAN MORTGAGE PORTFOLIO PERFORMANCE MORTGAGE CREDIT QUALITY 1 Total portfolio includes Line of Credit loans. 2 Financial hardship assistance is available to customers experiencing temporary financial difficulty, including changes in income due to illness, a relationship breakdown or natural disasters. Hardship assistance often takes the form of a reduction or deferral of repayments for a short period. The 6 months serviceability hold-out period requirement was removed for new commercial hardships from September 2024. 3 Mortgage loss rates for March balances are annualised, based on losses for the 6 months. Mortgage loss rates for September are actual losses for the 12 months ending. Months on book 57 Westpac Group 2025 Interim Results Presentation & Investor Discussion Pack 0.0 1.0 2.0 3.0 4.0 0 6 12 18 24 30 36 42 48 54 60 FY2019 FY2020 FY2021 FY2022 FY2023 FY2024 FY2025 Sep-24 |
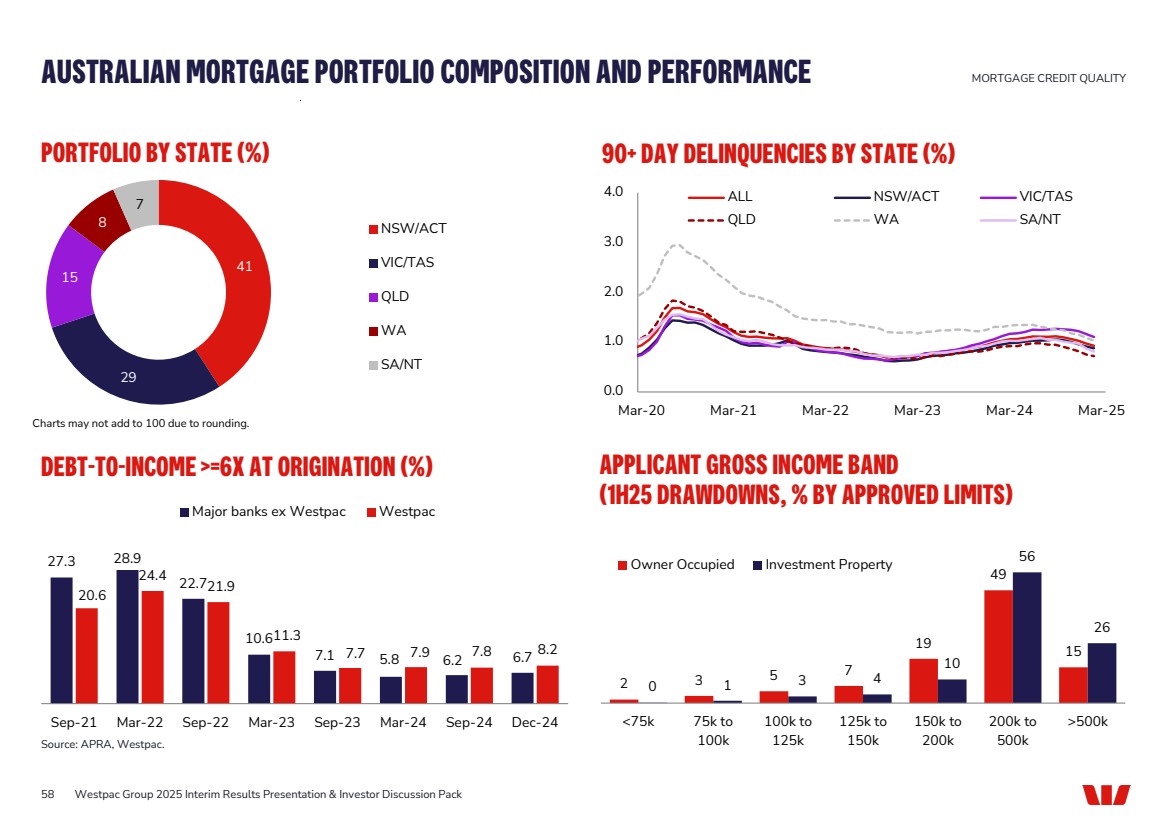
| DEBT-TO-INCOME >=6X AT ORIGINATION (%) AUSTRALIAN MORTGAGE PORTFOLIO COMPOSITION AND PERFORMANCE MORTGAGE CREDIT QUALITY Source: APRA, Westpac. 58 Westpac Group 2025 Interim Results Presentation & Investor Discussion Pack 41 29 15 8 7 NSW/ACT VIC/TAS QLD WA SA/NT PORTFOLIO BY STATE (%) 90+ DAY DELINQUENCIES BY STATE (%) 0.0 1.0 2.0 3.0 4.0 Mar-20 Mar-21 Mar-22 Mar-23 Mar-24 Mar-25 ALL NSW/ACT VIC/TAS QLD WA SA/NT APPLICANT GROSS INCOME BAND (1H25 DRAWDOWNS, % BY APPROVED LIMITS) 2 3 5 7 19 49 15 0 1 3 4 10 56 26 <75k 75k to 100k 100k to 125k 125k to 150k 150k to 200k 200k to 500k >500k 27.3 Owner Occupied Investment Property 28.9 22.7 10.6 7.1 5.8 6.2 6.7 20.6 24.4 21.9 11.3 7.7 7.9 7.8 8.2 Sep-21 Mar-22 Sep-22 Mar-23 Sep-23 Mar-24 Sep-24 Dec-24 Major banks ex Westpac Westpac Charts may not add to 100 due to rounding. |
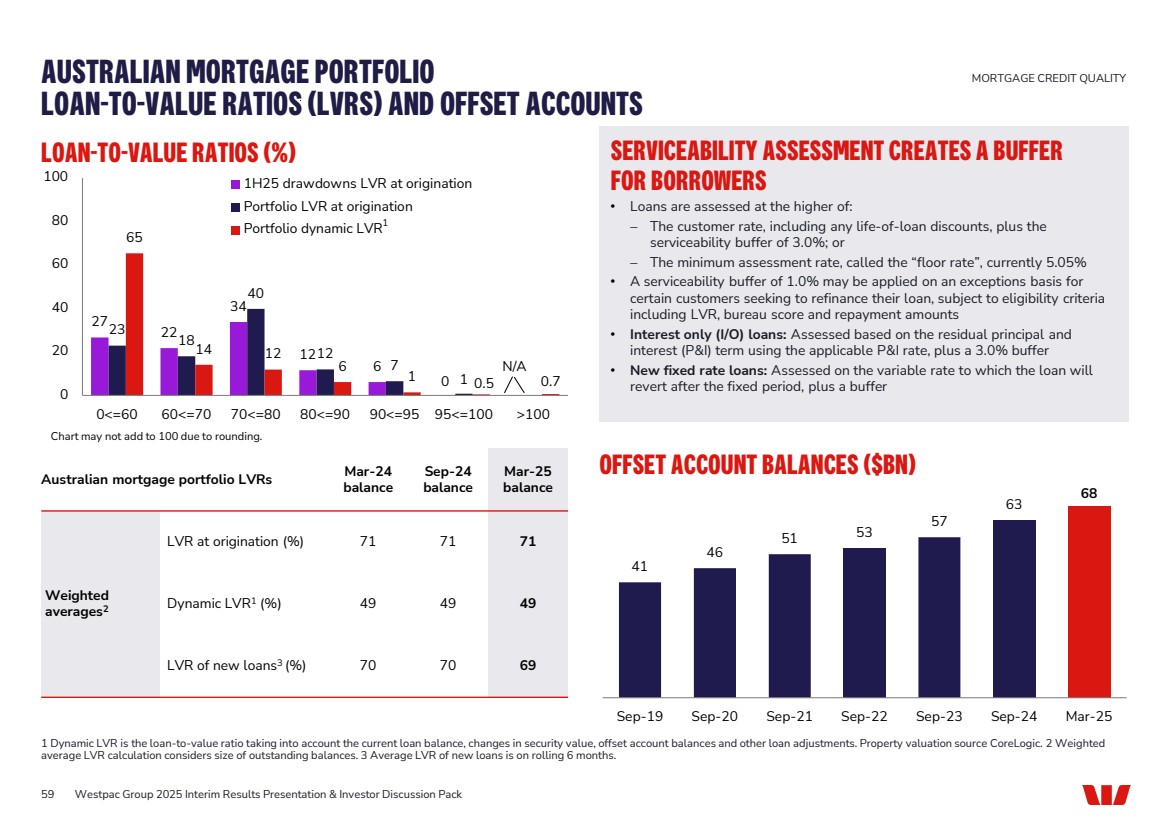
| LOAN-TO-VALUE RATIOS (%) SERVICEABILITY ASSESSMENT CREATES A BUFFER FOR BORROWERS AUSTRALIAN MORTGAGE PORTFOLIO LOAN-TO-VALUE RATIOS (LVRS) AND OFFSET ACCOUNTS MORTGAGE CREDIT QUALITY 1 Dynamic LVR is the loan-to-value ratio taking into account the current loan balance, changes in security value, offset account balances and other loan adjustments. Property valuation source CoreLogic. 2 Weighted average LVR calculation considers size of outstanding balances. 3 Average LVR of new loans is on rolling 6 months. Chart may not add to 100 due to rounding. N/A 1 • Loans are assessed at the higher of: − The customer rate, including any life-of-loan discounts, plus the serviceability buffer of 3.0%; or − The minimum assessment rate, called the “floor rate”, currently 5.05% • A serviceability buffer of 1.0% may be applied on an exceptions basis for certain customers seeking to refinance their loan, subject to eligibility criteria including LVR, bureau score and repayment amounts • Interest only (I/O) loans: Assessed based on the residual principal and interest (P&I) term using the applicable P&I rate, plus a 3.0% buffer • New fixed rate loans: Assessed on the variable rate to which the loan will revert after the fixed period, plus a buffer Australian mortgage portfolio LVRs Mar-24 balance Sep-24 balance Mar-25 balance Weighted averages2 LVR at origination (%) 71 71 71 Dynamic LVR1 (%) 49 49 49 LVR of new loans3 (%) 70 70 69 59 Westpac Group 2025 Interim Results Presentation & Investor Discussion Pack OFFSET ACCOUNT BALANCES ($BN) 41 46 51 53 57 63 68 Sep-19 Sep-20 Sep-21 Sep-22 Sep-23 Sep-24 Mar-25 27 22 34 12 6 0 23 18 40 12 7 1 65 14 12 6 1 0.5 0.7 0 20 40 60 80 100 0<=60 60<=70 70<=80 80<=90 90<=95 95<=100 >100 1H25 drawdowns LVR at origination Portfolio LVR at origination Portfolio dynamic LVR |
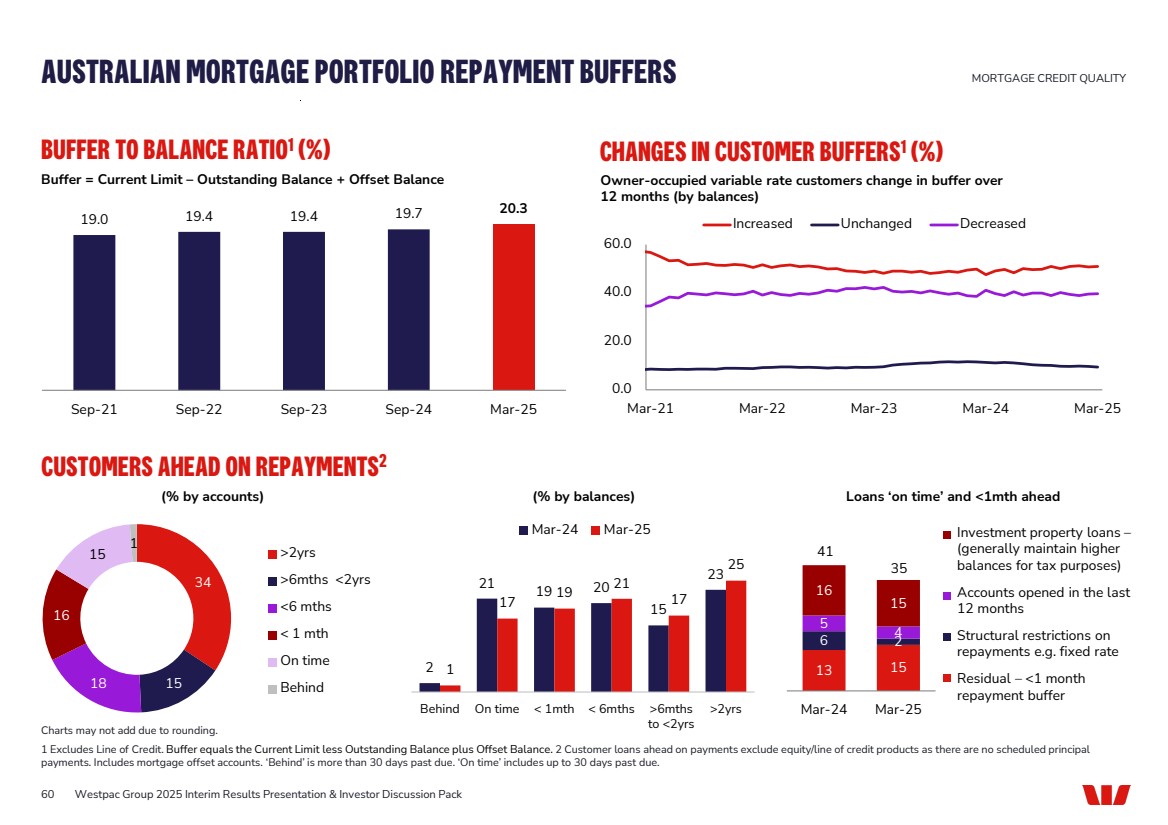
| (% by accounts) CUSTOMERS AHEAD ON REPAYMENTS2 BUFFER TO BALANCE RATIO1 (%) AUSTRALIAN MORTGAGE PORTFOLIO REPAYMENT BUFFERS MORTGAGE CREDIT QUALITY Charts may not add due to rounding. 1 Excludes Line of Credit. Buffer equals the Current Limit less Outstanding Balance plus Offset Balance. 2 Customer loans ahead on payments exclude equity/line of credit products as there are no scheduled principal payments. Includes mortgage offset accounts. ‘Behind’ is more than 30 days past due. ‘On time’ includes up to 30 days past due. Investment property loans – (generally maintain higher balances for tax purposes) Accounts opened in the last 12 months Structural restrictions on repayments e.g. fixed rate Residual – <1 month repayment buffer >6mths to <2yrs Loans ‘on time’ and <1mth ahead 19.0 19.4 19.4 19.7 20.3 Sep-21 Sep-22 Sep-23 Sep-24 Mar-25 60 Westpac Group 2025 Interim Results Presentation & Investor Discussion Pack Buffer = Current Limit – Outstanding Balance + Offset Balance (% by balances) CHANGES IN CUSTOMER BUFFERS1 (%) Owner-occupied variable rate customers change in buffer over 12 months (by balances) 0.0 20.0 40.0 60.0 Mar-21 Mar-22 Mar-23 Mar-24 Mar-25 Increased Unchanged Decreased 2 21 19 20 15 23 1 17 19 21 17 25 Behind On time < 1mth < 6mths >2yrs Mar-24 Mar-25 13 15 6 2 5 4 16 15 Mar-24 Mar-25 35 41 34 18 15 16 15 1 >2yrs >6mths <2yrs <6 mths < 1 mth On time Behind |
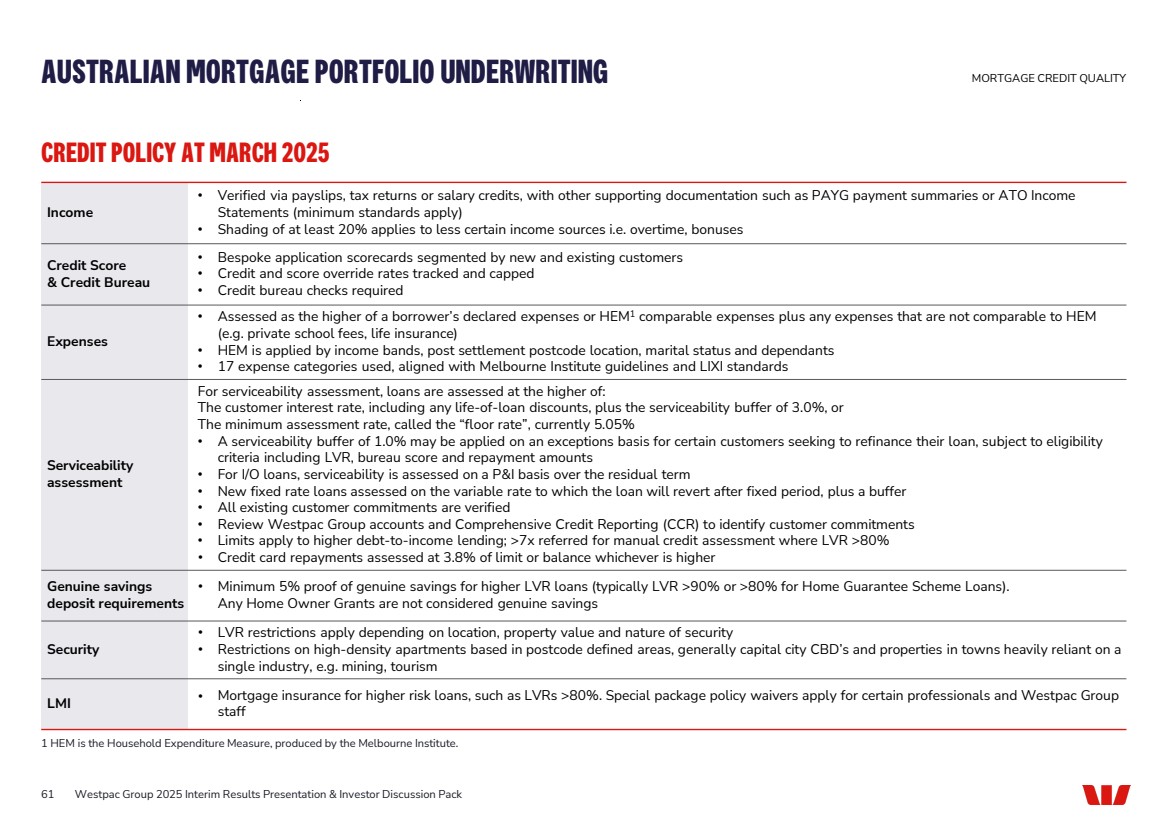
| 61 CREDIT POLICY AT MARCH 2025 Income • Verified via payslips, tax returns or salary credits, with other supporting documentation such as PAYG payment summaries or ATO Income Statements (minimum standards apply) • Shading of at least 20% applies to less certain income sources i.e. overtime, bonuses Credit Score & Credit Bureau • Bespoke application scorecards segmented by new and existing customers • Credit and score override rates tracked and capped • Credit bureau checks required Expenses • Assessed as the higher of a borrower’s declared expenses or HEM1 comparable expenses plus any expenses that are not comparable to HEM (e.g. private school fees, life insurance) • HEM is applied by income bands, post settlement postcode location, marital status and dependants • 17 expense categories used, aligned with Melbourne Institute guidelines and LIXI standards Serviceability assessment For serviceability assessment, loans are assessed at the higher of: The customer interest rate, including any life-of-loan discounts, plus the serviceability buffer of 3.0%, or The minimum assessment rate, called the “floor rate”, currently 5.05% • A serviceability buffer of 1.0% may be applied on an exceptions basis for certain customers seeking to refinance their loan, subject to eligibility criteria including LVR, bureau score and repayment amounts • For I/O loans, serviceability is assessed on a P&I basis over the residual term • New fixed rate loans assessed on the variable rate to which the loan will revert after fixed period, plus a buffer • All existing customer commitments are verified • Review Westpac Group accounts and Comprehensive Credit Reporting (CCR) to identify customer commitments • Limits apply to higher debt-to-income lending; >7x referred for manual credit assessment where LVR >80% • Credit card repayments assessed at 3.8% of limit or balance whichever is higher Genuine savings deposit requirements • Minimum 5% proof of genuine savings for higher LVR loans (typically LVR >90% or >80% for Home Guarantee Scheme Loans). Any Home Owner Grants are not considered genuine savings Security • LVR restrictions apply depending on location, property value and nature of security • Restrictions on high-density apartments based in postcode defined areas, generally capital city CBD’s and properties in towns heavily reliant on a single industry, e.g. mining, tourism LMI • Mortgage insurance for higher risk loans, such as LVRs >80%. Special package policy waivers apply for certain professionals and Westpac Group staff Westpac Group 2025 Interim Results Presentation & Investor Discussion Pack AUSTRALIAN MORTGAGE PORTFOLIO UNDERWRITING MORTGAGE CREDIT QUALITY 1 HEM is the Household Expenditure Measure, produced by the Melbourne Institute. |
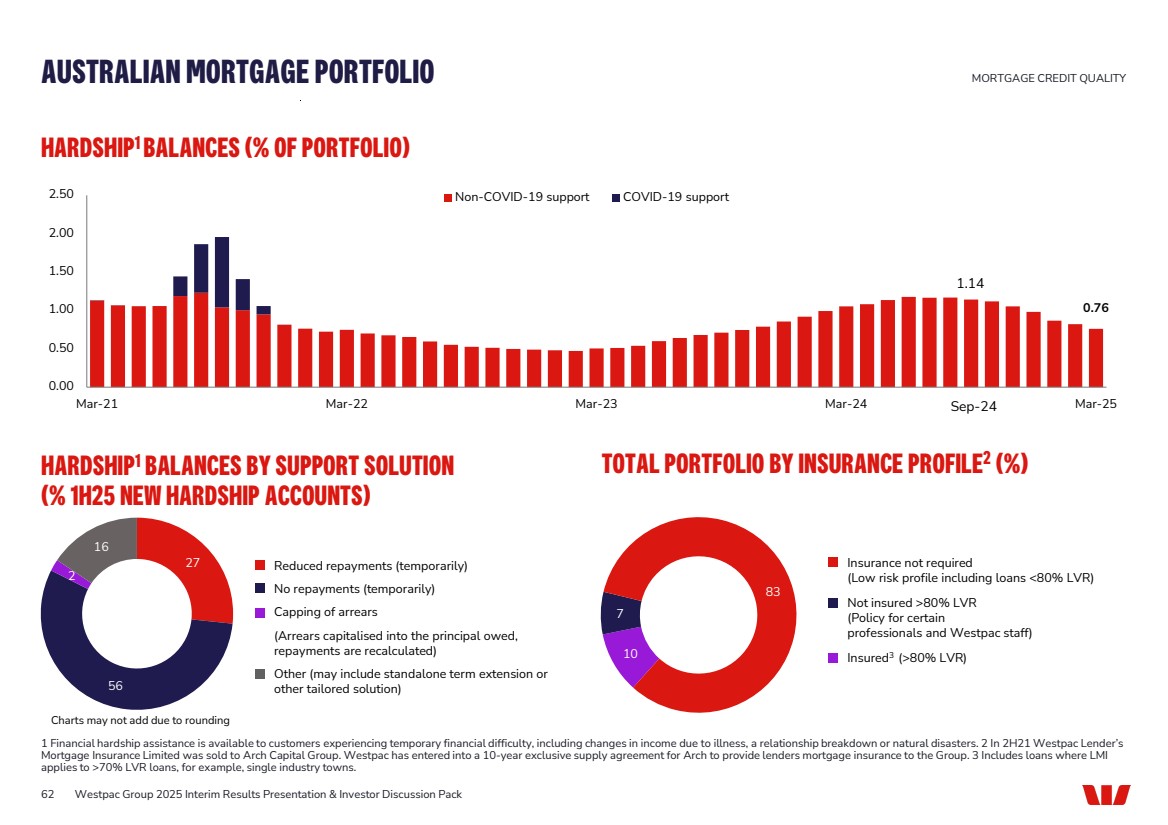
| 10 7 83 27 56 2 16 62 HARDSHIP1 BALANCES BY SUPPORT SOLUTION (% 1H25 NEW HARDSHIP ACCOUNTS) HARDSHIP1 BALANCES (% OF PORTFOLIO) 0.76 0.00 0.50 1.00 1.50 2.00 2.50 Mar-21 Mar-22 Mar-23 Mar-24 Mar-25 Non-COVID-19 support COVID-19 support Sep-24 Westpac Group 2025 Interim Results Presentation & Investor Discussion Pack AUSTRALIAN MORTGAGE PORTFOLIO MORTGAGE CREDIT QUALITY 1 Financial hardship assistance is available to customers experiencing temporary financial difficulty, including changes in income due to illness, a relationship breakdown or natural disasters. 2 In 2H21 Westpac Lender’s Mortgage Insurance Limited was sold to Arch Capital Group. Westpac has entered into a 10-year exclusive supply agreement for Arch to provide lenders mortgage insurance to the Group. 3 Includes loans where LMI applies to >70% LVR loans, for example, single industry towns. TOTAL PORTFOLIO BY INSURANCE PROFILE2 (%) Insurance not required (Low risk profile including loans <80% LVR) Not insured >80% LVR (Policy for certain professionals and Westpac staff) Insured3 (>80% LVR) 1.14 Charts may not add due to rounding Reduced repayments (temporarily) No repayments (temporarily) Capping of arrears (Arrears capitalised into the principal owed, repayments are recalculated) Other (may include standalone term extension or other tailored solution) |
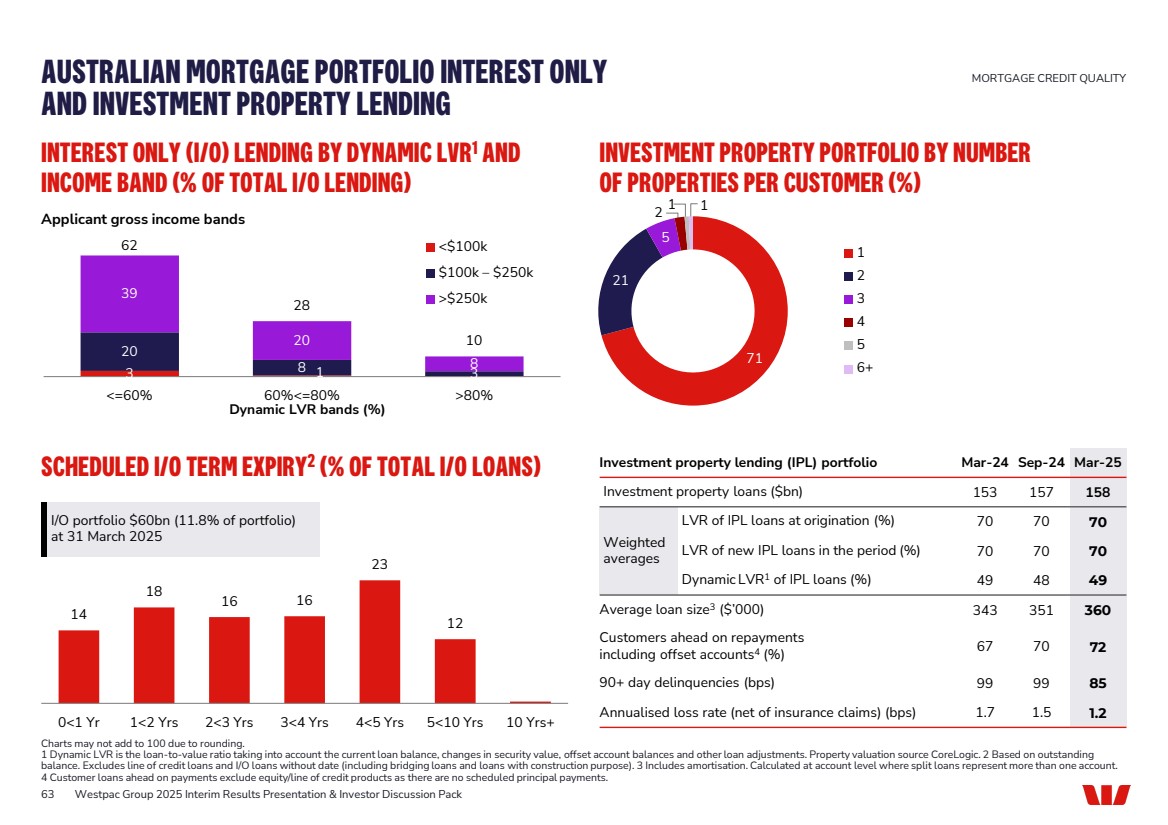
| 1 1 2 INTEREST ONLY (I/O) LENDING BY DYNAMIC LVR1 AND INCOME BAND (% OF TOTAL I/O LENDING) 3 1 20 8 3 39 20 8 62 28 10 <=60% 60%<=80% >80% Dynamic LVR bands (%) <$100k $100k – $250k >$250k INVESTMENT PROPERTY PORTFOLIO BY NUMBER OF PROPERTIES PER CUSTOMER (%) SCHEDULED I/O TERM EXPIRY2 (% OF TOTAL I/O LOANS) 14 18 16 16 23 12 0<1 Yr 1<2 Yrs 2<3 Yrs 3<4 Yrs 4<5 Yrs 5<10 Yrs 10 Yrs+ Investment property lending (IPL) portfolio Mar-24 Sep-24 Mar-25 Investment property loans ($bn) 153 157 158 Weighted averages LVR of IPL loans at origination (%) 70 70 70 LVR of new IPL loans in the period (%) 70 70 70 Dynamic LVR1 of IPL loans (%) 49 48 49 Average loan size3 ($’000) 343 351 360 Customers ahead on repayments including offset accounts4 (%) 67 70 72 90+ day delinquencies (bps) 99 99 85 Annualised loss rate (net of insurance claims) (bps) 1.7 1.5 1.2 AUSTRALIAN MORTGAGE PORTFOLIO INTEREST ONLY AND INVESTMENT PROPERTY LENDING MORTGAGE CREDIT QUALITY Charts may not add to 100 due to rounding. 1 Dynamic LVR is the loan-to-value ratio taking into account the current loan balance, changes in security value, offset account balances and other loan adjustments. Property valuation source CoreLogic. 2 Based on outstanding balance. Excludes line of credit loans and I/O loans without date (including bridging loans and loans with construction purpose). 3 Includes amortisation. Calculated at account level where split loans represent more than one account. 4 Customer loans ahead on payments exclude equity/line of credit products as there are no scheduled principal payments. I/O portfolio $60bn (11.8% of portfolio) at 31 March 2025 Applicant gross income bands 63 Westpac Group 2025 Interim Results Presentation & Investor Discussion Pack 71 21 5 1 2 3 4 5 6+ |
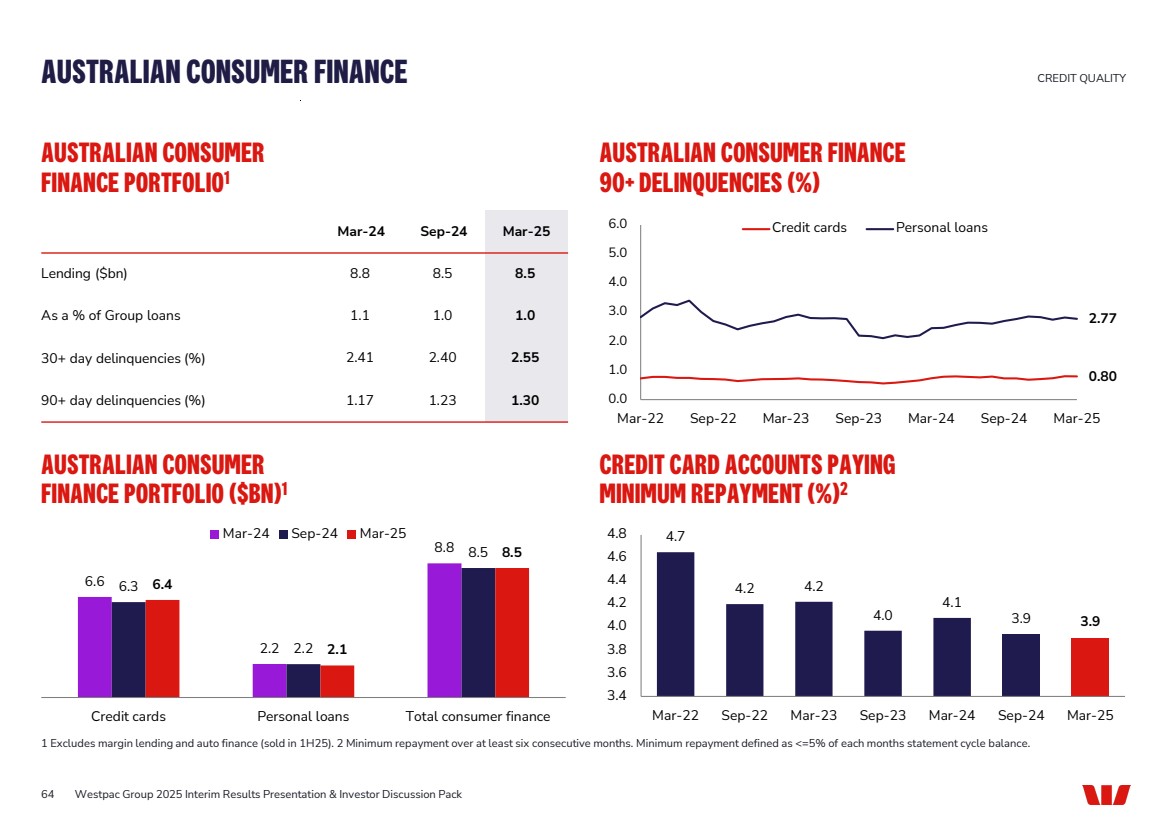
| 6.6 2.2 8.8 6.3 2.2 8.5 6.4 2.1 8.5 Credit cards Personal loans Total consumer finance Mar-24 Sep-24 Mar-25 AUSTRALIAN CONSUMER FINANCE PORTFOLIO1 AUSTRALIAN CONSUMER FINANCE 90+ DELINQUENCIES (%) 0.80 2.77 0.0 1.0 2.0 3.0 4.0 5.0 6.0 Mar-22 Sep-22 Mar-23 Sep-23 Mar-24 Sep-24 Mar-25 Credit cards Personal loans AUSTRALIAN CONSUMER FINANCE PORTFOLIO ($BN)1 CREDIT CARD ACCOUNTS PAYING MINIMUM REPAYMENT (%)2 4.7 4.2 4.2 4.0 4.1 3.9 3.9 3.4 3.6 3.8 4.0 4.2 4.4 4.6 4.8 Mar-22 Sep-22 Mar-23 Sep-23 Mar-24 Sep-24 Mar-25 AUSTRALIAN CONSUMER FINANCE CREDIT QUALITY 1 Excludes margin lending and auto finance (sold in 1H25). 2 Minimum repayment over at least six consecutive months. Minimum repayment defined as <=5% of each months statement cycle balance. 64 Mar-24 Sep-24 Mar-25 Lending ($bn) 8.8 8.5 8.5 As a % of Group loans 1.1 1.0 1.0 30+ day delinquencies (%) 2.41 2.40 2.55 90+ day delinquencies (%) 1.17 1.23 1.30 Westpac Group 2025 Interim Results Presentation & Investor Discussion Pack |
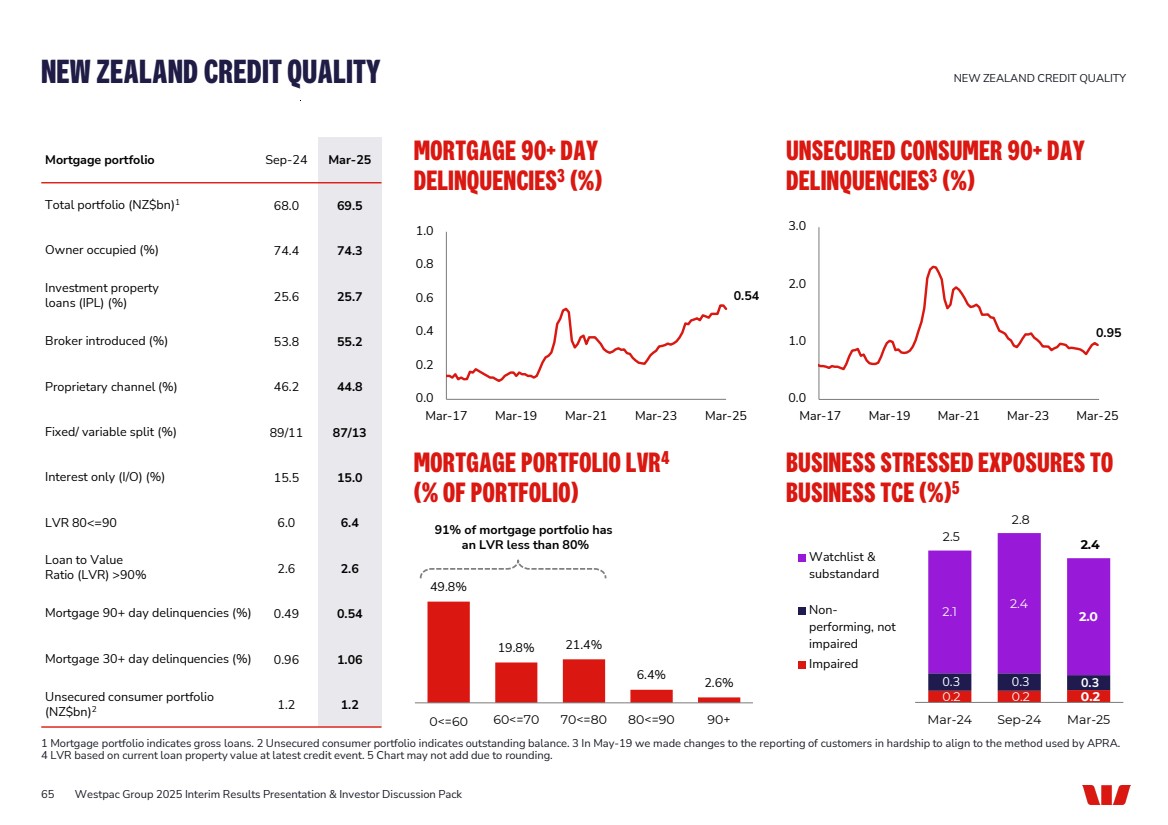
| 0.0 0.2 0.4 0.6 0.8 1.0 Mar-17 Mar-19 Mar-21 Mar-23 Mar-25 MORTGAGE PORTFOLIO LVR4 (% OF PORTFOLIO) 49.8% 19.8% 21.4% 6.4% 2.6% 0<=60 60<=70 70<=80 80<=90 90+ BUSINESS STRESSED EXPOSURES TO BUSINESS TCE (%)5 Mortgage portfolio Sep-24 Mar-25 Total portfolio (NZ$bn)1 68.0 69.5 Owner occupied (%) 74.4 74.3 Investment property loans (IPL) (%) 25.6 25.7 Broker introduced (%) 53.8 55.2 Proprietary channel (%) 46.2 44.8 Fixed/ variable split (%) 89/11 87/13 Interest only (I/O) (%) 15.5 15.0 LVR 80<=90 6.0 6.4 Loan to Value Ratio (LVR) >90% 2.6 2.6 Mortgage 90+ day delinquencies (%) 0.49 0.54 Mortgage 30+ day delinquencies (%) 0.96 1.06 Unsecured consumer portfolio (NZ$bn)2 1.2 1.2 MORTGAGE 90+ DAY DELINQUENCIES3 (%) UNSECURED CONSUMER 90+ DAY DELINQUENCIES3 (%) 0.95 0.0 1.0 2.0 3.0 Mar-17 Mar-19 Mar-21 Mar-23 Mar-25 NEW ZEALAND CREDIT QUALITY NEW ZEALAND CREDIT QUALITY 1 Mortgage portfolio indicates gross loans. 2 Unsecured consumer portfolio indicates outstanding balance. 3 In May-19 we made changes to the reporting of customers in hardship to align to the method used by APRA. 4 LVR based on current loan property value at latest credit event. 5 Chart may not add due to rounding. 91% of mortgage portfolio has an LVR less than 80% 0.2 0.2 0.2 0.3 0.3 0.3 2.1 2.4 2.0 2.5 2.8 2.4 Mar-24 Sep-24 Mar-25 Watchlist & substandard Non-performing, not impaired Impaired 65 Westpac Group 2025 Interim Results Presentation & Investor Discussion Pack 0.54 |
| CAPITAL, FUNDING AND LIQUIDITY |

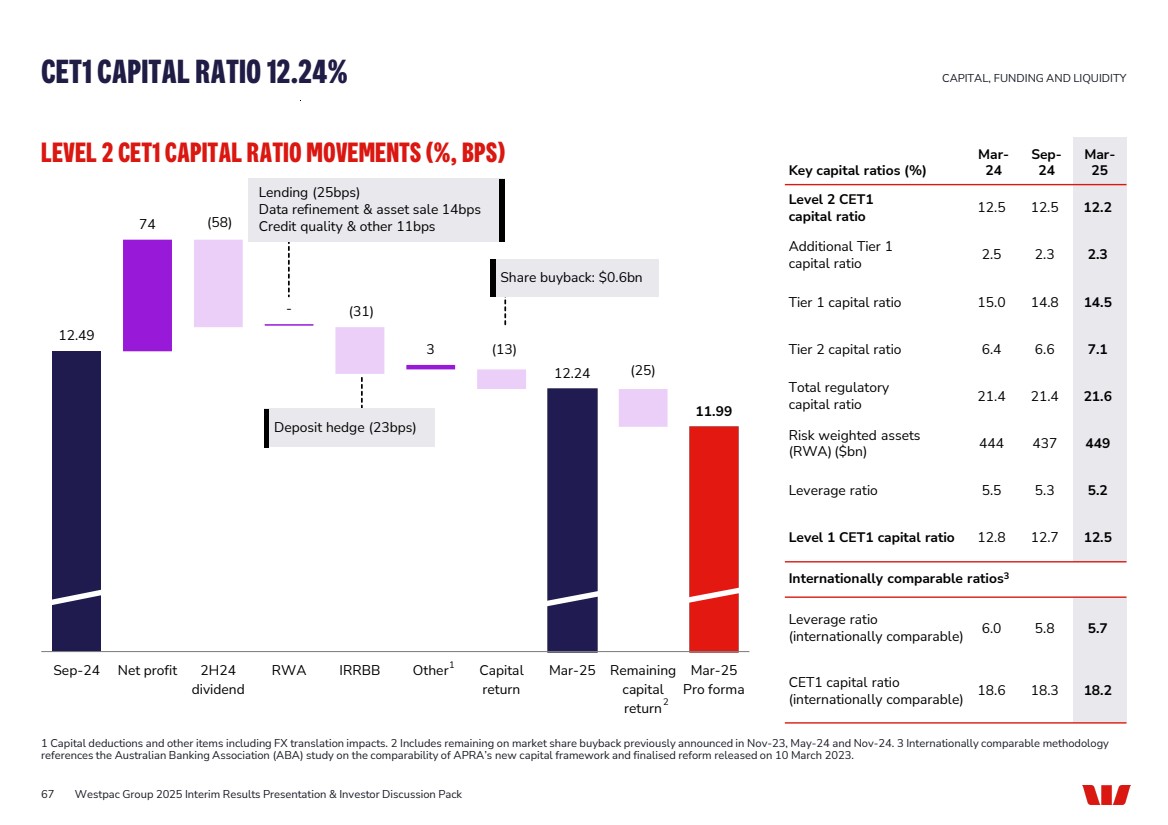
| 12.49 74 - 3 12.24 11.99 (58) (31) (13) (25) Sep-24 Net profit 2H24 dividend RWA IRRBB Other Capital return Mar-25 Remaining capital return Mar-25 Pro forma Lending (25bps) Data refinement & asset sale 14bps Credit quality & other 11bps Deposit hedge (23bps) 67 Key capital ratios (%) Mar-24 Sep-24 Mar-25 Level 2 CET1 capital ratio 12.5 12.5 12.2 Additional Tier 1 capital ratio 2.5 2.3 2.3 Tier 1 capital ratio 15.0 14.8 14.5 Tier 2 capital ratio 6.4 6.6 7.1 Total regulatory capital ratio 21.4 21.4 21.6 Risk weighted assets (RWA) ($bn) 444 437 449 Leverage ratio 5.5 5.3 5.2 Level 1 CET1 capital ratio 12.8 12.7 12.5 Internationally comparable ratios3 Leverage ratio (internationally comparable) 6.0 5.8 5.7 CET1 capital ratio (internationally comparable) 18.6 18.3 18.2 LEVEL 2 CET1 CAPITAL RATIO MOVEMENTS (%, BPS) CET1 CAPITAL RATIO 12.24% CAPITAL, FUNDING AND LIQUIDITY 1 Capital deductions and other items including FX translation impacts. 2 Includes remaining on market share buyback previously announced in Nov-23, May-24 and Nov-24. 3 Internationally comparable methodology references the Australian Banking Association (ABA) study on the comparability of APRA’s new capital framework and finalised reform released on 10 March 2023. 1 2 Share buyback: $0.6bn Westpac Group 2025 Interim Results Presentation & Investor Discussion Pack |
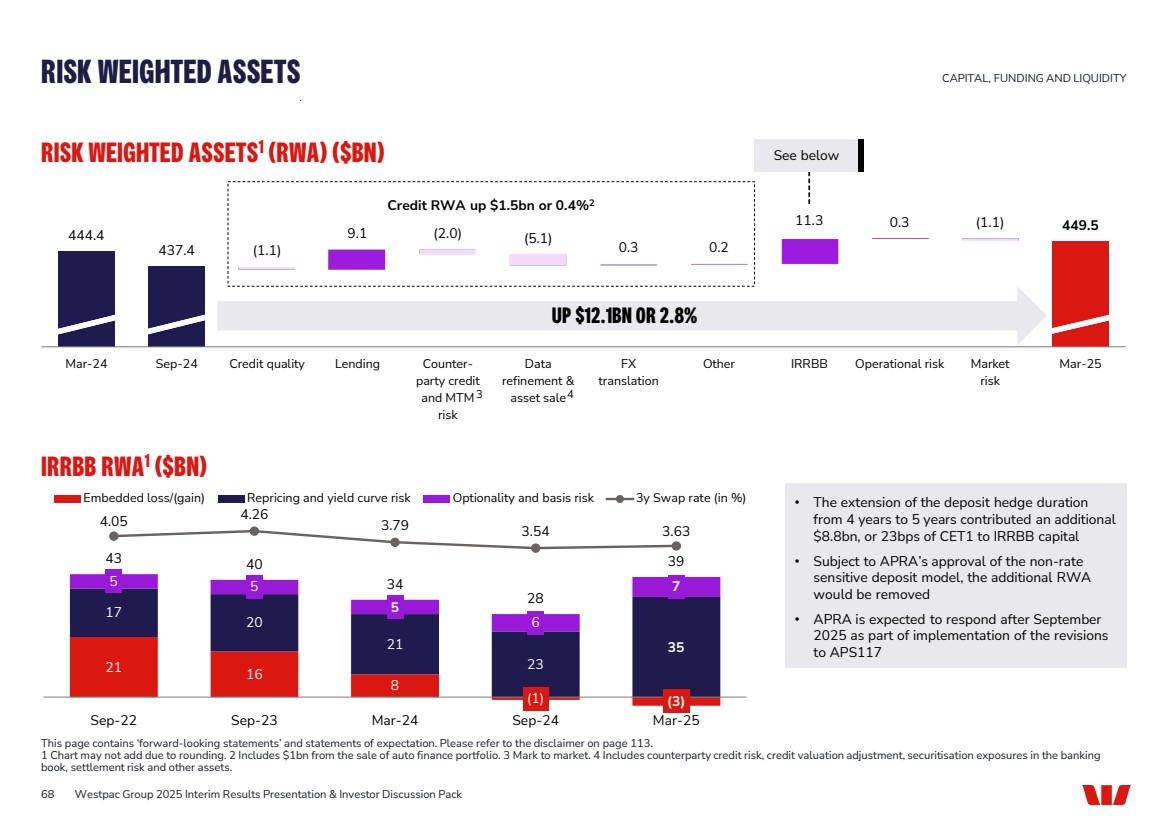
| 444.4 437.4 (1.1) 9.1 0.2 449.5 (2.0) (5.1) 0.3 11.3 0.3 (1.1) Mar-24 Sep-24 Credit quality Lending Counter-party credit and MTM risk Data refinement & asset sale FX translation Other IRRBB Operational risk Market risk Mar-25 21 16 8 (1) (3) 17 20 21 23 35 5 5 5 6 7 43 40 34 28 39 4.05 4.26 3.79 3.54 3.63 -4 -3 -2 -1 0 1 2 3 4 -10 0 10 20 30 40 50 60 Sep-22 Sep-23 Mar-24 Sep-24 Mar-25 Embedded loss/(gain) Repricing and yield curve risk Optionality and basis risk 3y Swap rate (in %) RISK WEIGHTED ASSETS1 (RWA) ($BN) IRRBB RWA1 ($BN) RISK WEIGHTED ASSETS CAPITAL, FUNDING AND LIQUIDITY This page contains ‘forward-looking statements’ and statements of expectation. Please refer to the disclaimer on page 113. 1 Chart may not add due to rounding. 2 Includes $1bn from the sale of auto finance portfolio. 3 Mark to market. 4 Includes counterparty credit risk, credit valuation adjustment, securitisation exposures in the banking book, settlement risk and other assets. See below 68 Westpac Group 2025 Interim Results Presentation & Investor Discussion Pack • The extension of the deposit hedge duration from 4 years to 5 years contributed an additional $8.8bn, or 23bps of CET1 to IRRBB capital • Subject to APRA’s approval of the non-rate sensitive deposit model, the additional RWA would be removed • APRA is expected to respond after September 2025 as part of implementation of the revisions to APS117 3 UP $12.1BN OR 2.8% Credit RWA up $1.5bn or 0.4%2 4 |
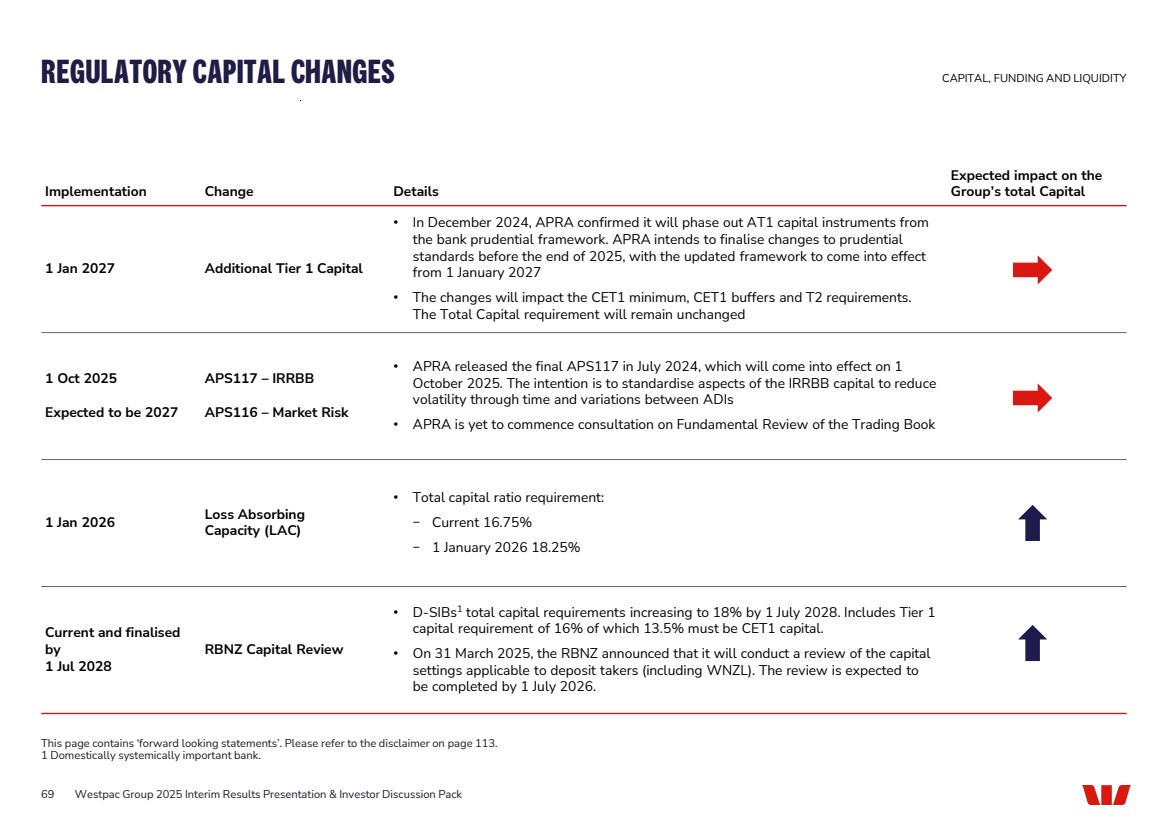
| REGULATORY CAPITAL CHANGES 69 Implementation Change Details Expected impact on the Group’s total Capital 1 Jan 2027 Additional Tier 1 Capital • In December 2024, APRA confirmed it will phase out AT1 capital instruments from the bank prudential framework. APRA intends to finalise changes to prudential standards before the end of 2025, with the updated framework to come into effect from 1 January 2027 • The changes will impact the CET1 minimum, CET1 buffers and T2 requirements. The Total Capital requirement will remain unchanged 1 Oct 2025 Expected to be 2027 APS117 – IRRBB APS116 – Market Risk • APRA released the final APS117 in July 2024, which will come into effect on 1 October 2025. The intention is to standardise aspects of the IRRBB capital to reduce volatility through time and variations between ADIs • APRA is yet to commence consultation on Fundamental Review of the Trading Book 1 Jan 2026 Loss Absorbing Capacity (LAC) • Total capital ratio requirement: − Current 16.75% − 1 January 2026 18.25% Current and finalised by 1 Jul 2028 RBNZ Capital Review • D-SIBs1 total capital requirements increasing to 18% by 1 July 2028. Includes Tier 1 capital requirement of 16% of which 13.5% must be CET1 capital. • On 31 March 2025, the RBNZ announced that it will conduct a review of the capital settings applicable to deposit takers (including WNZL). The review is expected to be completed by 1 July 2026. CAPITAL, FUNDING AND LIQUIDITY This page contains ‘forward looking statements’. Please refer to the disclaimer on page 113. 1 Domestically systemically important bank. Westpac Group 2025 Interim Results Presentation & Investor Discussion Pack |
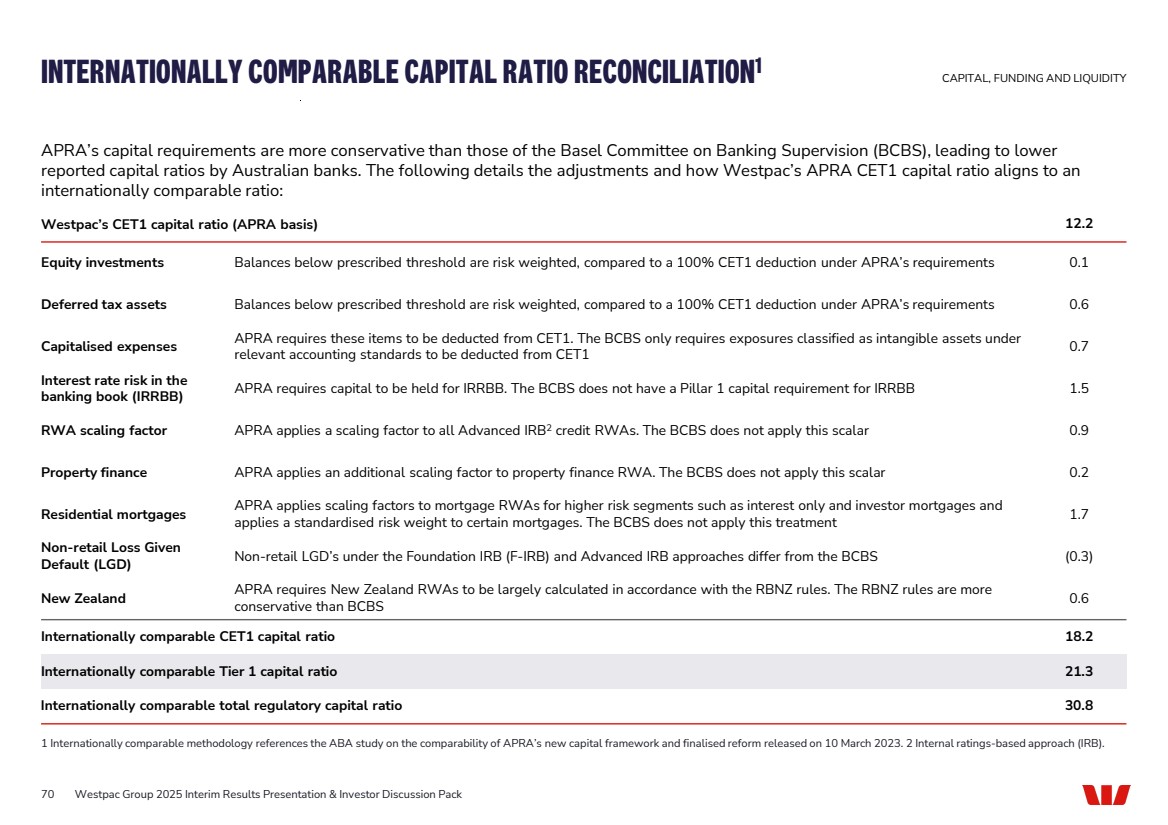
| INTERNATIONALLY COMPARABLE CAPITAL RATIO RECONCILIATION1 APRA’s capital requirements are more conservative than those of the Basel Committee on Banking Supervision (BCBS), leading to lower reported capital ratios by Australian banks. The following details the adjustments and how Westpac’s APRA CET1 capital ratio aligns to an internationally comparable ratio: CAPITAL, FUNDING AND LIQUIDITY 1 Internationally comparable methodology references the ABA study on the comparability of APRA’s new capital framework and finalised reform released on 10 March 2023. 2 Internal ratings-based approach (IRB). Westpac’s CET1 capital ratio (APRA basis) 12.2 Equity investments Balances below prescribed threshold are risk weighted, compared to a 100% CET1 deduction under APRA’s requirements 0.1 Deferred tax assets Balances below prescribed threshold are risk weighted, compared to a 100% CET1 deduction under APRA’s requirements 0.6 Capitalised expenses APRA requires these items to be deducted from CET1. The BCBS only requires exposures classified as intangible assets under relevant accounting standards to be deducted from CET1 0.7 Interest rate risk in the banking book (IRRBB) APRA requires capital to be held for IRRBB. The BCBS does not have a Pillar 1 capital requirement for IRRBB 1.5 RWA scaling factor APRA applies a scaling factor to all Advanced IRB2 credit RWAs. The BCBS does not apply this scalar 0.9 Property finance APRA applies an additional scaling factor to property finance RWA. The BCBS does not apply this scalar 0.2 Residential mortgages APRA applies scaling factors to mortgage RWAs for higher risk segments such as interest only and investor mortgages and applies a standardised risk weight to certain mortgages. The BCBS does not apply this treatment 1.7 Non-retail Loss Given Default (LGD) Non-retail LGD’s under the Foundation IRB (F-IRB) and Advanced IRB approaches differ from the BCBS (0.3) New Zealand APRA requires New Zealand RWAs to be largely calculated in accordance with the RBNZ rules. The RBNZ rules are more conservative than BCBS 0.6 Internationally comparable CET1 capital ratio 18.2 Internationally comparable Tier 1 capital ratio 21.3 Internationally comparable total regulatory capital ratio 30.8 70 Westpac Group 2025 Interim Results Presentation & Investor Discussion Pack |
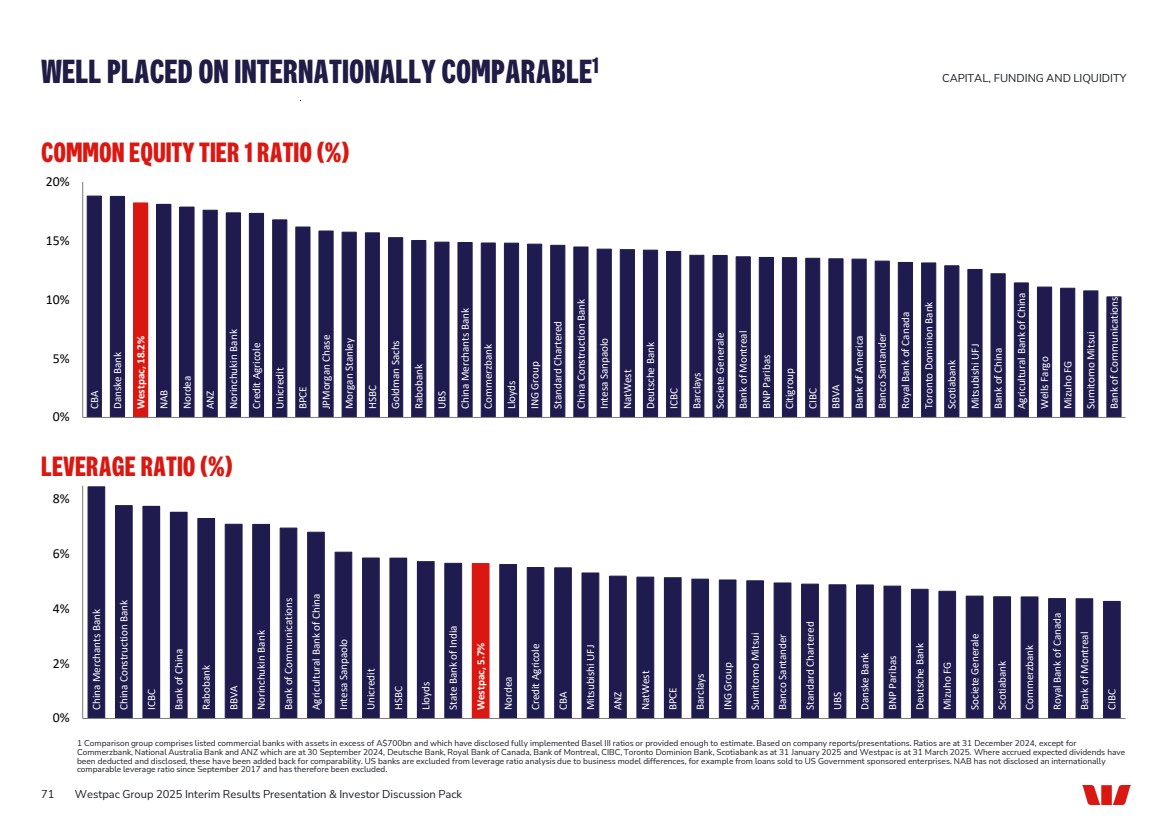
| China Merchants Bank China Construction Bank ICBC Bank of China Rabobank BBVA Norinchukin Bank Bank of Communications Agricultural Bank of China Intesa Sanpaolo Unicredit HSBC Lloyds State Bank of India Westpac, 5.7% Nordea Credit Agricole CBA Mitsubishi UFJ ANZ NatWest BPCE Barclays ING Group Sumitomo Mitsui Banco Santander Standard Chartered UBS Danske Bank BNP Paribas Deutsche Bank Mizuho FG Societe Generale Scotiabank Commerzbank Royal Bank of Canada Bank of Montreal CIBC 0% 2% 4% 6% 8% CBA Danske Bank Westpac, 18.2% NAB Nordea ANZ Norinchukin Bank Credit Agricole Unicredit BPCE JPMorgan Chase Morgan Stanley HSBC Goldman Sachs Rabobank UBS China Merchants Bank Commerzbank Lloyds ING Group Standard Chartered China Construction Bank Intesa Sanpaolo NatWest Deutsche Bank ICBC Barclays Societe Generale Bank of Montreal BNP Paribas Citigroup CIBC BBVA Bank of America Banco Santander Royal Bank of Canada Toronto Dominion Bank Scotiabank Mitsubishi UFJ Bank of China Agricultural Bank of China Wells Fargo Mizuho FG Sumitomo Mitsui Bank of Communications 0% 5% 10% 15% 20% COMMON EQUITY TIER 1 RATIO (%) 71 LEVERAGE RATIO (%) WELL PLACED ON INTERNATIONALLY COMPARABLE1 CAPITAL, FUNDING AND LIQUIDITY 1 Comparison group comprises listed commercial banks with assets in excess of A$700bn and which have disclosed fully implemented Basel III ratios or provided enough to estimate. Based on company reports/presentations. Ratios are at 31 December 2024, except for Commerzbank, National Australia Bank and ANZ which are at 30 September 2024, Deutsche Bank, Royal Bank of Canada, Bank of Montreal, CIBC, Toronto Dominion Bank, Scotiabank as at 31 January 2025 and Westpac is at 31 March 2025. Where accrued expected dividends have been deducted and disclosed, these have been added back for comparability. US banks are excluded from leverage ratio analysis due to business model differences, for example from loans sold to US Government sponsored enterprises. NAB has not disclosed an internationally comparable leverage ratio since September 2017 and has therefore been excluded. Westpac Group 2025 Interim Results Presentation & Investor Discussion Pack |
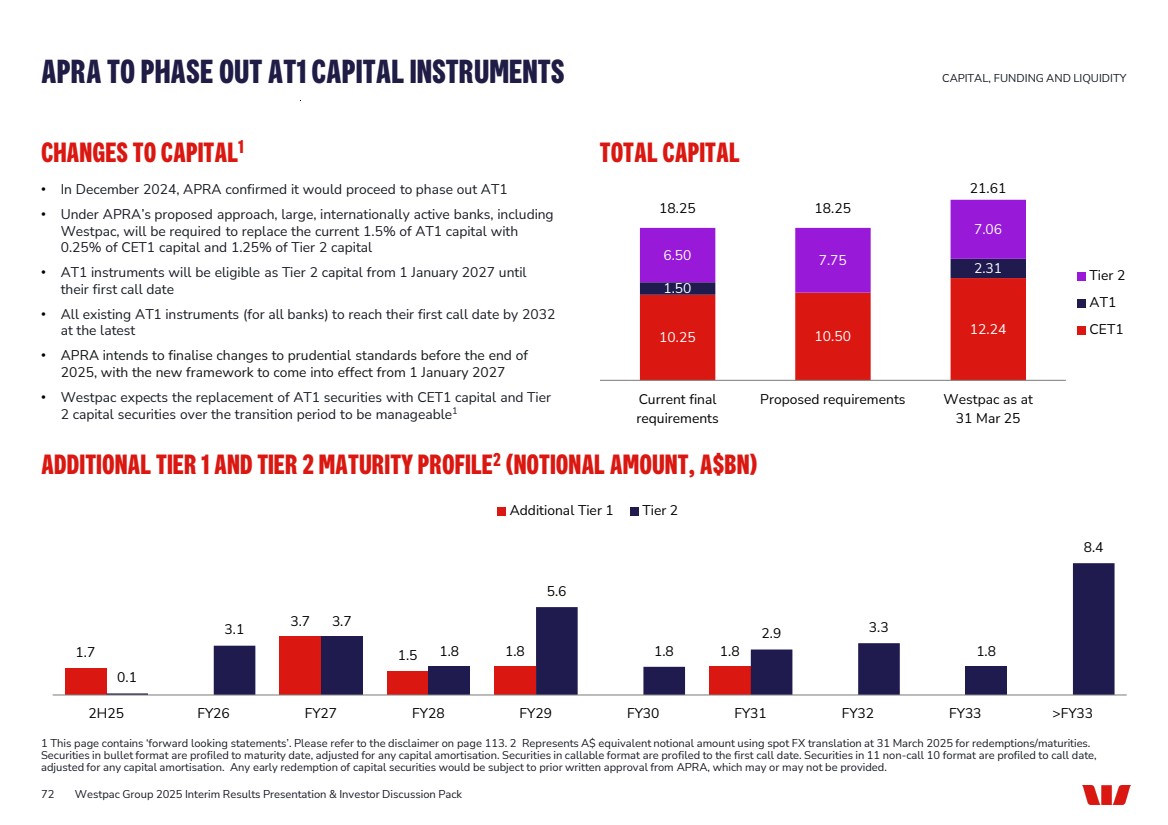
| ADDITIONAL TIER 1 AND TIER 2 MATURITY PROFILE2 (NOTIONAL AMOUNT, A$BN) CHANGES TO CAPITAL1 • In December 2024, APRA confirmed it would proceed to phase out AT1 • Under APRA’s proposed approach, large, internationally active banks, including Westpac, will be required to replace the current 1.5% of AT1 capital with 0.25% of CET1 capital and 1.25% of Tier 2 capital • AT1 instruments will be eligible as Tier 2 capital from 1 January 2027 until their first call date • All existing AT1 instruments (for all banks) to reach their first call date by 2032 at the latest • APRA intends to finalise changes to prudential standards before the end of 2025, with the new framework to come into effect from 1 January 2027 • Westpac expects the replacement of AT1 securities with CET1 capital and Tier 2 capital securities over the transition period to be manageable1 10.25 10.50 12.24 1.50 2.31 6.50 7.75 7.06 18.25 18.25 21.61 Current final requirements Proposed requirements Westpac as at 31 Mar 25 Tier 2 AT1 CET1 APRA TO PHASE OUT AT1 CAPITAL INSTRUMENTS CAPITAL, FUNDING AND LIQUIDITY TOTAL CAPITAL 72 Westpac Group 2025 Interim Results Presentation & Investor Discussion Pack 1.7 3.7 1.5 1.8 1.8 0.1 3.1 3.7 1.8 5.6 1.8 2.9 3.3 1.8 8.4 2H25 FY26 FY27 FY28 FY29 FY30 FY31 FY32 FY33 >FY33 Additional Tier 1 Tier 2 1 This page contains ‘forward looking statements’. Please refer to the disclaimer on page 113. 2 Represents A$ equivalent notional amount using spot FX translation at 31 March 2025 for redemptions/maturities. Securities in bullet format are profiled to maturity date, adjusted for any capital amortisation. Securities in callable format are profiled to the first call date. Securities in 11 non-call 10 format are profiled to call date, adjusted for any capital amortisation. Any early redemption of capital securities would be subject to prior written approval from APRA, which may or may not be provided. |
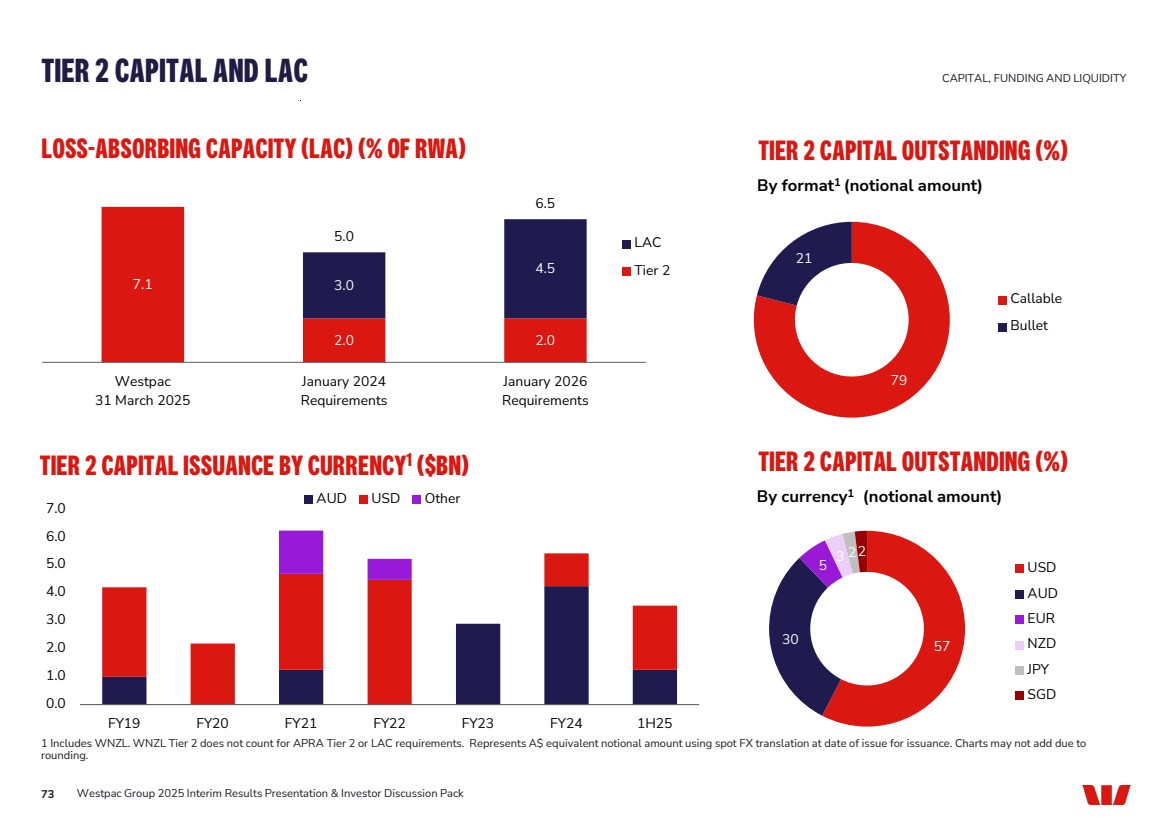
| TIER 2 CAPITAL AND LAC 73 Westpac Group 2025 Interim Results Presentation & Investor Discussion Pack 7.1 2.0 2.0 3.0 4.5 5.0 6.5 Westpac 31 March 2025 January 2024 Requirements January 2026 Requirements LAC Tier 2 LOSS-ABSORBING CAPACITY (LAC) (% OF RWA) TIER 2 CAPITAL OUTSTANDING (%) 79 21 Callable Bullet By format1 (notional amount) By currency1 (notional amount) TIER 2 CAPITAL ISSUANCE BY CURRENCY1 ($BN) CAPITAL, FUNDING AND LIQUIDITY 57 30 5 3 22 USD AUD EUR NZD JPY SGD 0.0 1.0 2.0 3.0 4.0 5.0 6.0 7.0 FY19 FY20 FY21 FY22 FY23 FY24 1H25 AUD USD Other 1 Includes WNZL. WNZL Tier 2 does not count for APRA Tier 2 or LAC requirements. Represents A$ equivalent notional amount using spot FX translation at date of issue for issuance. Charts may not add due to rounding. TIER 2 CAPITAL OUTSTANDING (%) |
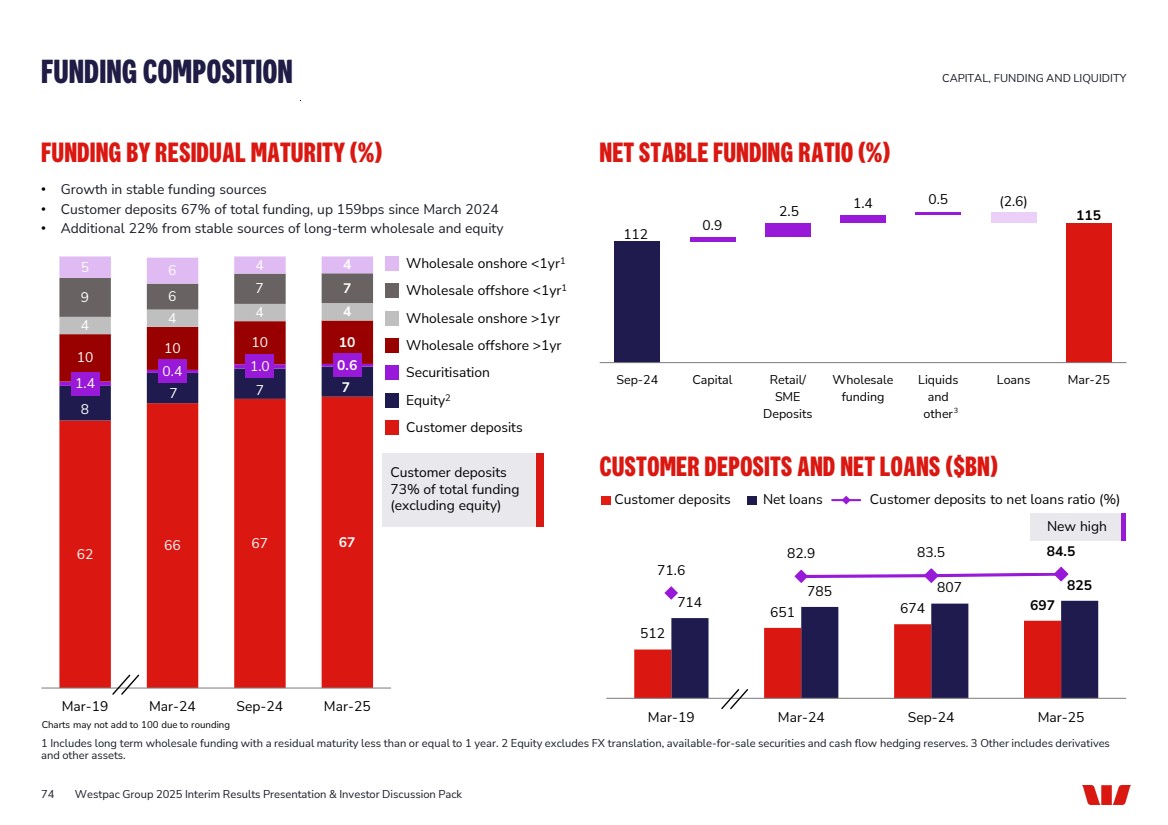
| • Growth in stable funding sources • Customer deposits 67% of total funding, up 159bps since March 2024 • Additional 22% from stable sources of long-term wholesale and equity 62 66 67 67 8 7 7 7 1.4 0.4 1.0 0.6 10 10 10 10 4 4 4 4 9 6 7 7 5 6 4 4 Mar-19 Mar-24 Sep-24 Mar-25 74 NET STABLE FUNDING RATIO (%) CUSTOMER DEPOSITS AND NET LOANS ($BN) FUNDING BY RESIDUAL MATURITY (%) Westpac Group 2025 Interim Results Presentation & Investor Discussion Pack FUNDING COMPOSITION CAPITAL, FUNDING AND LIQUIDITY 1 Includes long term wholesale funding with a residual maturity less than or equal to 1 year. 2 Equity excludes FX translation, available-for-sale securities and cash flow hedging reserves. 3 Other includes derivatives and other assets. Charts may not add to 100 due to rounding Wholesale offshore >1yr Wholesale onshore <1yr1 Wholesale onshore >1yr Wholesale offshore <1yr1 Securitisation Equity2 Customer deposits Customer deposits Net loans Customer deposits to net loans ratio (%) Customer deposits 73% of total funding (excluding equity) New high 112 115 0.9 2.5 1.4 0.5 (2.6) Sep-24 Capital Retail/ SME Deposits Wholesale funding Liquids and other Loans Mar-25 3 512 714 651 674 697 785 807 825 71.6 82.9 83.5 84.5 Mar-19 Mar-24 Sep-24 Mar-25 |
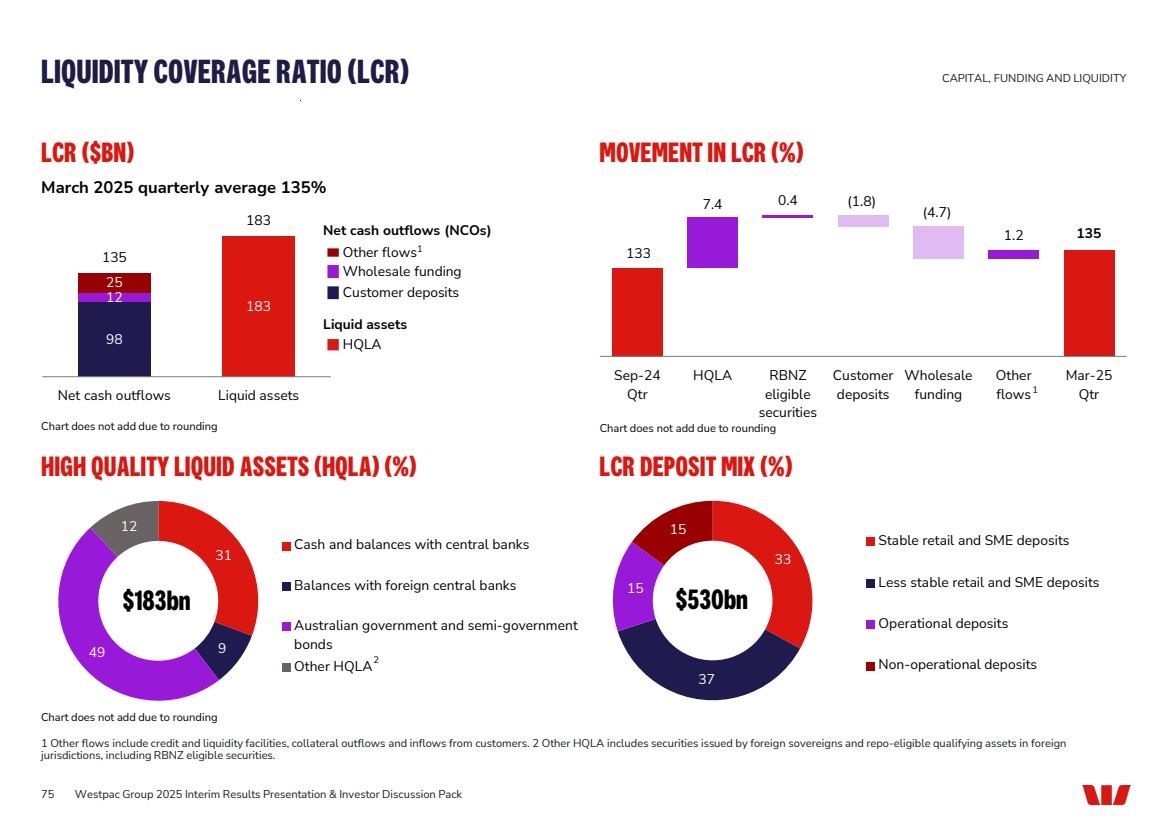
| 75 LCR ($BN) 98 183 12 25 135 183 Net cash outflows Liquid assets MOVEMENT IN LCR (%) 133 135 7.4 0.4 (1.8) (4.7) 1.2 Sep-24 Qtr HQLA RBNZ eligible securities Customer deposits Wholesale funding Other flows Mar-25 Qtr HIGH QUALITY LIQUID ASSETS (HQLA) (%) 31 49 9 12 Cash and balances with central banks Balances with foreign central banks Australian government and semi-government bonds Other HQLA LCR DEPOSIT MIX (%) 33 37 15 15 Stable retail and SME deposits Less stable retail and SME deposits Operational deposits Non-operational deposits Westpac Group 2025 Interim Results Presentation & Investor Discussion Pack LIQUIDITY COVERAGE RATIO (LCR) CAPITAL, FUNDING AND LIQUIDITY 1 Other flows include credit and liquidity facilities, collateral outflows and inflows from customers. 2 Other HQLA includes securities issued by foreign sovereigns and repo-eligible qualifying assets in foreign jurisdictions, including RBNZ eligible securities. Liquid assets HQLA 1 Net cash outflows (NCOs) Other flows1 Wholesale funding Customer deposits 2 $183bn $530bn March 2025 quarterly average 135% Chart does not add due to rounding Chart does not add due to rounding Chart does not add due to rounding |
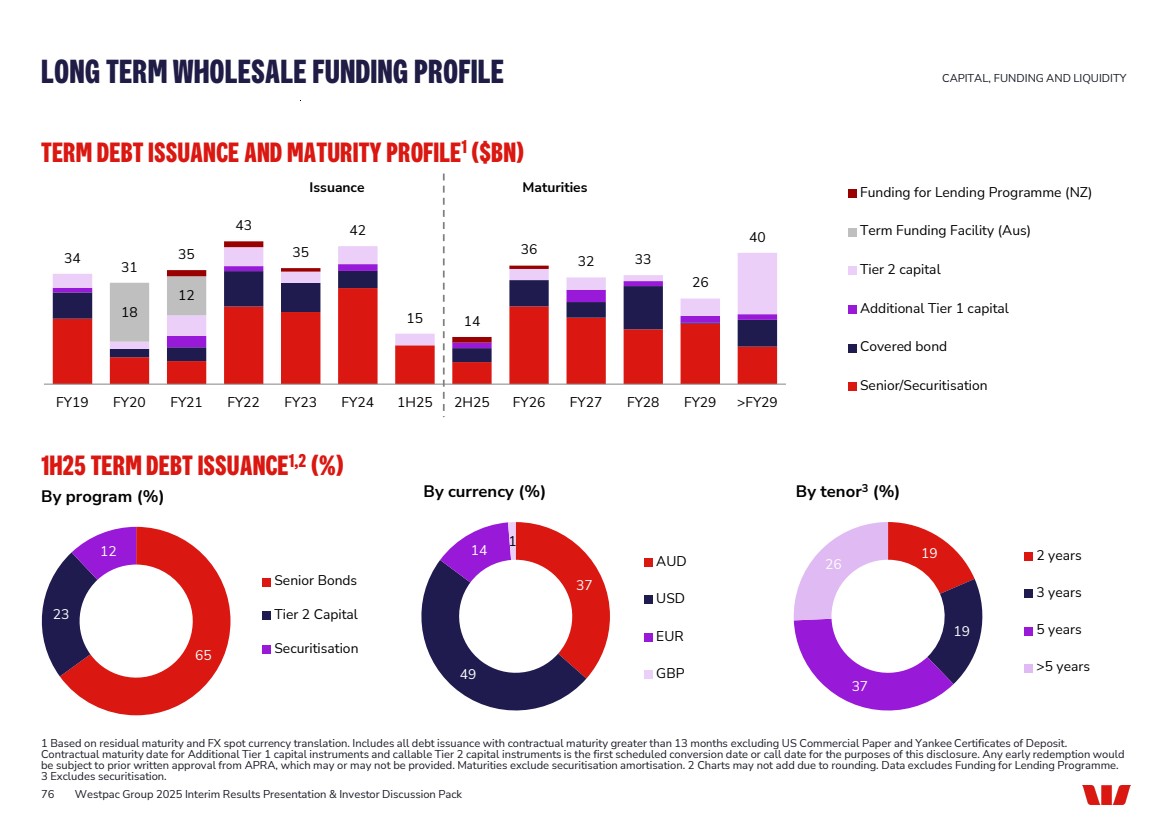
| 76 TERM DEBT ISSUANCE AND MATURITY PROFILE1 ($BN) Westpac Group 2025 Interim Results Presentation & Investor Discussion Pack LONG TERM WHOLESALE FUNDING PROFILE 1 Based on residual maturity and FX spot currency translation. Includes all debt issuance with contractual maturity greater than 13 months excluding US Commercial Paper and Yankee Certificates of Deposit. Contractual maturity date for Additional Tier 1 capital instruments and callable Tier 2 capital instruments is the first scheduled conversion date or call date for the purposes of this disclosure. Any early redemption would be subject to prior written approval from APRA, which may or may not be provided. Maturities exclude securitisation amortisation. 2 Charts may not add due to rounding. Data excludes Funding for Lending Programme. 3 Excludes securitisation. 1H25 TERM DEBT ISSUANCE1,2 (%) 37 49 14 1 AUD USD EUR GBP 19 19 37 26 2 years 3 years 5 years >5 years By program (%) By currency (%) By tenor3 (%) 18 12 34 31 35 43 35 42 15 14 36 32 33 26 40 FY19 FY20 FY21 FY22 FY23 FY24 1H25 2H25 FY26 FY27 FY28 FY29 >FY29 Funding for Lending Programme (NZ) Term Funding Facility (Aus) Tier 2 capital Additional Tier 1 capital Covered bond Senior/Securitisation Issuance Maturities 65 23 12 Senior Bonds Tier 2 Capital Securitisation CAPITAL, FUNDING AND LIQUIDITY |
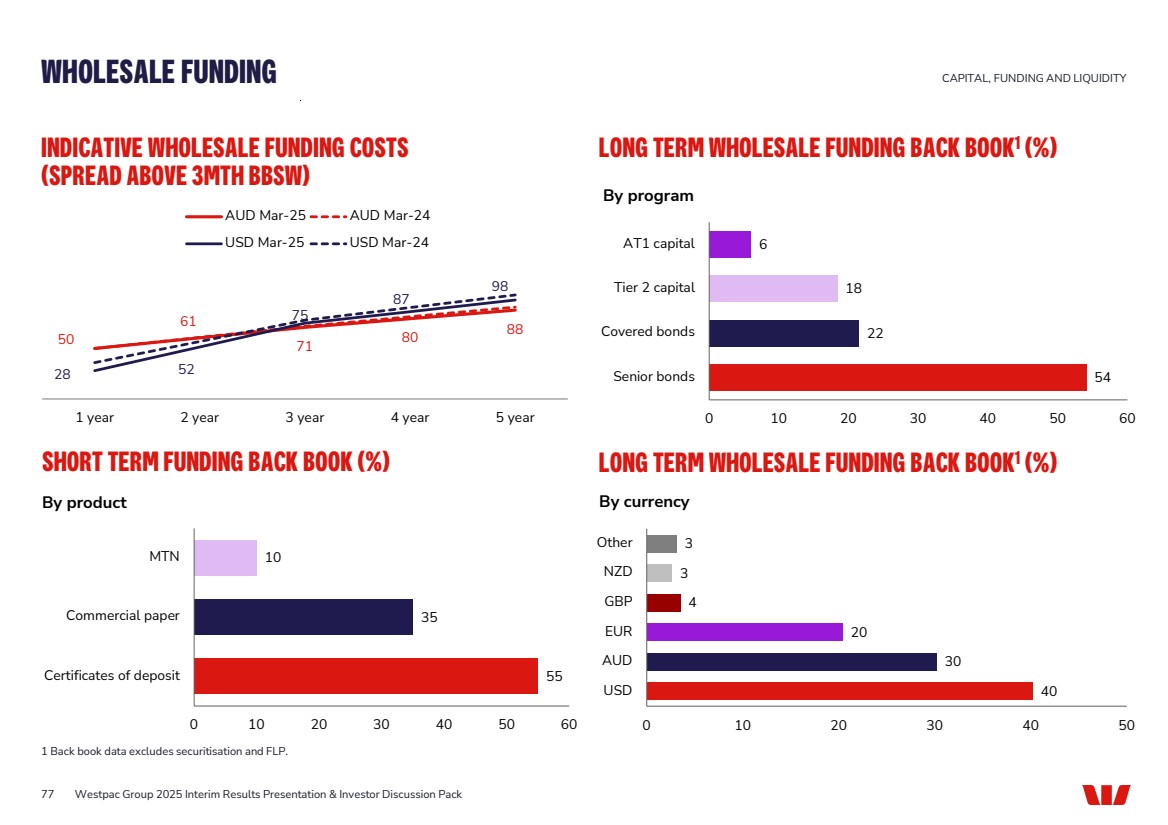
| 77 WHOLESALE FUNDING INDICATIVE WHOLESALE FUNDING COSTS (SPREAD ABOVE 3MTH BBSW) 1 Back book data excludes securitisation and FLP. LONG TERM WHOLESALE FUNDING BACK BOOK1 (%) 50 61 71 80 88 28 52 75 87 98 1 year 2 year 3 year 4 year 5 year AUD Mar-25 AUD Mar-24 USD Mar-25 USD Mar-24 By program By currency 54 22 18 6 Senior bonds Covered bonds Tier 2 capital AT1 capital 0 10 20 30 40 50 60 40 30 20 4 3 3 0 10 20 30 40 50 USD AUD EUR GBP NZD Other CAPITAL, FUNDING AND LIQUIDITY Westpac Group 2025 Interim Results Presentation & Investor Discussion Pack SHORT TERM FUNDING BACK BOOK (%) 55 35 10 Certificates of deposit Commercial paper MTN 0 10 20 30 40 50 60 By product LONG TERM WHOLESALE FUNDING BACK BOOK1 (%) |
| SUPPORTING CUSTOMERS |

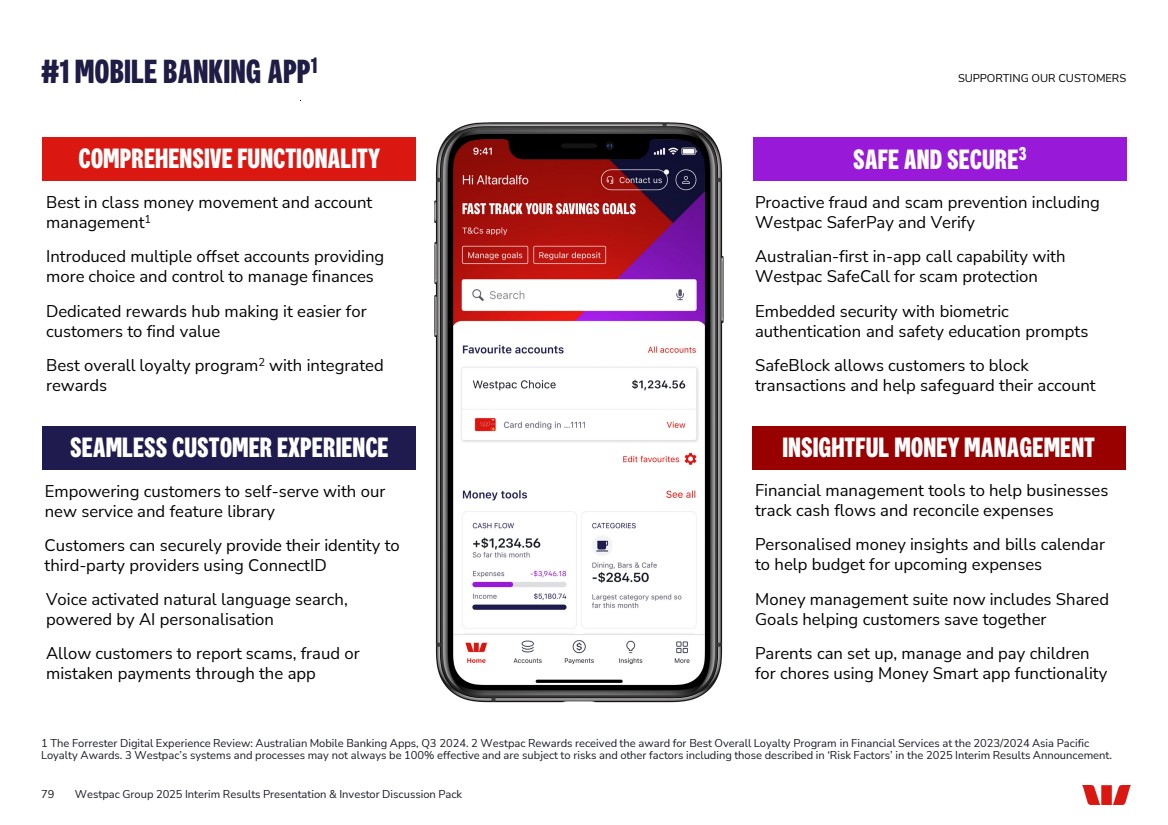
| #1 MOBILE BANKING APP1 79 Westpac Group 2025 Interim Results Presentation & Investor Discussion Pack SUPPORTING OUR CUSTOMERS 1 The Forrester Digital Experience Review: Australian Mobile Banking Apps, Q3 2024. 2 Westpac Rewards received the award for Best Overall Loyalty Program in Financial Services at the 2023/2024 Asia Pacific Loyalty Awards. 3 Westpac’s systems and processes may not always be 100% effective and are subject to risks and other factors including those described in ‘Risk Factors’ in the 2025 Interim Results Announcement. Empowering customers to self-serve with our new service and feature library Financial management tools to help businesses track cash flows and reconcile expenses COMPREHENSIVE FUNCTIONALITY Best in class money movement and account management1 SAFE AND SECURE3 SEAMLESS CUSTOMER EXPERIENCE INSIGHTFUL MONEY MANAGEMENT Introduced multiple offset accounts providing more choice and control to manage finances Australian-first in-app call capability with Westpac SafeCall for scam protection Dedicated rewards hub making it easier for customers to find value Embedded security with biometric authentication and safety education prompts Best overall loyalty program2 with integrated rewards Customers can securely provide their identity to third-party providers using ConnectID Personalised money insights and bills calendar to help budget for upcoming expenses Voice activated natural language search, powered by AI personalisation Money management suite now includes Shared Goals helping customers save together Allow customers to report scams, fraud or mistaken payments through the app Parents can set up, manage and pay children for chores using Money Smart app functionality Proactive fraud and scam prevention including Westpac SaferPay and Verify SafeBlock allows customers to block transactions and help safeguard their account |
| EVOLVING OUR DIGITAL BANKING EXPERIENCE SUPPORTING OUR CUSTOMERS 80 Westpac Group 2025 Interim Results Presentation & Investor Discussion Pack Manage chores, encourage savings and develop good money habits PAYMENTS & TRANSACTIONS Pocket money features for kids Verify identity securely via one digital pathway SERVICING & ONBOARDING One best digital way for ID verification LOYALTY & REWARDS Rewarded customers with ~$70m in value in 1H25 LOYALTY & REWARDS Westpac Rewards Hub redeem & track rewards MONEY MANAGEMENT Business Financial Management Business insights and tools with personalised features for sole traders |
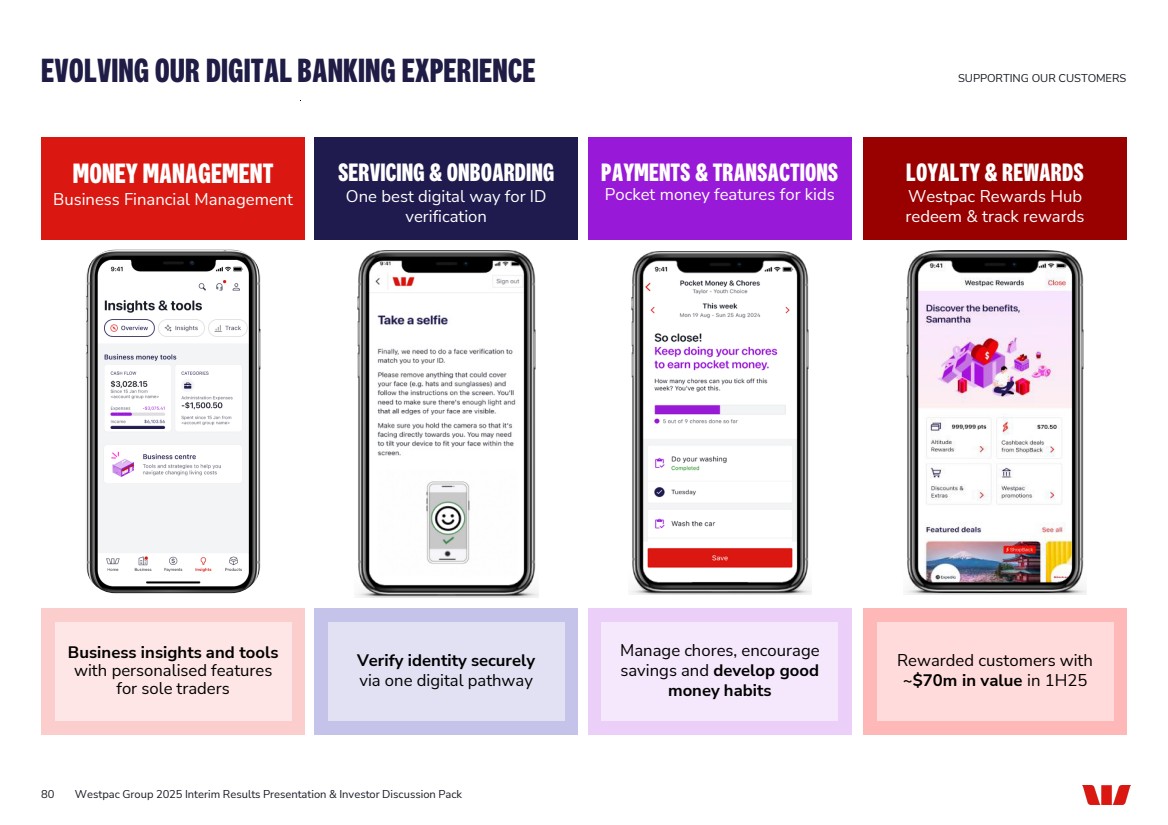
| ENHANCING BANKING PROTECTION FOR CUSTOMERS1 SUPPORTING OUR CUSTOMERS This page contains ‘forward-looking statements’ and statements of expectation. Please refer to the disclaimer on page 113. 1 Westpac’s systems and processes may not always be 100% effective and are subject to risks and other factors including those described in ‘Risk Factors’ in the 2025 Interim Results Announcement. SAFECALL Spot genuine Westpac calls VERIFY Payee name verification SAFERPAY Alerts of potential scams SAFEBLOCK Take control of your security • Australian-first in-app calling capability to help prevent scammers impersonate us is now rolling out • Available in the app to over 1 million customers • Prevents on average more than 400 mistaken/error payments per day • Averted $5m in customer scam losses since launching in June 2024 • Challenged over 616k transfers; customers abandoned $251m in payments in 1H25 • Averted $45m in customer scam losses in 1H25 • Targeted to launch in September 2025 • Allows customers to immediately block their account when they suspect they are being scammed 81 Westpac Group 2025 Interim Results Presentation & Investor Discussion Pack |
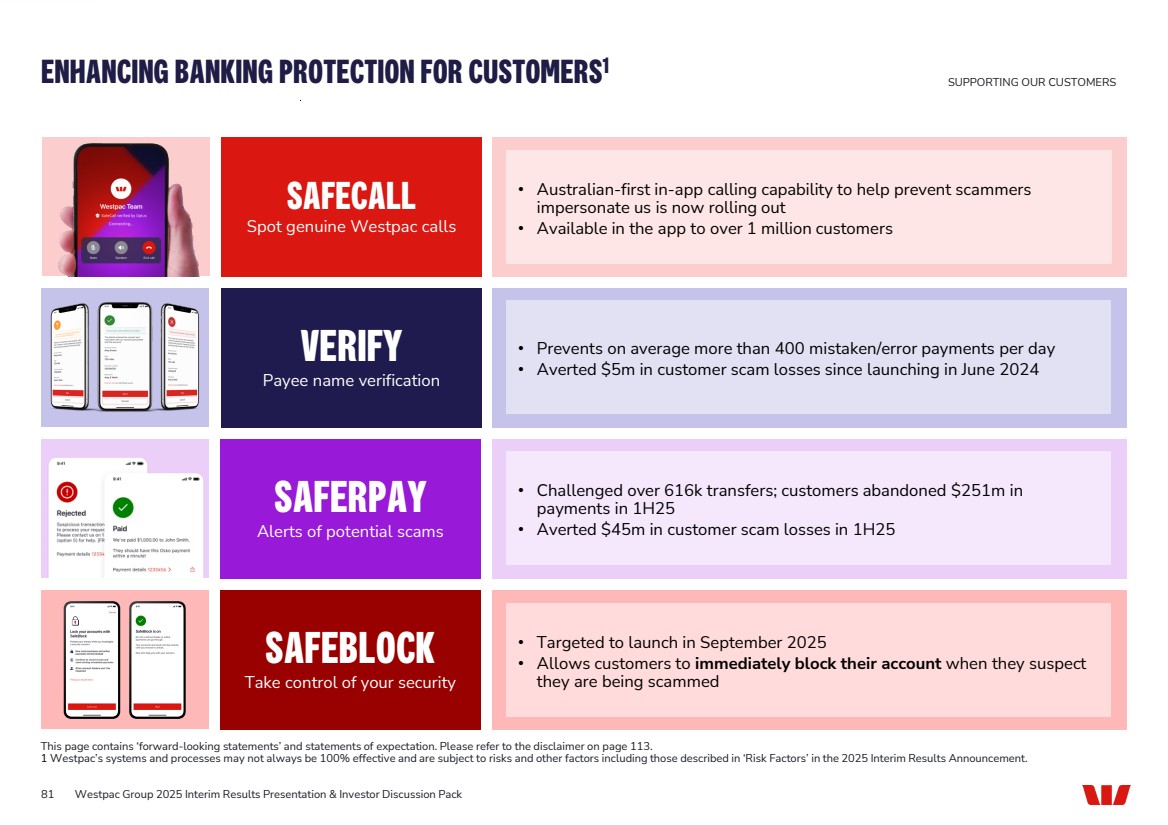
| 0% 5% 10% 15% 20% 0 5 10 15 20 25 30 35 Sep-20 Mar-21 Sep-21 Mar-22 Sep-22 Mar-23 Sep-23 Mar-24 Sep-24 Mar-25 SCAM AND DIGITAL FRAUD DETECTION (%)2 DYNAMIC CVC USERS3 1H25 SNAPSHOT Westpac Group 2025 Interim Results Presentation & Investor Discussion Pack PROTECTING CUSTOMERS FROM FRAUD AND SCAMS1 1 Westpac’s systems and processes may not always be 100% effective and are subject to risks and other factors including those described in ‘Risk Factors’ in the 2025 Interim Results Announcement. 2 Detection rate indicates the percentage of cases Westpac triggers alerts for. 3 Monthly average. Average daily users (LHS) Usage rate of eligible transaction (RHS) 66 65 68 74 80 81 30 40 50 60 70 80 90 1H24 2H24 1H25 Scam Fraud SafeCall launched to help prevent scammers impersonating staff Announced SafeBlock, a new feature allowing customers to block transactions and safeguard their account Customer reported scam losses 19% lower compared to 2H24 Top scams driving customer losses: investment, business email compromise, romance, bank scam, buying & selling on social media Dynamic CVC fraud is 50% lower than cards with static CVC SUPPORTING OUR CUSTOMERS 82 ,000’s |
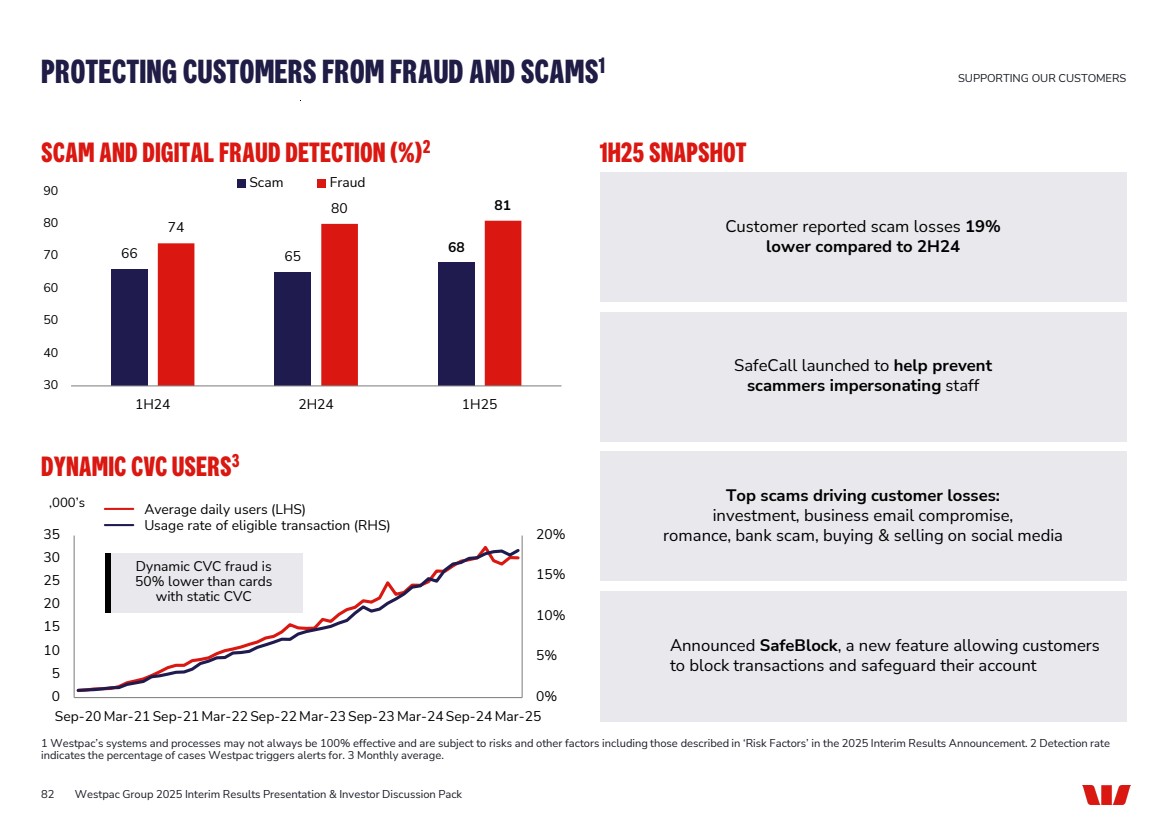
| Jan-23 Mar-23 May-23 Jul-23 Sep-23 Nov-23 Jan-24 Mar-24 May-24 Jul-24 Sep-24 Nov-24 Jan-25 Number of cases Net customer loss Introduction of SaferPay Enhancement of Westpac Verify to digital channel 83 INVESTED ~$115M IN DETECTION AND PREVENTION MEASURES SINCE FY21, SAVING CUSTOMERS OVER $800M IN FRAUD AND SCAM LOSSES Westpac Group 2025 Interim Results Presentation & Investor Discussion Pack BROAD SUITE OF SECURITY FEATURES DRIVING DOWN CUSTOMER LOSSES 1 Westpac’s systems and processes may not always be 100% effective and are subject to risks and other factors including those described in ‘Risk Factors’ in the 2025 Interim Results Announcement. Introduction of Westpac Verify Introduction of cryptocurrency blocks ‘Callstop’ initiative launched and expanded in partnership with telcos SUPPORTING OUR CUSTOMERS Biometric onboarding reduces identity theft, fraud and promotes digital usage Saved $14m in averted fraud losses in 1H25 Real-time blocking of questionable online merchants Saved $55m from 500,000 customer scam incidences in 1H25 Advanced customer behavioural tools combatting remote access scams Saved customers $36m in averted scam losses in 1H25 |
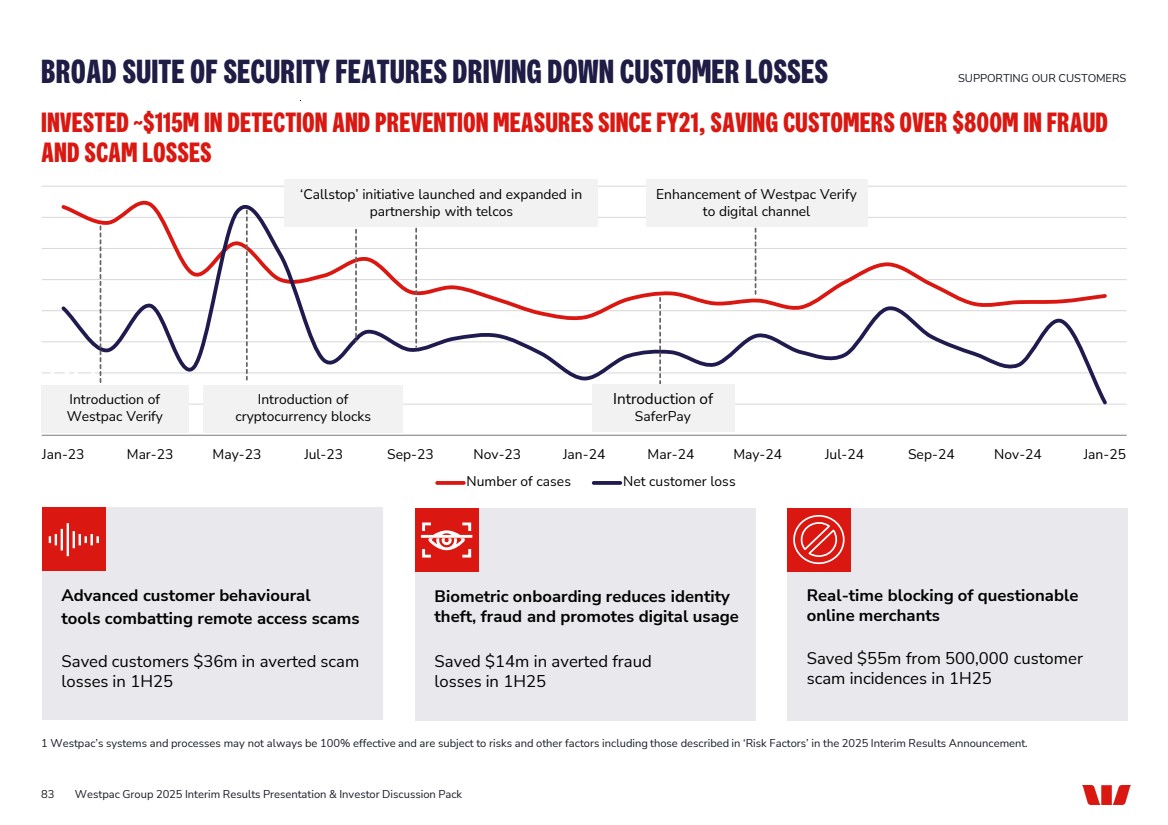
| 5.64 5.80 5.92 6.02 6.10 5.4 5.6 5.8 6 6.2 1H23 2H23 1H24 2H24 1H25 0.41 0.41 0.45 0.44 0.44 42 43 46 48 47 1H23 2H23 1H24 2H24 1H25 Sales (#m) Sales (%) 372 395 412 429 437 1H23 2H23 1H24 2H24 1H25 DIGITAL SALES1,2 DIGITAL TRANSACTIONS1 DIGITALLY ACTIVE CUSTOMERS (#M) 1 (#M) CUSTOMERS CONTINUE TO MIGRATE TO DIGITAL 1 For further details see page 111. 2 Consumer only. UP 1% UP 2% UP 6% DOWN 2% FLAT SUPPORTING OUR CUSTOMERS MOBILE WALLET PAYMENTS1 (#M) UP 8% 320 350 387 418 455 1H23 2H23 1H24 2H24 1H25 UP 9% UP 18% 84 Westpac Group 2025 Interim Results Presentation & Investor Discussion Pack |
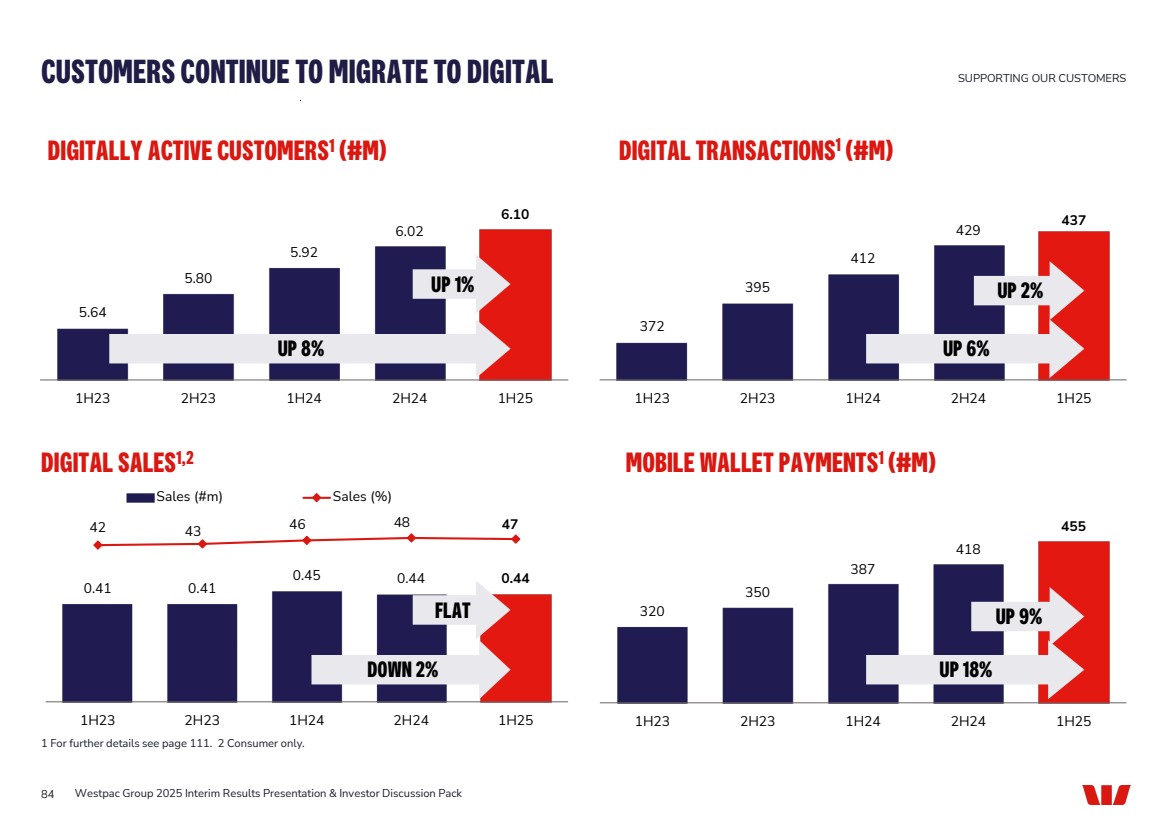
| 1 ATM numbers include Westpac Group ATMs, Precinct, ATMx and ANZ. 6.2 2.0 1H19 1H25 Westpac ATM withdrawals have reduced by 68% since 2019 INVESTING IN SUPPORTING CASH SERVICES #M, Avg. # of Monthly Withdrawals PROVIDING CASH SERVICES FOR AUSTRALIAN CUSTOMERS CHANGING CUSTOMER PREFERENCES Digital payments have increased by 81% #M, Avg. # of Monthly Transactions 40.3 72.8 1H19 1H25 23 32 1H19 1H25 Westpac spent ~$170m in 1H25 as part of our commitment to providing Australians access to cash 97% of customers live within a 20km radius of a Bank@Post location, where cash services are available Westpac customers have access to Australia’s largest fee-free ATM network at over ~6,600 ATMs1 As part of our Australia Post partnership, Westpac customers can use 3,400 Bank@Post locations, including 1,800 in regional Australia UP 39% SUPPORTING OUR CUSTOMERS 85 Westpac Group 2025 Interim Results Presentation & Investor Discussion Pack Westpac ATMs used by other financial institution customers (%) COST OF PROVIDING CASH SERVICES ~$170 million in 1H25 Including the collaborative agreement to support Armaguard to maintain cash availability in the community |

| CONSUMER MFI SHARE1,2 CUSTOMER SATISFACTION (CSAT)2 NET PROMOTER SCORE (NPS®) 2 Westpac Group 2025 Interim Results Presentation & Investor Discussion Pack FRANCHISE 1 Main Financial Institution for Consumer customers. 2 For further details see page 111. 3 Customer numbers have been restated. Customers related to businesses sold, held for sale or in runoff at Mar-25 have been excluded from all periods. 4 Other includes WIB, Westpac Pacific and Platforms customers. 5 New Zealand Consumer. Business Consumer Charts may not add due to rounding 13.9% 33.2% 11.7% 17.2% Peer 1 Peer 2 Peer 3 Westpac Group CUSTOMER NUMBERS3 (#M) New Zealand2,5 10.3 10.5 10.5 1.5 1.5 1.5 0.8 0.7 0.7 12.7 12.7 12.7 Mar-24 Sep-24 Mar-25 Australian banking New Zealand Other -5 0 5 10 15 Mar-24 Jun-24 Sep-24 Dec-24 Mar-25 WBC St.George Brands -20 -15 -10 -5 0 5 10 15 20 Mar-24 Jun-24 Sep-24 Dec-24 Mar-25 WBC St.George Brands 6.8 7.0 7.2 7.4 7.6 7.8 8.0 Mar-24 Jun-24 Sep-24 Dec-24 Mar-25 WBC St.George Brands 7.2 7.4 7.6 7.8 8.0 Mar-24 Jun-24 Sep-24 Dec-24 Mar-25 WBC St.George Brands 4 Peers Peers Peers Peers SUPPORTING OUR CUSTOMERS 86 15 12 14 35 31 34 35 29 32 25 26 21 19 17 23 Mar-24 Sep-24 Mar-25 Westpac Peers 59 60 61 74 74 74 75 70 70 72 71 72 66 65 70 Mar-24 Sep-24 Mar-25 Westpac Peers |
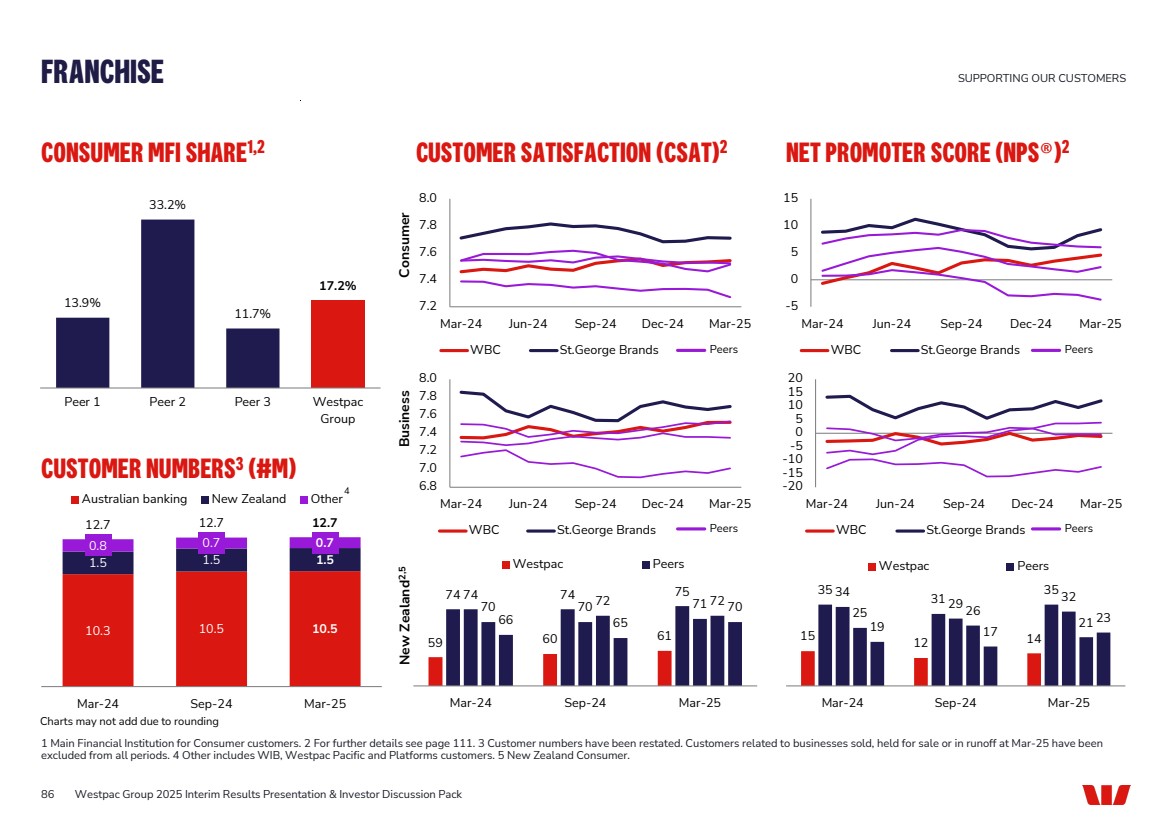
| 87 TIME TO DECISION (DAYS) 5.4 5.2 5.2 4.7 9.7 6.1 5.0 4.8 2H23 1H24 2H24 1H25 1st Party 3rd Party ON-DAY SETTLEMENT (%) 77.4 81.8 85.7 86.2 2H23 1H24 2H24 1H25 MORTGAGE PRODUCT NPS®1 -30 -25 -20 -15 -10 -5 0 Mar-23 Sep-23 Mar-24 Sep-24 Mar-25 1st Party 3rd Party Total UNIT COST PER 3RD PARTY APPLICATION ($) ~550 ~500 1H24 1H25 Westpac Group 2025 Interim Results Presentation & Investor Discussion Pack IMPROVEMENT IN MORTGAGES SUPPORTING OUR CUSTOMERS 1 For further details see page 111. (10%) UP 5% Westpac Group ranks #1 among peers |
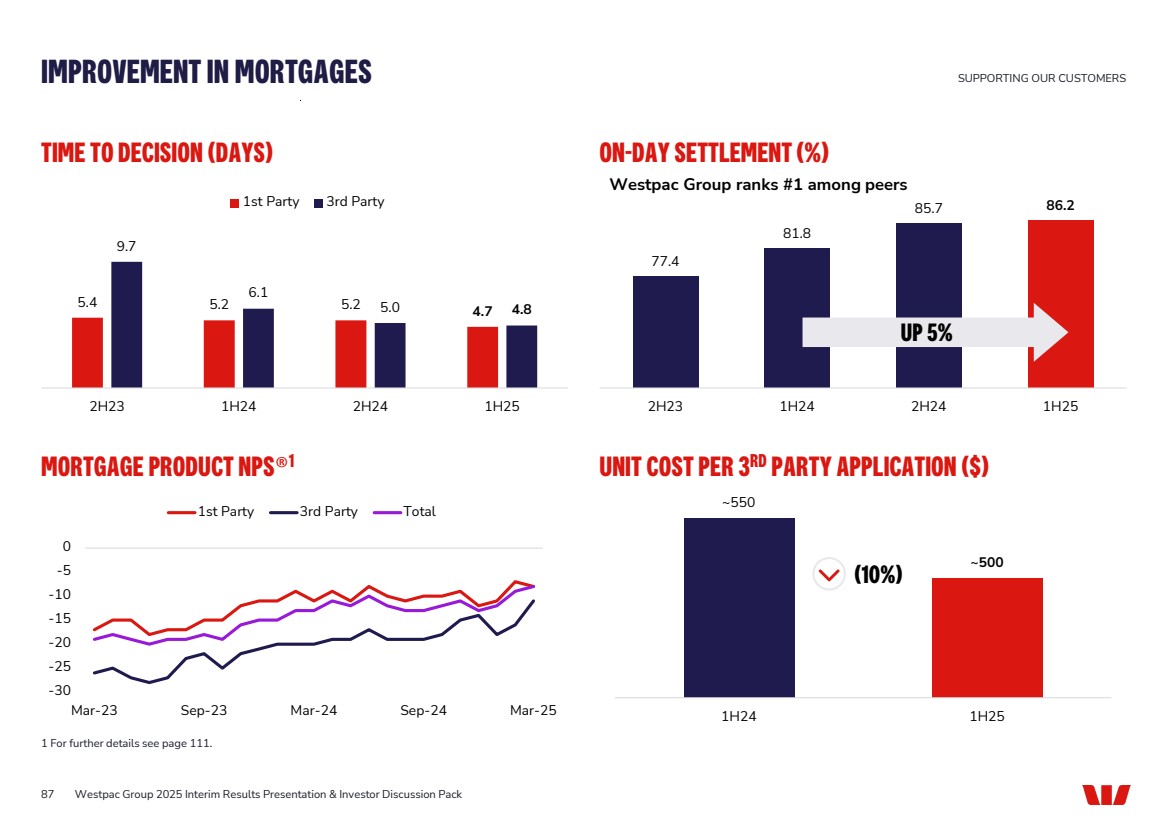
| SYSTEM SECURITY DATA Westpac Group 2025 Interim Results Presentation & Investor Discussion Pack CYBER SECURITY – A LAYERED DEFENCE Westpac’s systems and processes may not always be 100% effective and are subject to risks and other factors including those described in ‘Risk Factors’ in the 2025 Interim Results Announcement. EMPLOYEES Controls underpin who we hire; how we grant access; and how we monitor system use SUPPLIERS Security reviews, limited access to systems and data, and continual performance monitoring SYSTEM SECURITY Integrated approach to security of our systems, e.g. design reviews, patching and secure development CUSTOMERS Dedicated controls to help protect customers from fraud, including multi-factor authentication CORE SECURITY Core security capabilities across all systems, e.g. malware prevention, firewalls, email security MONITORING, INTELLIGENCE AND NETWORKS 24/7 monitoring of attacks and control weaknesses. Threat detection supported by cyber threat intelligence and information sharing partnerships MONITORING, CYBER INTELLIGENCE & PEER NETWORKS SUPPORTING OUR CUSTOMERS 88 |
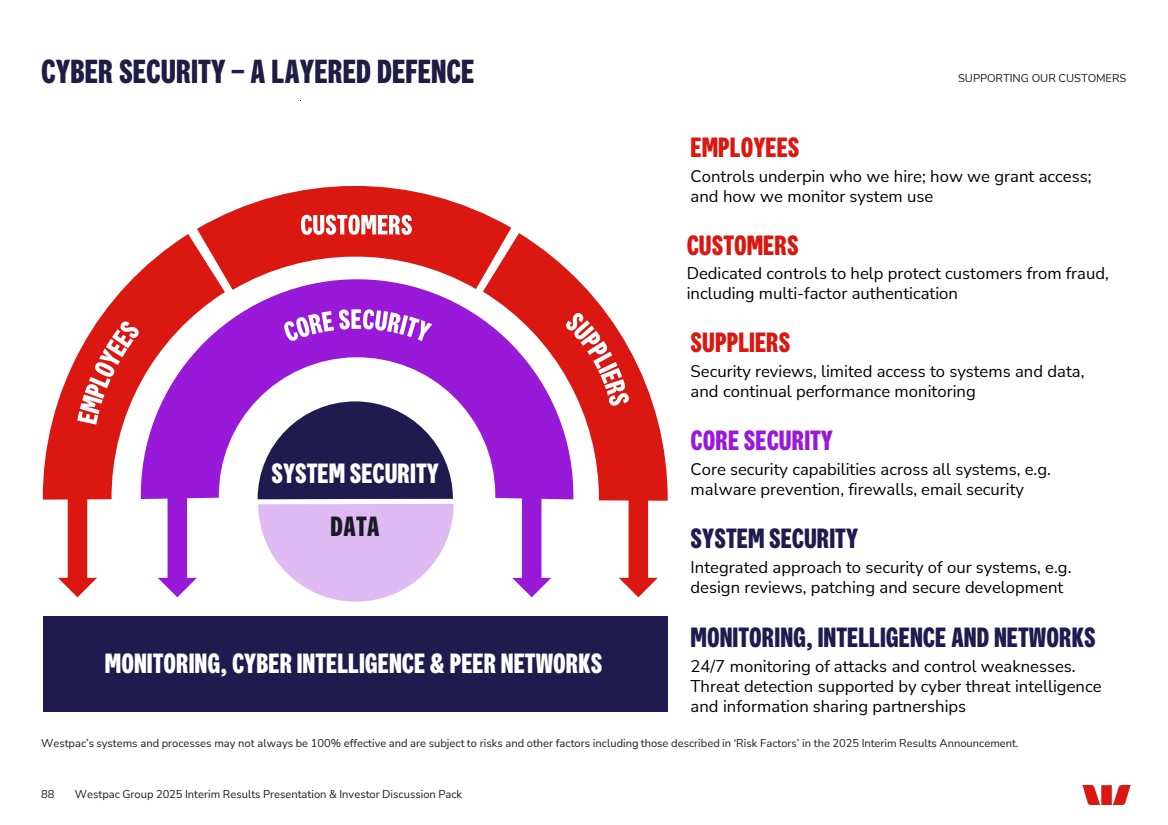
| SUSTAINABILITY |

| SUSTAINABILITY AND CLIMATE STRATEGIES SUSTAINABILITY 90 Westpac Group 2025 Interim Results Presentation & Investor Discussion Pack Reports available at westpac.com.au/sustainability These Sustainability pages contain forward-looking statements and statements of expectation. Please refer to the disclaimer at the back of this pack. Details on our sustainability commitments, targets and other supporting information is in our 2024 Annual Report, Climate Report and Sustainability Index and Datasheet. See website for more information on our sustainability strategy. THEMES OBJECTIVES PILLAR OUR PURPOSE Support in good times and bad Simpler, safer bank CREATING BETTER FUTURES TOGETHER Customer Easy Enhance financial inclusion and equality Strengthen data security and protection Action on climate and nature Expert Become a net-zero, climate resilient bank Become a nature positive bank Equitable and inclusive society Advocate Respect and advance human rights Enable diversity and inclusion 1 2 3 4 5 6 Net-zero, climate resilient operations Supporting customers’ transition to net-zero and to build their climate resilience Collaborate for impact on initiatives towards net-zero and climate resilience THREE AREAS OF CLIMATE ACTION 2024 Modern Slavery Statement 2024 Sustainability Index and Datasheet 2024 Annual Report Other sustainability positions and disclosures include 2024 Human Rights Position Statement and Action Plan 2023 Natural Capital Position Statement 2024 Sustainable Finance Framework 2024 Climate Methodologies Supplement 2023-2025 Climate Change Position Statement and Action Plan New Zealand – 2024 Sustainability and Climate Reports 2024 Climate Report |
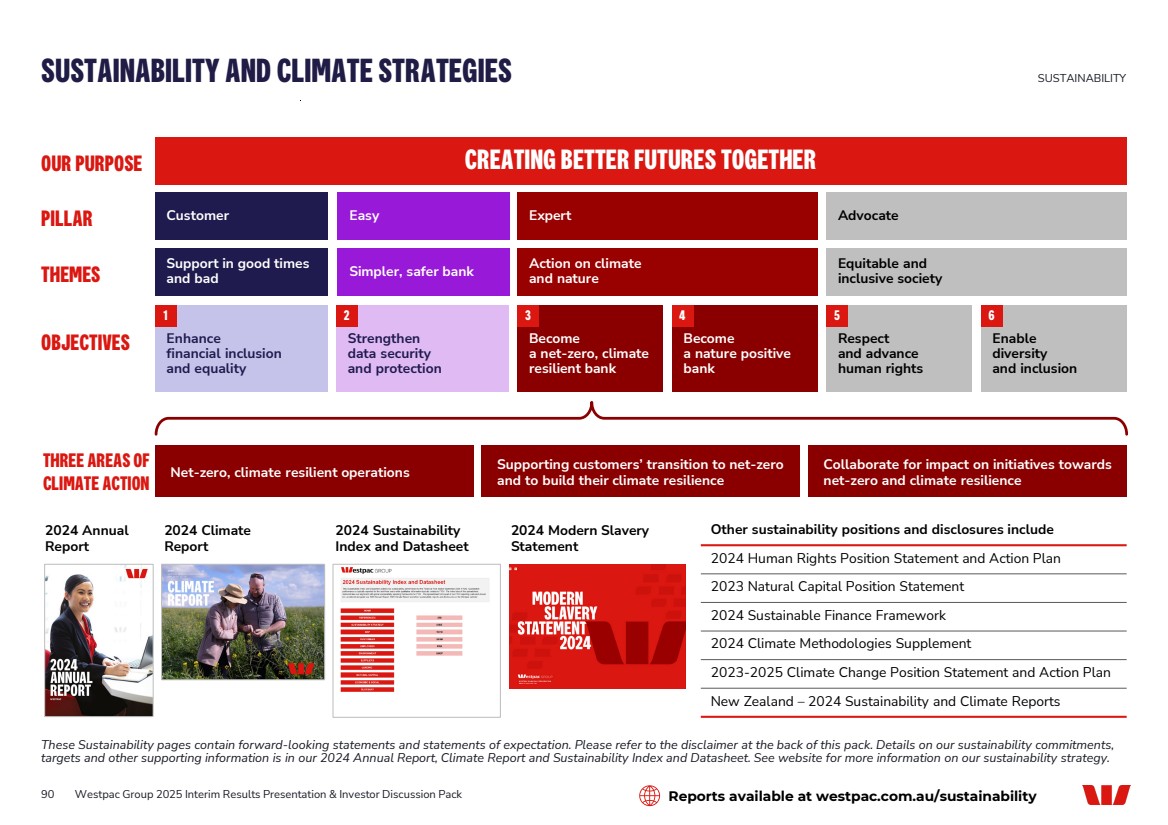
| • Continued to engage customers and refined our approach, focusing on climate opportunities and sharing insights • Completed ESG risk assessments for: ‐ >5,000 Australian commercial customers (~3,800 since Oct-24); and ‐ Our 50 largest business customers in Fiji and PNG • Elevated Chief Sustainability Officer role to report to the CEO • Inclusion of sustainability and climate-related measures in the CEO scorecard • Engaged ~4,800 employees through a Sustainability Town Hall • Presented a Market Update on our sustainability progress • Scope 1 and 2 absolute emissions reduced by 88%, exceeding our 2030 reduction target • Source the equivalent of 100% of our direct operational Australian electricity demand from renewables • Launched two additional employee renewable electricity offers • Introduced collection services for select hard-to-recycle materials at our Vic and NSW corporate offices SUSTAINABILITY AND CLIMATE HIGHLIGHTS 91 SUSTAINABILITY 1 Lending is TCE or balance for mortgages, assessed as sustainable finance in accordance with our Sustainable Finance Framework at 31 March 2025. 2 Bond facilitation target and progress is measured as the cumulative sum of our proportionate share of qualifying bonds facilitated from 1 Oct-21. Prior years are restated following data quality reviews which identified additional bonds not previously included. Westpac Group 2025 Interim Results Presentation & Investor Discussion Pack • Launched a Safety by Design Toolkit, in collaboration with the ABA, to help banks design products and services that mitigate financial harms • Updated our Human Rights Risk Assessment to help identify and mitigate salient human rights risks • Doubled our commitment to support female entrepreneurs to $1bn ($557m funding provided since Jun-23) CUSTOMERS TRANSITION TO NET-ZERO OTHER HIGHLIGHTS PROMOTING AN EQUITABLE AND INCLUSIVE SOCIETY STRENGTHENING GOVERNANCE AND ENGAGEMENT • 739 EV/hybrid vehicle loans provided to Australian customers totalling $31m • Launched Australia’s first Social Tailored Deposit to help fund lending that seeks to improve specific social issues • Provided 278 disaster relief packages to customers impacted by Ex-Tropical Cyclone Alfred • Released the Westpac New Zealand 2027 Sustainability Commitments GROWING SUSTAINABLE FINANCE Lending1 ($bn) 2030 LENDING TARGET: $55BN 2030 BOND FACILITATION TARGET: $40BN Cumulative BOND FACILITATION from 1 oct-212 ($BN) 4.9 9.9 15.9 19.1 Sep-22 Sep-23 Sep-24 Mar-25 +20% NET-ZERO OPERATIONS 28.7 33.3 Sep-24 Mar-25 +16% |
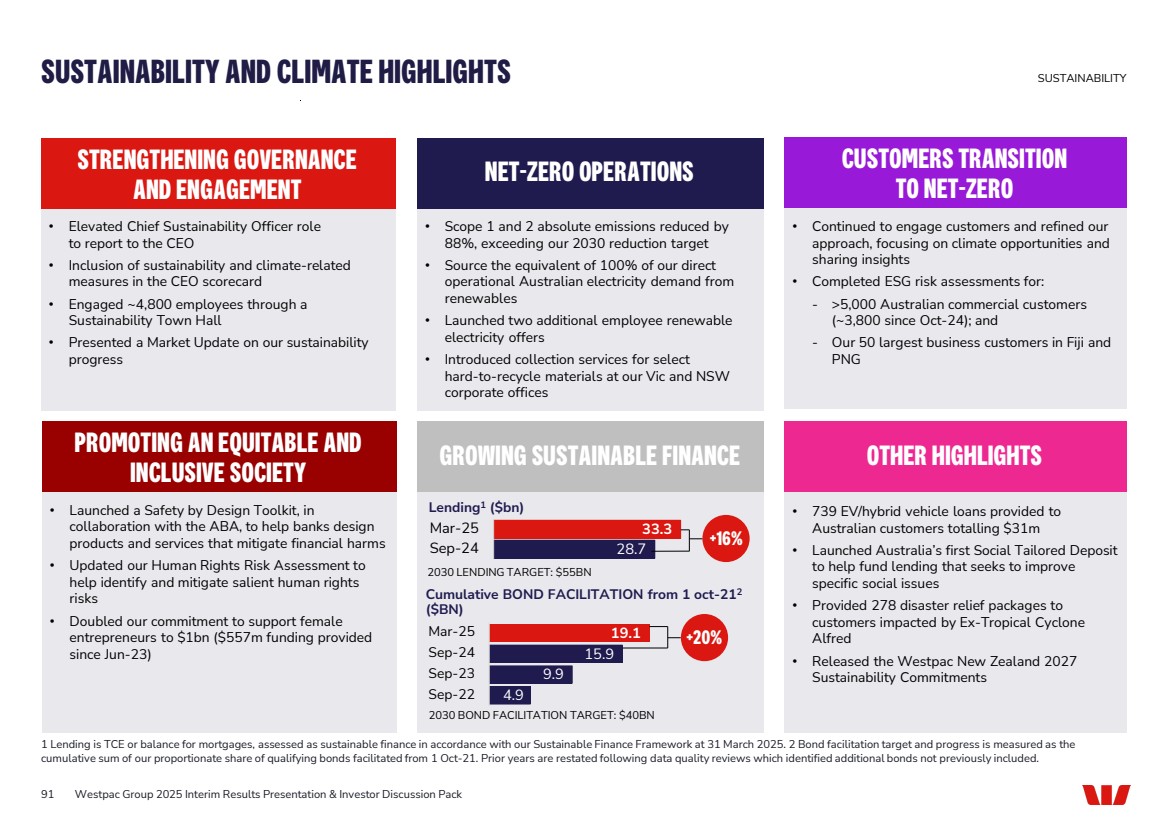
| OUR PEOPLE – STRENGTHENING INCLUSION, DIVERSITY AND WELLBEING 92 Westpac Group 2025 Interim Results Presentation & Investor Discussion Pack PEOPLE 1 40% women, 40% men and 20% of any gender. Westpac Board includes CEO. Executive team excludes CEO. 2 Senior leadership includes executive team, general managers and their direct reports (excluding administrative or support roles). 3 Our Voice+ survey includes McKinsey's Organisational Health Index – benchmarking Westpac’s organisational health relative to global standards. 1.08% of our Australian workforce identify as Aboriginal and /or Torres Strait Islander at Mar-25 (Target 1.5% by Sep-25) • Supporting Indigenous career pathways at Westpac, including an Indigenous Careers Summit in Sep-24 • 28 candidates completed the Indigenous Australian MobTech Program with all securing permanent employment Organisational Health Index score3 80at Sep-24 • Top quartile globally • 7 points above global banking median Chief Mental Health Officer overseeing Group mental health strategy since 2018 Mental Health Workplace Factors Review program assessing and addressing psychosocial risks at division level in Australia to be completed in FY25 10 Employee Advocacy Groups supporting inclusion, diversity and wellbeing Career development - delivered Advance mentoring program for women with disabilities, RISE Project supporting 20 culturally diverse women to advance their leadership careers, ongoing partnership with Asian Leadership Project Upstander initiative expanded - to speak up and act against racism and discrimination INDIGENOUS REPRESENTATION Focus on closing gender pay gap by improving female representation in Technology, Finance, Institutional and Business Bank. Targeted initiatives: • Illuminate program sees every General Manager sponsor an aspiring female leader in their business • New StepUP program aims to grow our pipeline of women in mid-level roles • Career Sprints providing exposure and connection for women to new areas within the bank INITIATIVES SUPPORTING MENTAL HEALTH ORGANISATIONAL HEALTH Females % Mar-25 Target Progress Westpac Board 33 40:40:201 Executive Team 50 40:40:201 ✓ General Managers 40 40 +/-2% ✓ Senior Leadership 49 50 +/-2%2 ✓ Westpac workforce 54 50 ✓ GENDER DIVERSITY |
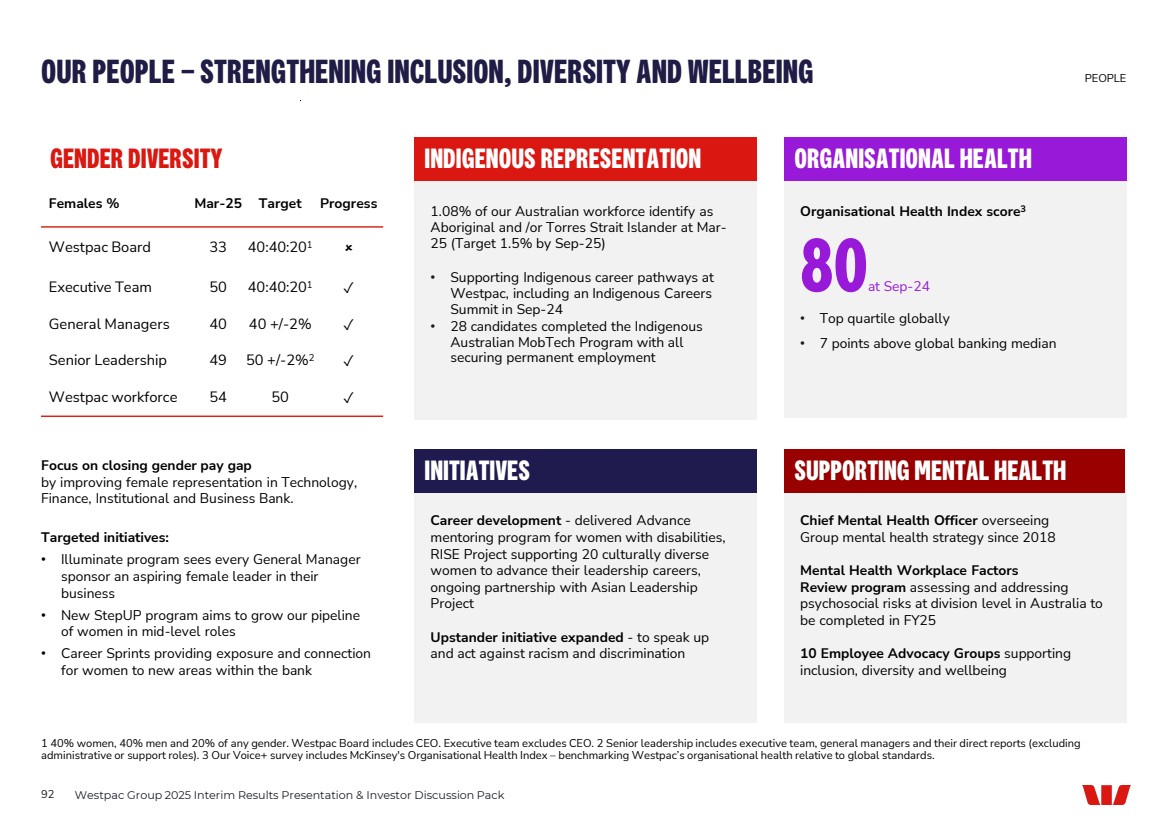
| SEGMENT RESULTS |

| 7 2 1,058 - 1,126 (9) 1,088 (38) 1H24 2H24 Net interest income Non-interest income Operating expenses Impairment charges Tax and NCI 1H25 94 NET PROFIT ($M) Key financial metrics ex Notable Items 1H24 2H24 1H25 Change on 2H24 Return on average tangible equity (%) 8.9 9.4 9.4 (7 bps) Expense to income (%) 58.7 58.6 58.6 (2 bps) Net interest margin (%) 1.69 1.70 1.70 - Average interest-earning assets ($bn) 446 454 455 flat Pre-provision profit ($m) 1,661 1,712 1,712 - Customer deposit to loan ratio (%) 64.0 65.5 67.9 232 bps Mortgage 90+ day delinquencies (%) 1.06 1.12 0.86 (26 bps) CONSUMER 1H25 PERFORMANCE CONSUMER 1 Australian consumer and business customers who have had an authenticated session (including Quickzone) on Westpac Group digital banking platforms in the prior 90 days. 2 For further details see page 111. 3 Includes all points of presence including Advisory, Community Banking Centres and Kiosks. Co-located branches are considered two points of presence. DOWN 3% AIEA flat, NIM stable Benefits from Cost Reset offset by higher salaries, wages and UNITE Increase in downside scenario weight and higher write-offs in cards and personal lending Key operating metrics 1H24 2H24 1H25 Change on 2H24 Active digital banking customers1 (#m) 5.92 6.02 6.10 1% Main financial institution2 (%) 16.6 16.8 17.2 2% NPS (rank)2 #3 #3 #2 1 Branches3 (#) 637 626 620 (6) Co-location branches (#) 99 111 114 3 Westpac-owned ATMs (#) 846 810 778 (4%) Westpac Group 2025 Interim Results Presentation & Investor Discussion Pack |
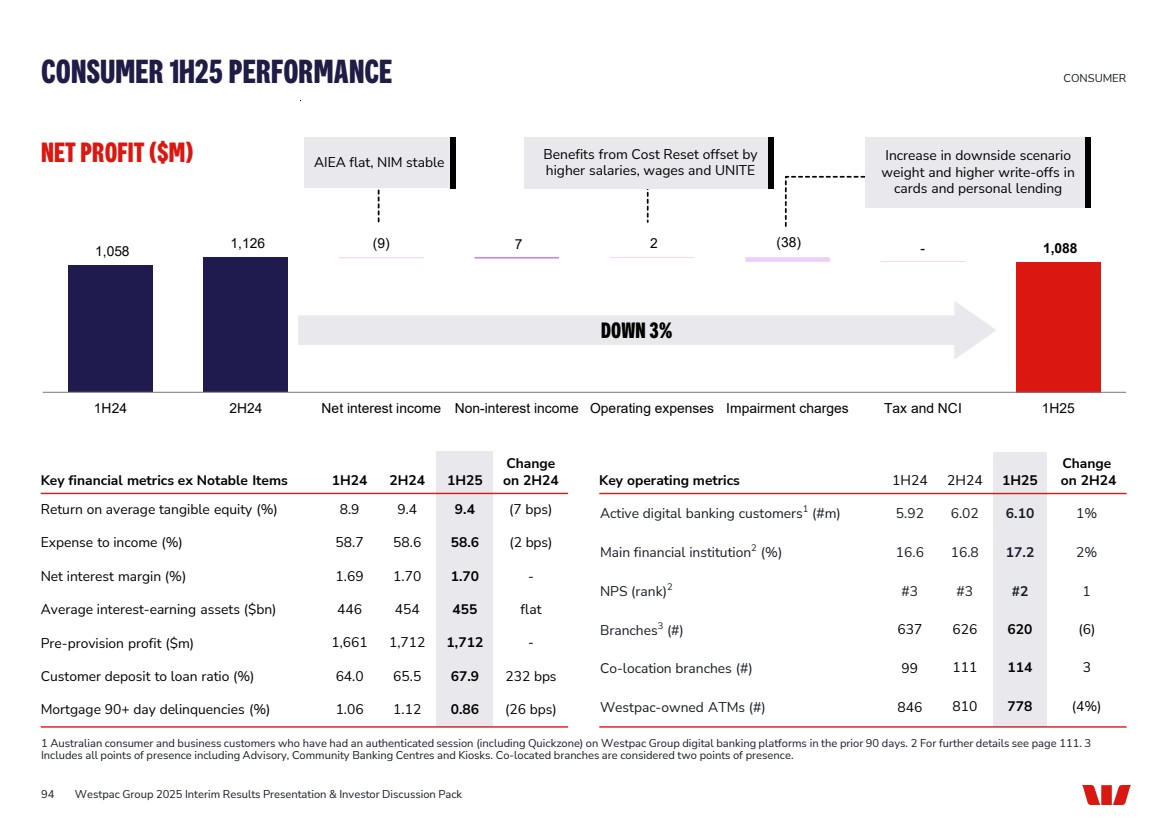
| 7 2 23 1,175 1,181 1,118 (25) (70) 1H24 2H24 Net interest income Non-interest income Operating expenses Impairment charges Tax and NCI 1H25 95 NET PROFIT ($M) BUSINESS AND WEALTH 1H25 PERFORMANCE BUSINESS AND WEALTH 1 For further details see page 111. 2 Simple +: Simplified lending pathway for originated loans to customers below $5m TCE. 3 Netflows have been adjusted to remove benefit payments from pension accounts; including benefit payments BT Panorama net flows were $1.4bn for the 6 months to Mar-25. DOWN 5% Key financial metrics ex Notable Items 1H24 2H24 1H25 Change on 2H24 Return on average tangible equity (%) 20.6 20.3 18.7 (161 bps) Expense to income (%) 41.5 44.0 44.2 19 bps Net interest margin (%) 5.34 5.37 5.09 (28 bps) Average interest-earning assets ($bn) 98.0 101.3 106.2 5% Pre-provision profit ($m) 1,769 1,741 1,725 (1%) Customer deposit to loan ratio (%) 145.1 141.5 138.7 (274 bps) Stressed exposures to TCE (%) 5.52 5.56 5.26 (30 bps) Key operating metrics 1H24 2H24 1H25 Change on 2H24 Digital sales1 (%) 34.6 35.0 39.0 399 bps Business lending time to decision (days) 7.7 9.0 8.0 (1.0) Simple+ originated loans (#)2 1,221 2,020 2,403 19% Net loans ex. Auto ($bn) 94.0 100.0 106.8 7% Deposits ($bn) 140.6 144.3 148.2 3% Net flows excluding benefit payments on BT Panorama ($m)3 1,952 3,146 3,364 7% Westpac Group 2025 Interim Results Presentation & Investor Discussion Pack AIEA up 5%, NIM decreased 28bps, including one-off remediation provision release in 2H24 Step up in UNITE offset by lower litigation and restructuring costs Increase in overlays and downside scenario weight |
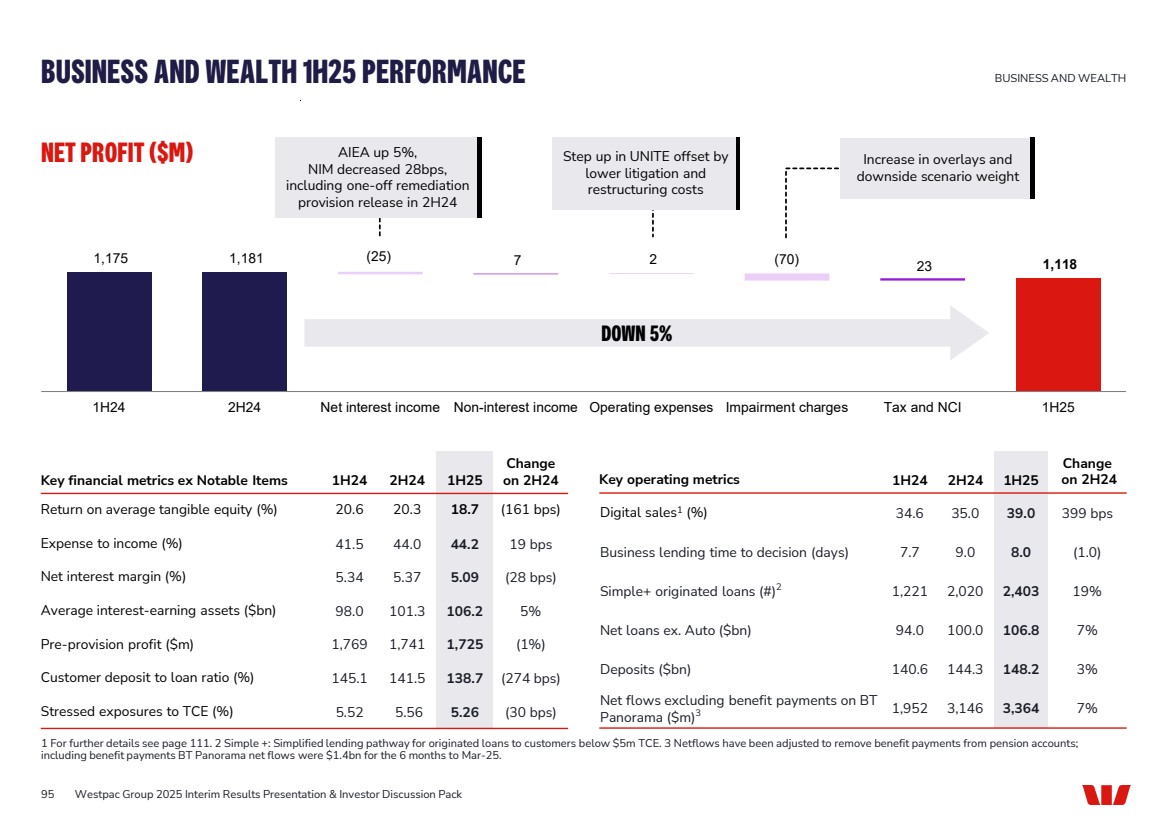
| 96 AVERAGE FUA PER ACCOUNT ON BT PANORAMA ($’000) 429 447 465 496 524 1H23 2H23 1H24 2H24 1H25 MANAGED ACCOUNTS FUA ON BT PANORAMA ($M) 13,675 15,492 18,683 21,294 23,586 Mar-23 Sep-23 Mar-24 Sep-24 Mar-25 FUA ON BT PANORAMA ($M) NET FLOWS EXCLUDING BENEFIT PAYMENTS3 ON BT PANORAMA ($M) 1,020 1,690 1,952 3,146 3,364 Mar-23 Sep-23 Mar-24 Sep-24 Mar-25 BT PANORAMA BUSINESS AND WEALTH 1 Australian Wealth Management Awards (May 24). 2 Investment Trends Adviser Tech Needs Report (June 24). 3 Represents benefit payments from pension accounts; including benefit payments BT Panorama net flows were $1.4bn for the 6 months to Mar-25. 4 Investment Trends Platform Competitive Analysis & Benchmarking Report (released Feb’ 25). Best Client Portal seventh consecutive year (2018 – 2024) and Best Mobile App six years (2018, 2019, 2020, 2021, 2022 and 2024). 5 Activam Impact awards (Sep’ 24). See https://www.bt.com.au/about-bt/bt-financial-group/overview/awards.html for more awards. UP 26% UP 11% UP 13% UP 6% UP 72% UP 7% Westpac Group 2025 Interim Results Presentation & Investor Discussion Pack Winner of Platform of the Year Award1 Winner of Best Client Portal and Mobile App4 Winner of Adviser Satisfaction with Mobile Access for Clients: Wrap Platform2 Winner of Managed Accounts (SMA/MDA) Offering of the Year – BT Managed Accounts5 102,068 102,872 113,328 118,593 120,501 Mar-23 Sep-23 Mar-24 Sep-24 Mar-25 UP 6% UP 2% |
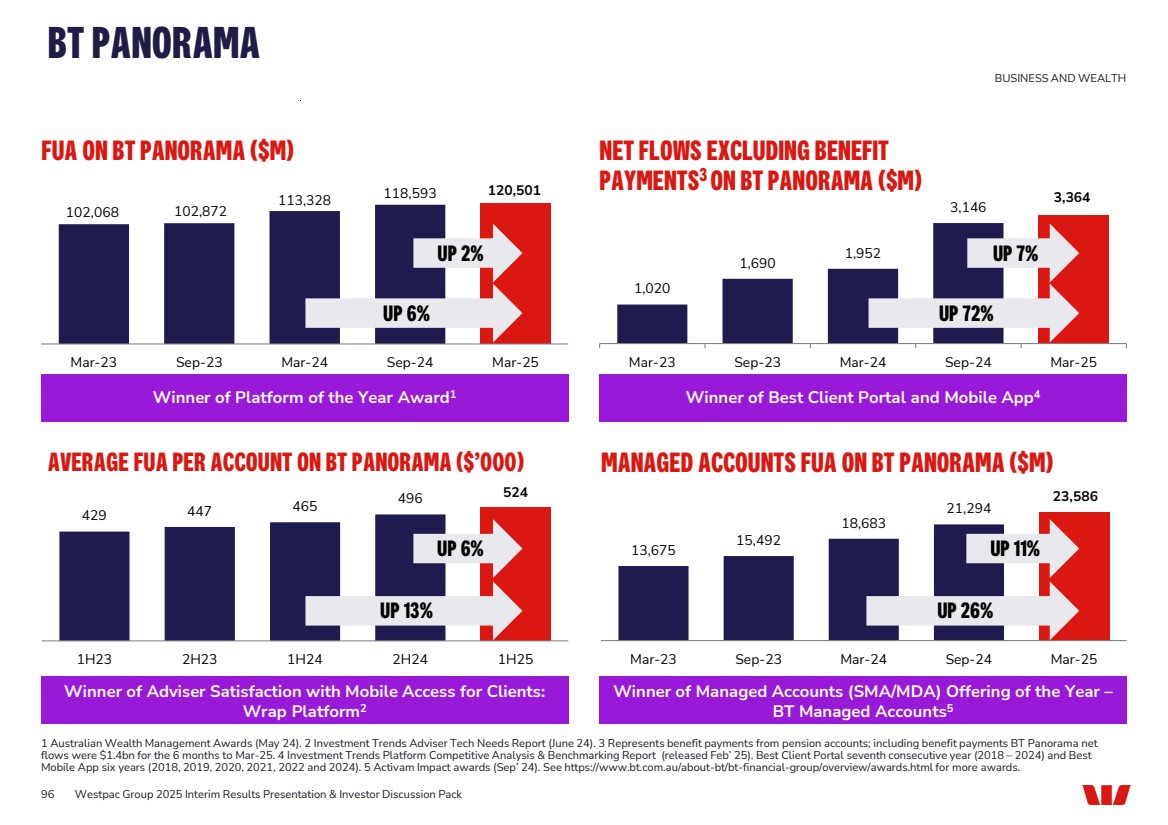
| 681 686 27 20 58 2 758 (35) 1H24 2H24 Net interest income Non-interest income Operating expenses Impairment charges Tax and NCI 1H25 97 NET PROFIT ($M) Key financial metrics ex Notable Items 1H24 2H24 1H25 Change on 2H24 Return on average tangible equity (%) 14.3 14.1 14.7 64 bps Net interest margin (%) 1.85 1.82 1.76 (6 bps) Expense to income ratio (%) 40.4 43.2 44.0 82 bps Average interest-earning assets ($bn) 117.9 126.6 134.2 6% Pre-provision profit ($m) 1,047 993 1,005 1% Customer deposit to loan ratio (%) 124.0 119.1 114.4 (475bps) Stressed exposures to TCE (%) 0.63 0.76 0.78 2 bps Key operating metrics 1H24 2H24 1H25 Change on 2H24 Net interest margin ex. Markets (%) 2.08 2.13 2.02 (11 bps) Net loans ($bn) 93.0 100.6 107.0 6% Customer Deposits ($bn) 115.3 119.8 122.3 2% Lending and deposit revenue ($m) 1,272 1,289 1,296 1% Sales and risk management income ($m) 455 391 421 8% INSTITUTIONAL 1H25 PERFORMANCE WESTPAC INSTITUTIONAL BANK AIEA up 6%, NIM ex. Markets down 11bps Higher salaries, wages and technology investment UP 10% Westpac Group 2025 Interim Results Presentation & Investor Discussion Pack Higher fee income from underwriting activity and higher sales and risk management income from FX |
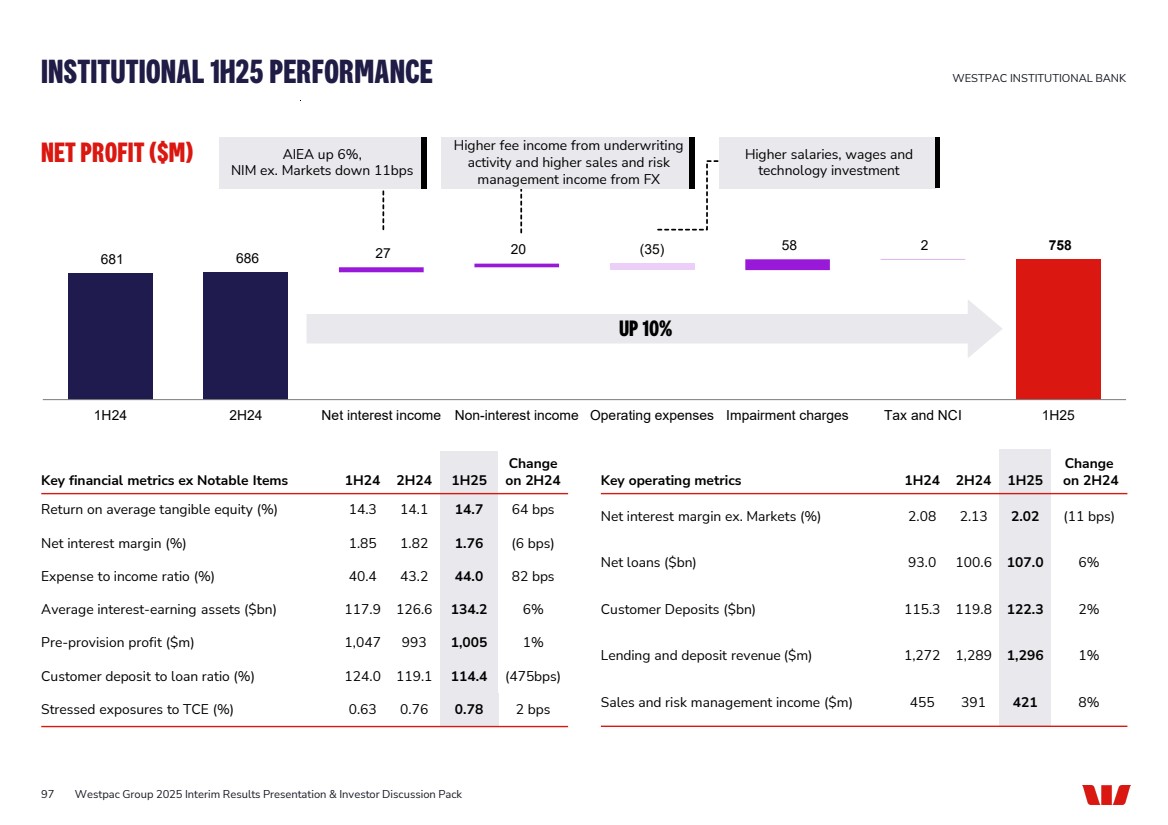
| 477 578 35 16 525 (15) (60) (29) 1H24 2H24 Net interest income Non-interest income Operating expenses Impairment charges Tax and NCI 1H25 98 NET PROFIT ($M) NEW ZEALAND 1H25 PERFORMANCE1 NEW ZEALAND 1 In NZ$ unless otherwise noted. 2 Digital active customers have been restated due to a change in definition. AIEA up 2%, NIM up 3bps Higher staff and technology costs, including software amortisation and investment spend Key financial metrics ex Notable Items 1H24 2H24 1H25 Change on 2H24 Return on average tangible equity (%) 11.9 14.1 12.5 (162 bps) Expense to income (%) 50.0 45.5 49.0 346 bps Net interest margin (%) 2.11 2.23 2.26 3 bps Average interest-earning assets ($bn) 119 119 121 2% Pre-provision profit (NZ$m) 694 806 764 (5%) Stressed exposures to TCE (%) 1.55 1.73 1.63 (10 bps) Mortgage 90+ day delinquencies (%) 0.47 0.49 0.54 5 bps Key operating metrics Mar-24 Sep-24 Mar-25 Change Sep-24 Net loans (NZ$bn) 100.8 102.1 103.2 1% Customer Deposits (NZ$bn) 78.8 79.7 80.9 2% Customer deposit to loan ratio (%) 78.2 78.1 78.4 33 bps Customers (#m) 1.51 1.51 1.51 - Digital active customers (#m)2 0.83 0.84 0.85 1% Branches (#) 112 106 106 - ATMs (#) 407 385 374 (11) Westpac Group 2025 Interim Results Presentation & Investor Discussion Pack DOWN 9% Charts may not add due to rounding Increase in downside scenario weight and weaker economic projections |
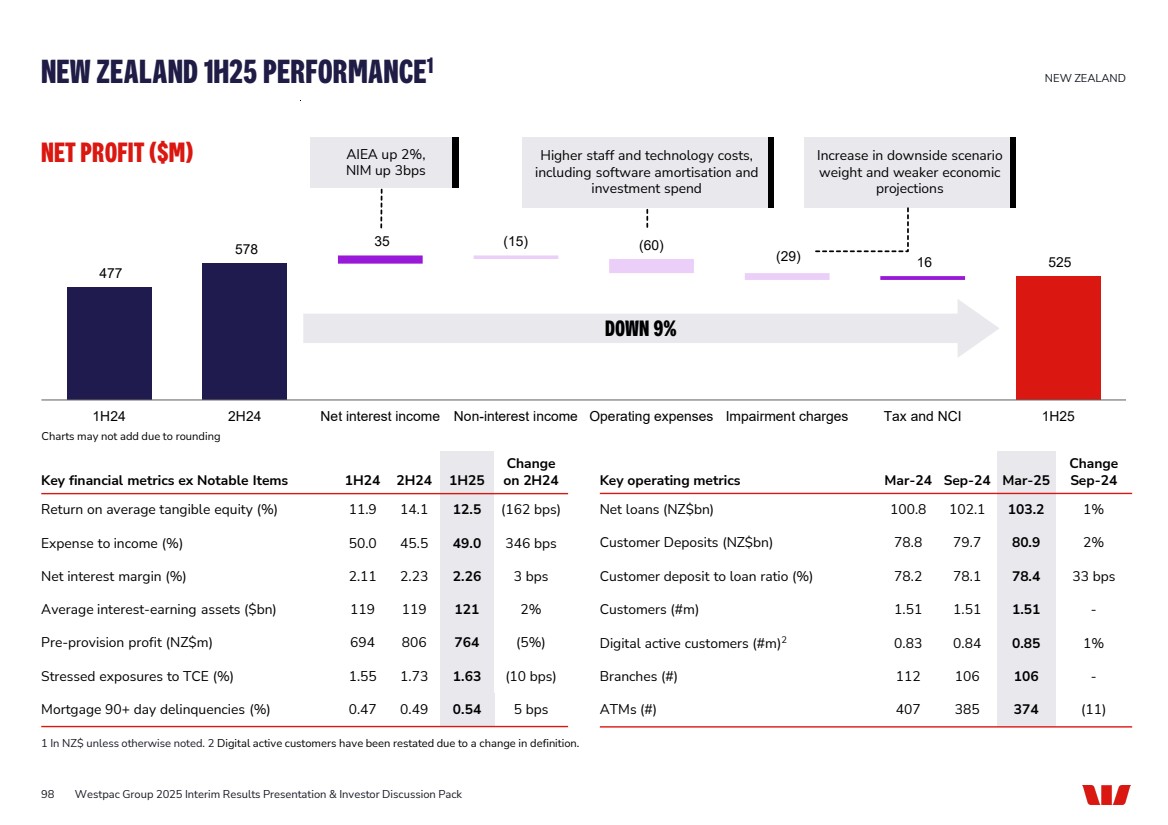
| 39 38 40 39 20 20 19 21 21 21 21 21 80 79 80 81 Sep-23 Mar-24 Sep-24 Mar-25 Term deposits Savings Transaction 100.8 102.1 1.5 (0.4) 103.2 1H24 2H24 Consumer Business 1H25 78.8 79.7 1.1 0.1 80.9 1H24 2H24 Consumer Business 1H25 22% 59% 19% 99 NET LOANS CUSTOMER DEPOSITS LOANS % OF TOTAL 66 67 68 69 1 1 1 1.2 33 33 33 33 Sep-23 Mar-24 Sep-24 Mar-25 Mortgage Personal Business CUSTOMER DEPOSITS AND % OF TOTAL NEW ZEALAND BALANCE SHEET1 NEW ZEALAND 99 101 102 UP 1% UP 2% 103 1% 67% 32% Household Business Institutional 1 In NZ$ unless otherwise noted. Westpac Group 2025 Interim Results Presentation & Investor Discussion Pack |
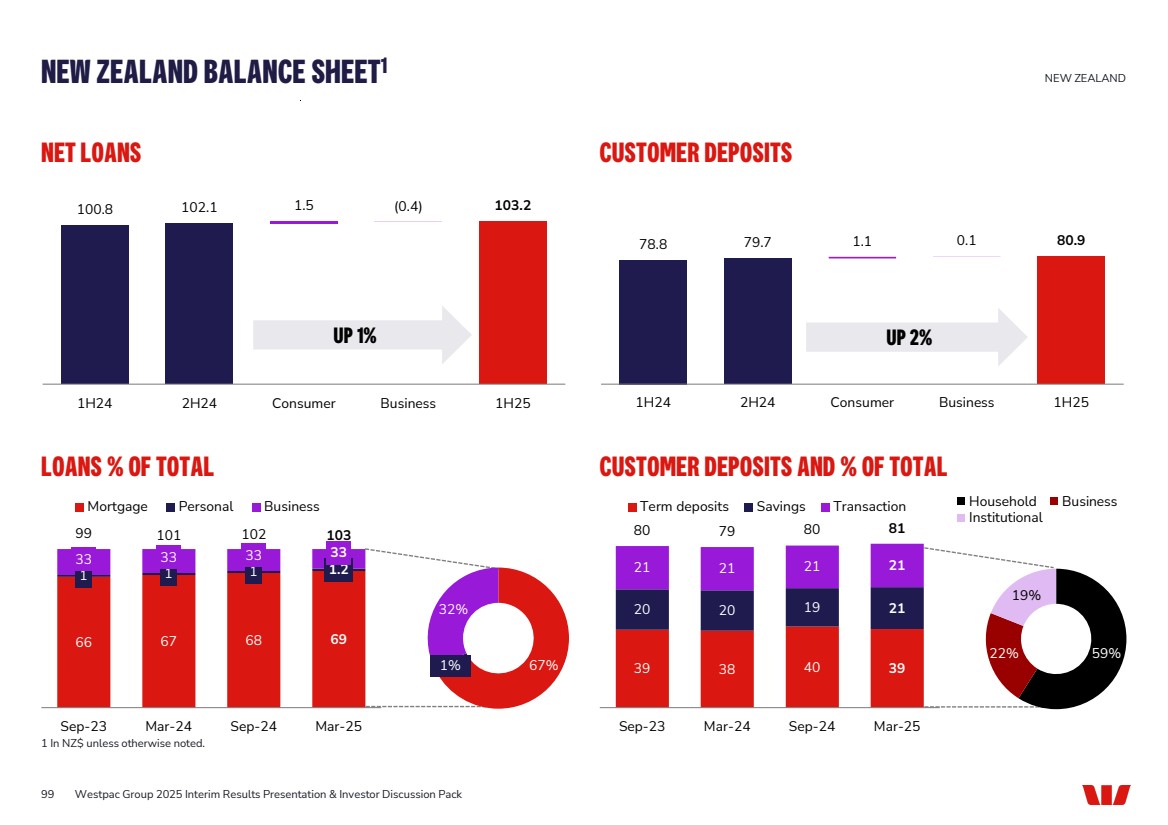
| ECONOMICS |

| 101 KEY ECONOMIC INDICATORS 2024 2025 Calendar Years Q2 Q3 Q4 Q1E Q2F Q3F Q4F 2023 2024 2025F 2026F World GDP1 - - - - - - - 3.2 3.3 2.9 3.0 Australia GDP2 1.0 0.8 1.3 1.5 1.7 2.0 1.9 1.5 1.2 1.9 2.2 Unemployment – end period 4.1 4.1 4.0 4.1 4.2 4.4 4.5 3.9 4.0 4.5 4.5 CPI headline – year end 3.8 2.8 2.4 2.4 1.9 2.6 3.1 4.1 2.4 3.1 2.7 Interest rates – cash rate 4.35 4.35 4.35 4.35 3.85 3.60 3.35 4.35 4.35 3.35 3.35 New Zealand GDP2 -0.5 -1.6 -1.1 -1.1 0.4 2.3 2.6 0.9 -1.1 2.6 3.0 Unemployment – end period 4.6 4.8 5.1 5.3 5.4 5.4 5.3 4.0 5.1 5.3 4.6 Consumer prices 3.3 2.2 2.2 2.5 2.4 2.7 2.8 4.7 2.2 2.8 2.0 Interest rates – official cash rate 5.50 5.25 4.25 3.75 3.25 3.25 3.25 5.50 4.25 3.25 3.75 KEY ECONOMIC INDICATORS 2023 2024 2025F 2026F Australia Credit growth Total – year end 4.8 6.5 5.5 6.1 Housing – year end 4.2 5.5 5.3 5.6 Business – year end 6.5 8.9 6.4 7.6 New Zealand Credit growth Total – year end 2.2 3.1 4.2 5.3 Housing – year end 3.0 3.8 5.7 6.1 Business – year end 0.6 2.1 1.8 4.0 PRIVATE SECTOR CREDIT GROWTH (% ANN) AUSTRALIAN AND NEW ZEALAND ECONOMIC FORECASTS – (%) AS AT 2 MAY 2025 ECONOMICS Sources: RBA, Statistics NZ, Westpac Economics. 1 Year average growth rates. 2 Through the year growth rates. Sources: RBA, Westpac Economics. Sources: IMF, RBA, Statistics NZ, Westpac Economics -8 -4 0 4 8 12 16 Mar-11 Mar-13 Mar-15 Mar-17 Mar-19 Mar-21 Mar-23 Mar-25 Total credit Australia Housing Australia Business Australia Total credit New Zealand Westpac f’casts % ann Westpac Group 2025 Interim Results Presentation & Investor Discussion Pack |
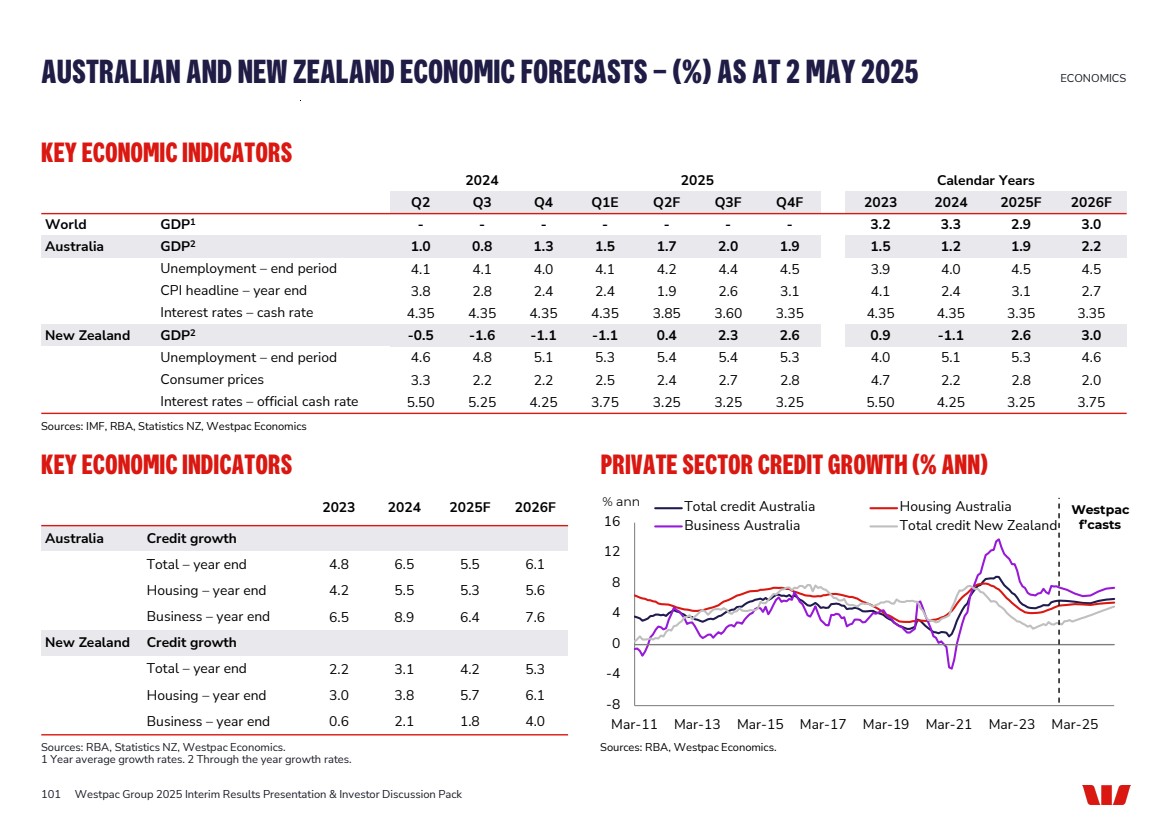
| -20 -15 -10 -5 0 5 10 15 20 25 30 35 40 Apr-17 Apr-18 Apr-19 Apr-20 Apr-21 Apr-22 Apr-23 Apr-24 Apr-25 Apr-26 % rate cuts rate hikes Macro-prudential measures 2019 election COVID-19 ‘Delta’ Macro-prudential measures 102 DWELLING PRICES (%, 3 MONTH ANNUALISED) DWELLING PRICES (%) – (TO APR-25) Capital city Pop’n Last 3 mths Last 12 mths Last 5 years Sydney 5.5m Up 1.0% Up 0.9% Up 29.7% Melbourne 5.2m Up 1.0% Down 2.2% Up 10.5% Brisbane 2.7m Up 1.0% Up 7.8% Up 71.1% Perth 2.3m Up 0.7% Up 10.0% Up 77.2% DWELLING PRICES (ANNUAL %) Capital city Avg* 2022 2023 2024 2025F 2026F Sydney 5.4 -11.4 11.3 2.3 3 6 Melbourne 4.0 -7.1 4.2 –2.9 1 8 Brisbane 6.7 –1.9 13.5 11.2 3 6 Perth 4.5 4.2 16.2 18.5 4 6 Australia 5.2 -6.6 10.1 4.7 3 7 AUSTRALIAN HOUSING MARKET – PRICES UPTURN MODERATES ECONOMICS Sources: CoreLogic, Westpac Economics * Average last 10yrs. Sources: CoreLogic, Westpac Economics Westpac Group 2025 Interim Results Presentation & Investor Discussion Pack Sources: CoreLogic, Westpac Economics |

| 103 MONTHLY HOUSE SALES AND PRICES (% YR) -20 -10 0 10 20 30 40 0 2,000 4,000 6,000 8,000 10,000 12,000 14,000 2004 2007 2010 2013 2016 2019 2022 Sales %YR Sales (lhs) House prices (rhs) DWELLING PRICES (INDEX) 750 1250 1750 2250 2750 750 1250 1750 2250 2750 2007 2009 2011 2013 2015 2017 2019 2021 2023 2025 Auckland Canterbury Wellington Other regions Index Index DWELLING PRICES -20 -10 0 10 20 30 40 0 500 1000 1500 2000 2500 3000 2010 2012 2014 2016 2018 2020 2022 2024 Annual growth (right axis) Level (left axis) DWELLING PRICES (%) – (TO MAR-25) Capital city Pop’n Last 3 mths Last 12 mths Last 5 years Auckland 1.8m Up 1% Down 2% Up 12% Wellington 0.6m Flat Down 3% Up 10% Canterbury 0.7m Up 1% Up 1% Up 47% Nationwide 5.3m Up 1% Down 1% Up 22% NEW ZEALAND HOUSING MARKET – ACTIVITY HAS STABILISED, STILL SUBDUED ECONOMICS Sources: REINZ, Westpac Economics. Sources: CoreLogic, REINZ, Westpac Economics. Source: REINZ Sources: REINZ, Westpac Economics Forecast (Annual %) Ave. past 10 years 2022 2023 2024 2025F 2026F Nationwide 7% -13% -1% -1% +6% +6% %YR Westpac forecasts Index = 1000 in 2010 Westpac Group 2025 Interim Results Presentation & Investor Discussion Pack |
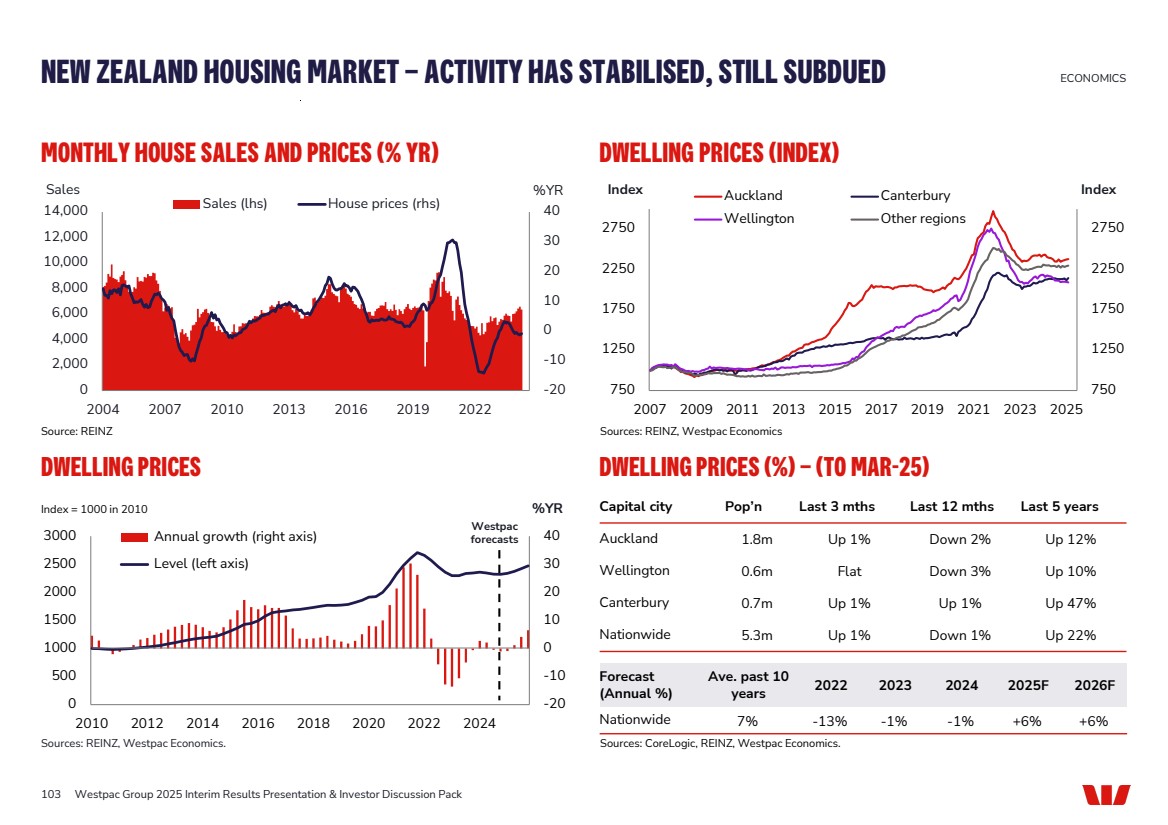
| 2023 2024 2025 104 AVERAGE QUARTERLY SPEND PER PERSON (%) Westpac Group 2025 Interim Results Presentation & Investor Discussion Pack CONSUMER CUSTOMER SPEND AND BUFFERS1 1 Source: Westpac DataX, Westpac Economics. 2 Mortgage holders only. Essential expenses includes food, bills and minimum mortgage repayments. 104 2022 -1 0 1 2 3 4 5 Q1 Q2 Q3 Q4 Q1 Q2 Q3 Q4 Q1 Q2 Q3 Q4 Q1 + 1 S.D CONTRIBUTION TO ANNUAL CHANGE IN BUFFERS2 (4) (2) - 2 4 Jan-22 Jul-22 Jan-23 Jul-23 Jan-24 Jul-24 Jan-25 Essential expenses Buffers Q1 Consumer spending growth of 0.9% in in line with price growth – real spend, flat Buffers starting to rebuild as inflationary pressures ease and mortgage payments reduce - 1 S.D No. months Buffers built with mortgage payments low, savings high Customers utilised buffers due to rise in interest rates and inflationary pressures |
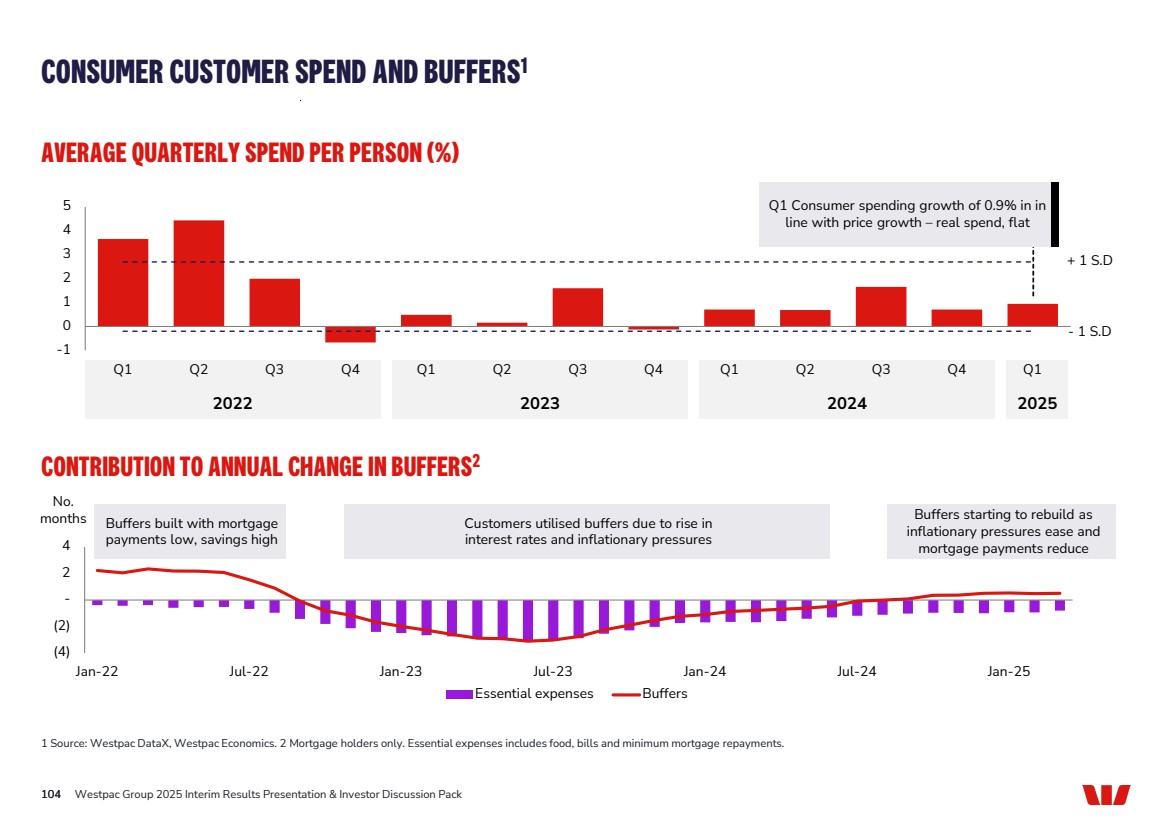
| 2022 2023 2024 -10 -5 0 5 10 Q1 Q2 Q3 Q4 Q1 Q2 Q3 Q4 Q1 Q2 Q3 Q4 Deviation from the rolling 6-month average (ppts) 105 CASHFLOW TRENDS Westpac Group 2025 Interim Results Presentation & Investor Discussion Pack BUSINESS CUSTOMER CASHFLOW CONDITIONS IMPROVING 1 Source: Westpac Economics, Macrobond. 105 SME Commercial Commercial continues to improve SME remains challenged but showing signs of improvement CASHFLOW GAUGE (INCOME TO EXPENSE) 2022 2023 2024 (15) (10) (5) - 5 10 Q1 Q2 Q3 Q4 Q1 Q2 Q3 Q4 Q1 Q2 Q3 Q4 Expenses Income Total Excluding debt servicing payments, contribution to annual % change Improvement in income to expense ratio Deterioration in income to expense ratio |
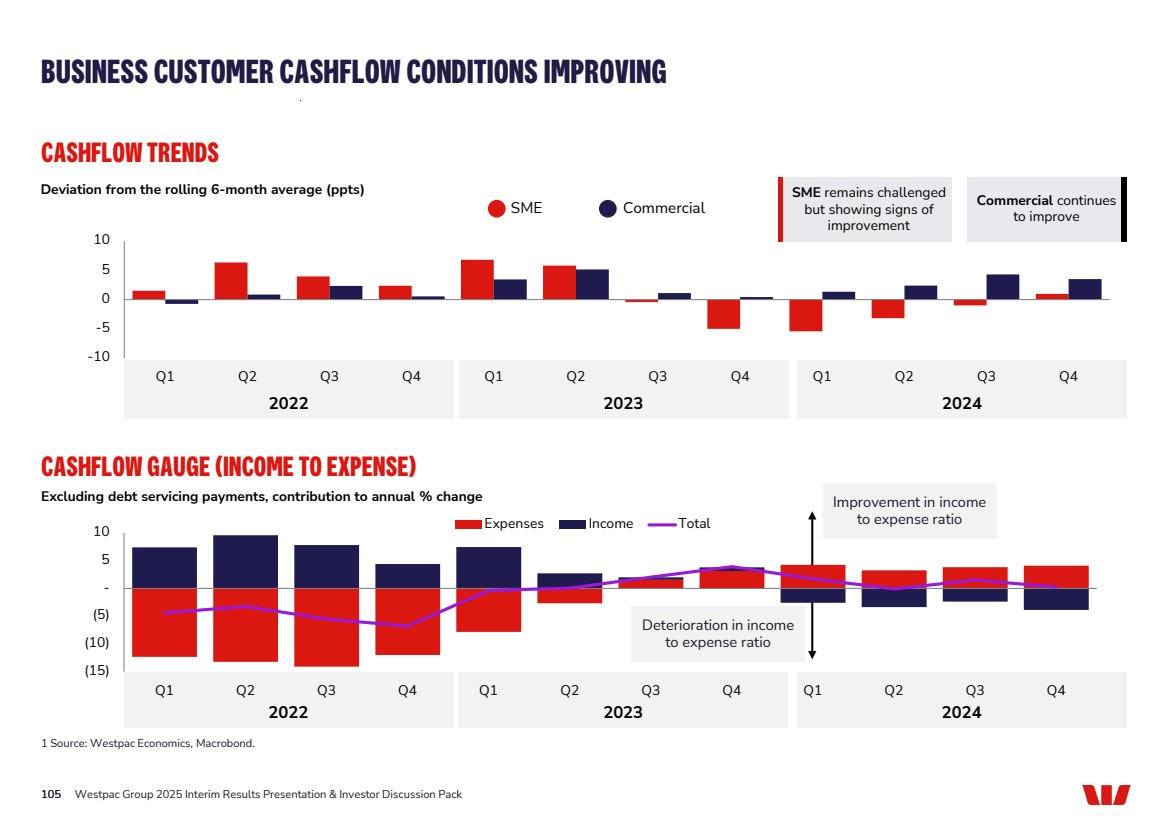
| APPENDIX |

| APPENDIX 1: NET PROFIT EX NOTABLE ITEMS1 107 $m 1H24 2H24 1H25 Change 1H25 – 2H24 (%) Net interest income 9,351 9,565 9,569 - Non-interest income 1,465 1,382 1,424 3% Net operating income 10,816 10,947 10,993 - Expenses (5,395) (5,549) (5,698) 3% Pre-provision profit 5,421 5,398 5,295 (2%) Impairment charges (362) (175) (250) 43% Tax and non-controlling interests (NCI) (1,553) (1,616) (1,588) (2%) Net profit 3,506 3,607 3,457 (4%) APPENDIX 1 For further information refer to Westpac’s 2025 Interim Results Announcement. Westpac Group 2025 Interim Results Presentation & Investor Discussion Pack |
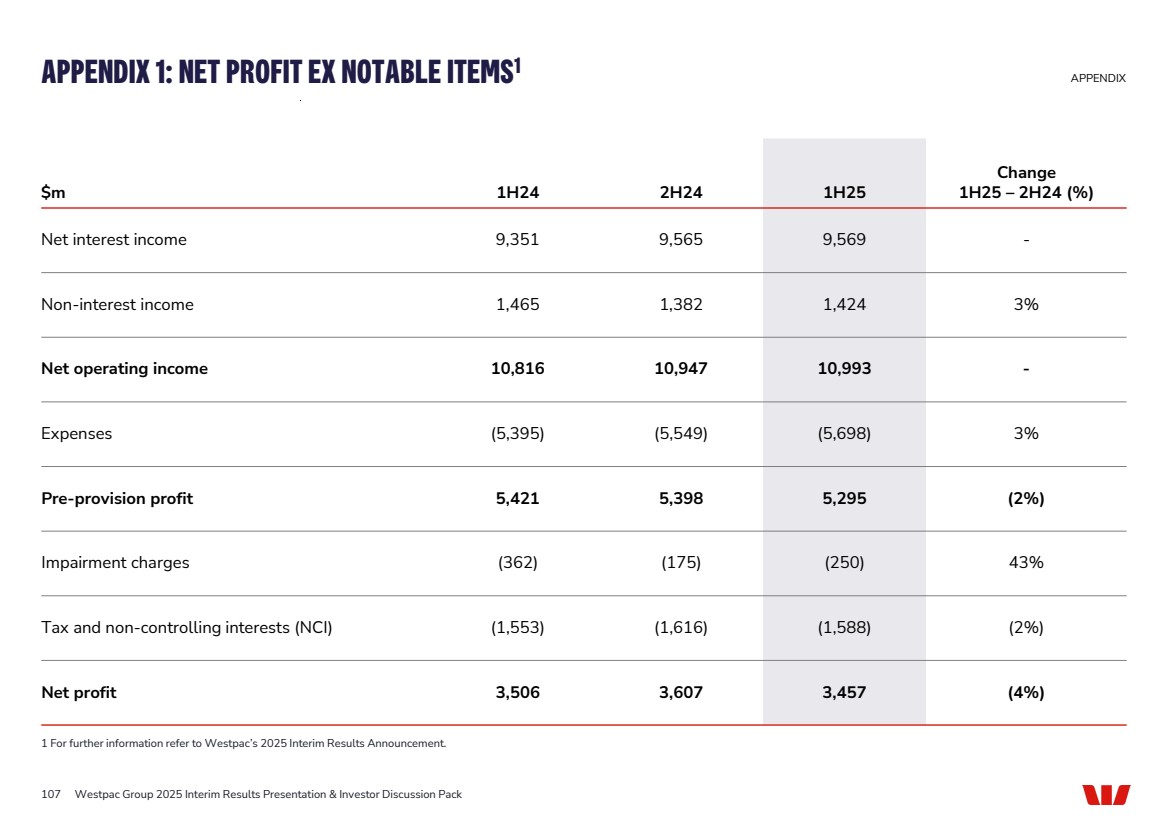
| ($m) Net profit after tax Hedging Notable Items Net profit excluding hedging Notable Items2 Other Notable Items3 Net profit excluding Notable Items4 2H24 Net profit excluding Notable Items % change 1H25-2H24 Net interest income 9,351 (218) 9,569 - 9,569 9,565 Flat Non-interest income 1,442 18 1,424 - 1,424 1,382 3% Net operating income 10,793 (200) 10,993 - 10,993 10,947 Flat Expenses (5,698) - (5,698) - (5,698) (5,549) 3% Pre-provision profit 5,095 (200) 5,295 - 5,295 5,398 (2%) Impairment charges (250) - (250) - (250) (175) 43% Tax and non-controlling interests (NCI) (1,528) 60 (1,588) - (1,588) (1,616) (2%) Net profit 3,317 (140) 3,457 - 3,457 3,607 (4%) APPENDIX 2: 1H25 NOTABLE ITEMS1 APPENDIX 1 For further information refer to Westpac’s 2025 Interim Results Announcement. 2 Referred to as Cash earnings in previous periods. 3 Other Notable Items include provisions for remediation, litigation, fines and penalties; impact from asset sales and revaluations; asset write-downs and restructuring costs. 4 Referred to as Cash earnings excluding Notable Items in previous periods. 108 Westpac Group 2025 Interim Results Presentation & Investor Discussion Pack |
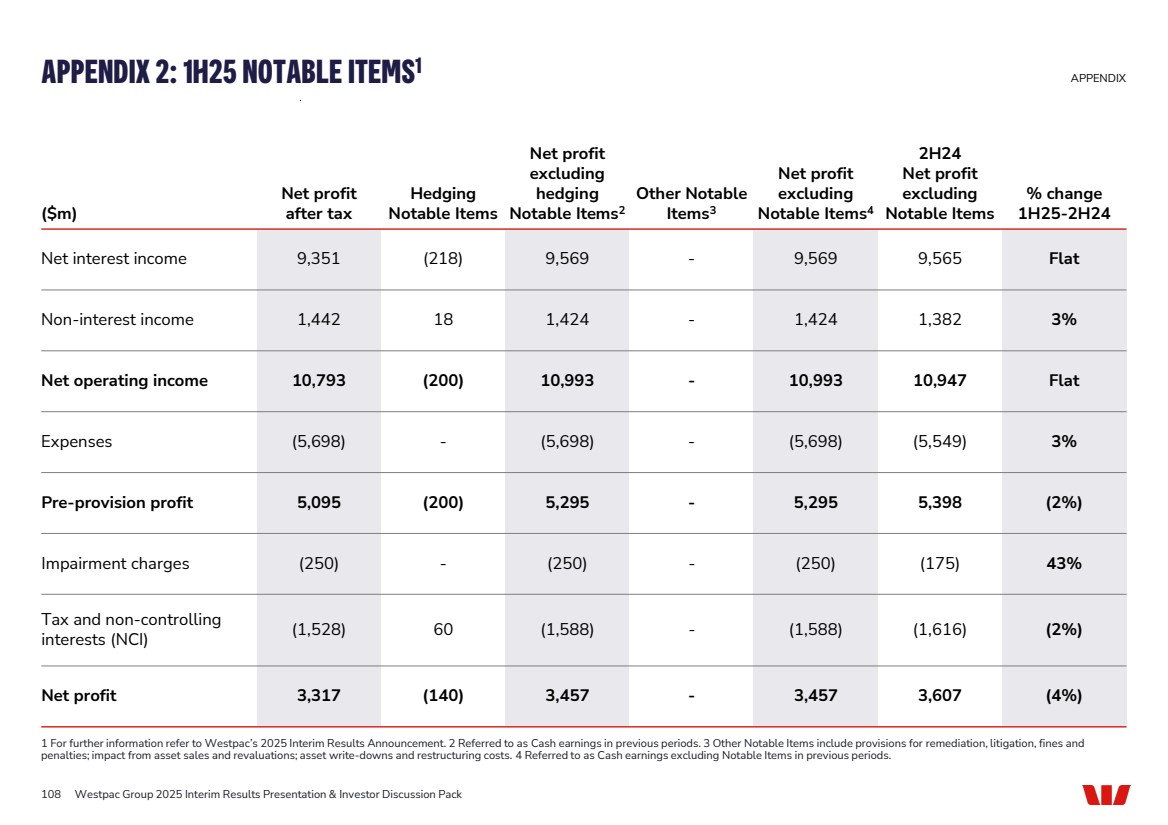
| Impaired exposures Includes exposures that have deteriorated to the point where full collection of interest and principal is in doubt, based on an assessment of the customer’s outlook, cash flow, and the net realisation of value of assets to which recourse is held: • Facilities 90 days or more past due, and full recovery is in doubt: exposures where contractual payments are 90 or more days in arrears and the net realisable value of assets to which recourse is held may not be sufficient to allow full collection of interest and principal, including overdrafts or other revolving facilities that remain continuously outside approved limits by material amounts for 90 or more calendar days; • Non-accrual facilities: exposures with individually assessed impairment provisions held against them, excluding restructured loans; • Restructured facilities: exposures where the original contractual terms have been formally modified to provide for concessions of interest or principal for reasons related to the financial difficulties of the customer; • Other assets acquired through security enforcement (includes other real estate owned): includes the value of any other assets acquired as full or partial settlement of outstanding obligations through the enforcement of security arrangements; or • Any other facilities where the full collection of interest and principal is in doubt. Stressed exposures Watchlist and substandard, non-performing not impaired, and impaired exposures Total committed exposures (TCE) Represents the sum of the committed portion of direct lending (including funds placement overall and deposits placed), contingent and pre-settlement risk plus the committed portion of secondary market trading and underwriting risk Watchlist and substandard Loan facilities where customers are experiencing operating weakness and financial difficulty but are not expected to incur loss of interest or principal <90 days past due Includes facilities less than 90 days past due and those credit exposures, that are in default, but where it is expected that the full value of principal and accrued interest can be collected, generally by reference to the value of security held 90+ days past due Includes facilities 90 days or more past due, and those credit exposures that are in default, but where it is expected that the full value of principal and accrued interest can be collected, generally by reference to the value of security held Provision for expected credit losses Expected credit losses (ECL) are a probability-weighted estimate of the cash shortfalls expected to result from defaults over the relevant time frame. They are determined by evaluating a range of possible outcomes and taking into account the time value of money, past events, current conditions and forecasts of future economic conditions Collectively assessed provisions (CAP) CAP for ECL under AASB 9 represent the ECL which is collectively assessed in pools of similar assets with similar risk characteristics. This incorporates forward looking information and does not require an actual loss event to have occurred for an impairment provision to be recognised Individually assessed provisions (IAP) Provisions raised for losses on loans that are known to be impaired and are assessed on an individual basis. The estimated losses on these impaired loans is based on expected future cash flows discounted to their present value and, as this discount unwinds, interest will be recognised in the income statement Stage 1: 12 months ECL – performing For financial assets where there has been no significant increase in credit risk since origination a provision for 12 months ECL is recognised. Interest revenue is calculated on the gross carrying amount of the financial asset Stage 2: Lifetime ECL – performing For financial assets where there has been a significant increase in credit risk since origination but where the asset is still performing a provision for lifetime ECL is recognised. Interest revenue is calculated on the gross carrying amount of the financial asset Stage 3 Lifetime ECL – non-performing For financial assets that are non-performing a provision for lifetime ECL is recognised. Interest revenue is calculated on the carrying amount net of the provision for ECL rather than the gross carrying amount APPENDIX 3: DEFINITIONS – CREDIT QUALITY 109 Westpac Group 2025 Interim Results Presentation & Investor Discussion Pack APPENDIX |
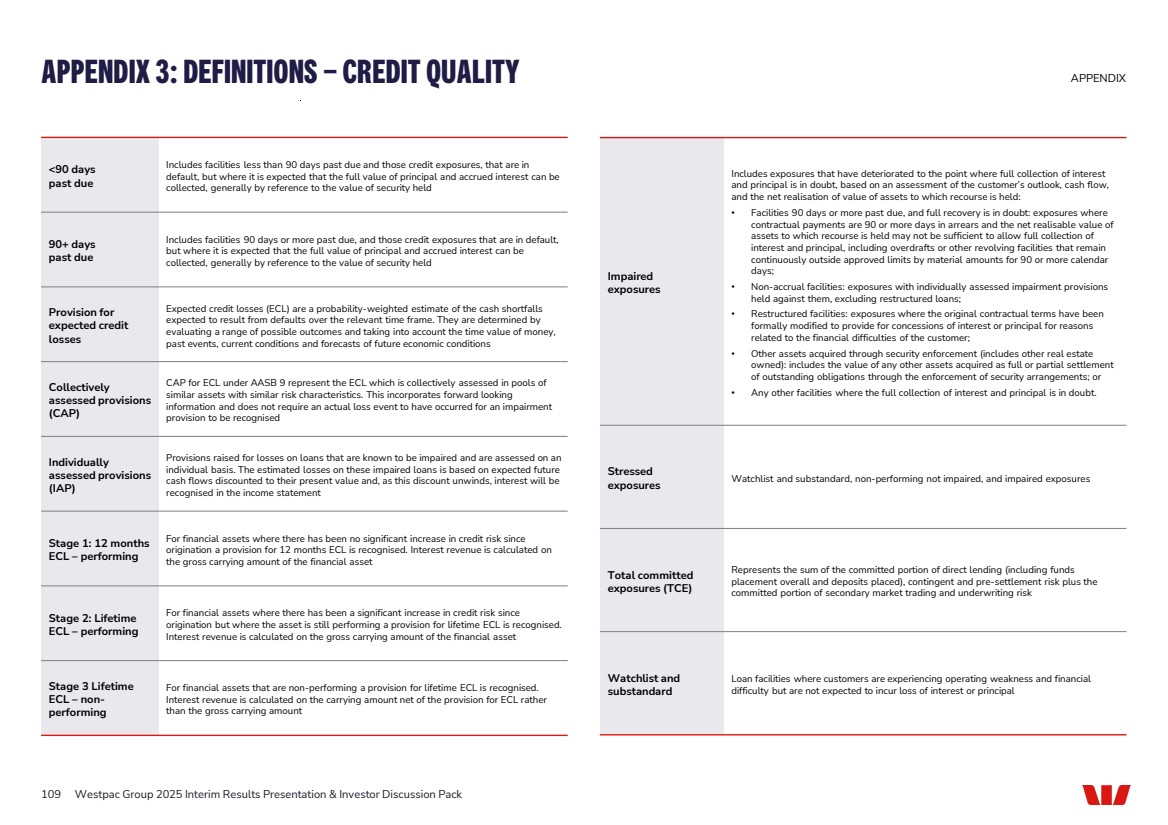
| SEGMENTS Consumer Consumer provides banking products and services, including mortgages, credit cards, personal loans, and savings and deposit products to Australian retail customers Business and Wealth Business and Wealth serves the banking and wealth needs of Australian customers, including small business, Agribusiness and Commercial businesses WIB Westpac Institutional Bank (WIB) provides a broad range of financial products and services to corporate, institutional and government customers Westpac NZ Westpac New Zealand provides banking, wealth and insurance products and services for consumer, business and institutional customers in New Zealand EARNINGS DRIVERS Average interest-earning assets (AIEA) The average balance of assets held by the Group that generate interest income. Where possible, daily balances are used to calculate the average balance Group net interest margin Calculated by dividing net interest income by average interest-earning assets (annualised where applicable) Core net interest margin Calculated by dividing net interest income excluding Notable Items and Treasury & Markets by average interest-earning assets (annualised where applicable) Pre-provision profit Net operating income less operating expenses NCI Non-controlling interests Full-time equivalent employees (FTE) A calculation based on the number of hours worked by full and part-time employees as part of their normal duties. For example, the full-time equivalent of one FTE is 76 hours paid work per fortnight CAPITAL AND LIQUIDITY Capital ratios As defined by APRA (unless stated otherwise) Committed liquidity facility (CLF) The RBA makes available to Australian Authorised Deposit-taking Institutions (ADIs) a CLF that, subject to qualifying conditions, can be accessed to meet LCR requirements under APS210 Liquidity. APRA announced in September 2021 that ADIs subject to the LCR should reduce their CLF usage to zero by 1 January 2023 High quality liquid assets (HQLA) Assets which meet APRA’s criteria for inclusion as HQLA in the numerator of the LCR Internationally comparable ratios Internationally comparable regulatory capital ratios are Westpac’s estimated ratios after adjusting the capital ratios determined under APRA Basel III regulations for various items. Analysis aligns with the APRA study titled “International capital comparison study” dated 13 July 2015 Leverage ratio As defined by APRA (unless stated otherwise). Tier 1 capital divided by ‘exposure measure’ and expressed as a percentage. ‘Exposure measure’ is the sum of on-balance sheet exposures, derivative exposures, securities financing transaction exposures and other off-balance sheet exposures Liquidity coverage ratio (LCR) An APRA requirement to maintain an adequate level of unencumbered high quality liquid assets, to meet liquidity needs for a 30 calendar day period under an APRA-defined severe stress scenario. Absent a situation of financial stress, the value of the LCR must not be less than 100%. LCR is calculated as the percentage ratio of stock of HQLA and CLF over the total net cash out-flows in a modelled 30 day defined stressed scenario Net stable funding ratio (NSFR) The NSFR is defined as the ratio of the amount of available stable funding (ASF) to the amount of required stable funding (RSF) defined by APRA. The amount of ASF is the portion of an ADI’s capital and liabilities expected to be a reliable source of funds over a one year time horizon. The amount of RSF is a function of the liquidity characteristics and residual maturities of an ADI’s assets and off-balance sheet activities. ADI’s must maintain an NSFR of at least 100% Risk weighted assets or RWA Assets (both on and off-balance sheet) are risk weighted according to each asset’s inherent potential for default and what the likely losses would be in case of default. In the case of non-asset-backed risks (ie. market and operational risk), RWA is determined by multiplying the capital requirements for those risks by 12.5 APPENDIX 3: DEFINITIONS – SEGMENTS, EARNINGS DRIVERS, CAPITAL AND LIQUIDITY 110 Westpac Group 2025 Interim Results Presentation & Investor Discussion Pack APPENDIX |
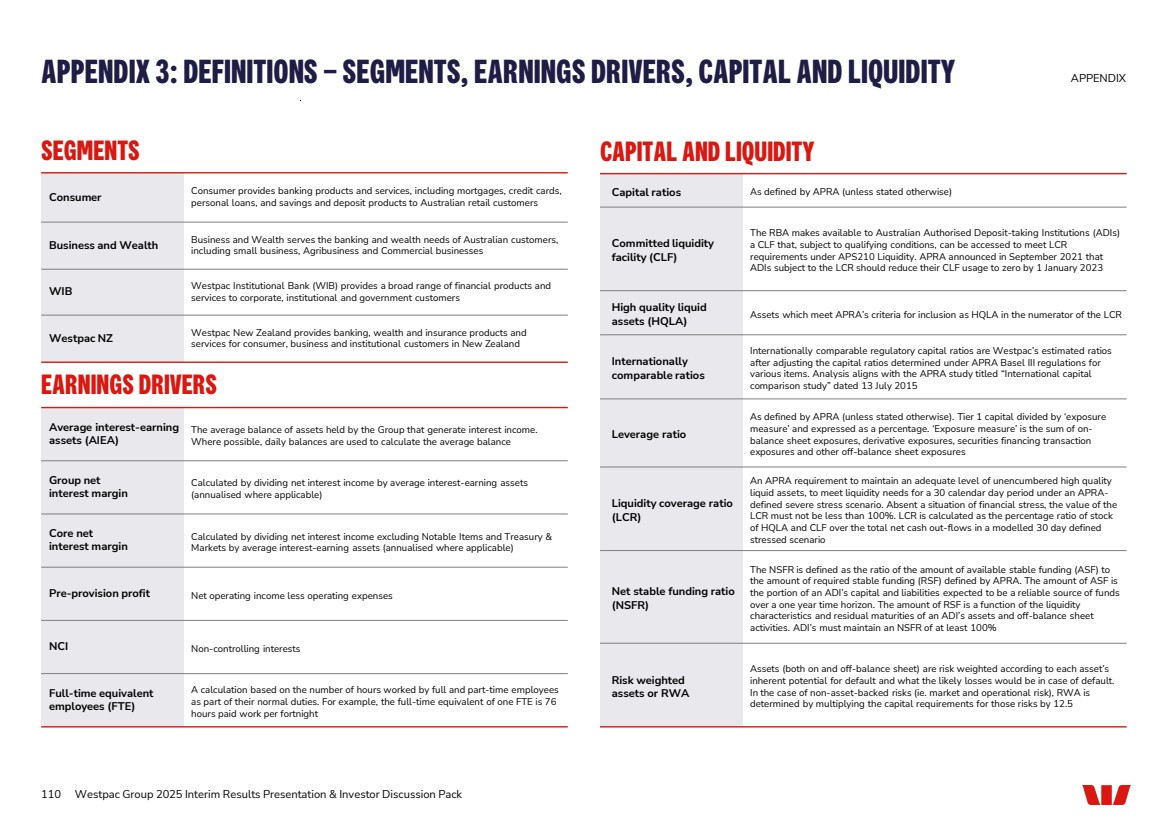
| Branch transactions Branch transactions are typically withdrawals, deposits, transfers and payments Customer satisfaction or CSAT The Customer Satisfaction score is an average of customer satisfaction ratings of the customer’s main financial institution for consumer or business banking on a scale of 0 to 10 (0 means ‘extremely dissatisfied’ and 10 means ‘extremely satisfied’) CSAT (Main Bank Service Satisfaction) (Westpac NZ) Source: 3 month rolling Retail Market Monitor data (survey conducted by Insights HQ, formerly Camorra Research). Respondents are asked to rate the overall level of service they receive from their main bank (self-selected which ONE bank is their main provider of financial services) on a scale of 1 (Poor) to 5 (Excellent). The rating represents % of respondents who scored 4 (Very Good) or 5 (Excellent) CSAT – overall consumer Source: RFI Consumer Atlas, March 2024 – March 2025, 6MMA. MFI customers CSAT – overall business Source: RFI Business Atlas, March 2024 – March 2025, 6MMA. MFI businesses Digitally active Australian consumer and business customers who have had an authenticated session (including Quickzone) on Westpac Group digital banking platforms in the prior 90 days Digital sales The percentage of quality sales that were digitally initiated in a 12-week period (percentage against the count of all quality sales in that 12-week period) Digital transactions Digital transactions including all payment transactions (Transfer Funds, Pay Anyone and BPAY) within Westpac Live and Compass, excl. Corporate Online and Business Banking online Mobile Wallet Payments Count of transactions that use a digital card via apple pay, fitbit pay, garmin pay, google pay and samsung pay products. MFI share MFI share results are based on the number of customers who have a Main Financial Institution (MFI) relationship with an institution, as a proportion of the number of customers that have a MFI relationship with any institution Consumer MFI share Source: Roy Morgan Single Source, March 2025, 6MMA. MFI Banking Group customers Net Promoter Score or NPS® Net Promoter® Score measures the net likelihood of recommendation to others of the customer’s main financial institution for retail or business banking. Net Promoter®, NPS®, NPS Prism®, and the NPS-related emoticons are registered trademarks of Bain & Company, Inc., NICE Systems, Inc., and Fred Reichheld. Net Promoter ScoreSM and Net Promoter SystemSM are service marks of Bain & Company, Inc., NICE Systems, Inc., and Fred Reichheld. Using an 11 point numerical scale where 10 is ‘Extremely likely’ and 0 is ‘Not at all likely’, Net Promoter Score is calculated by subtracting the percentage of Detractors (0- 6) from the percentage of Promoters (9-10) NPS® Consumer (Westpac NZ) Source: 3 month rolling Retail Market Monitor data (survey conducted by Insights HQ, formerly Camorra Research). Respondents are asked about likelihood to recommend their main bank to family and friends on a scale of 1 (extremely unlikely) to 10 (extremely likely). Net Promoter Score is represents % of Promoters (recommend score of 9 or 10) minus % of Detractors (recommend score of 1 to 6) NPS® – overall consumer Source: RFI Consumer Atlas, March 2024 – March 2025, 6MMA. MFI customers NPS® – overall business Source: RFI Business Atlas, March 2024 – March 2025, 6MMA. MFI businesses St.George brands (SGB) St.George Bank, Bank of Melbourne and BankSA Mortgage Product NPS® Mortgage Product NPS® measures the net likelihood of recommendation to others of the mortgage product via 1st party (direct with the provider) or 3rd party (through a broker). Source: 5D Strategic NPS Program, March 2023 – March 2025, 6MMA, Westpac AFI mortgage customers APPENDIX 3: DEFINITIONS – OTHER 111 Westpac Group 2025 Interim Results Presentation & Investor Discussion Pack APPENDIX |
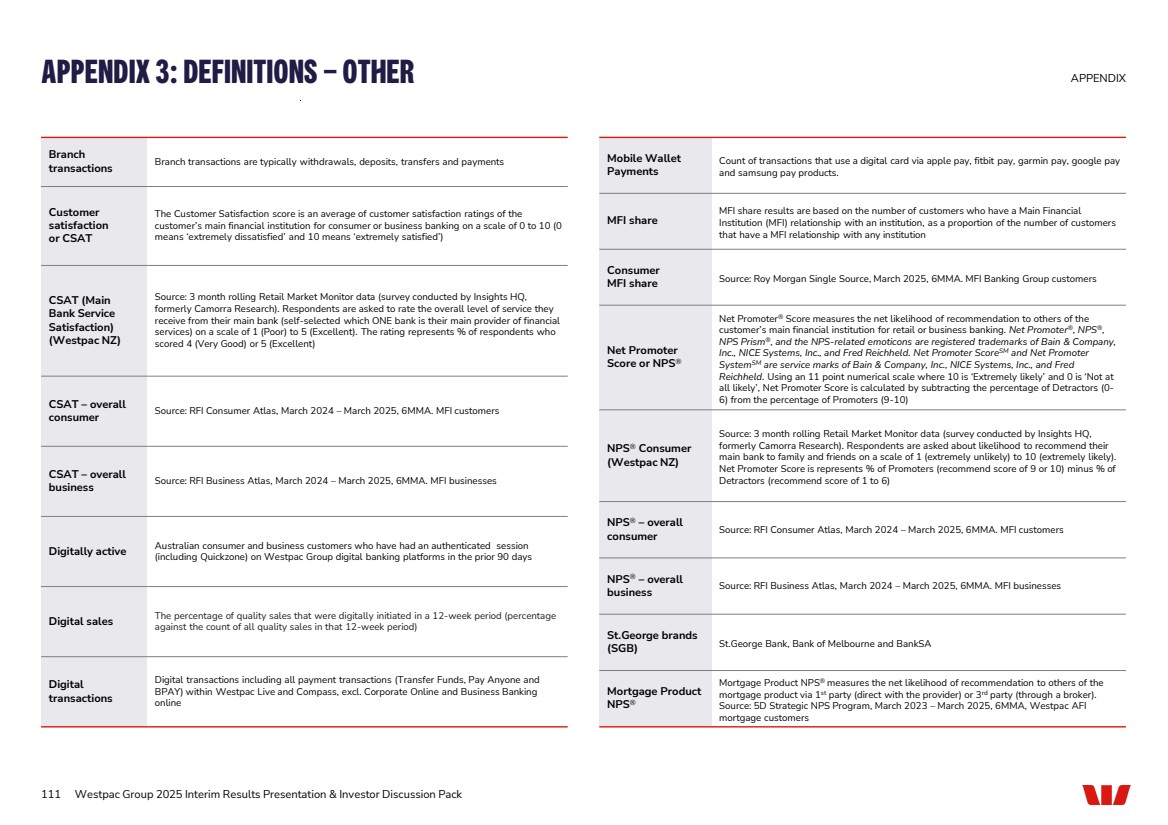
| INVESTOR RELATIONS TEAM – CONTACT US CONTACT US INVESTOR RELATIONS CONTACT SHARE REGISTRY CONTACT For all shareholding enquiries relating to: • Address details and communication preferences • Updating bank account details, and participation in the dividend reinvestment plan For all matters relating to Westpac’s strategy, performance and results 1800 804 255 westpac@cm.mpmas.mufg.com au.investorcentre.mpms.mufg.com +61 2 9178 2977 investorrelations@westpac.com.au westpac.com.au/investorcentre 112 Lucy Wilson Head of Corporate Reporting and ESG Catherine Garcia Head of Investor Relations, Institutional Arthur Petratos Manager, Shareholder Services Laura Babaic Graduate, Investor Relations Jacqueline Boddy Head of Debt Investor Relations Justin McCarthy General Manager, Investor Relations James Wibberley Manager, Investor Relations Nathan Fontyne Senior Analyst, Investor Relations Westpac Group 2025 Interim Results Presentation & Investor Discussion Pack |
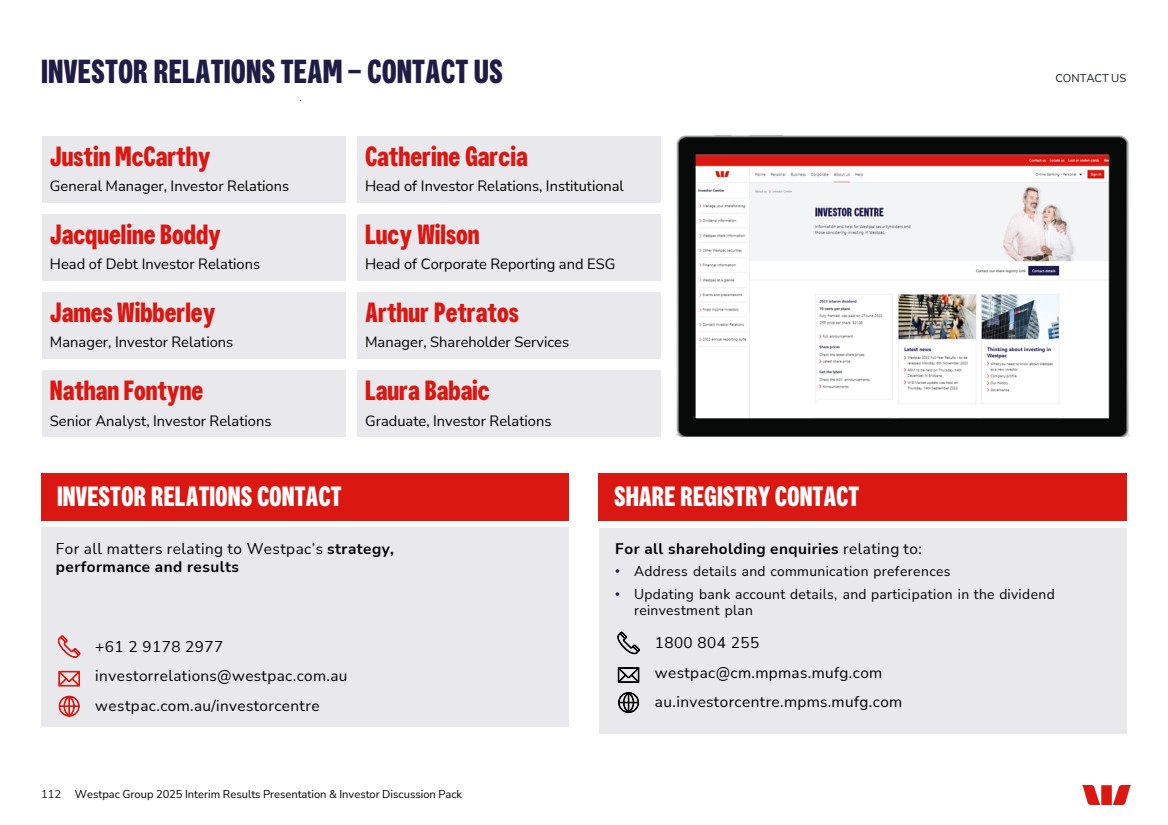
| DISCLAIMER The material contained in this presentation is intended to be general background information on Westpac Banking Corporation (Westpac) and its activities. The information is supplied in summary form and is therefore not necessarily complete. It is not intended that it be relied upon as advice to investors or potential investors, who should consider seeking independent professional advice depending upon their specific investment objectives, financial situation or particular needs. The material contained in this presentation may include information derived from publicly available sources that have not been independently verified. No representation or warranty is made as to the accuracy, completeness or reliability of the information. All amounts are in Australian dollars unless otherwise indicated. This presentation contains statements that constitute “forward-looking statements” within the meaning of Section 21E of the US Securities Exchange Act of 1934. Forward-looking statements are statements that are not historical facts. Forward-looking statements appear in a number of places in this presentation and include statements regarding our current intent, belief or expectations with respect to our business and operations, macro and micro economic and market conditions, results of operations and financial condition, capital adequacy, liquidity and risk management, including, without limitation, future loan loss provisions and financial support to certain borrowers, forecasted economic indicators and performance metric outcomes, indicative drivers, climate- and other sustainability-related statements, commitments, targets, projections and metrics, and other estimated and proxy data. We use words such as ‘will’, ‘may’, ‘expect’, ‘intend’, ‘seek’, ‘would’, ‘should’, ‘could’, ‘continue’, ‘plan’, ‘estimate’, ‘anticipate’, ‘believe’, ‘probability’, ‘indicative’, ‘risk’, ‘aim’, ‘outlook’, ‘forecast’, ‘f’cast’, ‘f’, ‘assumption’, ‘projection’, ‘target’, ‘goal’, ‘guidance’, ‘ambition’, ‘objective’ or other similar words to identify forward-looking statements, or otherwise identify forward-looking statements. These forward-looking statements reflect our current views on future events and are subject to change, certain known and unknown risks, uncertainties and assumptions and other factors which are, in many instances, beyond our control (and the control of our officers, employees, agents and advisors), and have been made based on management’s and/or the board’s current expectations or beliefs concerning future developments and their potential effect upon us. Forward-looking statements may also be made, verbally or in writing, by members of Westpac’s management or Board in connection with this presentation. Such statements are subject to the same limitations, uncertainties, assumptions and disclaimers set out in this presentation. There can be no assurance that future developments or performance will align with our expectations or that the effect of future developments on us will be those anticipated. Actual results could differ materially from those we expect or which are expressed or implied in forward-looking statements, depending on various factors including, but not limited to, those described in the sections titled ‘Our Operating Environment’ and ‘Risk Management' in our 2024 Annual Report as well as the section titled 'Risk Factors' in our 2025 Interim Financial Results Announcement available at www.westpac.com.au. When relying on forward-looking statements to make decisions with respect to us, investors and others should carefully consider such factors and other uncertainties and events. Except as required by law, we assume no obligation to revise or update any forward-looking statements contained in this presentation, whether from new information, future events, conditions or otherwise, after the date of this presentation. We also make statements about our processes and policies (including what they are designed to do) as well as the availability of our systems or product features. Systems, processes and product features can be subject to disruption, and may not always work as intended, so these statements are limited by the factors described in the section titled ‘Risk Management’ in our 2024 Annual Report as well as the section titled 'Risk Factors' in our 2025 interim Financial Results Announcement. Further important information regarding climate change and sustainability-related statements This presentation contains forward-looking statements and other representations relating to environment, social and governance (ESG) topics, including but not limited to climate change, net-zero, climate resilience, natural capital, emissions intensity, human rights and other sustainability related statements, commitments, targets, projections, scenarios, risk and opportunity assessments, pathways, forecasts, estimated projections and other proxy data. These are subject to known and unknown risks, and there are significant uncertainties, limitations, risks and assumptions in the metrics and modelling on which these statements rely. In particular, the metrics, methodologies and data relating to climate and sustainability are rapidly evolving and maturing, including variations in approaches and common standards in estimating and calculating emissions, and uncertainty around future climate and sustainability related policy and legislation. There are inherent limits in the current scientific understanding of climate change and its impacts. Some material contained in this presentation may include information including, without limitation, methodologies, modelling, scenarios, reports, benchmarks, tools and data, derived from publicly available or government or industry sources that have not been independently verified. No representation or warranty is made as to the accuracy, completeness or reliability of such information. There is a risk that the estimates, judgements, assumptions, views, models, scenarios or projections used by Westpac may turn out to be incorrect. These risks may cause actual outcomes, including the ability to meet commitments and targets, to differ materially from those expressed or implied in this presentation. The climate and sustainability related forward-looking statements made in this presentation are not guarantees or predictions of future performance and Westpac gives no representation, warranty or assurance (including as to the quality, accuracy or completeness of these statements), nor guarantee that the occurrence of the events expressed or implied in any forward-looking statement will occur. There are usually differences between forecast and actual results because events and actual circumstances frequently do not occur as forecast and these differences may be material. Westpac will continue to review and develop its approach to ESG as this subject area matures DISCLAIMER 113 Westpac Group 2025 Interim Results Presentation & Investor Discussion Pack |